
Gold: $1,262.10 down $1.10 (comex closing time)
Silver 15.38 down 24 cents
In the access market 5:15 pm
Gold $1261.50
silver: 15.35
At the gold comex today, we had a poor delivery day, registering 1 notice for 100 ounces and for silver we had 7 notices for 35,000 oz for the active March delivery month.
Several months ago the comex had 303 tonnes of total gold. Today, the total inventory rests at 212.03 tonnes for a loss of 91 tonnes over that period.
In silver, the open interest fell by 1287 contracts down to 168,368. In ounces, the OI is still represented by .840 billion oz or 120% of annual global silver production (ex Russia ex China). Generally as we go into an active delivery month the liquidation is much bigger.
In silver we had 7 notices served upon for 35,000 oz.
In gold, the total comex gold OI rose by a huge 6507 contracts to 498,172 contracts despite the fact that the price of gold was down $6.70 with yesterday’s trading.(at comex closing)
We had no changes in gold inventory at the GLD, / thus the inventory rests tonight at 793.12 tonnes. The appetite for gold coming from China is depleting not only gold from the LBMA and GLD but also the comex is bleeding gold. Our 670 tonnes of rock bottom inventory in GLD gold has been broken. It looks to me that China has taken the last amounts of physical gold from the GLD. I guess the only place left for China to receive physical gold, after they deplete the GLD will be the FRBNY and the comex. In silver,/we again had a major change in inventory/this time another huge deposit of 2.856 million oz and thus the Inventory rests at 322.632 million oz
.
First, here is an outline of what will be discussed tonight:
1. Today, we had the open interest in silver fell by 1287 contracts down to 168,368 as the price of silver was down 6 cents with yesterday’s trading. The total OI for gold rose by 6,507 contracts to 491,665 contracts even though gold was down $6.70 in price from yesterday’s level.
(report Harvey)
2 a) Gold trading overnight, Goldcore
(Mark OByrne)
off today
3. ASIAN AFFAIRS
i)Late MONDAY night/ TUESDAY morning: Shanghai closed UP BY 4.04 POINTS OR 0.14% ON A LAST 2 HR RESCUE, / Hang Sang closed DOWN by 148.14 points or 0.73% . The Nikkei closed DOWN 138.14 or 0.73%. Australia’s all ordinaires was DOWN 0.68%. Chinese yuan (ONSHORE) closed DOWN at 6.5050. Oil GAINED to 38.39 dollars per barrel for WTI and 41.22 for Brent. Stocks in Europe so far IN THE RED . Offshore yuan trades 6.5090 yuan to the dollar vs 6.5050 for onshore yuan/ LAST WEDNESDAY, MOODYS DOWNGRADES CHINA’S CREDIT FROM STABLE TO NEGATIVE. At the big people’s congress where they meet to set a 5 year plan, the leaders failed to deliver a major fiscal stimulus package. However instead they made very promises.
iia) Summary from Japan: poor GDP numbers/Abenomics failing badly
iib)The 30 yr auction for Japanese bonds just ended and the yield is a paltry 47 basis points, a fall of 21 basis points from yesterday. The entire Japanese yield curve is negative out to 13 years. Also what is interesting is that the uSA 2 yr bond yield is higher than the 30 yr Japanese rate. This will no doubt force Japanese banks to shun Japanese bonds in favour of the USA bonds.
( zero hedge)
iii) Summary from China;
Now our report from China: Extremely poor and unexpected trade balance report. Both exports and imports plunge!!
( zero hedge)
iv)Early this morning, Goldman Sachs put a damper on commodities when he states that the rally is not sustainable…especially oil and iron ore!
( Goldman Sachs/zero hedge)
v)Epoch times interviews Willem Middelkoop. They discuss China’s gold strategy:
( Epoch times/Willem Middlekoop/GATA)
vi) Lawrie Williams gives the real reason for the fiasco over at Blackrock’s IAU. His take:
they are having trouble assembling the necessary physical against the gold shares.
(Williams/Sharp’s Pixley)
6.USA STORIES WHICH MAY INFLUENCE THE PRICE OF GOLD/SILVER
i)We brought this to your attention on Friday. The repo bond market is basically a tool to borrow treasuries especially the 10 yr note. The amount of borrowings has been so great that the negative 2.75% yield means that the borrower is paid to borrow. It also means that there is a scarcity of bonds as everybody has shorted the treasuries and loaded the boat on the short side. This has caused many failures to deliver and for investors it is better to pay the penalty than to deliver the paper!
( zero hedge)
ii)David Stockman tackles the earnings of our S and P. He is warning everyone that an ambush on NY will cause considerable damage shortly and he explains why:
( David Stockman/ContraCorner)
iii) Small business confidence crashes!!
Let us head over to the comex:
The total gold comex open interest rose to a high of 498,172 for a rather large gain of 6507 contracts despite the fact that the price of gold was down $6.70 in price with respect to Friday’s trading. We must be close to a multi year high in gold OI. For the past two years, we have strangely witnessed two interesting developments with respect to the gold open interest: 1) total gold comex collapse in OI as we enter an active delivery month or for that matter an inactive month, and 2) a continual drop in the amount of gold standing in an active month. Today, only the first scenario was in order as we actually gained in number of ounces standing for March. The front March contract month saw its OI fall by 44 contracts down to 83.We had 54 notices filed upon yesterday, and as such we gained 10 contracts or an additional 1000 oz will stand for delivery. After March, the active delivery month of April saw it’s OI fall by 12,571 contracts down to 301,376. Almost all of these guys rolled into June.The estimated volume today (which is just comex sales during regular business hours of 8:20 until 1:30 pm est) was 207,778 which is good. The confirmed volume yesterday (which includes the volume during regular business hours + access market sales the previous day was very good at 259,386 contracts. The comex is not in backwardation .
March contract month:
INITIAL standings for MARCH
March 8/2016
| Gold |
Ounces
|
| Withdrawals from Dealers Inventory in oz | nil |
| Withdrawals from Customer Inventory in oz nil | 192.900 oz(Scotia)
6 kilobars |
| Deposits to the Dealer Inventory in oz | NIL oz |
| Deposits to the Customer Inventory, in oz | nil |
| No of oz served (contracts) today | 1 contract (100 oz) |
| No of oz to be served (notices) | 82 contracts(8200 oz) |
| Total monthly oz gold served (contracts) so far this month | 576 contracts (57,600 oz) |
| Total accumulative withdrawals of gold from the Dealers inventory this month | nil |
| Total accumulative withdrawal of gold from the Customer inventory this month | 103,882.4 oz |
we had 0 adjustment
.
MARCH INITIAL standings/
March 8/2016:
| Silver |
Ounces
|
| Withdrawals from Dealers Inventory | nil |
| Withdrawals from Customer Inventory | 46,096.370 oz (HSBC.CNT) |
| Deposits to the Dealer Inventory | 1,211,554.800 oz
BRINKS |
| Deposits to the Customer Inventory | 1,529,117.898 oz (SCOTIA) |
| No of oz served today (contracts) | 7 contracts 35,000 oz |
| No of oz to be served (notices) | 1883 contract (9,065,000 oz) |
| Total monthly oz silver served (contracts) | 332 contracts (1,660,000 oz) |
| Total accumulative withdrawal of silver from the Dealers inventory this month | nil oz |
| Total accumulative withdrawal of silver from the Customer inventory this month | 7,892,035.3 oz |
Today, we had 1 deposits into the dealer account:
i) Into Brinks: 1,211,554.800 oz
total dealer deposit; 1,211,554.800 oz
we had 0 dealer withdrawals:
total dealer withdrawals: nil
we had 0 customer deposits
:
total customer deposits: nil oz
total withdrawals from customer account 46,096.37 oz
we had 1 adjustment
i) Out of Delaware:
19,519.900 oz was adjusted out of the customer account and this landed into the dealer account of Delaware
And now the Gold inventory at the GLD:
March 8/no changes in inventory at the GLD/Inventory rests at 793.12 tonnes
MARCH 7/a tiny loss of .21 tonnes of gold probably to pay for fees/inventory 793.12 tonnes
MARCH 4/another mammoth sized deposit of 7.13 tonnes of gold into GLD/Inventory rests at 793.33 tonnes. This is no doubt a “a paper addition” and not physical
MAR 3/another good sized deposit of 2.37 tonnes of gold into the GLD/Inventory rests at 788.57 tonnes
MAR 2/another mammoth paper gold addition of 8.93 tonnes of gold into the GLD/Inventory rests at 786.20 tonnes.
March 1/a mammoth 14.87 tonnes of gold deposit into the GLD/inventory rests at 770.27 tonnes
FEB 29/another deposit of 2.08 tonnes of gold into the GLD/Inventory rests at 762.40 tonnes
Feb 26./no change in gold inventory at the GLD/Inventory rests at 760.32 tonnes
Feb 25./we had a huge deposit of 7.33 tonnes of gold into the GLD/Inventory rests at 760.32 tonnes. No doubt that this is a paper gold deposit/not real as the price of gold hardly moved on that huge amount of deposit.
FEB 24/no change in gold inventory at the GLD/Inventory rests at 752.29 tonnes
FEB 23./another huge addition of 19.3 tonnes of gold into its inventory/Inventory rests at 752.29 tonnes. Again how could they accumulate this quantity of gold with backwardation in London/this vehicle is nothing but a fraud
Feb 22/A huge addition of 19.33 tonnes of gold to its inventory/Inventory rests at 732.96 tonnes/ How could this happen: a huge addition of gold coupled with a huge downfall of 20 dollars in gold.
xxxxxxxxxxxxxxxxxxxxxxxxxxxxxxxxxxxxxxxxxxxxxxxxxxxxxxxxx
March 8.2016: inventory rests at 793.12 tonnes
end
end
And now your overnight trading in gold, TUESDAY MORNING and also physical stories that may interest you:
South Africa gold firms get lift from weak rand, but risks lurk
By Ed Stoddard
Reuters
Monday, March 7, 2016
JOHANNESBURG, South Africa — A sinking rand has sparked a buying spree and rerating of South African gold mining shares which have doubled in value in 2016, but the volatile currency is a double-edged sword that could cut the gains back down to size.
The crumbling currency is the main driver behind the rally. It has shed 15 percent against the dollar since October and its decline has coincided with a spike in spot gold, pushing the rand/bullion price to record highs of almost 20,000 rand an ounce.
The result: South African gold producers which were struggling are now suddenly flush with cash. …
But what the rand gives, it can take away. The sudden change in fortune highlights just how marginal South African gold operations are and how exposed they are to fluctuations in the rand and gold price.
“These mines are so marginal and geared. If the price goes in your favor, it is a multiple increase. Harmony was losing money and now it is just a cash machine,” said Peter Major, fund manager at Cadiz Cadiz Corporate Solutions. …
… For the remainder of the report:
Embry: Many expect another smash but gold still may be cheaper than ever
7:53p ET Monday, March 7, 2016
Dear Friend of GATA and Gold:
Sprott Asset Management’s John Embry, interviewed today by King World News, notes that many gold market analysts, surveying the burgeoning short positions of the bullion banks, are predicting an imminent smashing for the gold price. But, Embry adds, “What observers may be missing is that gold, in relation to the money supply and debt in the world, might be cheaper than at any time in history. The vicious takedown of gold over the past 4 1/2 years, from more than $1,900 to under $1,100 at the bottom, occurred as global quantitative easing was in full bloom and global debt was exploding to well over $200 trillion. Smart money is aware of this, and I believe they are accumulating as much physical gold as possible while it is still available.”
Embry’s interview is excerpted at KWN’s Internet site here:
http://kingworldnews.com/50-year-veteran-on-warren-buffetts-bs-and-the-b…
CHRIS POWELL, Secretary/Treasurer
Gold Anti-Trust Action Committee Inc.
CPowell@GATA.org
end
A super commentary from Hugo as to why the USA and for that matter, the entire globe must return to the gold standard
(courtesy Hugo Salinas Price/GATA)
Hugo Salinas Price: Remember ‘the Greening of America’? It destroyed industry
8:31p ET Monday, March 7, 2016
Dear Friend of GATA and Gold:
Hugo Salinas Price, president of the Mexican Civic Association for Silver, explains tonight how the privilege of issuing the world reserve currency has destroyed industry in the United States. Only a return to gold as money, Salinas Price writes, will restore the country’s industry and productivity skills. His commentary is headlined “Remember ‘the Greening of America’? and it’s posted at the association’s Internet site, Plata.com.mx, here:
http://plata.com.mx/Mplata/articulos/articlesFilt.asp?fiidarticulo=283
CHRIS POWELL, Secretary/Treasurer
Gold Anti-Trust Action Committee Inc.
CPowell@GATA.org
end
Early this morning, Goldman Sachs put a damper on commodities when he states that the rally is not sustainable…especially oil and iron ore!
(courtesy Goldman Sachs/zero hedge)
“The Commodity Rally Is Not Sustainable” – Goldman Is Now Waiting For The Next Big Drop
As noted yesterday morning, “Goldman does it again” when just hours after Goldman said the “bearish cash for iron ore was intact,” the commodity recorded its biggest surge in history crushing anyone short, and soaring 20% across the globe. That however has not dented Goldman’s conviction that the commodity rally is overdone (we actually agree with Goldman for once) and just hours ago the head of commodities at Goldman Jeffrey Currie doubled down on Goldman’s bearish commodities call saying “market views on reflation, realignment and re-levering have driven a premature surge in commodity prices that we believe is not sustainable.
Indeed the fundamentals – especially in oil – remain dire, with land storage especially in PADD2/Cushing about to overflow as we have been showing for the past 2 months, and yet the sentiment has shifted the most in years. As Currie puts it: “Energy needs lower prices to maintain financial stress to finish the rebalancing process; otherwise, an oil price rally will prove self-defeating as it did last spring.”
It is this premature excitement that according to Goldman, will be catalyst that leads to the next leg lower in commodities, as the price surge gone far too soon and long before the much needed rebalancing and excess production was taken out:
Last year commodity prices were driven lower by deflation, divergence and deleveraging which were reinforcing through a negative feedback loop. Deflationary pressures from excess commodity supply reinforced divergence in US growth and a stronger US dollar which in turn exacerbated EM funding costs and the need for EMs to de-lever though lower investment and hence commodity demand. While we believe that these dynamics likely ran their course last year resulting in signs of rebalancing, the force of their reversal has created a new trend in market positioning that could run further. However, the longer they run, the more destabilizing they become to the nascent rebalancing they are trying to price.
In other words, the short squeeze will lead to higher prices, which leads to more production, leading to another surge in excess supply, which leads to another showdown between fundamentals and technicals/positioning until fundamentals win, violently at that, which then sends commodity prices to their next support level lower.
As noted above, for once we agree with Currie.
Here are the key excerpts from his note “The Three R’s (Reflation, Realignment and Re-leveraging) are not sustainable”
The reversal started last month with ‘green shoots’ of rebalancing. Deflation turned into reflation with evidence of long-awaited oil supply curtailments in both the US and other non-OPEC producers which supported energy prices. Divergence lost out to realignment with increased fears about US economic growth. This together with strength of EU manufacturing data over the same period and a pickup in China credit data in January led the market to question the idea that the US is fundamentally outperforming its peers. These worries are reflected in the recent weakness of the US dollar and strength in the gold price. And recent policy announcements in China combined with the pickup in Chinese credit raised the prospects of leverage-driven investment demand as a focus on de-leveraging faded.
While these dynamics could run further, they simply are not sustainable in the current environment, in our view. Energy needs lower prices to maintain financial stress to finish the rebalancing process; otherwise, an oil price rally will prove self-defeating as it did last spring. The most recent macro data coming out of the US reinforces US growth divergence. Increases in core CPI, strong employment growth and a rebound in manufacturing, pushed the US MAP score – a metric for how much macro data surprises – up significantly to nearly positive for the first time in 2016. Most importantly, our US economics team continues to expect solid consumer spending growth of 2.5% to 3.0% in 2016. Finally, credit growth in China remains too high relative to GDP growth underscoring the need for de-leveraging.
While we still believe oil will likely rebalance this year and create a deficit market by year end, ‘green shoots’ of a deficit alone are not sufficient for a new sustainable bull market. Only a real physical deficit can create a sustainable rally which is still months away should the behavioral shifts created by the low prices in January and February remain in place. Commodity markets are physical spot markets, not anticipatory financial markets that are driven by expectations. This is why an early rally in oil prices would prove self-defeating before a real deficit materializes as it would reverse the supply curtailments that are expected to rebalance the market in 2H16.
The ‘green shoots’ for oil include US E&P’s guiding production lower (c.600 kb/d), supply disruptions in Iraq and Nigeria (c.750 kb/d), non-OPEC ex-US producers reporting significant potential reductions (c.400 kb/d) and strong US oil demand. While the Iraqi and Nigerian disruptions will likely prove temporary, they do help in the rebalancing process and have likely helped to tighten Brent timespreads. However, the other green shoots are both price sensitive and are still more relevant for expectations of rebalancing, than the rebalancing seen to date. The current oil market is still in a large surplus as witnessed by last week’s large US inventory build and the large global stock overhang. To keep the financial pressure on producers, we maintain our near-term view of a trendless oil market with substantial volatility between $40/bbl (under which creates financial stress) and $20/bbl (under which creates operational stress).
* * *
Iron ore rallied the most in the past week, breaching $60/t today. We believe this rally too will likely prove temporary and are maintaining our end-of-year target of $35/t . The rally in iron ore prices was the result of a surge in steel prices needed to widen mill margins in order to incentivize operators to pay the restart costs and rebuild operating inventories of raw materials as China enters this year’s peak construction season. However, the physical shortfall in steel supply can be filled easily and the subsequent deterioration in steel margins is likely to put iron ore prices under renewed pressure. In other words, the market fundamentals are unchanged and the current rally is only a brief lull before production cuts at high-cost mines are required to make room for low-cost producers.
Goldman’s conclusion: “While deflation, divergence and de-leveraging are all likely to reassert themselves and reapply modest downward pressure on commodity prices in the near-term, we do believe that the negative feedback loop that they create has mostly played out in this cycle from a bearish price trend perspective, particularly in oil which is why we maintain a bullish end-of-year view in energy. However, it is important to remember that in the end this was a supply-driven bear market and will not trade like a demand-driven market. In a demand-driven market, once demand gets ahead of supply following an economic recovery, supply struggles to catch up as it was also likely slowed by the lower prices. In the current supply-driven market, demand hasn’t really changed, it takes lower prices to push and keep supply below demand to create a deficit. As a result, higher prices are much harder to sustain in a supply-driven market since supply is primed to return with higher prices. But this lesson will likely only be learned through false starts.”
Where we disagree with Goldman is that demand hasn’t changed: it most certainly has, and as we have shown repeatedly in recent months, demand across various commodity sectors, especially in distillates as a result of collapsing global trade (just see China’s overnight trade numbers)…

… is also in freefall.
All that said, a warning: Goldman’s recent forecasts have been absolutely abysmal. If this the past few months are any indication, oil may well continue squeezing higher until it goes back into the triple digits… before it crashes back into the single digits.
Lawrie Williams gives the real reason for the fiasco over at Blackrock’s IAU. His take:
they are having trouble assembling the necessary physical against the gold shares.
(Williams/Sharp’s Pixley)
Gold now in bull market: Paper gold breaking down at last?
By Clint Siegner – Money Metals Exchange
Gold officially entered a bull market in last week’s trading with prices gaining more than 20% from their December lows. The silver price also put on some very nice gains, but the price needs to reach about $16.40 before watchers can make the same claim.
If the white metal can exceed last week’s gains of more than 5%, the silver market will reach official bull territory too.
Metals investors will be following the speculation surrounding the upcoming Federal Open Market Committee (FOMC) meeting on March 16th. Recent rallies in stocks, commodities, and oil are raising the odds that officials just might hike rates once again. Their problem is that the rally we’re seeing is largely based upon speculation they would not further tighten.
The FOMC hiked rates in December. The ensuing carnage in the markets during the second half of December and January led to a consensus that officials would abandon attempts at further increases. Some even speculated that officials would completely reverse course and may even implement negative rates. At which point the rally began.
Markets are behaving like the stimulus addicts they have become. The Fed is caught in a trap of its own making. Officials may want to raise rates, but recent experience has shown they won’t be able to pull that off without immediate and profound consequences.
CRACKS WIDEN IN PAPER GOLD MARKET
Gold investors witnessed a “first” in the markets last week. Constraints emerged in the previously limitless supply of paper gold. Blackrock announced that it was suspending issuance of new shares in the iShare’s Gold Trust (IAU).
The Blackrock press release describes the suspension as temporary. The fund has to make a filing with the SEC before they can resume issuing new shares. Demand for gold since the start of the year apparently caught them flat footed. From the Blackrock press release:
Since the start of 2016, in response to global macroeconomic conditions, demand for gold and for IAU has surged among global investors. IAU has $8 billion in assets under management, and has expanded $1.4 billion year to date. February marked its largest creation activity in the last decade.
The growth in investment demand for gold is extraordinary, but that may not be the only story.
Steve St. Angelo of the SRSrocco Report wonders if Blackrock is telling the whole truth. He asks an important question; why did Blackrock wait until their ability to issue new shares was completely exhausted? If it is just a matter of a routine filing, the halt in sales could have easily been avoided.
One possible answer is the halt has more to do with the increasing shortage of gold registered as available for delivery. Blackrock can make the filing easily enough, but perhaps getting the actual gold bars to back new shares is more of a challenge. In other words, the halt may have more to do with this revelation from ZeroHedge.com:
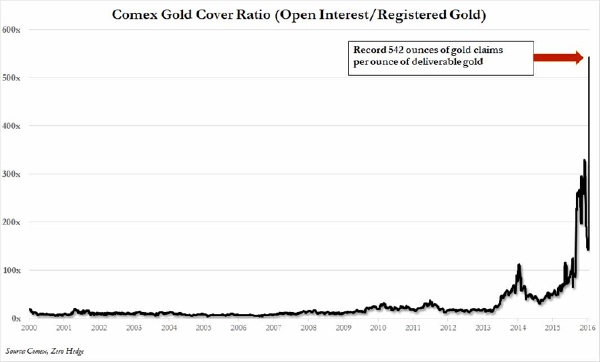
Stocks of “registered” gold bars – those designated as being available for delivery against futures contracts – continue to dwindle.
In the past, inventory of “allocated” gold was reclassified as registered whenever needed, a quick and simple process. But that isn’t happening this time around. In fact, we are seeing the opposite. Registered stocks are being converted to the “allocated” category and taken off the market.
The COMEX gold cover ratio recently hit 542 ounces of paper gold for every ounce of physical metal. Such extreme leverage is so far off into uncharted territory that it cannot be dismissed.
While it is true historically that a sharp decline in registered bars has never resulted in actual delivery problems, even those quickest to discount the developing shortage must be wondering why the cover ratio is now more than five times its previous all-time high.
The most recent COMEX report shows a little over 11 metric tonnes of registered gold on hand. Consider that the IAU added roughly 19 tonnes in both January and February. The much larger SPDR Gold Trust (GLD) added more than 75 tonnes per month in the first two months of the year.
Meanwhile, according to TFMetalsReport.com, gold demand from both Russia and China continues at about 20 tonnes per month and India imports up to 100 tonnes/month.
Of course, not all of this gold is coming from exchange stockpiles. Mine production covers the bulk of demand. However, the World Gold Council reports gold demand outstripped gold supply by more than 80 tonnes in the fourth quarter of 2015. Those tonnes were, in large part, sourced from the COMEX and other exchange vaults.
The supply deficit in the first quarter of 2016 promises to be far worse. It is time for investors in paper gold – ETFs and futures contracts – to seriously question from whence all of the gold supposedly backing their paper is coming.
end
SGE Confirms To Continue Publish Withdraw Data!
I’ve received written confirmation by the Shanghai Gold Exchange (SGE) delivery department that the Chinese Market Data Monthly Reports disclose the volume of physical gold withdrawn from SGE designated vaults. I’m thrilled to resume reporting these numbers and everything related to the Chinese gold market!
It’s advised to have read The Chinese Gold Market Essentials Guide before you continue.
Because of the structure of the Chinese gold market the volume of physical gold withdrawn from the vaults of the SGE provides us a unique measure of Chinese wholesale gold demand – which in recent years has been more than twice as much as Chinese consumer gold demand reported by the World Gold Council. However, it appeared the SGE ceased publishing SGE withdraw numbers after a press release from 11 January 2016 that stated the bourse “adjusted some terms in the Delivery Reports”. After the announcement SGE withdrawals were not disclosed in the Chinese Market Data Weekly Reports and over the phone I was informed withdraw numbers would not be disclosed any longer by the SGE.
Perhaps I spoke to the wrong people at the SGE or perhaps the SGE has changed its mind. In any case, in the first Chinese Market Data Monthly Report of this year (January) the format was different from the Chinese Market Data Weekly Reports. In the Chinese monthly report it showed a number that looked to be the volume of gold withdrawn from the vaults. Though we couldn’t be too sure as the SGE changed its nomenclature since the press release from 11 January.
Once again I contacted the SGE and finally came in touch with an employee at the delivery department. The person in question told me over the phone that indeed the January monthly report disclosed withdraw data, but because confirmations over the phone can be easily violated, I also asked for written confirmation. Then, a few days later the SGE delivery department confirmed over email that the Market Data Monthly Reports include the volume of gold withdrawn from SGE designated vaults!
So, here we go again. The SGE monthly report from February shows withdrawals from the vaults of the SGE accounted for a modest 107.6 tonnes, down 52 % from January and down 31 % from February 2015…
https://www.bullionstar.com/blogs/koos-jansen/sge- confirms-to-continue-publish-withdraw-data/
-END-
Epoch times interviews Willem Middelkoop. They discuss China’s gold strategy:
(courtesy Epoch times/Willem Middlekoop/GATA)
Epoch Times interviews Willem Middelkoop on China’s gold strategy
10:47a ET Tuesday, March 8, 2016
Dear Friend of GATA and Gold:
Interviewed this week by Valentin Schmid of the Epoch Times, fund manager and financial writer Willem Middelkoop, author of “The Big Reset,” examines China’s strategy with gold, which seems to entail getting a lot more of it for hedging the country’s foreign exchange reserves in anticipation of a worldwide official upward revaluation of gold that will reliquefy central banks. The interview is headlined “China’s Global Gold Strategy” and it’s posted at the Epoch Times here:
http://www.theepochtimes.com/n3/1978487-chinas-global-gold-strategy/3/
CHRIS POWELL, Secretary/Treasurer
Gold Anti-Trust Action Committee Inc.
CPowell@GATA.org
end
:
1 Chinese yuan vs USA dollar/yuan DOWN to 6.5050 / Shanghai bourse IN THE GREEN : / HANG SANG CLOSED DOWN 148.14 POINTS OR 0.73%
2 Nikkei closed DOWN 178.17 OR 0.76%
3. Europe stocks ALL IN THE RED /USA dollar index DOWN to 97.07/Euro UP to 1.1026
3b Japan 10 year bond yield: FALLS TO -.099% AND YES YOU READ THAT RIGHT !!!!(Japan buying 100% of bond issuance)/Japanese yen vs usa cross now at 113.02
3c Nikkei now well below 17,000
3d USA/Yen rate now well below the important 120 barrier this morning
3e WTI:: 38.39 and Brent: 41.22
3f Gold UP /Yen UP
3g Japan is to buy the equivalent of 108 billion uSA dollars worth of bond per month or $1.3 trillion. Japan’s GDP equals 5 trillion usa.
Japan to buy 100% of all new Japanese debt and by 2018 they will have 25% of all Japanese debt. Fifty percent of Japanese budget financed with debt.
3h Oil UP for WTI and UP for Brent this morning
3i European bond buying continues to push yields lower on all fronts in the EMU. German 10 yr bund FALLS to 0.194% German bunds in negative yields from 8 years out
Greece sees its 2 year rate RISE to 9.18%/:
3j Greek 10 year bond yield FALL to : 9.90%
3k Gold at $1273.50/silver $15.61 (7:15 am est)
3l USA vs Russian rouble; (Russian rouble DOWN 42/100 in roubles/dollar) 71.89
3m oil into the 38 dollar handle for WTI and 41 handle for Brent/
3n Higher foreign deposits out of China sees huge risk of outflows and a currency depreciation (already upon us). This can spell financial disaster for the rest of the world/China forced to do QE!! as it lowers its yuan value to the dollar/expect a huge devaluation imminently from POBC.
JAPAN ON JAN 29.2016 INITIATES NIRP
30 SNB (Swiss National Bank) still intervening again in the markets driving down the SF. It is not working: USA/SF this morning .9929 as the Swiss Franc is still rising against most currencies. Euro vs SF is 1.0946 well above the floor set by the Swiss Finance Minister. Thomas Jordan, chief of the Swiss National Bank continues to purchase euros trying to lower value of the Swiss Franc.
3p BRITAIN STARTS ITS CAMPAIGN AS TO WHETHER EXIT THE EU.
3r the 8 year German bund now in negative territory with the 10 year FALLS to + .194%
/German 8 year rate negative%!!!
3s The Greece ELA NOW at 71.4 billion euros,
The bank withdrawals were causing massive hardship to the Greek bank. the Greek referendum voted overwhelming “NO”. Next step for Greece will be the recapitalization of the banks and that will be difficult.
4. USA 10 year treasury bond at 1.85% early this morning. Thirty year rate at 2.64% /POLICY ERROR)
5. Details Ransquawk, Bloomberg, Deutsche bank/Jim Reid.
(courtesy Jim Reid/Bloomberg/Deutsche bank/zero hedge)
Bears Exit Hibernation As Rally Fizzles On Dismal Chinese Trade Data; Commodities Slide; Gold Higher
Those algos who scrambled to paint yesterday’s closing tape with that last second VIX slam sending the S&P back over 2,000, forgot one thing – the same thing that China also ignored –central bankers can not print trade, something we have repeated since 2011. The world got a harsh reminder of this last night when China reported the third largest drop in exports in history, which crashed by over 25%, the third biggest drop on record, and no, it was not just the base effect from last February’s spike, as otherwise the combined January-February data would offset each other, instead it was a joint disaster, meaning one can’t blame the Lunar New Year either. In short, one can’t really blame anything aside from the real culprit: despite all the lipstick that has been put on it, global trade is grinding to a halt.
This, together with fresh record low (and mostly negative) yields along Japan’s JGB curve, brought the risk off sentiment out of hibernation, and have sent the USDJPY sliding in overnight trading, and dragging European stocks and U.S. equity futures down with it.
Furthermore, after Goldman doubled-down on its bearish call on commodities, the sector has taken a deep breather after yesterday’s surge, and while crude oil has dipped by about 1%,iIron-ore futures on the Singapore Exchange fell 8.8% after yesterday’s record 19% jump on Monday. Citigroup Inc. said it’s still bearish as supply and demand fundamentals remain weak, while Axiom Capital Management Inc. said the price surge was probably just a “blip.”
Promptly bearish commentators came out of the woodwork, first in Asia…
“If they can’t get stocks right, how are they going to get the trickier puzzle of SOE reform right?” Michael Every, the head of financial markets research at Rabobank Group in Hong Kong, who correctly predicted the tumble in Chinese equities told Bloomberg. “The government’s attempts have been a total failure, leading to a huge drop in confidence among investors.”
… and then in Europe:
“We are still in the process where we’re trying to find the bottom and I don’t think we are there yet,” said Ralf Zimmermann, a strategist at Bankhaus Lampe in Dusseldorf, Germany. “There had been, with the recent rebound, some optimism that we were out of the woods. The Chinese trade data is a reminder that the path for the business cycle ahead is pretty rocky and bumpy.”
As a result, global equities’ five-day winning streak has, as of this moment, come to a halt. Japanese government bonds surged in a haven-asset rally that also lifted the yen, gold and Treasuries.
In summary, the Stoxx Europe 600 Index extended its decline from a five-week high as investors sold equities that had led the recent rebound, while Brent crude slid after closing on Monday above $40 a barrel for the first time this year. Industrial metals sank and iron ore fell as Goldman Sachs Group Inc. predicted gains in commodities would falter. A jump in Japanese bonds that sent yields to record lows helped boost Treasuries and European debt. The yen strengthened against all of its 31 major peers and gold climbed to a 13-month high.
However one bearish commodity which never went into hibernation and which has been rising even alongside stocks, has been gold, and as the following Bloomberg chart shows, “gold rally belies confidence in stocks” having outperformed global equities.

Perhaps “gold vigilantes” are the new bond vigilantes?
* * *
Where global markets stand now:
- S&P 500 futures down 0.8% to 1985
- Stoxx 600 down 1.4% to 336
- FTSE 100 down 0.8% to 6130
- DAX down 1.4% to 9642
- German 10Yr yield down 6bps to 0.17%
- Italian 10Yr yield down 3bps to 1.43%
- Spanish 10Yr yield down 2bps to 1.57%
- S&P GSCI Index up less than 0.1% to 324.4
- MSCI Asia Pacific down 0.7% to 125
- Nikkei 225 down 0.8% to 16783
- Hang Seng down 0.7% to 20012
- Shanghai Composite up 0.1% to 2901
- S&P/ASX 200 down 0.7% to 5108
- US 10-yr yield down 7bps to 1.84%
- Dollar Index down 0.04% to 97.03
- WTI Crude futures down 0.8% to $37.60
- Brent Futures down 0.6% to $40.60
- Gold spot up 0.7% to $1,276
- Silver spot up 0.1% to $15.66
Top Globa News
- Michael Bloomberg Says He Won’t Run for President in 2016: Decided against running out of concern that his entry could benefit Republican front-runner Donald Trump
- Wells Fargo Said to Join Swaps Revival as Funds Clamor to Hedge: Bank plans to trade derivatives known as single-name credit default swaps with clients as soon as next quarter.
- Vale, Fortescue Game-Changing Deal to Shake Up Big Iron Ore: Pact includes plans to develop joint ventures to create about ~80mt-100mt per year of blended product.
- Pimco Says Time to Buy Riskier Debt as U.S. to Avoid Recession: Pimco says high-quality company debt, junk bonds, bank loans offer a better risk-adjusted alternative.
- Goldman Says Commodity Rally a False Start, Will Fizzle: rally in commodities from iron ore to gold will falter; forecasts copper, aluminum prices will slide as much as 20% over next year.
- Nike Suspends Ties With Sharapova After She Fails Drug Test: Co. suspended ties with after she failed a drug test at the Australian Open.
Looking at regional equity markets, we start in Asia where stocks traded negative with sentiment dampened following a contraction in Japanese GDP figures (Japanese GDP SA (Q4 F) Q/Q -0.30% vs. Exp. -0.40% vs Prey. -0.40%) and weak Chinese Trade data. Nikkei 225 (-0.76%) was pressured following soft Japanese GDP which showed the economy contracted by an annualised 1.1 %, while JPY strength also added to the downbeat tone.ASX 200 (-0.53%) failed to sustain the commodity-led gains amid profit-taking in the sector and weakness in financials. The Shanghai Comp (+0.1%) initially traded lower after weak Chinese trade data in which exports declined wider than expected, while some analysts also noted disappointment regarding a lack of significant measures announced at the NPC so far. However, losses were pared heading into the European open. 10yr JGBs rose as the risk-averse tone underpinned demand while today also saw a strong 30yr JGB auction where the b/c printed at its highest since May 2014 as participants hunt for positive yields. Recapping China’s trade data, the February Trade Balance came in at CNY M/M 209.50B vs. Exp. 341.00B (Prey. 406.20B)
- Exports (CNY) (Feb) Y/Y -20.60% vs. Exp. -11.30% (Prey. -6.60%)
- Imports (CNY) (Feb) Y/Y -8.00% vs. Exp. -11.70% (Prey. -14.40%)
In Europe, sentiment this morning has been guided lower by downbeat data from overnight, with Japanese GDP and Chinese trade balance readings failing to inspire confidence in financial markets . As such, European equities trade firmly in negative territory (Euro Stoxx: -1.3%), with the materials sector the most significantly impacted by China concerns. As such, the usual culprits of Anglo American, BHP Billiton, Glencore are among the worst performers, while Burberry are among the best performers after the FT reported that the Co. are looking for help to defend against a potential takeover. In line with the softness seen in equities, Bunds have seen strength so far today, with the June’16 contract strengthening by over 50 ticks to rise back above 163.00. Analysts at IFR suggest model driven accounts are lifting both Bunds and Gilts, while Japanese buying of core/mid-tier markets is evident in 10Y OATs.
Top European News
- Burberry Surges on Speculation Trenchcoat Maker May Attract Bid: Co. asked advisers at Robey Warshaw to help prepare for bid after mystery investor built up ~5% stake: FT.
- German Industrial Production Surges by Most Since 2009: Production, adjusted for seasonal swings, climbed 3.3% m/m.
- RWE Posts Loss at U.K. Business After Customer Defections: U.K. unit is to cut 2,400 jobs as it reported FY loss after billing system failures, departure of >350,000 utility customers.
- Apple’s Clash With FBI Risks Piercing Trust in EU Privacy Shield: EU privacy regulators promised to give their verdict next month on so-called privacy shield deal.
- EU Nears Migrant Cap Deal as Turkey Raises Its Asking Price: Turkish PM called on EU to double its financial aid to Turkey to EU6b.
In FX, after some volatile moves in NY and Tokyo, the early European session has been much more contained in FX, though notable is the heavy tone in spot and cross JPY, while the AUD now looks to be on the back foot after some decent data led strength of late. USD/JPY lows have so far reached just shy of 112.70, but so far, all recovery attempts have come up against decent offers through 113.00. AUD/USD stopped shy of .7500 yesterday, and now looks under threat of testing the lows from yesterday to dent a potential move to recent .7700+ projections. The USD index is pretty stable as a result, with EUR looking buoyant against the greenback, with further potential seen on the upside despite anticipated policy action from the ECB; the crosses also recovering off recent lows. GBP is looking heavy also, with the upper 1.4200’s well offered in Cable. WTI/Oil gains capped, turning USD/CAD back onto the 1.3300’s.
China’s yuan climbed 0.17 percent as the central bank raised its daily reference rate for the currency following Monday data that showed a slide in the nation’s foreign-exchange reserves moderated in February. The currencies of raw-material producing nations slumped, led by South Africa’s rand dropping more than 1 percent. New Zealand’s dollar fell 0.7 percent, while Australia’s slid 0.5 percent.
The yen gained for a second day. Bank of Japan Governor Haruhiko Kuroda told parliament on Monday he doesn’t think additional stimulus is needed at the present time. “The yen is gaining partly because Kuroda is denying imminent further easing,” said Shinichiro Kadota, a foreign-exchange strategist at Barclays Plc in Tokyo. “That’s effectively telling speculative players to go ahead and buy the yen.”
In commodities, oil prices pulled back from yesterday’s best levels with WTI back below USD 38/bbl level amid weak Chinese trade data. Gold retreated from near 13-month highs to trade flat and copper prices were also pressured from weak China data, while Dalian iron ore futures continued its upward trend to hit limit up at the open following yesterday’s largest gain in spot iron ore prices on record.
In commodities, Iron-ore futures on the Singapore Exchange fell 8.8 percent, after a record 19 percent jump on Monday. Citigroup Inc. said it’s still bearish as supply and demand fundamentals remain weak, while Axiom Capital Management Inc. said the price surge was probably just a “blip.” Copper fell 1 percent in London, trimming this month’s advance to 5.4 percent. Nickel slid 2.8 percent, retreating from its highest close since November. Goldman Sachs reiterated its view that the drivers for last year’s slump in industrial metals prices remain intact, predicting drops of as much as 20 percent for copper and aluminum over the next 12 months.
Gold last week entered a bull market — commonly defined as a 20 percent advance from the most recent low — and platinum and palladium followed suit on Monday. Platinum rose 0.2 percent on Tuesday, while palladium dropped 1.8 percent. Brent crude slipped 0.5 percent in London to 40.65 a barrel, after surging 5.5 percent on Monday. It has advanced more than 40 percent since slumping to a 12-year low in January amid speculation a proposal by major producers to freeze production will trim a global glut. Data on Wednesday is forecast to show U.S. stockpiles increased last week to the highest level since 1930.
On today’s thin US calendar we have last month’s NFIB small business optimism survey reading as only release of note, which moments ago printed at 92.9, below January’s 93.9 and below the expected rebound to 94.0.
Bulletin Headline Summary from RanSquawk and Bloomberg
- European bourses take the lead from their Asian counterparts as soft Japanese GDP and Chinese trade data dictates the state of play
- In FX, JPY has been a beneficiary of the risk-averse tone with USD/JPY breaking back below 113.00 while commodity currencies face selling pressure
- Looking ahead, highlights include US API data, BoE’s Weale and US 3yr Note Auction
- Treasuries higher in overnight trading, global equities sell off after China’s exports tumbled 25.4%, the biggest decline since May 2009; week’s auctions begin with $24b 3Y notes, WI 1.065% vs 0.844% in Feb., was lowest 3Y auction stop since 0.802% in March 2014.
Mark Carney was accused of jeopardizing the Bank of England’s credibility in the EU debate as pro-“Brexit” lawmaker Jacob Rees-Mogg said the central bank’s report on the topic supported the government’s position of remaining part of the bloc - An increase in investment and higher domestic spending helped propel the euro-area to its 11th successive quarter of growth as overall the economy grew 0.3% in the fourth quarter
- German industrial production in January climbed 3.3% from the prior month, the most in more than six years, in a sign that strong domestic demand may be helping to underpin output even as external trade cools
- European Union leaders edged toward an agreement with Turkey to halt the inflow of migrants, with the Turkish government jacking up the price for serving as the EU’s defensive barrier
- Cyprus FM Georgiades said he’s confident in his country’s ability to access the bond market, after the government won the blessing of its European partners and the IMF to exit a three-year-old aid program with no safety net
- Michael Bloomberg, the billionaire former three-term mayor of New York, said he’s decided against entering the 2016 presidential race. Bloomberg is the founder and majority owner of Bloomberg News parent Bloomberg LP
- $11.52b IG corporates priced yesterday; MTD volume $53.345b, YTD $347.595b
- No HY priced yesterday, $3.65b priced last week, $16.33b YTD
- Sovereign 10Y bond yields mostly lower led by Greece (-39bp); European, Asian markets lower; U.S. equity-index futures drop. WTI crude oil, copper fall, gold rallies
DB’s Jim Reid concludes the overnight wrap
I was a bit confused about yesterday. Markets were seemingly weak early on due to perceived disappointment about the scale of China’s fiscal impetus discussed over the weekend at the NPC even though our own Zhiwei Zhang thought it was in line with expectations. However in parallel Iron Ore was catapulted 18.59% higher (the largest single day gain with daily data going back to 2009) on hopes that the weekend showed China’s willingness to boost economic growth. Go figure.
In fact, Iron Ore has been one of the most impressive performing commodities this year and with yesterday’s move is now up 46% YTD so far as well as a massive 66% from the record lows made back on December 11th last year. Much of the commentary suggested yesterday’s move reflected to some degree a replenishing of Chinese steel mills supplies ahead of the ramping up of the summer construction season, as well as aggressive moves in Steel prices in expectation of demand recovery triggered by property policies and also abundant liquidity in the system. While similar commentary still remains cautious on the sustainability of such gains for now, further news overnight of a possible joint-venture of sorts between two of the biggest four producers, Fortescue and Vale, is keeping the market squarely in the spotlight for now.
Not to be outdone, Oil markets also continued their strong surge of late yesterday. WTI and Brent rallied +5.51% and +5.48% respectively with the former closing back in on $38/bbl and the latter ending the day back above $40/bbl for first time since December 9th. Sentiment was boosted after the news of another drop in the number of operating rigs last month while expectations continue to build ahead of a potential meeting between OPEC and non-OPEC producers later this month. In fact, the latest move has now seen WTI move into positive YTD territory (+2.21%) for the first time this year with Brent (+9.55%) already well through that level.
In fact, it’s now proving harder to find a commodity which isn’t posting positive YTD returns. Copper (+6.27%), Aluminium (+6.14%), Nickel (+6.41%) and Zinc (+12.52%) are all up for the year helped by the big rally this month, while even more impressive have been moves in precious metals with the well documented move for Gold (+19.50%) this year in particular eye-catching. Silver (+13.00%) is also up strongly while Platinum (+11.85%) and Palladium (+2.38%) have now entered bull markets. The laggards to the rally have come in agriculture with the likes of Corn, Wheat, Sugar and Cotton down single digits still. In any case, some staggering moves considering the extent of the selloff earlier this year.
So, despite that bumper day across commodity markets yesterday, declines across tech and consumer names tempered any hope for a material equity market rally. That said, the S&P 500 (+0.09%) did manage to nudge into positive territory by the close of play, bringing its run of consecutive daily gains to five now and matching the run made in October last year. Prior to this, a rough day for Italian Banks saw European equities edge lower however, with the Stoxx 600 closing -0.25% and Italian equity market down -1.20%, while credit markets on both sides of the pond enjoyed a marginally better day.
Glancing at our screens this morning, despite the commodity rally yesterday it’s been a rough start across most bourses in Asia with some softer than expected trade numbers out of China having their say. With regards to the data, China’s exports (in US Dollar terms) declined a much greater than expected -25.4% yoy (vs. -14.5% expected) in February, down from -11.2% in January and only slightly less than the record contraction back in May 2009 (of -26.4%). Imports also tumbled more than expected (-13.8% yoy vs. -12.0% expected) although that contraction was less than that seen in January. All told the data has seen the trade surplus shrink to $32.6bn from $63.3bn. The data in CNY terms shows a similar pattern with exports down -20.6% yoy (vs. -11.3% expected) and to a record low.
Bourses in China were already trading with a soft tone with the Shanghai Comp tumbling as low as -3.37% prior to the data, although it has rebounded into the midday break, albeit still down -1.55% on the day. The CSI 300 is -1.69%, while the Hang Seng is -0.74%, Kospi -0.68% and ASX -0.68%. In Japan the Nikkei is down -0.51% despite the second read of Japan’s Q4 GDP print being revised up unexpectedly by one-tenth to -0.3% qoq. Oil markets have receded a percent or so, while US equity futures are down half a percent.
Moving on. Yesterday’s Fedspeak offered two very differing opinions ahead of next week’s FOMC meeting. Fed Vice-Chair Fischer played down the suggestion that the link between strong employment and inflation was broken, saying that although the link has never been very strong, ‘it exists and we may well at present be seeing the first stirrings of an increase in the inflation rate’. Meanwhile, speaking at a separate conference in Washington, Fed Governor Brainard opined that ‘I am heartened by the continued strong progress on employment and the resilience of American consumers, which stand against a considerably more challenging global backdrop’. That said, she also warned that ‘we should not take the strength in the US labour market and consumption for granted’ and that ‘sources of robust demand around the globe are few, and sources of weakness relatively greater’. Brainard also cautioned that ‘tighter financial conditions and softer inflation expectations may pose risks to the downside for inflation and domestic activity’ and that ‘from a risk-management perspective, this argues for patience as the outlook becomes clearer’.
Away from the Fedspeak, yesterday’s economic dataflow was fairly quiet. In the US we saw the February labour market conditions index fall 1.6pts last month to a below market -2.4 (vs. +1.0 expected) which is in stark contrast to Friday’s employment report. In fact the reading was the lowest since June 2009 and the first back-to-back monthly drop since 2012. Post the closing bell we learned that US consumer credit in January rose by the least since May 2012 ($10.54bn vs. $17bn expected), with revolving credit (which includes credit cards) recording the first decline since February 2015. In Europe the main data of note was out of Germany where factory orders declined by less than expected in January (-0.1% mom vs. -0.3% expected). The Euro area Sentix investor confidence reading printed down 0.5pts this month at 5.5 and nearly 3pts below expectations.
Just before we look at the day ahead, a quick update on the migrant crisis talks in Brussels where a proposal is being debated between Turkey and the EU in which Turkey will accept the re-admission of migrants in exchange for further financial aid, visa-liberalisation for Turkish citizens and also a recommencing of EU accession talks. As per the BBC, the EU is demanding that Turkey take back migrants who fail to qualify for asylum and in return Turkey is demanding the EU to accept one Syrian refugee for every migrant taken back. Talks are set to resume ahead of the migration summit on 17th-18th March.
Looking at the day ahead, this morning in Europe we’ll be kicking off in Germany where the January industrial production data is due, shortly followed by French trade data. Later this morning we’ll receive the second reading on Q4 GDP for the Euro area (no change expected to the initial +0.3% qoq estimate) along with a breakdown of the components. The calendar is fairly thin again in the US this afternoon with last month’s NFIB small business optimism survey reading the only release of note. The BoE’s Carney and Cunliffe testifying to UK lawmakers (at 9.15am GMT) on Britain’s referendum on EU membership is worth keeping an eye on too.
Let us begin;
ASIAN AFFAIRS
Late MONDAY night/ TUESDAY morning: Shanghai closed UP BY 4.04 POINTS OR 0.14% ON A LAST 2 HR RESCUE, / Hang Sang closed DOWN by 148.14 points or 0.73% . The Nikkei closed DOWN 138.14 or 0.73%. Australia’s all ordinaires was DOWN 0.68%. Chinese yuan (ONSHORE) closed DOWN at 6.5050. Oil GAINED to 38.39 dollars per barrel for WTI and 41.22 for Brent. Stocks in Europe so far IN THE RED . Offshore yuan trades 6.5090 yuan to the dollar vs 6.5050 for onshore yuan/ LAST WEDNESDAY, MOODYS DOWNGRADES CHINA’S CREDIT FROM STABLE TO NEGATIVE. At the big people’s congress where they meet to set a 5 year plan, the leaders failed to deliver a major fiscal stimulus package. However instead they made very promises.
Last night’s summary from Japan:
Asian stocks tumble after lower than expected GDP revision. Abenomics just not working!!
AsiaPac Stocks Tumble After Japan GDP As China Trade Data Looms
Following a modest revision to Japanese GDP (still -1.1% and recession-y) and with all eyes glued to China’s trade data, Chinese and Japanese stocks are not following the panic-buying short-squeeze-driven lead of US equities. Both are down hard in the early AsiaPac trading(with China down for the first time in six days post-G-20).
It’s not working Mr Kuroda…

And the markets are starting to realize it…


This is China’s first losing day in 6 since the G-20 meeting ended such a dud…(and the world rallied on ECB hope)

Charts: Bloomberg
end
The 30 yr auction for Japanese bonds just ended and the yield is a paltry 47 basis points, a fall of 21 basis points from yesterday. The entire Japanese yield curve is negative out to 13 years. Also what is interesting is that the uSA 2 yr bond yield is higher than the 30 yr Japanese rate. This will no doubt force Japanese banks to shun Japanese bonds in favour of the USA bonds.
(courtesy zero hedge)
Japanese Government Bond Yields Collapse To Record Lows
Amid a strong 30 year auction overnight, long-dated Japanese Government Bond yields utterly collapsed. 30Y yields dropped 21bps – the biggest absolute drop in over 3 years and biggest percentage drop ever – to a record low 47bps. Since Kuroda unleashed NIRP, the entire JGB has been crushed and last night’s rush for long duration debt (well at least there is some yield there?) has flattened the curve to record lows. For context, Japan’s 30Y yield is now below US 2Y yield…
Nothing to see here…

As Reuters reports,
Japanese government bond yields tumbled to fresh record lows on Tuesday after a firm 30-year auction fuelled a rally for debt instruments that still offer positive yields, which have become scarce under the Bank of Japan’s negative interest rate policy.
Weaker Tokyo stocks also increased the allure of the bond market, with the Nikkei falling to a one-week low.
The benchmark 10-year yield fell to a new record low of minus 0.100 percent.
The 30-year yield plummeted 21 basis points, the biggest one-day fall in three years, to a life-time trough of 0.470 percent.
The rally by super long JGBs was triggered by strong results in a 30-year auction, underlining solid investor demand for the maturities that offer positive yields but also entailing greater duration risk.
“There were some concerns that the 30-year auction may not garner sufficient demand and the firm results prompted a rally in the bond futures. The auction results show domestic banks’ JGB buying is extending towards the super longs,” said a dealer at a Japanese financial institution.
As the entire JGB curve is now negative to 13 years…

Crashing the 30Y yield below the UST 2Y for the first time since pre-Lehman…

Which appears to be sending Japanese banks into USTreasuries out-curve…

This will not end well.
Charts: Bloomberg
end
Now our report from China: Extremely poor and unexpected trade balance report.
Both exports and imports plunge!!
(courtesy zero hedge)
China Trade Balance Plunges To 11-Month Lows As Exports Crash Over 25%
Worse than expected is an understatement.
Things are not getting better in China as Exports crashed 25.4% YoY (the 3rd largest drop in history), almost double the 14.5% expectation and Imports tumbled 13.8%, the 16th month of YoY decline – the longest ever. Altogether this sent the trade surplus down to $32.6bn (missing expectations of $51bn) to 11-month lows.

So much for that whole “devalue yourself to export growth” idea…

As Bloomberg notes,
China’s exports in yuan terms fell 20.6% year on year in February, down from a 6.6% drop in January, and missing expectations of an 11.3% fall. Imports were down 8.0%, an improvement from January’s 14.4% drop. The trade surplus came in at 209.5 billion yuan ($32 billion), down from 406.2 billion yuan.
The Chinese New Year holiday, which fell at the start of February in 2016 and in the middle of February in 2015, distorts the data in unpredictable ways. Holiday effects mean the outsize drop in February exports overstates the weakness in China’s factory sector.
Even so, looking at a year-to-date figure for the first two months of the year, the picture is only slightly less gloomy. In the year through February, exports are down 13.1%.
The policy response has already been announced. The National People’s Congress set a target for 13% growth in money supply in 2016, up from 12% in 2015, and a 3% of GDP fiscal deficit, up from 2.3%. In other words: more lending and more public spending to provide a boost to demand. In the short term, that shores up confidence in the growth outlook. Medium term, of course, there is a price to be paid.
Stocks are mounting a modest rebound on this terrible data (moar stimulus hopes) but after $1 trillion of new credit in 2 months, is there seriously anyone left who thinks moar will help?
We leave it to Borat to explain the Chinese authorities take on this data…
Your early morning currency/gold and silver pricing/Asian and European bourse movements/ and interest rate settings/TUESDAY morning 7:00 am
Euro/USA 1.1026 up .0013
USA/JAPAN YEN 113.02 DOWN .457 (Abe’s new negative interest rate (NIRP)a total bust
GBP/USA 1.4211 DOWN .0047 (threat of Brexit)
USA/CAN 1.3327 UP.0035
Early THIS MONDAY morning in Europe, the Euro ROSE by 13 basis points, trading now JUST above the important 1.08 level falling to 1.0883; Europe is still reacting to deflation, announcements of massive stimulation (QE), a proxy middle east war, and the ramifications of a default at the Austrian Hypo bank, an imminent default of Greece, Glencore, Nysmark and the Ukraine, along with rising peripheral bond yield further stimulation as the EU is moving more into NIRP, and the threat of continuing USA tightening by raising their interest rate / Last night the Chinese yuan was UP in value (onshore) The USA/CNY DOWN in rate at closing last night: 6.5050 / (yuan UP but will still undergo massive devaluation/ which will cause deflation to spread throughout the globe)
In Japan Abe went BESERK with NEW ARROWS FOR HIS Abenomics WITH THIS TIME INITIATING NIRP . The yen now trades in a NORTHBOUND trajectory RAMP as IT settled UP in Japan by 46 basis points and trading now well BELOW that all important 120 level to 113.04 yen to the dollar. NIRP POLICY IS A COMPLETE FAILURE AND ALL OF OUR YEN CARRY TRADERS HAVE BEEN BLOWN UP (TODAY TRADERS RAMPED USA/YEN AND THUS ALL BOURSES RISE!!)
The pound was DOWN this morning by 47 basis points as it now trades WELL ABOVE the 1.40 level at 1.4211.
The Canadian dollar is now trading DOWN 35 in basis points to 1.3357 to the dollar.
Last night, Chinese bourses were MAINLY DOWN/Japan NIKKEI CLOSED DOWN 178.17 POINTS OR 0.76%, HANG SANG DOWN 148.14 OR 0.73% SHANGHAI UP 4/04 OR 0.14% ON LAST HOUR RESCUE / AUSTRALIA IS LOWER / ALL EUROPEAN BOURSES ARE IN THE RED, WITH A FAILURE ON USA/YEN RAMP as they start their morning.
We are seeing that the 3 major global carry trades are being unwound. The BIGGY is the first one;
1. the total dollar global short is 9 trillion USA and as such we are now witnessing a sea of red blood on the streets as derivatives blow up with the massive rise in the rise in the dollar against all paper currencies and especially with the fall of the yuan carry trade. The emerging market which house close to 50% of the 9 trillion dollar short is feeling the massive pain as their debt is quite unmanageable.
2, the Nikkei average vs gold carry trade (blowing up and the yen carry trade HAS BLOWN up/and now NIRP)
3. Short Swiss franc/long assets blew up ( Eastern European housing/Nikkei etc.
These massive carry trades are terribly offside as they are being unwound. It is causing global deflation ( we are at debt saturation already) as the world reacts to lack of demand and a scarcity of debt collateral. Bourses around the globe are reacting in kind to these events as well as the potential for a GREXIT>
The NIKKEI: this TUESDAY morning: closed DOWN 178.17 OR 0,76%
Trading from Europe and Asia:
1. Europe stocks IN THE RED
2/ CHINESE BOURSES MOSTLY IN THE RED/ : Hang Sang CLOSED DOWN 148.14 POINTS OR .73% ,Shanghai IN THE GREEN/ Australia BOURSE IN THE RED: /Nikkei (Japan)RED/India’s Sensex in the GREEN /
Gold very early morning trading: $1274.25
silver:$15.63
Early TUESDAY morning USA 10 year bond yield: 1.85% !!! DOWN 5 in basis points from last night in basis points from MONDAY night and it is trading WELL BELOW resistance at 2.27-2.32%. The 30 yr bond yield falls to 2..64 DOWN 6 in basis points from MONDAY night.
USA dollar index early TUESDAY morning: 97.07 DOWN 3 cents from MONDAY’s close.(Now below resistance at a DXY of 100)
This ends early morning numbers TUESDAY MORNING
Portuguese 10 year bond yield: 3.17% UP 3 in basis points from MONDAY
“I’ll Go Full Power If There’s No Agreement” – Kuwait Breaks OPEC Production Freeze
Back in late February, when crude prices had just hit a 13 year low, one catalyst unleashed a furious short-covering rally: a WSJ report which cited a delayed SkyNews interview with the UAE energy minister, according to which OPEC would freeze, if not cut production. Since then we learned, courtesy of the Saudi oil minister Al-Naimi himself, that the Saudis will never reduce output, however, in a utterly meaningless gesture, Saudi Arabia and Russia agreed to “freeze” production at levels which are already at maximum capacity and under one condition: that all other OPEC members join the freeze, with the possible exception of Iran which may be allowed to produce until it hits its pre-embargo export levels.
Of course, even said “freeze” is nothing but a stalling tactic employed by an OPEC member (Saudi Arabia), to give the impression that OPEC still exists as a production-throttling cartel when OPEC ceased to exist in that capacity in November 2014. Everything since then has been one surreal redux of “Weekend at Bernies” where everyone pretends not to notice the corpse in the room.
However, while many had pretended to at least play along with the charade, today a core OPEC member effectively broke ranks when Kuwait said it would only agree to an output freeze if all major producers take part including Iran.
According to Reuters, Kuwait’s oil minister said on Tuesday that his country’s participation in an output freeze would require all major oil producers, including Iran, to be on board.
“I’ll go full power if there’s no agreement. Every barrel I produce I’ll sell,” Anas al-Saleh told reporters in Kuwait City. And since Iran has made it very, very clear it will not join the production freeze at its current mothballed output, and will need at least 9-12 months before it regains its pre-embargo capacity levels, one can forget about a production freeze well into 2017 if not for ever since by then at least one if not more OPEC members will be bankrupt (they know who they are: they are the source of those “ALL CAPS” flashing read headlines every day).
Putting Kuwait’s production in context, Kuwait – the small Gulf state Saddam invaded 25 years ago – is currently producing 3 million barrels of oil per day. Incidentally, this is precisely how much the oil market is oversupplied each and every day, and why in addition to PADD1, 2 and 3 being almost full, and excess oil now being stored in ships, pipelines and trains, and re-exported to Europe, quite soon empty swimming pools will be full with the “black gold” as the algos continue to refuse to pay any attention to the constantly deteriorating fundamentals.
Kuwait’s announcement followed a report by Goldman overnight in which, as we reported, Jeff Currie said that “commodity rally is not sustainable” and it is time to sell crude.
“While these dynamics (rising prices) could run further, they simply are not sustainable in the current environment,” the analysts wrote. “Energy needs lower prices to maintain financial stress to finish the rebalancing process; otherwise, an oil price rally will prove self-defeating, as it did last spring.”
Perhaps, but not just yet: in addition to China’s abysmal exports we also learned that in February China’s crude imports soared 19.1% to 31.80 million tonnes, or about 8 million barrels per day, an all time high, suggesting China – like the US – is filling every available container including its SPR at a time when precise are relatively low even if organic demand continues to deteriorate.
As Reuters writes, “despite strong oil demand, questions about the sustainability of growing consumption weighed on markets after China’s overall exports tumbled by a quarter in February.”
China’s February vehicle sales, a key driver for gasoline demand, were down 3.7 percent year on year, data from the country’s Passenger Car Association showed.“This is really a poor start for trade this year,” said Zhang Yongjun, senior economist at the China Centre for International Economic Exchanges.
However, judging by the latest bounce in crude in the last hour of trading, the only thing that still matters is who does the daily “short squeeze” rip higher. By the looks of things, at least one major trader already got the tap on the shoulder.
Oil Fundamentals Could Cause Oil Prices To Fall, Fast!
Submitted by Artrhur Bermann via OilPrice.com,
Oil prices should fall, possibly hard, in coming weeks. That is because fundamentals do not support the present price.
Prices should fall to around $30 once the empty nature of an OPEC-plus-Russia production freeze is understood. A return to the grim reality of over-supply and the weakness of the world economy could push prices well into the $20s.

A Production Freeze Will Not Reduce The Supply Surplus
An OPEC-plus-Russia production cut would be a great step toward re-establishing oil-market balance. I believe that will happen later in 2016 but is not on the table today.
In late February, Saudi oil minister Ali Al-Naimi stated categorically, “There is no sense in wasting our time in seeking production cuts. That will not happen.”
Instead, Russia and Saudi Arabia have apparently agreed to a production freeze. This is meaningless theater but it helped lift oil prices 37 percent from just more than $26 in mid-February to almost $36 per barrel last week. That is a lot of added revenue for Saudi Arabia and Russia but it will do nothing to balance the over-supplied world oil market.
The problem is that neither Saudi Arabia nor Russia has greatly increased production since the oil-price collapse began in 2014 (Figure 1). A freeze by those countries, therefore, will only ensure that the supply surplus will not get worse because of them. It is, moreover, doubtful that Saudi Arabia or Russia have the spare capacity to increase production much beyond present levels making the proposal of a freeze cynical rather than helpful.

(Click to enlarge)
Figure 1. Incremental liquids production since January 2014 by the United States plus Canada, Iraq, Saudi Arabia and Russia. Source: EIA & Labyrinth Consulting Services, Inc. (click image to enlarge)
Saudi Arabia and Russia are two of the world’s largest oil-producing countries. Yet in January 2016, Saudi liquids output was only ~110,000 bpd more than in January 2014 and Russia was actually producing~50,000 bpd less than in January 2014. The present world production surplus is more than 2 mmbpd.
By contrast, the U.S. plus Canada are producing ~1.9 mmbpd more than in January 2014 and Iraq’s crude oil production has increased ~1.7 mmbpd. Also, Iran has potential to increase its production by as much as ~1 mmbpd during 2016. Yet, none of these countries have agreed to the production freeze. Iran, in fact, called the idea “ridiculous.”
Growing Storage Means Lower Oil Prices
U.S. crude oil stocks increased by a remarkable 10.4 mmb in the week ending February 26, the largest addition since early April 2015. That brought inventories to an astonishing 162 mmb more than the 2010-2014 average and 74 mmb above the bloated levels of 2015 (Figure 2).

(Click to enlarge)
Figure 2. U.S. crude oil stocks. Source: EIA and Labyrinth Consulting Services, Inc. (click image to enlarge)
The correlation between U.S. crude oil stocks and world oil prices is strong. Tank farms at Cushing, Oklahoma (PADD 2) and storage facilities in the Gulf Coast region (PADD 3) account for almost 70 percent of total U.S. storage and are critical in WTI price formation. When storage exceeds about 80 percent of capacity, oil prices generally fall hard. Current Cushing storage is at 91 percent of capacity, the Gulf Coast is at 87 percent and combined, they are at a whopping 88 percent of capacity (Figure 3).

(Click to enlarge)
Figure 3. Cushing and Gulf Coast crude oil storage. Source: EIA and Labyrinth Consulting Services, Inc. (click image to enlarge)
Prices have fallen hard in step with growing storage throughout 2015 and early 2016. Since talk of a production freeze first surfaced, however, intoxicated investors have ignored storage builds and traders are testing new thresholds before they fall again.
The truth is that prices will not increase sustainably until storage volumes fall, and that cannot happen until U.S. production declines by about 1 mmbpd.
Despite extreme reductions in rig count and catastrophic financial losses by E&P companies, production decline has been painfully slow. The latest data from EIA indicates that February 2016 production will fall approximately 100,000 bpd compared to January (Figure 4).

(Click to enlarge)
Figure 4. U.S. crude oil production and forecast. Source: EIA STEO, EIA This Week In Petroleum, and Labyrinth Consulting Services, Inc. (click image to enlarge)
That is an improvement over the average 60,000 bpd monthly decline since the April 2015 peak. It is not enough, however, to make a difference in storage and storage controls price.
EIA and IEA will publish updates this week on the world oil market balance and I doubt that the news will be very good. IEA indicated last month that the world over-supply had increased almost 750,000 bpd in the 4th quarter of 2015 compared with the previous quarter. EIA data corroborated those findings and showed that the surplus in January 2016 had increased 650,000 bpd from December 2015.
Oil Prices and The Value of the Dollar
Why, then, have oil prices increased? Partly, it is because of hope for an OPEC production freeze and that sentiment is expressed in the OVX crude oil-price volatility index (Figure 5).

(Click to enlarge)
Figure 5. Crude oil volatility index (OVX) and WTI price. Source: EIA, CBOE and Labyrinth Consulting Services, Inc. (click image to enlarge)
The OVX reflects how investors feel about where oil prices are going. It is sometimes called the “fear index.” That suggests that investors are feeling pretty good and less fearful about the oil markets than in the last quarter of 2015 when oil prices fell 47 percent. Since mid-February, prices have increased 37 percent.
But there is more to it than just hope and that may be found in the strength of the U.S. dollar. The negative correlation between the value of the dollar and world oil prices is well-established. The oil-price increase in February was accompanied by a decrease in the trade-weighted value of the dollar (Figure 6).

(Click to enlarge)
Figure 6. U.S. Dollar value vs. WTI NYMEX futures price. Source: EIA, U.S. Federal Reserve Bank and Labyrinth Consulting Services, Inc. (click to enlarge)
Now, that trend has reversed. The U.S. jobs report last week was positive so continued strength of the dollar is reasonable for a while. Assuming the usual correlation, that means that oil prices should fall.
Oil Prices Should Fall Hard
It is a sign of how bad things have gotten in oil markets that we feel optimistic about $35 oil prices. It should also be a warning that the over-supply that got us here has not gone away.
Oil storage volumes continue to grow and that is the surest indication that production has not declined enough yet to make a difference. It is impossible to imagine oil prices rising much beyond present levels until storage starts to fall. In fact, it is difficult to understand $35 per barrel prices based on any measure of oil-market fundamentals.
The OPEC-plus-Russia production freeze is a cynical joke designed to increase their short-term revenues without doing anything about production levels. An output cut would make a difference but a freeze on current Saudi and Russian production levels means nothing. It apparently made some investors feel better but it didn’t do anything for me. Iran got this one right by calling it ridiculous.
No terrible economic news has surfaced in recent weeks but that does not change the profound weakness of a global economy that is burdened with debt and weak demand. The announcement last week by thePeople’s Bank of China that it sees room for more quantitative easing may have comforted stock markets but it only added to my anxiety about reduced oil consumption and future downward shocks in oil prices.
I hope that oil prices increase but cannot find any substantive reason why they should do anything but fall. As market balance reality re-emerges in investor consciousness and the false euphoria of a production freeze recedes, prices should correct to around $30. A little bad economic or political news could send prices much lower.
end
The Oil Short Squeeze Explained: Why Banks Are Aggressively Propping Up Energy Stocks
Last week, during the peak of the commodity short squeeze, we pointed out how this default cycle is shaping up to be vastly different from previous one: recovery rates for both secured and unsecured debts are at record low levels. More importantly, we noted how this notable variance is impacting lender behavior, explaining that banks – aware that the next leg lower in commodities is imminent – are not only forcing the squeeze in the most trashed stocks (by pulling borrow) but are doing everything in their power to “assist” energy companies to sell equity, and use the proceeds to take out as much of the banks’ balance sheet exposure as possible, so that when the default tsunami finally arrives, banks will be as far away as possible from the carnage. All of this was predicated on prior lender conversations with the Dallas Fed and the OCC, discussions which the Dallas Fed vocally denied accusing us of lying, yet which the WSJ confirmed, confirming the Dallas Fed was openly lying.
This was the punchline:
[Record low] recovery rate explain what we discussed earlier, namely the desire of banks to force an equity short squeeze in energy stocks, so these distressed names are able to issue equity with which to repay secured loans to banks who are scrambling to get out of the capital structure of distressed E&P names. Or as MatlinPatterson’s Michael Lipsky put it: “we always assume that secured lenders would roll into the bankruptcy become the DIP lenders, emerge from bankruptcy as the new secured debt of the company. But they don’t want to be there, so you are buying the debt behind them and you could find yourself in a situation where you could lose 100% of your money.”
And so, one by one the pieces of the puzzle fall into place: banks, well aware that they are facing paltry recoveries in bankruptcy on their secured exposure (and unsecured creditors looking at 10 cents on the dollar), have engineered an oil short squeeze via oil ETFs…
… to push oil prices higher, to unleash the current record equity follow-on offering spree…
… to take advantage of panicked investors some of whom are desperate to cover their shorts, and others who are just as desperate to buy the new equity issued. Those proceeds, however, will not go to organic growth or even to shore liquidity but straight to the bank to refi loan facilities and let banks, currently on the hook, leave silently by the back door. Meanwhile, the new investors have no security claims and zero liens, are at the very bottom of the capital structure, and face near certain wipe outs.
In short, once the current short squeeze is over, expect everyone to start paying far more attention to recovery rates and the true value of “fundamentals.”


Going back to what Lipsky said, “the banks do not want to be there.” So where do they want to be? As far away as possible from the shale carnage when it does hit.
Today, courtesy of The New York Shock Exchange, we present just the case study demonstrating how this takes place in the real world. Here the story of troubled energy company “Lower oil prices for longer” Weatherford, its secured lender JPM, the incestuous relationship between the two, and how the latter can’t wait to get as far from the former as possible, in…
“Why Would JP Morgan Raise Equity For An Insolvent Company“
I am on record saying that Weatherford International is so highly-leveraged that it needs equity to stay afloat. With debt/EBITDA at 8x and $1 billion in principal payments coming due over the next year, the oilfield services giant is in dire straits. Weatherford has been in talks with JP Morgan Chase to re-negotiate its revolving credit facility — the only thing keeping the company afloat. However, in a move that shocked the financial markets, JP Morgan led an equity offering that raised $565 million for Weatherford. Based on liquidation value Weatherford is insolvent. The question remains, why would JP Morgan risk its reputation by selling shares in an insolvent company?
According to the prospectus, at Q4 2015 Weatherford had cash of $467 million debt of $7.5 billion. It debt was broken down as follows: [i] revolving credit facility ($967 million), [ii] other short-term loans ($214 million), [iii] current portion of long-term debt of $401 million and [iv] long-term debt of $5.9 billion. JP Morgan is head of a banking syndicate that has the revolving credit facility.
Even in an optimistic scenario I estimate Weatherford’s liquidation value is about $6.7 billion less than its stated book value. The lion’s share of the mark-downs are related to inventory ($1.1B), PP&E ($1.9B), intangibles and non-current assets ($3.5B). The write-offs would reduce Weatherford’s stated book value of $4.4 billion to – $2.2 billion. After the equity offering the liquidation value would rise to -$1.6 billion.
JP Morgan and Morgan Stanley also happen to be lead underwriters on the equity offering. The proceeds from the offering are expected to be used to repay the revolving credit facility.
In effect, JP Morgan is raising equity in a company with questionable prospects and using the funds to repay debt the company owes JP Morgan. The arrangement allows JP Morgan to get its money out prior to lenders subordinated to it get their $401 million payment. That’s smart in a way. What’s the point of having a priority position if you can’t use that leverage to get cashed out first before the ship sinks? The rub is that [i] it might represent a conflict of interest and [ii] would JP Morgan think it would be a good idea to hawk shares in an insolvent company if said insolvent company didn’t owe JP Morgan money?

The answer? JP Morgan doesn’t care how it looks; JP Morgan wants out and is happy to do it while algos and momentum chasing daytraders are bidding up the stock because this time oil has finally bottomed… we promise.
So here’s the good news: as a result of this coordinated lender collusion to prop up the energy sector long enough for the affected companies to sell equity and repay secured debt, the squeeze may last a while; as for the bad news: the only reason the squeeze is taking place is because banks are looking to get as far from the shale patch and the companies on it, as possible.
We leave it up to readers to decide which “news” is more relevant to their investing strategy.
end
EIA’s Dire Oil Forecast: $34 Crude Due To Far More Resilient Production, Oversupply And Lower Demand
Now that the massive USO-driven squeeze appears to be over (congratulations to whoever managed to sell equity and their secured lenders) the bad news can return. First, it was Goldman slamming the “unsustainable rally, and then just a few hours ago, the EIA released its latest monthly short-term outlook report in which it brought even more bad news for long-suffering bulls who thought the pain was finally over.
Instead, the pain is only just beginning, after the EIA revised its 2016 supply forecast higher as “production is more resilient to lower prices than previously expected” – why thank you desperate momentum chasing “investors” of other people’s money, who can’t wait for that secondary offering to repay JPMorgan’s credit facility.
The EIA also revised its forecast demand lower as a result of a decline in global economic growth.
Yes, someone finally admitted that demand is lower.
End result: a cut in forecast oil prices for 2016 and 2017 from $37 and $50 to just $34 and $40.
Here is the summary, with the troubling parts highlighted:
Global oil inventories are forecast to increase by an annual average of 1.6 million b/d in 2016 and by an additional 0.6 million b/d in 2017. These inventory builds are larger than previously expected, delaying the rebalancing of the oil market and contributing to lower forecast oil prices. Compared with last month’s STEO, EIA has revised forecast supply growth higher for 2016 and revised forecast demand growth lower for both 2016 and 2017. Higher 2016 supply in this month’s STEO is based on indications that production is more resilient to lower prices than previously expected. Notably, revisions to historical Russian data, which raised the baseline for Russian production, carry through much of the forecast. Additionally, lower expectations for global economic growth contributed to a reduction in the oil demand forecast.
And the details:
- Brent crude oil prices are forecast to average $34/b in 2016 and $40/b in 2017, $3/b and $10/b lower than forecast in last month’s STEO, respectively.The lower forecast prices reflect oil production that has been more resilient than expected in a low-price environment and lower expectations for forecast oil demand growth.
- Forecast West Texas Intermediate (WTI) crude oil prices are expected to average the same as Brent in 2016 and 2017. However, the current values of futures and options contracts suggest high uncertainty in the price outlook. For example, EIA’s forecast for the average WTI price in June 2016 of $35/b should be considered in the context of recent Nymex contract values for June 2016 delivery (Market Prices and Uncertainty Report) suggesting that the market expects WTI prices to range from $24/b to $58/b (at the 95% confidence interval).
- Global oil inventories are forecast to increase by an annual average of 1.6 million b/d in 2016 and by an additional 0.6 million b/d in 2017. These inventory builds are larger than previously expected, delaying the rebalancing of the oil market and contributing to lower forecast oil prices. Compared with last month’s STEO, EIA has revised forecast supply growth higher for 2016 and revised forecast demand growth lower for both 2016 and 2017. Higher 2016 supply in this month’s STEO is based on indications that production is more resilient to lower prices than previously expected. Notably, revisions to historical Russian data, which raised the baseline for Russian production, carry through much of the forecast. Additionally, lower expectations for global economic growth contributed to a reduction in the oil demand forecast.
- U.S. crude oil production averaged an estimated 9.4 million barrels per day (b/d) in 2015, and it is forecast to average 8.7 million b/d in 2016 and 8.2 million b/d in 2017. EIA estimates that crude oil production in February averaged 9.1 million b/d, which was 80,000 b/d below the January level
Breaking it down just for non-OPEC, or mostly shale:
- Non?OPEC Petroleum and Other Liquids Supply. EIA estimates that petroleum and other liquid fuels production in countries outside of the Organization of the Petroleum Exporting Countries (OPEC) grew by 1.5 million b/d in 2015, with most of the growth occurring in North America. EIA expects non-OPEC production to decline by 0.4 million b/d in 2016, which would be the first decline since 2008. Most of the forecast production decline in 2016 is expected to be in the United States. Non-OPEC production is forecast to decline by 0.5 million b/d in 2017.
- Changes in non-OPEC production are driven by changes in U.S. tight oil production, which is characterized by high decline rates and relatively short investment horizons, making it among the most price-sensitive globally. However, increases in production of hydrocarbon gas liquids (HGL) from natural gas plants and in crude oil production from the Gulf of Mexico partially offset lower tight oil production. Forecast total U.S. liquid fuels production declines by 0.5 million b/d in 2016 and by 0.2 million b/d in 2017, both less than the decline in crude oil considered separately.
So a 0.9mm b/d decline cumulatively being taken away from non-OPEC. The problem is that Saudi Arabia continues to report, there is a 3 million barrell excess supply every day; it also means that the market will remain oversupplied just purely on the OPEC side for the next 22 months! Basically, anyone hoping for a quick rebalancing in the oil market will be very severly disappointed.
Perhaps the only hope is that the EIA is massively wrong in its forecast. Here is its latest price forecast curve:

… and this is what the EIA “predicted” precisely two years ago.

Just a little bit off.
Crude Chaos As Cushing Inventories Rise For 6th Straight Week
Following Genscape’s projection that Cushing inventories rose less than expected, various sources on Twitter report that API sees a 4mm build (in line with expectations of a 3.9mm build) after EIA’s massive build of over 10.3mm barrels last week. Cushing saw a 692k build – the 6th week in a row but gasoliine and distillates saw a draw. Crude sold off all day as the short-covering squeeze ended but as the data hit, WTI dipped, ripped, and dipped again… only to rally once more…
API
- Crude +4mm
- Cushing
- Gasoline
- Distillates
Sixth weekly rise in Cuhsing Inventories…

And the reaction in crude…

Charts: Bloomberg
end
Commodities, Stocks, & Bond Yields Plunge As Super-Short-Squeeze Stalls
We suspect the following will be heard a little more this week than last…
The squeeze is over… for now thanks To Fed’s Fischer…After 10 straight days without dropping, “Most Shorted” tumbled the most in 2 months…

And crude oil ETF short-squeeze is over – Oil ETF long/short is back to recent norms…

And the major indices were extremely overbought… Trannies are as overbought as they were at the peak in Nov 2014 (after Bullard’s QE4 bounce)…

And Small Caps are as overbought as they were at their peak in June 2015.

Which left stocks sliding after dismal China trade data and Goldman pouring cold water on the crude ramp…

Futures show the reactions as Japanese GDP stayed in recession, China Trade Data disappointed, Germany beat… and reality struck in the crude complex…

Leaving S&P Futures right at the crucial trendline…

As VIX was dumped in the last minute to ensure 1980 was held…

VIX surged near 19 again…

Energy & Financials went from winners to biggest losers very quick… This was energy sector’s 2nd biggest daily drop since August Black Monday

We’re gonna need another Mclendon death…

And Tilson’s short LL again..

Oil decoupled from stocks…but stocks caught down in the end amid Crude’s drop in 2 weeks

Bonds decoupled from stocks… but they recoupled into the close…

And after this yuuge rally aimed at supporting energy stocks to get secondaries (and banks to unload), credit risk on the junkiest junk has not improved at all…widest since 2009

And with everyone chasing HYG (not realizing this is a placeholder for fund manager cash as the primary market is dead for now – but due to pick up), we thought the following chart might help with some rationality…

And noting that HYG has stalled at its 100DMA…

Treasury yiuelds plunged on the day as repomarkets imploded…(and JGB yields collapsed)…

The USD Index rose very modestly on the day as commodity currencies (CAD, AUD) tumbled and JPY strengthened (as carry was unwound en masse)

Commodities were all weak, led by crude and copper on the day…

Copper’s worst day in 2 months…

Charts: Bloomberg
We brought this to your attention on Friday. The repo bond market is basically a tool to borrow treasuries especially the 10 yr note. The amount of borrowings has been so great that the negative 2.75% yield means that the borrower is paid to borrow. It also means that there is a scarcity of bonds as everybody has shorted the treasuries and loaded the boat on the short side. This has caused many failures to deliver and for investors it is better to pay the penalty than to deliver the paper!
(courtesy zero hedge)
Are Treasury Shorts About To Scream: 10s, 30s Plunge In Repo, “Fails” Galore
Over the past week we have been following a disturbing development in the US Treasury market: while the repo rate on the 10Y has been sliding deep into negative territory for a while, on Friday it finally hit the “fails charge” of -3.00%, suggesting there is a massive shortage of Treasury paper as a result of wholesale shorting by various market participants.
Back then we explained the move as follows: “[as of this moment] the repo rate can’t go any lower, and any demands to cover Treasury shorts are met with “Delivery Failure” notices. For those who are unfamiliar, a “Delivery Failure”occurs when one party fails to deliver a U.S. Treasury security, Agency Debt or Agency MBS to another party by the date previously agreed by the parties (Sifma has more). It also means that there is an unprecedented (and based on the historical data, record) amount of shorts who would rather pay the fails charge than to cover their positions on the delivery demand, or alternatively, there is simply not enough Treasurys in the private market that are not locked up in short positions. Finally, this means that the panicked scramble by various entities, including central banks, to short US Treasurys continues unabated.”
Over the weekend Bloomberg picked up on this with a note titled “The Treasury Market’s Big Short Is in 10-Year Notes, Repos Show” in which it reiterated as much:
Demand is so great for benchmark 10-year Treasuries in the $1.6 trillion market for borrowing and lending U.S. government debt, and supply is so short, that traders are willing to pay to lend cash to get their hands on the issue.
The overnight repurchase agreement rate on the newest 10-year note was negative 2.9 percent at noon New York time Monday, the lowest for any Treasury note or bond, according to ICAP Plc data. In the parlance of the repo world, that means the maturity is on ‘special,’ signaling heightened appetite for this specific security in deals where traders exchange the debt for overnight cash. In agreements lasting one month, the rate was as low as negative 1 percent last week, the most special since mid-2008, according to JPMorgan Chase & Co.
While futures traders have been short the maturity for about a year, the scramble in the repo market has intensified as the availability of the notes in cash dealings has dwindled.
There is more to it but the gist is clear: everyone is short the 10Y.
Today JPM confirmed as much when it said that according to the Treasury Client Survey for the week ended March 7, active clients were the most short since November 23; broken down as follows:
- Longs 14 vs 20
- Neutrals 64, unch
- Shorts 22 vs 16
- Net longs -8 vs 4
And then we got the latest repo data, where we find that the shortage has never been worse!
According to ICAP, the current 10Y remains at the “fails charge” of -3.00% in repo, which according to Bloomberg is a “reflection of the increasing short base and shortage of the security, which the Fed cannot alleviate because it doesn’t hold much of the issue.”
As Stone McCarthy writes, “once again the 10-year note has fallen below the fails charge. The 10-year note has fallen below the -275 basis point fails charge at various times over the past four days, though currently it is at -280 basis points. With this much pressure on the issue, it may continue to trade special even after the new auction settles and it is classified as the off the run 10-year note.”

Worse, the shortage at the 10Y has now drifted to the long end as well as someone is absolutely desperate to keep yields higher. More from SMRA:
“even more noteworthy is the 30-year bond’s drop to -75 basis points. The 30-year bond rarely trades this tight, the last time it was below 75 basis points was December 14th, 2010.”

And the shortage has even migrated to the short end! “The 3-year note is also trading special at -20 basis points this morning ahead of its auction this afternoon.”
In short, pardon the pun, there is no OTR paper available at all!
To be sure, some optimists continue to hold out hope that new 10Y supply will “clear up the fails” although that is precisely what they said when the Treasury issuance announcement was made last week. It did not help. Meanwhile, the demand for paper is about double what is available: just yesterday, dealers took $905m of $906m 1.625% Feb-26 security available, after requesting double this amount or $1.822 billion.
Meanwhile, 10Y yields are starting to slide:

Is today the day the short trap for Treasury bears is finally sprung and the 10Y pulls a “crude” and soars? Find out soon.
Citi Slumps After CFO Forecasts Huge Revenue Drop
Just two days ago, everything was awesome – oil was up, stocks were up, financials were ‘winning’ – and then question started about why credit risk hadn’t rallied like stocks.

But today we get our slap back to reality as Citi CFO unleashes the following: CITIGROUP SEES INVESTMENT BANKING REVENUE DOWN 25%, FIXED INCOME, EQUITY TRADING REV DOWN 15% YOY. The stock is rapidly giving up its “everything’s fine” gains as Citi “hopes” for more rate hikes… but does not expect them.

Citigroup’s CFO Gerspach is speaking at the RBC Conference in NYC… (live feed here)
“In fixed income, we see spread products continuing to have pressure,” Gerspach said. “That’s been a story for the last 18 months.”
- *CITICORP EXPECTS $400 MLN REPOSITIONING RESERVE, GERSPACH SAYS
- *CITIGROUP SAYS OTHER THAN ENERGY SECTOR, CREDIT PERFORMING WELL
- *CITIGROUP CFO SAYS STILL ‘HOPE’ FED WILL RAISE RATES 2X IN 2016
- *CITIGROUP CFO SAYS MORE LIKELY ONE RATE INCREASE IN 2016 BY FED
- *CITIGROUP CFO: WOULD BE SURPRISED IF U.S. RATES GO NEGATIVE
- *CITIGROUP CFO: QUESTIONS WHETHER NEGATIVE RATES ARE EFFECTIVE
- *CITIGROUP CFO SAYS BANK FEELS VERY GOOD ABOUT CHINA EXPOSURE
- *GERSPACH SEES FURTHER BRANCH CLOSURES IN U.S., INTERNATIONALLY
So did the Japanese banks.
end
David Stockman tackles the earnings of our S and P. He is warning everyone that an ambush on NY will cause considerable damage shortly and he explains why:
(courtesy David Stockman/ContraCorner)
The Price Isn’t Right——-How Central Banks Are Fixing To Ambush The Casino
by David Stockman • March 7, 2016


The casino is incorrigible. After a monumental short squeeze that has lifted the averages right into the jaws of danger, Goldman Sachs has the temerity to print the following:
“Our model suggests SPX calls are more attractive than at any time over the past 20 years”.
There must have been a mullets’ breeding frenzy awhile back because it’s hard to fathom how Goldman has any real customers left. Then again, its current preposterous call is just indicative of the horrible threat heading menacingly toward what remains of main street’s 401k investments.
To wit, the Fed and other central banks have thoroughly falsified financial market prices and destroyed all of the ordinary mechanisms of financial discipline. Foremost among these are short sellers and a meaningfully positive cost of carry trades.
Markets are therefore unhinged from any connection to fundamental economic and financial reality, meaning that they are capable of an extended period of spasmodic deadcat bounces that will have only one end result.
Namely, the naïve and desperate among main street investors who still, unaccountably, frequent the casino will presently be taken out back and shot yet another time. The market technicians are pleased to call this “distribution”. Would that someone on Wall Street man-up and amend the phrase to read ” distribution……. of the losses” and be done with the charade.
The S&P 500 is heading through 1300 from above long before it ever again penetrates from below its old May 2015 high of 2130. And now that 97% of Q4 results are in, there is a single number that proves the case.
Reported LTM profits as of year-end 2015 stood at just $86.46 per S&P 500 share. That particular number is a flat-out bull killer.
It represents an 18% decline from peak S&P 500 reported earnings of $106per share back in September 2014. And more importantly, it means that the robo-machines and hedge fund gamblers have traded the market back up to23.1X earnings.
That’s off the charts…….except for when recession has already arrived unannounced by the hockey stick factories of Wall Street.
But here’s the thing with respect to the scarlet 23.1X numerals now painted on the casino’s front entrance. It comes at a time when the so-called historical average PE ratios are way too high for present realities. That is, in a world sliding into a prolonged deflationary decline, capitalization rates should be falling into the sub-basement of history.
Why? Because current earnings are worth far less than normal owing to the prospect that renewed earnings growth anytime soon is lodged somewhere between zero and none.
So when capitalization rates should be plunging the casino has them soaring, while pretending its all awesome on the earnings front. In a nearby post, Lance Roberts puts the story in devastating historical context.
For the third time this century, corporate earnings are already in free fall, yet the Wall Street hockey sticks are still pointing archly to the upper right of the chart.
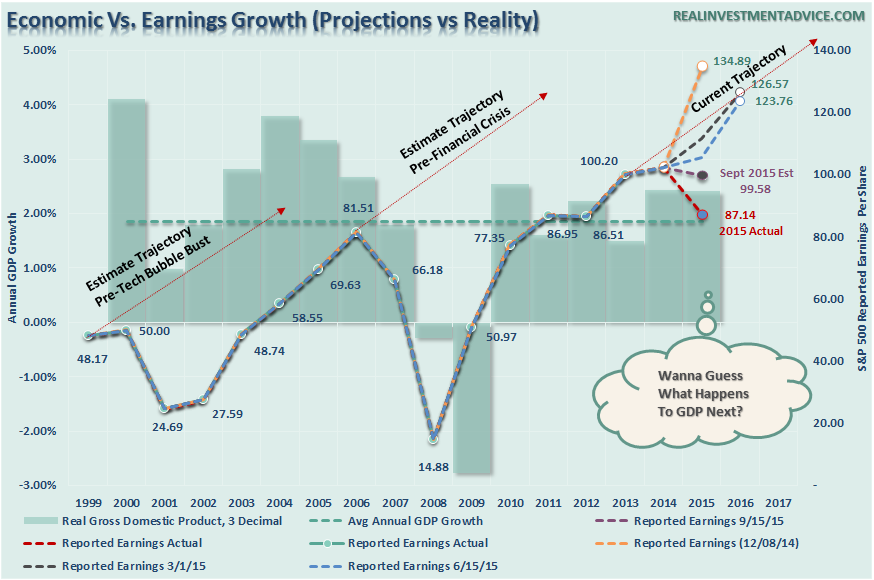
Yet this time the backstory is even sketchier. When reported S&P 500 earnings peaked at $84.92 per share June 2007 (LTM basis), they had grown at a 6.8% annualized rate since the prior peak of about $54/share in Q3 2000. By contrast, at the reported $86.46 level for Q4 2015, the implied 8-year growth rate is…….well, nothing at all unless you prefer two digit precision. In that case, the CAGR is 0.22%.
That’s right. Based on the kind of real corporate earnings that CEOs and CFOs must certify on penalty of jail time, profits are now barely above the June 2007 level, and are once again heading down the slippery slope traced twice already during this era of central bank bubble finance.
Yes, the sell side stock peddlers will tell you that notwithstanding the fact that Uncle Sam spends upwards of $1 billion per year pursuing accounting malefactors, these GAAP profits are to be ignored because they are chock-a-block with non-recurring items.
Well, yes they are. As an excellent recent Wall Street Journal investigation showed, the Wall Street version of ex-items earnings came in for 2015 at$1.040 trillion for the S&P 500. But that was 32% higher than actual GAAP earnings of $787 billion!
 Supposedly, the $253 billion difference indicated for 2015 in the chart above don’t amount to nothin’ when it comes to valuing stocks. After all, what do the principal non-recurring items——asset write-offs, plant shutdowns, store closing costs, goodwill reductions, restructuring charges and stock options costs——have to do with Wall Street’s authoritative EPS hockey sticks?
.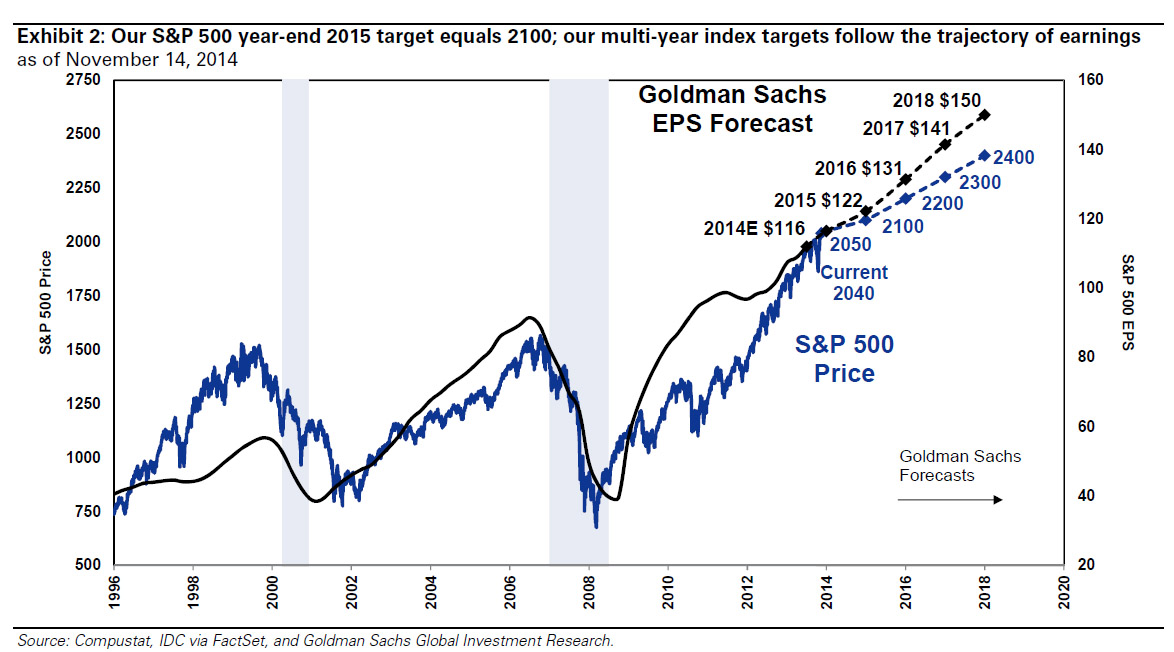
Not exactly. The above chart has been generated over and over and has been spectacularly wrong nearly as often, and most especially at turning points in the business cycle.
Indeed, the yawning $253 billion gap between reported earnings and the Wall Street ex-items concoction for 2015 is nearly the same magnitude as the disconnect in 2008-early 2009. And like back then, the massive one-timers consisted of real corporate cash and capital that was destroyed——more often than not owing to bad business decisions that had earlier resulted from central bank falsification of interest rates and the price of debt and equity securities.
For instance, during 2015 one part of the gap was accounted for by the fact that the energy sector of the S&P 500 reported actual losses of $45 billion collectively but on an ex-items basis claimed profits of $48 billion. Did that $93 billion difference amount to a financial nothing?
No it didn’t. Instead, it was comprised primarily of massive write-downs of the carrying value of oil and gas reserves. Yet it was the global credit boom enabled by central banks which first drove the price of oil above $100 per barrel and encouraged massive malinvestment in high cost and excessive reserves; and then the drastic suppression of interest rates which ignited a massive scramble for yield which encouraged upwards of $400 billion on the junk bond and junk loan market.
Those giant write-downs may be construed by Wall Street as non-recurring irrelevances, but in fact they amount to dead weight losses of real capital.
NFIB Slams Fed, Obama As Small Business Optimism Crashes To 2 Year Lows
The last 14 months have seen the biggest slump in small business confidence since the financial crisis. Despite being told about how great the recovery is by authorities, at 92.9, NFIB’s optimism index has collapsed to its lowest in 2 years with weakness across the board – from hiring plans to capex spending to real sales expectation. There are two ‘people’ to blame for this according to NFIB’s chief economist – The Fed (“dithering”) and Obama (“disinclined to act favorably to small business.”)
Not what The Fed wants…

The datas was ugly across the board, extending recent ugliness (despite equity market’s recent exuberance):

As NFIB Chief Economist William Dunkelberg explains,
Political uncertainty remains a major concern and the President does not seem inclined to act favorably on any small business owner’s major concerns.
Fed policy communications are very disconcerting, giving an impression that the economy is weak. Too much monthly dithering.
All of this generates uncertainty, the enemy of spending and hiring behavior that would move the economy forward at a faster pace.
Charts: Bloomberg


[…] MARCH 8/NO CHANGES IN INVENTORY AT GLD AND SLV/THE REPO POOL IN THE USA BOND MARKET BREAKS DOWN AS Y… […]
LikeLike