
Good evening Ladies and Gentlemen:
Here are the following closes for gold and silver today:
Gold: $1151.10 down $1.40 (comex closing time)
Silver: $15.49 up 8 cents (comex closing time)
In the access market 5:15 pm
Gold $1153.30
silver $15.57
Gold/silver trading: see kitco charts on right side of the commentary.
Following is a brief outline on gold and silver comex figures for today:
The gold comex today had a poor delivery day, registering 0 notices served for nil oz. Silver comex registered 3 notices for 15,000 oz .
Several months ago the comex had 303 tonnes of total gold. Today the total inventory rests at 253.33 tonnes for a loss of 49.5 tonnes over that period. Lately the removals have been rising!
In silver, the open interest rose by an astonishing 2,832 contracts even though yesterday’s silver price was down 27 cents. The total silver OI continues to remain relatively high with today’s reading at 171,957 contracts. The front month of March contracted by 44 contracts.
We had 1 notice served upon for 5,000 oz.
In gold we had an absolutely astonishing rise in OI with gold down by $9.40 yesterday.If you include access markets, gold has been down for 9 straight days. The total comex gold OI rests tonight at 417,636 for a gain of 6718 contracts. Today, surprisingly we again had only 0 notices served upon for nil oz.
Today, we had a large withdrawal of 2.09 tones of gold at the GLD/Inventory rests at 750.95 tonnes
In silver, /SLV we had no change in inventory at the SLV/Inventory, remaining at 327.332 million oz
We have a few important stories to bring to your attention today…
1. The Greece affair.
The war of words between Germany and Greece magnify today.
This afternoon, Yannis Varoufakis states that Greece will never repay its debts. Greece also is making overtures to Russia and both of these events angered Germany to no end.
Also today, Greece passed in its parliament the right to withdraw funds from Greek pensions.
(zero hedge)
2.The Euro overnight faltered to 1.049 to the dollar before recovering.. ECB finds it difficult to purchase bonds on their QE program due to huge number of bonds trading in negative yield and many investors do not want to part with their bonds.. (zero hedge)
3. China alarms the world when 4 cities have deflation in wages. China will no doubt have to engage in QE (zerohedge)
4. South Korea becomes the 24th nation to lower interest rates as the global economy falters badly. (zero hedge)
5. Macro data from the USA all bad today suggesting that Q1 GDP will come very close to the Atlanta report at 1.2%
6. The 9 trillion USA short position by various players is getting a lot of ink. Bill Holter takes one side of the battle. Raul Meijer, Ambrose Evans Pritchard and Econmatters take the other.
we have these and other stories for you tonight.
Let us now head over to the comex and assess trading over there today.
Here are today’s comex results:
The total gold comex open interest rose by a wide margin of 6,718 contracts today from 410,918 up to 417,636 even though gold was down by $9.40 yesterday (at the comex close). We are now in the contract month of March which saw it’s OI rise by 10 contracts up to 130. We had 0 notices filed on yesterday so we gained 10 gold contract or an additional 1000 oz will stand for delivery in this delivery month of March. The next big active delivery month is April and here the OI fell by 8,828 contracts down to 217,295. The estimated volume today (which is just comex sales during regular business hours of 8:20 until 1:30 pm est) was poor at 91,156. The confirmed volume yesterday ( which includes the volume during regular business hours + access market sales the previous day) was fair at 197,879 contracts with mucho help from the HFT boys. Today we had 0 notices filed for nil oz.
And now for the wild silver comex results. Silver OI rose by an extremely high 2,832 contracts from 169,125 up to 171,957 despite the fact that silver was down by 27 cents with respect to yesterday’s trading. We are now in the active contract month of March and here the OI fell by 44 contracts down to 840. We had 1 contract served upon yesterday. Thus we lost 43 contracts or an additional 215,000 oz will not stand in this March delivery month. The estimated volume today was poor at 17,737 contracts (just comex sales during regular business hours. The confirmed volume on yesterday (regular plus access market) came in at 45,149 contracts which is very good in volume. We had 3 notices filed for 5,000 oz today.
March initial standings
March 12.2015
| Gold |
Ounces |
| Withdrawals from Dealers Inventory in oz | nil |
| Withdrawals from Customer Inventory in oz | 32,246.45 /1003 kilobars (Scotia) |
| Deposits to the Dealer Inventory in oz | nil |
| Deposits to the Customer Inventory, in oz | nil |
| No of oz served (contracts) today | 0 contracts (nil oz) |
| No of oz to be served (notices) | 130 contracts (13,000 oz) |
| Total monthly oz gold served (contracts) so far this month | 5 contracts(500 oz) |
| Total accumulative withdrawals of gold from the Dealers inventory this month | 114,790.651 oz |
|
Total accumulative withdrawal of gold from the Customer inventory this month |
8,398.287.0 oz |
Today, we had 0 dealer transactions
total Dealer withdrawals: nil oz
we had 0 dealer deposit
total dealer deposit: nil oz
we had 2 customer withdrawals (and the farce continues)
i) Out of Scotia: 32,150.000 (1000 kilobars)
ii) Out of Manfra; 96.45 (3 kilobars)
total customer withdrawal: 32,246.45 oz (1003 kilobars)
we had 0 customer deposits:
total customer deposits; nil oz
We had 0 adjustments
Today, 0 notices was issued from JPMorgan dealer account and 0 notices were issued from their client or customer account. The total of all issuance by all participants equates to 0 contracts of which 0 notices were stopped (received) by JPMorgan dealer and 0 notices were stopped (received) by JPMorgan customer account.
To calculate the total number of gold ounces standing for the March contract month, we take the total number of notices filed so far for the month (5) x 100 oz or 500 oz , to which we add the difference between the open interest for the front month of March (130) and the number of notices served upon today (0) x 100 oz equals the number of ounces standing.
Thus the initial standings for gold for the March contract month:
No of notices served so far (5) x 100 oz or ounces + {OI for the front month (130) – the number of notices served upon today (0) x 100 oz} = 13,500 oz or .4199 tonnes
we gained 10oo additional gold ounces standing in this March contract month.
Total dealer inventory: 656,644.474 oz or 20.424 tonnes
Total gold inventory (dealer and customer) = 8.146 million oz. (253.33) tonnes)
Several weeks ago we had total gold inventory of 303 tonnes, so during this short time period 49.5 tonnes have been net transferred out. However I believe that the gold that enters the gold comex is not real. I cannot see continual additions of strictly kilobars.
end
And now for silver
March silver initial standings
March 12 2015:
| Silver |
Ounces |
| Withdrawals from Dealers Inventory | nil oz |
| Withdrawals from Customer Inventory | 260,495.79 oz (Brinks,Scotia) |
| Deposits to the Dealer Inventory | nil oz |
| Deposits to the Customer Inventory | nil oz |
| No of oz served (contracts) | 3 contracts (15,000 oz) |
| No of oz to be served (notices) | 837 contracts (4,185,000) |
| Total monthly oz silver served (contracts) | 1735 contracts (8,685,000 oz) |
| Total accumulative withdrawal of silver from the Dealers inventory this month | |
| Total accumulative withdrawal of silver from the Customer inventory this month | 2,233,478.9 oz |
Today, we had 0 deposit into the dealer account:
total dealer deposit: nil oz
we had 0 dealer withdrawal:
total dealer withdrawal: nil oz
We had 0 customer deposits:
total customer deposit: nil oz
We had two customer withdrawals:
i) Out of Brinks: 200,400.79 oz
ii) Out of Scotia: 60,095.000 oz ??? can someone explain this perfectly round withdrawal???
total withdrawals; 260,495.79 oz
we had 1 adjustment
i) out of Delaware: 5,210.766 oz was adjusted out of the customer and this landed into the dealer account of Delaware;
Total dealer inventory: 68.828 million oz
Total of all silver inventory (dealer and customer) 177.182 million oz
.
The total number of notices filed today is represented by 3 contracts for 15,000 oz. To calculate the number of silver ounces that will stand for delivery in March, we take the total number of notices filed for the month so far at (1735) x 5,000 oz = 8,675,000 oz to which we add the difference between the open interest for the front month of March (840) and the number of notices served upon today (3) x 5000 oz equals the number of ounces standing.
Thus the initial standings for silver for the March contract month:
1735 (notices served so far) + { OI for front month of March( 840) -number of notices served upon today (3} x 5000 oz = 12,860,000 oz standing for the March contract month.
we lost 43 contracts or an additional 215,000 oz will not stand for delivery in March.
for those wishing to see the rest of data today see:
http://www.harveyorgan.wordpress.com orhttp://www.harveyorganblog.com
end
The two ETF’s that I follow are the GLD and SLV. You must be very careful in trading these vehicles as these funds do not have any beneficial gold or silver behind them. They probably have only paper claims and when the dust settles, on a collapse, there will be countless class action lawsuits trying to recover your lost investment.
There is now evidence that the GLD and SLV are paper settling on the comex.
***I do not think that the GLD will head to zero as we still have some GLD shareholders who think that gold is the right vehicle to be in even though they do not understand the difference between paper gold and physical gold. I can visualize demand coming to the buyers side:
i) demand from paper gold shareholders
ii) demand from the bankers who then redeem for gold to send this gold onto China
vs no sellers of GLD paper.
And now the Gold inventory at the GLD:
March 12.we had a withdrawal of 2.09 tonnes of gold at the GLD/Inventory at 750.95 tonnes
March 11.2015: no changes in gold inventory at the GLD/Inventory at 753.04 tonnes
March 10 no report on the GLD tonight/computer down/inventory remains 753.04 tonnes
March 9/ we had another huge withdrawal of 3.38 tonnes of gold from the GLD, no doubt heading for Shanghai/Inventory 753.04 tonnes
March 6/we had a huge withdrawal of 4.48 tonnes of gold from the GLD/inventory rests tonight at 756.32/Also HSBC is getting out of the gold business in London and is giving up all of its 7 vaults.
March 5 no change in gold inventory at the GLD/760.80 tonnnes
March 4/ no change/inventory 760.80 tonnes
March 3 we had another 2.69 tonnes of gold withdrawn from the GLD. Inventory is now 760.80 tonnes.
March 2 we had 7.76 tonnes of withdrawal from the GLD today and this physical gold landed in Shanghai/Inventory 763.49 tonnes
March 12/2015 / the GLD tonight lost 2.09 tonnes of gold :
inventory: 750.95 tonnes.
The registered vaults at the GLD will eventually become a crime scene as real physical gold departs for eastern shores leaving behind paper obligations to the remaining shareholders. There is no doubt in my mind that GLD has nowhere near the gold that say they have and this will eventually lead to the default at the LBMA and then onto the comex in a heartbeat (same banks).
GLD : 750.95 tonnes.
end
And now for silver (SLV):
March 12: no changes in silver inventory/327.332 million oz
March 11/no changes in silver inventory/327.332 million oz
March 10/ no change in silver inventory/327.332 million oz
March 9/ no change in silver inventory at the SLV/327.332 million oz
March 6: huge addition of 1.34 million oz of silver into the SLV/Inventory 727.332 million oz
March 5 no change in inventory/725.992 million oz
March 4 a slight reduction of 126,000 oz of silver/SLV inventory at 725.992 (probably to pay for fees)
March 3 a small deposit of 328,000 oz of silver into the SLV/Inventory at 726.118 million oz.
March 2/ no change in silver inventory tonight; 725.734 million oz
Feb 27.2015 no change in silver inventory tonight: 725.734 million oz
Feb 26. no change in silver inventory at the SLV/Inventory at 725.734 million oz
Feb 25. no changes in silver inventory/SLV inventory at 725.734 million oz
March 12/2015 no change in silver inventory at the SLV/ SLV inventory rests tonight at 327.332 million oz
end
And now for our premiums to NAV for the funds I follow:
Note: Sprott silver fund now for the first time into the negative to NAV
Sprott and Central Fund of Canada.
(both of these funds have 100% physical metal behind them and unencumbered and I can vouch for that)
Not available tonight
1. Central Fund of Canada: traded at Negative 8.2% percent to NAV in usa funds and Negative 8.1% to NAV for Cdn funds!!!!!!!
Percentage of fund in gold 61.5%
Percentage of fund in silver:38.0%
cash .5%
( March 12/2015)
Sprott gold fund finally rising in NAV
2. Sprott silver fund (PSLV): Premium to NAV falls to + 1.98%!!!!! NAV (March 12/2015)
3. Sprott gold fund (PHYS): premium to NAV rises to -.15% to NAV(March 12 /2015)
Note: Sprott silver trust back into positive territory at +1.98%.
Sprott physical gold trust is back into negative territory at -.15%
Central fund of Canada’s is still in jail.
end
And now for your more important physical gold/silver stories:
Gold and silver trading early this morning
(courtesy Mark O’Byrne)
Deutsche & Santander Fail ‘Stress Tests’ – Risk of Bail-Ins
– Largest banks in Germany and Spain fail Federal Reserve’s ‘stress tests’
– Stress tests designed to assess whether lenders can withstand another financial crisis
– U.S. subsidiaries fail Fed stress tests on ‘‘widespread and critical deficiencies’’ in identifying risks
– Deutsche and Santander bank fail on “qualitative” grounds
– 28 out of 31 banks passed the stress test, with BoA required to resubmit plans
– Both Deutsche and Santander passed questionable ECB stress tests in October
– Developing bail-in regime poses risks to depositors
The Federal Reserve has issued a stinging rebuke to two of Europe’s largest banks – Deutsche Bank and Santander.
U.S. operations of Deutsche, Germany’s largest bank, and Santander, the biggest bank in Spain and a large player in the UK market, were found to have serious deficiencies in capital planning and risk management, according to a senior Federal Reserve official.

The systems by which European banks assess risk have been called into question following the failure of the U.S. subsidiaries of the two major European banks to meet criteria set out in the Federal Reserve’s stress tests.
The subsidiaries of both Deutsche Bank and Banco Santander failed the stress tests for “qualitative” reasons among which were their inability to accurately identify risk and to respond realistically to losses.
The annual Fed ‘stress tests’ aim to ensure banks are capable of functioning during periods of “financial stress”.
Of the 31 banks tested, 28 passed although the Wall Street Journal reports that some big banks “struggled”. Bank of America did not pass the test and has been asked to resubmit its plans.
It is unsettling that the two banks that failed the stress test are subsidiaries of European banks that comfortably passed the ECB’s stress test in October. As we pointed out at the time, the ECB test was of questionable value as it didn’t even model in a potential deflation scenario – despite early signs of and risks of deflation.
Within a few short months Europe was experiencing deflation, demonstrating a lack of competence and or foresight at the ECB. The health and viability of Europe’s banking sector would not appear to be as sound as the ECB has suggested to investors, depositors and the public.

Equally troubling, is the fact that Deutsche Bank, who have derivatives exposure of over a whopping €54 trillion – almost nine times the GDP of the entire Eurozone – has serious issues with risk management.
Warren Buffett’s “financial weapons of mass destruction” – how are you?
Should Deutsche Bank or any other similarly exposed European bank suffer substantial losses it could trigger a major derivatives and or solvency crisis – and contagion in the financial system. With sovereigns and central banks having already badly damaged their balance sheets – another Lehman style crisis may be one which no nation or multi-national institution could resolve.
The best case scenario would involve bail-outs and bail-ins. The worst case scenario would involve currency devaluations internationally and a consequent destruction of wealth.
An allocation to physical gold outside of the banking system will protect savers and investors in such a scenario.
Download Protecting Your Savings In The Coming Bail-In Era (11 pages)
Download From Bail-Outs To Bail-Ins: Risks and Ramifications – Includes 60 Safest Banks In World (51 pages)
MARKET UPDATE
Today’s AM fix was USD 1,161.25, EUR 1,094.90 and GBP 774.48 per ounce.
Yesterday’s AM fix was USD 1,158.75, EUR 1,096.06 and GBP 769.42 per ounce.
Gold fell 0.63%percent or $7.30 and closed at $1,154.00 an ounce yesterday, while silver slipped 0.45% or $0.18 to $15.50 an ounce.

In Singapore, bullion for immediate delivery rose initially prior to falling and was marginally lower at $1,160.05 an ounce.
In London, spot gold in late morning trading is $1,160.38 up 0.41 percent. Silver is $15.67, gaining 1 percent while platinum is $1,127.23, climbing 0.48 percent.
Gold rose above the key psychological level of $1,150 this morning after the U.S. dollar gave up some of the recent outsize gains against the euro. Gold’s gain could be attributed to speculators scrambling to cover shorts on the yellow metal and some seeing gold as good value at these levels.
Gold has racked up an 8 day losing streak in dollars and is now showing a loss in dollars of nearly 3 percent for 2015 but gains of 11% in euro terms – see table.

Yesterday’s stock market free fall erased 2015 gains for the S&P 500 and Dow industrials, meaning that stocks too are negative for the year.
The S&P 500 closed 1.7%, lower at 2,044.2, it is biggest one-day percentage decline in nine weeks. Selling on Wall Street was broad based, with all 10 main sectors finishing with losses.
The Dow Jones Industrial Average dropped 1.9%, to 17,662.9, it is worst point drop since Oct 9, 2014.
The Nasdaq Composite ended the day down 1.7%, at 4,859.8, on the 15th anniversary of its all-time high.
Sentiment towards gold is very negative after the recent gains and gold is due a bounce.
Interestingly, according to Amanda Cooper of Thomson Reuters posting in the Global Gold Forum:
“Until yesterday, gold had fallen for 8 days in a row, which is pretty steep going even for the gold market when it gets gloomy. The last time gold fell that many days in a row was March 2009.
A closer look at the chart reveals that gold has only ever fallen by that many days in a row three times since the gold standard was abolished in the 1970s. Since Reuters gold data began in 1968, gold has only fallen for 9 days once, back in August 1973.”
It takes a brave or foolish investor to buy after such falls and will always caution never to “catch a falling knife”. However, an attractive buying opportunity looks set to soon present itself and dollar cost averaging into position remains prudent.
end
The algo trading is asserting its influence on gold/silver trading
with respect to the shorting of yen/shorting gold and the purchasing o the Nikkei:
(courtesy Turd Ferguson/TF Metals)
TF Metals Report: Yen and gold selling trade seems to be on again
11:14p ICT Thursday, March 12, 2015
Dear Friend of GATA and Gold:
The high-frequency, algorithmic trade of selling yen and gold together seems to be back in place, the TF Metals Report’s Turd Ferguson writes this week, warning that more smashes are likely ahead for “paper gold.” His commentary is headlined “gird your loins” and it’s posted at the TF Metals Report here:
http://www.tfmetalsreport.com/blog/6680/gird-your-loins
CHRIS POWELL, Secretary/Treasurer
Gold Anti-Trust Action Committee Inc.
end
(courtesy John Hathaway, Doug Groh/the Gold Report)
The Simple Test Tocqueville’s John Hathaway & Doug Groh Use To Determine If Gold Is At A Bottom
March 12.2015:
In this interview with The Gold Report, Tocqueville Asset Management fund managers Doug Groh and John Hathaway say that though gold investors have been through a nuclear winter, the future looks bright as mining companies bask in the glow of lower costs, better exchange rates and a flurry of mergers and acquisitions.
The Gold Report: Since we last talked in August, have precious metals bullion and mining shares bottomed?
John Hathaway: It looks as if they are trying to make a stand. In early November, we got down to $1,140/ounce ($1,140/oz). Only time will tell for sure.
What we do know is that the industry can’t produce any more gold at these prices or lower prices, so that impacts the supply side of the picture. It certainly meets the test of being a contrarian investment. In our opinion, sentiment is pretty much rock bottom. It has gotten better with this rally, but in the bigger scheme of things, people still scoff at the idea of gold. That is one sign of a bottom.

TGR: What is the range you expect for gold in 2015?
JH: The 200-day moving average right now is $1,244/oz. If gold can break above that, I think it would gather strength and surprise people on the upside. Seeing as how so many people are betting the other direction, I think you’d have a lot of short covering. So $1,400/oz or $1,500/oz wouldn’t surprise me.
TGR: Are you as bullish on silver?
JH: The magic number on silver is $18/oz. The 200-day average on the iShares Silver Trust (SLV), an exchange-traded fund, is roughly $17.29/oz. If silver closes above $18/oz, that will be a strong signal that it has changed its colors. For both gold and silver, the moving average keeps coming down, so it gets easier to surpass it.
TGR: Gold has intermittently run up with the dollar in recent weeks rather than in opposition to it. Is that a new trend?
JH: No. The correlation between the U.S. Dollar Index (DXY), which is the comparative strength of the dollar compared to the euro and the yen, and the gold price is very low. It’s a meaningless relationship over time. From time to time, commentary will refer to one causing a movement in the other, but if we look at the relationship over a long period of time, it really hasn’t mattered.

And if we go back 20 years, the dollar has been weak relative to gold. Gold is up in dollar terms quite substantially.

TGR: You have commented that the Shanghai Gold Exchange may likely provide a challenge to the U.S. dollar as the world’s reserve currency over the next several years. What impact would that have on gold?
JH: The Shanghai Gold Exchange could replace the London Bullion Market Association, the London gold fix. Western market conventions such as the gold fix and the Comex will eventually play second fiddle to price discovery in a place like Shanghai, Singapore or Dubai. That’s where physical gold is being traded. That’s what I meant by that statement.
At the same time, it’s important to pay attention to how many more deals the Chinese are doing in renminbi, their currency. It could be some time before China’s currency replaces the dollar as the leading reserve currency, but it is already starting to crowd out the dollar’s unquestioned status, particularly for trade deals. Many people, particularly in the emerging markets, really don’t like the dollar, and that is encouraging competition for the top spot. It’s not going to happen overnight, but it’s something to watch.
God forbid the dollar ever loses its monopoly on reserve currency status. It would change the world. People would have less of an interest in owning U.S Treasury bonds, for one thing. It may mean that inflation numbers, which have benefitted from the strong dollar, could turn less favorable, which is what all the central banks are trying to do anyway.
TGR: What impact would that transition process have on gold?
JH: The impact on gold is due to a loss of trust in the dollar-reliant system. Jim Grant, publisher of the Interest Rate Observer, said it best: “The price of gold is the inverse of confidence in central banking.” If dollar strength continues relative to other currencies, for a while that’s not a bad thing because competition keeps prices low in U.S. dollars. But ultimately, it’s a destabilizing factor because it’s bad for emerging markets that have borrowed in U.S. dollars.
To the extent that the strong dollar actually becomes a headwind for economic growth in places like Brazil and India, it’s a negative for global growth and it becomes a problem. And it becomes a destabilizing factor for the global economy because it means that the U.S. economy will be challenged by imports and loss of market share because of cheaper European and Asian currencies. Let’s not forget that gold has already risen in every currency except the dollar in the last year and a half.
TGR: What impact will Greece renegotiating its debt or pulling out of the euro have on gold?
JH: What is going on in Europe is very unsettling to those with savings and capital in that part of the world. If Greece pulls out of the euro or if the Eurozone makes huge concessions to Greece, then it would become increasingly difficult to view the euro as a serious currency.
We all saw what happened in Switzerland. The Swiss bank balance sheet just ballooned beyond any sort of reasonable measure. Debt was five times Swiss gross domestic product (GDP), whereas the U.S.’ debt is only 25% of GDP. The Swiss couldn’t just keep printing francs like crazy. So despite promises to the contrary, the Swiss pulled the rug out from the feet of a lot of people who bet on that. It was an important lesson. You can’t take central bankers at their word. No matter what they say, currency manipulation is ultimately something that can’t be sustained. One by one, those tricks will fail, and then we’ll see the real economic consequences of our actions. When that happens, one thing you can own to protect you against massive currency devaluation is gold. It has been proven time and again.
TGR: Is this a good time to buy gold or should people wait and see if it goes even lower?
JH: It seems to be a good time. Gold is already strong in every currency other than the dollar. Negative interest rates in much of the world and the overly strong dollar should eventually result in political pressure to cheapen the dollar, but against what? The only monetary asset left standing will be gold.
TGR: What is the relationship between mining share valuations and commodity prices?
JH: In Australia, Canada and South Africa, countries with currencies that have been weak compared to the dollar, earnings are going through the roof. The industry is actually doing very well because it has lower costs based on currency and oil.
TGR: In the Tocqueville Gold Fund, what is the role of physical metals versus mining shares? It looks as if you’re at about 12% physical gold right now.
JH: We did buy more gold a couple of months ago. It was time to do so. We own maybe 20% more physical ounces than we did a year ago. We don’t expect it to perform as well as the mining shares on the upside, but it’s certainly an element of value in the portfolio. It differentiates us from most of our peers and it makes sense.
On the mining share equity side, Tocqueville invests in companies that add value even when the gold price is going sideways or down. These companies are either discovering more ounces in the ground or in the process of building a cash-producing mine, which is potentially very accretive to shareholders as long as it’s done in a way that doesn’t destroy the balance sheet. That may not translate into a higher share price when the gold price is going sideways or down. But they will be the leaders on the upside when people want to own gold stocks again. Everyone thinks about the industry as a monolith, which is incorrect. There are so many differences between companies and countries, and every situation is different. We own a very select group of companies.
One strategy that has really worked for us is that we’ve been heavily into the royalty stocks. That’s a great business model when the industry has a difficult time raising money. These companies provide capital and do a lot of deals with very favorable terms. Their pipelines are particularly robust now because most mining companies have a hard time advancing projects through the regular sources that the capital markets provide.
The royalty model is very efficient. Instead of holding 10 mines scattered all over the world, royalty companies participate in 70 or 80 mines with none of the management challenges. If a mine or a country has a problem, it’s less significant and moves the needle less than it does for a producer. That’s the notional difference between royalties and typical mining companies. Having said that, there are plenty of companies that are pure miners that we think are very good.
TGR: When we talked last, Doug, you pointed to the upside you enjoyed during a number of mergers. Are you anticipating more mergers and acquisitions (M&A)?
Doug Groh: The gold sector is really ripe for a plethora of M&A activity. In fact, we’ve already seen that this year. Certainly, it’s a market environment where miners are finding it very difficult to operate with limited capital. They can’t access the capital markets as effectively as they did some years ago so mergers become more attractive.
For the same reason, joint ventures will probably also be more common. The industry is recognizing that, in some cases, going it alone is not possible. I’m sure we’re going to see very dynamic transactions across the space as the year progresses.
TGR: How are investors being treated? Are they getting a premium for their patience?
DG: On the announcement date of the transaction, there’s typically a premium from the last traded equity price, anywhere from 20% to 35% or from the 20-day average weighted value approach. That has to come through if the shareholders are going to accept any type of transaction.
What is interesting is that management teams are more willing to have a discussion now than they were some years ago. Now, the market is coming closer together on valuations and there are likely to be more transactions.
TGR: What final insights can you give us on surviving the current market?
DG: I think in this environment, it’s important to recognize that companies have a challenge getting capital to build out their projects. So in assessing a company or its project, it’s very important to consider the capital requirements carefully. Does the company have access to capital or a means to build its projects? What does the balance sheet look like? Does it have cash? Does it have debt? Does it have the ability to raise funds?
Second, the grade and the quality of the asset are always important. But it’s not always just about grade. It can be about recoveries. It can be about the geology. It can be about the difficulty of actually mining. But the asset quality is certainly important.
Finally, I think investors should think about M&A activity and consider that some of these projects may not really have merit in this type of environment, but the company may have merit in its potential to become part of something larger.
TGR: John, what wisdom can you share with our reader/investors?
JH: We have done our research and we believe that over time, investing in gold and gold mining is an investment strategy that makes sense in a world of currency debasement. We’ve been through sort of a nuclear winter the last couple of years, but we outperformed our benchmarks by a wide margin. When the sector comes back in the U.S., contrarian investors will be sitting in a pretty good position competitively.
TGR: You’ve given us lots to think about. Thank you for your time.
********
John Hathaway, senior portfolio manager of Tocqueville Asset Management, manages all gold equity products and strategies at Tocqueville Asset Management. He holds a bachelor’s degree from Harvard University, a Master of Business Administration from the University of Virginia and is a Chartered Financial Analyst. He began his career in 1970 as an equity analyst with Spencer Trask & Co. In 1976, he joined investment advisory firm David J. Greene & Co., where he became a partner. In 1986, Hathaway founded Hudson Capital Advisors and in 1988, he became chief investment officer of Oak Hall Advisors.
Douglas B. Groh is a portfolio manager and senior research analyst at Tocqueville Asset Management and has 30 years of investment experience. Before joining Tocqueville in 2003, he was director of investment research at Grove Capital. While an analyst for JP Morgan and Merrill Lynch, he was recognized by Institutional Investor and The Wall Street Journal. He holds a Master of Art in energy and mineral resources from the University of Texas at Austin and a Bachelor of Science in geology/geophysics from the University of Wisconsin—Madison.
end
(courtesy Lawrence Williams/Mineweb)
Very positive on gold but silver the big favourite – Middelkoop
Speaking in London, Willem Middelkoop set out what he feels are the positive attributes for gold and silver going forward.

Speaking at the Global Mining Finance conference in London yesterday, Dutch precious metals fund manager, writer, analyst and former TV business pundit, Willem Middelkoop, painted a more positive picture for precious metals, following a perhaps downbeat presentation on the prospects for most metals – base, precious and ferrous, by Investec’s Jeremy Wrathall. Middelkoop, has always in any case tended to be strong on the bullish elements with regard to precious metals – and focuses his Commodity Discovery Fund accordingly. It is largely invested in gold stocks which are at the discovery and development stages. These are the times in a prospective miner’s life which tend to see value growth and consequently the fund has seen a number of stocks it is invested in having been acquisition targets for bigger miners, which has helped it do better than many other precious metals funds and indices in what has been a dismal market for precious metals stocks. While the fund is broad based in terms of the companies in which it invests, around 60% is in discovery stage gold development companies and 24% in silver stocks, with the balance in other metals and minerals and despite the poor performance of precious metals over the past three years the fund has continued to see investor growth.
While Middelkoop is very positive on gold for many of the same reasons as are gold bulls everywhere – 90% of world seeing zero interest rates, the largest bond bubble in history, massive global debt etc. – he does draw strongly on Chinese policy, and statements from various Chinese bankers and officials over the past few years to help make his case given China’s huge relevance to gold supply and demand. From these statements he gleans that China has a policy to build its reserves of gold, both directly through so-far under the radar purchases by the Central Bank (or perhaps by other government bodies under whose auspices it can store the gold without feeling it has to report it to the IMF) and also by persuading its citizens to buy the precious metals and thereby build up total Chinese gold volumes.
Talking to Mineweb after his presentation, Middelkoop predicted that China will likely make an announcement on an increase in its gold reserves some time this year at substantially more than the 1,054 tonnes it currently claims to hold – but even then no-one will really know if that is a true statement of its central bank holdings or not. He sees China, Russia and some other like-thinking nations targeting a de-Americanised world and we are already seeing considerable evidence of this in the beginnings of the internationalisation of the yuan as a trading currency and also in the setting up of alternatives to the SWIFT global financial interbank trading network.
Middelkoop also says he likes drawing on statements from former central bankers like Alan Greenspan who, he says can now tell the truth! Greenspan has made some remarkably positive statements on gold in recent months including that ‘gold is a good place to put money these days given its value as a currency outside of the policies conducted by governments’, noted Middelkoop.
But although he feels that gold has to be an excellent investment at current price levels and has to move sharply higher in the medium to long term, Middelkoop sees silver as probably being an even better investment in terms of growth potential in US dollar terms. New mined silver production, he avers, is substantially below demand, while over the years above ground stocks have been run down, and unlike gold there are no huge central bank holdings which can be drawn on to hold the price down.
The only real surface silver stocks nowadays are held in the silver ETFs and although these can be a little volatile, much of these remains in strong hands and he feels these overlying volumes will not counter what he sees, perhaps controversially, as the overall supply deficit now prevailing. With its comparatively strong industrial demand – a demand which is seen as growing along with the electronics and solar power sectors – supply/demand fundamentals are probably more relevant to silver than to gold where so much more depends on investment sentiment and perception. Middelkoop feels that these silver fundamentals will lead to a supply crunch sooner rather than later as, like gold, silver too is flowing East in massive quantities – and he said as an aside that he has taken bets that silver will be over $100 an ounce by 2020. Silver investors will be hoping he is correct.
Every day I feel so grateful for my life. In South Africa it’s hard not to be. We often lose sight though, of what’s really important. Reading this reminds me that there isn’t a need to feel pressured into creating a surrounding that is filled by material things, my life is a sheer privilege and I am so thankful for it. Thank you to those who share what they have been blessed with, for sharing their ‘wealth’ with others who have not been so lucky.
end
Bill Holter discusses the huge dollar short position. The huge rise in the dollar index has caused massive problems for our shorts. He explains that the rapid rise has no doubt caused some dead bodies to surface.
I would like you to contrast Bill’s commentary with that of Raul Meijer (near the bottom of my commentary)
a must read..
(courtesy Bill Holter)
Too many dollars and yet not enough …at the same time?
We have watched, even marveled at how the U.S. dollar has strengthened since last September. All sorts of theories have been put forth as to “why”. Some have proffered the dollar is the cleanest dirty shirt of the bunch. Others believe the interest rate differential is kicking in where dollars at least have a positive interest rate versus negative rates elsewhere. Another theory and one which I have written about in the past and believe to be the main reason for dollar strength is the “margin call” aspect. In other words, the “carry trade” which was used to leverage all sorts of trades is unwinding and dollars are needed to pay back the loans. A synthetic dollar short being covered in other words.
end
And now for the important paper stories for today:
Early Thursday morning trading from Europe/Asia
1. Stocks generally higher on major Chinese bourses/yen falls to 121.06
1b Chinese yuan vs USA dollar/yuan strengthens to 6.2612
2 Nikkei up 267.59 or 1.43%
3. Europe stocks mostly down/USA dollar index down to 98.99?Euro rises to 1.0623
3b Japane 10 year bond yield .40% (Japan buying 100% of bond issuance)/Japanese yen vs usa cross now at 121.06/
3c Nikkei still above 17,000
3d USA/Yen rate now above 121 barrier this morning
3e WTI 48.60 Brent 58.33
3f Gold up/Yen slightly up
3gJapan is to buy the equivalent of 108 billion uSA dollars worth of bond per month or $1.3 trillion. Japan’s GDP equals 5 trillion usa.
Japan to buy 100% of all new Japanese debt and by 2018 they will have 25% of all Japanese debt. Fifty percent of Japanese budget financed with debt.
3h Oil up for both WTI and Brent this morning.
3i European bond buying continues to push yields lower on all fronts in the EMU
Except Greece which sees its 2 year rate rise to almost 18%/Greek stocks down .67% today/expect continual bank runs on Greek banks.
3j Greek 10 year bond yield: 10.88% (up 18 basis points in yield)
3k Gold at 1160.00 dollars/silver $15.66
3l USA vs Russian rouble; (Russian rouble up 5/8 rouble/dollar in value) 60.60
3m oil into the 48 dollar handle for WTI and 58 handle for Brent
3n Higher foreign deposits out of China sees hugh risk of outflows and a currency depreciation. This scan spell financial disaster for the rest of the world/China may be forced to do QE!!
30 SNB (Swiss National Bank) still intervening again in the markets driving down the SF
3p Britain’s serious fraud squad investigating the Bank of England
3r the 7 year German bund is now in negative territory/no doubt the ECB will have trouble meeting its quota of purchases and thus European QE will be a total failure.
3s We now have our 24th nation lowering interest rates as we now have a global margin call on all USA borrowings. (see below)
4. USA 10 year treasury bond at 2.07% early this morning. Thirty year rate well below 3% at 2.66/yield curve flatten/foreshadowing recession.
5. Details Ransquawk, Bloomberg, Deutsche bank/Jim Reid.
FX Volatility Spikes As More Countries Enter Currency Wars; Euro Surges On Furious Squeeze After Touching 1.04
The global currency wars are getting ever more violent, following yesterday’s unexpected entry of Thailand andSouth Korea, whose central banks were #23 and #24 to ease monetary conditions in 2015, confirming the threat of a global USD margin call is clear and present (see “The Global Dollar Funding Shortage Is Back With A Vengeance And “This Time It’s Different“). But the one currency everyone continues to watch is the Euro, which the closer it gets to parity with the USD, the more volatile it becomes, and moments after touching a 1.04-handle coupled with the DXY rising above 100 for the first time in 12 years, the EURUSD saw a huge short squeeze which sent it nearly 150 pips higher to 1.0643, before the selling resumed.
Indeed, FX markets have been the main source of focus so far with once again the USD-index being the main source of price action. Overnight, the USD posted a fresh 12yr high after briefly breaking above the key 100.00 level, sending EUR/USD below 1.0500 for the first time since Jan’03. However, heading into the European open and a failed sustained break of 100.00 for the USD-index, the USD saw a bout of weakness which subsequently provided a lift to its major counterparts with EUR/USD and GBP/USD temporarily breaking back above 1.0600 and 1.5000 respectively, with RANsquawk sources noting Asian buyers in EUR/USD. One wonders if the BOJ is now also intervening on behalf of the ECB when things gets serious. However, this momentum for EUR/USD failed to sustain at the USD-index pared some of its initial losses, while GBP remained at its highs after the latest UK trade balance report showed a narrower deficit than expected. Elsewhere, NZD has held onto its gains after the RBNZ struck a less-dovish than expected tone, after leaving rates unchanged at 3.5%, as expected.
And since the ECB is all anyone can talk about these days, it is worth noting that the central bank bought €9.8 billion in eurozone bonds in the first according to Benoit Coeure. “We have already bought 9.8 billion euros in bonds in three days” Coeure said at a symposium in Paris. He said the ECB was on “precisely the right path” to attain its objective of buying 60 billion euros of eurozone government and corporate bonds a month. Coeure said the average maturity of the debt was close to nine years, which he called “very long” and which he said should “reinforce the economic effect of the intervention” by the central bank as the ECB’s injection of funds into the eurozone economy would last longer.
So if under €9 billion in ECB purchases brought the 10Y Bund to a record low 0.20%, one wonders where another €993 or so billion will take it?
Looking at the US today, everyone’s attention will be on retail sales which are expected to rebound after two disastrous months to 0.3% on the headline and 0.3% ex autos and gas.

Of course, if indeed the Commerce Dept does suggest a jump in retail sales, remember that it will be all in the seasonal adjustment. As BofA showed previously, February retail sales ex autos and gas were a disaster, and the worst since January 2014.

Looking at bond markets, the action is also once again entirely in Europe, where everything is naturally green (even Greece this time), with German 10Y under 0.20%, and Spain sliding under 1% for the first time ever.
In equity markets, Asian stocks rose after shrugging off a second consecutive negative Wall Street close as the greenback continued to protract further gains. Nikkei 225 (+1.4%) broke above 19,000 for the first time since 2000, with both the Hang Seng (+0.5%) and Shanghai Comp (+1.5%) trading higher, the latter lifted by financials.This was amid easing speculation following news of a proposed CNY 1trl debt swap between Chinese local governments and the MOF, which would be handled by direct bond purchases. Banks, the main group of creditors, will be able to treat the new bonds as lower-risk assets, reducing capital charges. JGBs rose following a well-received 5yr auction which drew the highest b/c since January, overlooking the strength in Japanese stocks.
European equities have seen a relatively directionless session so far after a mixed open with macro newsflow relatively. However, the FTSE 100 has seen a bout of outperformance following a rebound in commodity prices alongside the softer USD. Despite trading lower around the open, Bunds and USTs have pulled off their lows in recent trade with nothing new in the way of fundamental news, although ECB’s Coeure announced that since the start of the QE programme EUR 9.8bln of assets have been purchased with an average maturity of 9 years.
28 out of 31 banks unconditionally passed the second round of Fed stress tests regarding their plans to return capital to shareholders. However, Santander’s (SAN SM) and Deutsche Bank’s (DBK GY) US units both failed the stress tests while Bank of America’s (BAC) capital returns were only conditionally approved and the bank must resubmit its capital plan by 30th September. (BBG)
The USD-index has also provided a bulk of the price action in the commodity complex with both energy and metals prices higher while commodity-specific newsflow is relatively scarce so far. However, should precious metal prices move lower, a negative close for spot gold today would mark a 9th consecutive drop; the longest losing streak for the yellow metal in 17yrs. Overnight, Dalian iron ore futures rose by around 1.5% amid expectations of a pick-up in Chinese steel demand after China’s Steel Sentiment Index rebounded to above the 50.0 benchmark level.
In summary: European shares trade mixed with the basic resources and oil & gas sectors outperforming and autos, tech underperforming. Euro strengthens against dollar after earlier falling below $1.05 for first time since Jan. 2003. Bank of Korea unexpectedly cuts interest rate. China PBOC says likely to remove deposit rate ceiling this year. Spain’s Banco Sabadell in talks to acquire Britain’s TSB Group. The U.K. and Dutch markets are the best-performing larger bourses, Germany’s is the worst. The euro is stronger against the dollar. Spanish 10yr bond yields fall; Japanese yields decline. Commodities gain, with natural gas, corn underperforming and copper outperforming. U.S. jobless claims, continuing claims, Bloomberg consumer comfort, monthly budget statement, retail sales, import price index, business inventories, household change in net worth, due later.
Market Wrap
- S&P 500 futures up 0.4% to 2047.2
- Stoxx 600 up 0.3% to 396.7
- US 10Yr yield down 3bps to 2.08%
- German 10Yr yield down 1bps to 0.2%
- MSCI Asia Pacific up 1.1% to 143.7
- Gold spot up 0.3% to $1159.3/oz
- Eurostoxx 50 -0.1%, FTSE 100 +0.9%, CAC 40 -0.1%, DAX -0.1%, IBEX +0.2%, FTSEMIB +0.2%, SMI -0.1%
- Asian stocks rise with the Shanghai Composite outperforming and the Kospi underperforming.
- MSCI Asia Pacific up 1.1% to 143.7; Nikkei 225 up 1.4%, Hang Seng up 0.3%, Kospi down 0.5%, Shanghai Composite up 1.8%, ASX up 1%, Sensex up 0.8%
- Euro up 0.41% to $1.059
- Dollar Index down 0.45% to 99.35
- Italian 10Yr yield down 7bps to 1.06%
- Spanish 10Yr yield down 9bps to 1.07%
- French 10Yr yield down 3bps to 0.45%
- S&P GSCI Index up 0.9% to 409
- Brent Futures up 1.1% to $58.2/bbl, WTI Futures up 0.7% to $48.5/bbl
- LME 3m Copper up 1.7% to $5826/MT
- LME 3m Nickel up 1.5% to $13975/MT
- Wheat futures up 0.7% to 502.3 USd/bu
Bulletin Headline Summary from RanSquawk and Bloomberg
- European equities are relatively mixed, while the FTSE outperforms as the weaker USD-index has supported commodity prices
- 28 out of 31 banks unconditionally passed the second round of Fed stress tests regarding their plans to return capital to shareholders
- Looking ahead, today sees the release of US retail sales and weekly jobs data with potential comments from ECB’s Noyer, Coeure and BoE Governor Carney
- Treasuries gain, with long end extending rally seen after yesterday’s strong 10Y auction; 30Y bonds to be sold at today’s $13b reopening yield 2.650% in WI vs 2.56% award in February.
- ECB’s Benoit Coeure says ECB has bought EU9.8b over three days under QE program; average maturity is nine years
- Removal of a cap on what banks can pay depositors over the benchmark rate is “very close,” PBOC Governor Zhou Xiaochuan said Thursday; central bank also guided some lenders to lower deposit rates on concern they had been increasing them too quickly, people with knowledge of matter said
- China aggregate financing was 1.35t yuan ($215.5b) in Feb., according to the PBOC, above economists’ median estimate of 1t; new loans totaled 1.02t yuan, M2 money supply rose 12.5%
- South Korea’s central bank cut its key interest rate to an all-time low to counter slowing inflation and a weak economic recovery, joining a global wave of monetary easing
- New Zealand’s central bank refrained from saying it expects “further significant depreciation” in the currency and left borrowing costs at the highest in the developed world
- Two officers were seriously injured in a shooting outside a police station in Ferguson, Missouri, during protests after the resignation of the city’s police chief
- Sovereign 10Y yields lower. Asian stocks gain, European stocks mostly lower, U.S. equity-index futures mixed. Crude, gold and copper higher
DB’s Jim Reid rounds out the overnight event recap
What an incredible financial world we live in. After only 3 days of an 18-month program, the ECB continue to shred through yields at an incredible rate in Europe leaving them at astonishingly low levels relative to anything seen through centuries of financial market data. Many people now think European yields can go even lower but many of these same people thought they’d go higher 6 or 12 months ago so one would caution against placing high convictions on anyone’s forecasts for yields at the moment (including ours). However we do feel more comfortable that credit and peripherals continue to tighten than we do on say the direction of Bunds.
Fascinatingly after only 3 days of QE there is already chatter about whether the ECB might have to end their program early given the distortions and problems they’re creating. However that would leave a huge credibility issue and one has to assume that the situation would need to get significantly more crazy before they changed tact. Overall one has to say there is no precedent for anything close to the current situation in history and that everyone is making it up as they go along, central banks, investors and us strategists. We don’t mean that in a disparaging way but it just reflects the reality of the situation. I would love to hear from people if they think they have a high conviction view on Bunds over say 3-6 months.
Yesterday was clearly another day where European QE trades continued to perform as EURUSD dropped another 1.4% and 10yr bund yields dipped briefly below 0.2% before closing 3bps down at 0.2%. It was also a big day for European peripherals with 10yr yields in Italy, Spain and Portugal all down 9bps and 30yrs down 16-17bps.
European equities jumped back after falling on Tuesday with the Stoxx 600 up +1.5% led by a +2.2% return on the FTSE MIB, a +2.4% return on the CAC and an +2.7% return on the DAX. European credit also had a strong day, with iTraxx Main and Xover 1bp and 7bps tighter respectively. Trading in the US was more subdued with the S&P dipping -0.2% and CDX IG and HY marginally wider.
In terms of newsflow the day began with disappointing retail sales, IP and investment data out of China. In his comment on the releases our Chief China economist Zhiwei Zhang later wrote how these reads show a noticeable slowdown in economic activity, reflecting that fiscal slide has set in. The team reiterated their H1 GDP forecast of 6.8% YoY (vs 7.2% consensus) and their view that risks are growing of a mini hard landing this year as the policy stance remains tight despite weak growth.
It was a relatively quiet day for data elsewhere with the main news probably being the start of the latest round of talks between Greece and its creditors. As they kicked off we had news out of Greece that the country’s Justice Minister suggested that German property could be confiscated to pay for war reparations (Der Spiegel) with Greek PM Tsipras yesterday saying that the country was owed reparation money by the Germans (CNBC).
Although a light day for data, Friday’s strong payroll still resonates and given the feeling at the moment that the Fed is building momentum towards a midyear rate hike, it’s interesting to see one Fed metric which isn’t quite on message. The Atlanta Fed’s “GDPNow” forecast, which attempts to provide a “nowcast” for GDP prior to its release has dropped materially for Q1 since mid- February from around 2.3% to 1.2% in the latest update last week. The biggest factors underlying this development has been the deterioration in the current ‘nowcast’ for residential investment’s positive contribution to growth and an increase in the negative contributions to growth being made by nonresidential structures investments and net exports. The worsening in the two investment reads seems related to some disappointing construction reads we’ve had so far this quarter out of the US (possibly weather related) as well and the worsening of net exports looks to be tied into the appreciation of the $ and a port shutdown on the west coast earlier in the quarter. Whilst these kind of nowcasts are prone to big revisions and are future data dependant, the low current level and its deterioration over the past month certainly points towards a risk of possible disappointment in the Q1 GDP growth release. Even if it is mostly weather related will the Fed have enough info to confidently decide the climate is suitable for a mid-year hike?
On the effects of US dollar appreciation on net exports and investment it was interesting to see in what was a broadly positive set of results from Duke University’s US CFO survey that there were growing concerns from respondents on dollar appreciation. Around two thirds of firms with at least 25% of their total sales overseas noted a negative effect from the dollar’s strength and around one fourth of these firms said they planned to reduce capital spending plans as a result.
After another day of impressive dollar strength, with the currency up materially and up another 1.4% against the euro alone and with EURUSD experiencing the biggest annual bear run since the formation of the single currency (down around 24% YoY, see Figure 1 in PDF) the question has to be not whether current FX moves will slow the US down but rather by how much.
end
Deflation is getting a strong foothold in 4 major Chinese cities. Ladies and Gentlemen: expect QE to enter China very shortly:
The Final Nail In China’s Deflationary Coffin: Wages In The 4 Largest Cities Are Now Dropping
Remember when during the inflation panic of 2011 we reportted that “Wage Inflation is Rampant In China As More Provinces Plan Minimum Salary Hikes.” and wrote:
By the end of 2010, 30 provincial-level regions had raised the standard for the minimum wage, with an average increase of 22.8 percent year-on-year., Yin Chengji, spokesman for the Ministry of Human Resources and Social Security (MHRSS), said Tuesday. According to him, 29 provinces have issued the guideline for the minimum wages, and the benchmark line grew about 2 percent. In Shanghai, the local minimum wage was the highest nationwide, totaling 1,120 yuan ($170.2) per month.”
And 2011 will be even worse: “Also, according to a China Business News (CBN) report Tuesday, in 2011, many areas would continue to raise the standard. A Xinhua News Agency report Wednesday revealed that northern Chinese city of Tianjin is considering raising the minimum working wage by 16 percent this year amid rising inflationary pressure and labor shortages.”
Well, kiss all that goodbye. From Shanghai Daily:
Shanghai remained the top Chinese city for average monthly salary, but major cities saw their salary decline, recruitment portal Zhaopin.com said in a survey.
Shanghai’s average monthly salary was 7,108 yuan (US$1,135) while Beijing was second with 6,585 yuan and Shenzhen with 6,285 yuan came in third, the survey covering job postings on the website after the Spring Festival found. But Zhaopin.com didn’t reveal the sample size of the survey yesterday, citing business reasons.
But the average salary in Shanghai fell from last year’s 7,214 yuan in line with the 6 percent decline from a year ago to 6,518 yuan in the four largest Chinese cities, the survey showed.
Next stop: full blown deflationary prolapse and a PBOC that must scramble to do anything and everything (such as this) to halt the plunge.
end
The Greek saga: 3 stories tonight
I feel sorry for Greek pensioners:
(courtesy zero hedge)
Greece Passes Law To Plunder Pension Funds
Having previously hinted that they might ‘dip’ into public pensions funds for some short-term cash to payback The IMF, and then confirming that the plan is to repo that cash from pension cash reserves (raising concerns about how they will unwind the repo – i.e. pay it back); the Greek government finally signed the bill today that enables them to plunder the Greek people’s pension funds (for their own good).The massive irony of this bill is the bill enables greek deposits to be fully invested in Greek sovereign bonds… which Tsipras and Varoufakis both admitted today is “unsustainable” and “will never be repaid.”
- *GREEK GOVT SUBMITS BILL, ALLOWING USE OF PENSION FUND RESERVES
As Bloomberg reports,
Cash reserves of pension funds and other public entities kept in Bank of Greece deposit accounts can be fully invested in Greek sovereign notes, according to amendment to be submitted in parliament, country’s finance ministry says in e-mailed statement.
Cash reserves can be used for repos, reverse repos, buy and sell-back, sell and buy-back transactions
Pension funds, public entities will be able to claim damages from Greek state in case of overdue repayment, partial repayment
Pension funds are not obliged to transfer their reserves to the Bank of Greece, according to finance ministry statement
* * *
We wonder how the increasingly disenfranchised Greeks will react when they find their savings (whatever there is left) are now being directly plundered to fund the nation’s transfer payments (via The IMF) to Ukraine.
* * *
* * *
Greece remains second only to Ukraine for default risk….

Are Alarm Bells Ringing Over Greece’s Pivot To Russia?
With German media asking “who is more dangerous for us? Greece or Russia,” recent actions by both ‘antagonists’ in that question suggest they may become one and the same sooner than many expected. With tensions rising between Greece and the Eurogroup, recent and future visits to Russia have gained in importance since Russian FinMin confirmed that Moscow “could consider financial help to Greece.” While this Russian pivot meme was the stuff of conspiracy theorists just weeks ago, The BBC is now asking directly, “could Europe lose Greece to Russia?” and with more Greeks positive on Russia (61%) than Europe (23%), it should not shock anyone.
Deepening ties between Greece’s new government and Russia have set off alarm bells across Europe,as the leaders in Athens wrangle with international creditors over reforms needed to avoid bankruptcy. WhileGreece may be eyeing Moscow as a bargaining chip, some fear it is inexorably moving away from the West, towards a more benevolent ally, a potential investor and a creditor. As The BBC asks, Europe is not pleased. Should it also be worried?
A drove of Greek cabinet members will be heading to Moscow.
Prime Minister Alexis Tsipras will be hosted by Russian President Vladimir Putin in May, accompanied by coalition partner Panos Kammenos, defence minister and leader of the populist right-wing Independent Greeks party.
The timing has not escaped analysts.
Greece’s bailout extension expires at the end of June and the worst kept secret in Brussels is that Athens will need new loans to stay afloat.
Officially, Greece is not searching for alternative sources of funding.
But a loan from Russia, or perhaps China, could seem a more favourable alternative – or at least supplement – to any new eurozone bailout with all its unpopular measures and reforms attached.
Greece could look forward to cheaper gas for struggling households, increased Russian investment and tourism to provide a much needed economic boost.
Moscow, in return, would be rewarded with a friendly ally with veto power inside the EU at a time of heightened tensions over the Ukraine crisis.
…
“My feeling is that the Greek government is playing the ‘Russian card’ in order to improve its bargaining position in the current negotiations,” says Manos Karagiannis, a Greece-born specialist on Russian foreign policy at King’s College, London.
“But it will be very difficult for Athens to distance itself from the EU and Nato.”
…
For Prof Karagiannis, what matters is that Greece is fully integrated into the West, buthe warns against underestimating the risks of a Greek exit from the euro.
“A Grexit could certainly fuel anti-EU sentiments among the Greek population. And an isolated and weak Greece could jeopardise the stability of the entire region,” he says.
A weakened country, cast out of the eurozone and possibly the EU, would then be far more open to closer ties with Russia.
* * *
Isolated indeed…
h/t @KeepTalkingGreece
end
Then this humdinger!!!
This kills Greece’s chance for more money!!
(courtesy zero hedge)
Germans Furious After Varoufakis/Tsipras Admit “Greece Will Never Repay Its Debts”
The Greco-Germanic war of words continues… Having pissed off The Greeks with his “Troika” remarks, Germany’s Schaeuble went on today to more ad hominum attacks by reportedly calling the Greek FinMin “foolishly naive.” The Greek ambassador has ‘officially’ complained to “friend and ally” Germany about the personal insult. But The Greeks had the last laugh, as first Varoufakis and then Tsipras explained respectively that “Greece would never pay back its debts,” and “Greece cannot pretend its debt burden is sustainable.” The German response, via tabloid Bild,“there must be an end to this madness. Europe must not be made to look stupid.”

As Bloomberg reports, Germany and Greece confirmed Thursday that the Greek ambassador in Berlin made an official protest late Tuesday to the German Foreign Ministry over comments made by Schaeuble.
Schaeuble and his Greek counterpart Yanis Varoufakis have traded barbs in recent weeks, with Schaeuble on Tuesday suggesting that Varoufakis needed to look more closely at an agreement that Greece signed in February: “He just has to read it. I’m willing to lend him my copy if need be.”
“It was a complaint after what he (Schaeuble) said about Mr. Varoufakis. As a minister of a country that is our friend and our ally, he cannot personally insult a colleague.”
Koutras did not specify what the insult was, but Greek media had reported that Schaeuble had said that Varoufakis was “foolishly naive.”
Schaeuble said Thursday that any suggestion he insulted Varoufakis at the meeting is “absurd.”
* * *
And then, as Reuters reports, Greek Finance Minister Yanis Varoufakis has described his country as the most bankrupt in the world and said European leaders knew all along that Athens would never repay its debts, in blunt comments that sparked a backlash in the German media on Tuesday.
A documentary about the Greek debt crisis on German public broadcaster ARD was aired on the same day euro zone finance ministers met in Brussels to discuss whether to provide Athens with further funding in exchange for delivering reforms.
“Clever people in Brussels, in Frankfurt and inBerlin knew back in May 2010 that Greece would never pay back its debts.But they acted as if Greece wasn’t bankrupt, as if it just didn’t have enough liquid funds,” Varoufakis told the documentary.
“In this position, to give the most bankrupt of any state the biggest credit in history, like third class corrupt bankers, was a crime against humanity,” said Varoufakis, according to a German translation of his comments.
Followed today by comments from Syriza leader Tsipras…
- *TSIPRAS: GREECE CAN’T PRETEND ITS DEBT BURDEN IS SUSTAINABLE
- *TSIPRAS: IT’S VITAL FOR GREECE’S PUBLIC DEBT TO BE RESTRUCTURED
Wait What!!
The Germans are not happy… the remarks caused a stir in Germany where voters and politicians are increasingly reluctant to lend Greece money.
Bild daily splashed the comments on the front page and ran an editorial comment urging European leaders to stop providing Greece with ever more financial support.
“The Greek government is behaving as if everyone must dance to its tune. But there must be an end to this madness. Europe must not be made to look stupid,”wrote a commentator.
* * *
European ‘Union’ indeed.
end
What a riot: SWIFT does not remove Russia as demanded by the USA. Instead, they actually give them a seat on their board:
(courtesy Simon Black/Sovereign Man Blog)
The West’s Plan To Drop Russia From SWIFT Hilariously Backfires
Submitted by Simon Black via Sovereign Man blog,
If Vladimir Putin is remotely capable of laughter (the jury is out on that one…) then he’s probably doing so right now.
Russia is once again Arch-Enemy of the United States. It’s like living through a really bad James Bond movie, complete with cartoonish villains.
And for the last several months, the US government has been doing everything it can to torpedo the Russian economy, as well as Vladimir Putin’s standing within his own country.
The economic nuclear option is to kick Russia out of the international banking system. And the US government has been vociferously pushing for this.
Specifically, the US government wants to kick Russia out of SWIFT, short for the Society of Worldwide Interbank Financial Telecommunications.
That’s a mouthful. But SWIFT is an important component in the global banking system because it lays the foundation for banks to communicate and transfer funds with one another.
It’s a network protocol of sorts. Whenever a bank in Pakistan does business with a bank in Portugal, the funds will clear through the SWIFT network.
According to the SWIFT itself, they link over 9,000 financial institutions worldwide in over 200 countries, which transact 15 million times per day.
Bottom line, being part of SWIFT is critical to conducting business with the rest of the world. And if Russia gets kicked out of SWIFT, it would be a disaster.
Now, SWIFT is technically organized as a ‘Cooperative Society’ and governed by a board of directors.
There are 25 available board seats, and each seat is allocated for a three-year term to a specific country.
The United States, Belgium, France, Germany, UK, and Switzerland each hold two seats. A handful of other countries hold just one seat. And of course, most countries don’t hold any seats at all.
Here’s what’s utterly hilarious—
On Monday afternoon, not only did SWIFT NOT kick Russia out… but they announced that they were actually giving a BOARD SEAT to Russia.
This is basically the exact opposite of what the US government was pushing for.
Awkward…
But this story is even bigger than that.
Because at the same time that the US government isn’t getting its way with SWIFT, the Chinese are busy putting together their own version of it called CIPS.
CIPS stands for the China International Payment System; it’s intended to be a direct competitor to SWIFT, and a brand new way for global banks to communicate and transact with one another in a way that does NOT depend on the United States.
We’ll talk about CIPS in more details in a future letter. But in brief, it addresses some serious weaknesses, inefficiencies, and technological challenges of SWIFT.
And it should be ready to go later this year.
Make no mistake, this is the beginning of the end of the US dollar’s global hegemony. It’s time to stop hoping that it won’t happen and time to start preparing for it.
end
Make that 24 nations that are cutting interest rates:
(courtesy zero hedge)
Bank Of Korea Unexpectedly Cuts Interest Rate To Record Low 1.75%, 24th Central Bank To Ease In 2015
The currency war salvos just keep on coming. Moments ago the BOK unexpectedly (the move was predicted by just 2 of 17 economists polled by Bloomberg) cut its policy rate from 2.00% to a record low 1.75%, in what is clearly a full-blown retaliation against the collapse currency of its biggest export competitor, Japan, whose currency has cratered to a level that many in South Korea believe has become a direct subsidy for its competing exports. As such the only question is why the BOK didn’t cut earlier.
The Korean Won reacted appropriately, if only in the first millisecond: then it seems the algos forgot what easing is, and the BOK may need to cut again shortly.

And following the surprise rate cut by Thailand earlier today, the “surprise” South Korean rate cut means there are now 24 easing policy actions by central banks in 2015 alone.
Here is the full list of the 24 central bank rate cuts so far in 2015:
1. Jan. 1 UZBEKISTAN
Uzbekistan’s central bank cuts its refinancing rate to 9 percent from 10 percent.
2. Jan. 7/Feb. 4 ROMANIA
Romania’s central bank cuts its key interest rate by a total of 50 basis points, taking it to a new record low of 2.25 percent. Most analysts polled by Reuters had expected the latest cut.
3. Jan. 15 SWITZERLAND
The Swiss National Bank stuns markets by scrapping the franc’s three-year-old exchange rate cap to the euro, leading to an unprecedented surge in the currency. This de facto tightening, however, is in part offset by a cut in the interest rate on certain sight deposit account balances by 0.5 percentage points to -0.75 percent.
4. Jan. 15 EGYPT
Egypt’s central bank makes a surprise 50 basis point cut in its main interest rates, reducing the overnight deposit and lending rates to 8.75 and 9.75 percent, respectively.
5. Jan. 16 PERU
Peru’s central bank surprises the market with a cut in its benchmark interest rate to 3.25 percent from 3.5 percent after the country posts its worst monthly economic expansion since 2009.
6. Jan. 20 TURKEY
Turkey’s central bank lowers its main interest rate, but draws heavy criticism from government ministers who say the 50 basis point cut, five months before a parliamentary election, is not enough to support growth.
7. Jan. 21 CANADA
The Bank of Canada shocks markets by cutting interest rates to 0.75 percent from 1 percent, where it had been since September 2010, ending the longest period of unchanged rates in Canada since 1950.
8. Jan. 22 EUROPEAN CENTRAL BANK
The ECB launches a government bond-buying programme which will pump over a trillion euros into a sagging economy starting in March and running through to September next year, and perhaps beyond.
9. Jan. 24 PAKISTAN
Pakistan’s central bank cuts its key discount rate to 8.5 percent from 9.5 percent, citing lower inflationary pressure due to falling global oil prices. Central Bank Governor Ashraf Wathra says the new rate will be in place for two months, until the next central bank meeting to discuss further policy.
10. Jan. 28 SINGAPORE
The Monetary Authority of Singapore unexpectedly eases policy, saying in an unscheduled policy statement that it will reduce the slope of its policy band for the Singapore dollar because the inflation outlook has “shifted significantly” since its last review in October 2014.
11. Jan. 28 ALBANIA
Albania’s central bank cuts its benchmark interest rate to a record low 2 percent. This follows three rate cuts last year, the most recent in November.
12. Jan. 30 RUSSIA
Russia’s central bank unexpectedly cuts its one-week minimum auction repo rate by two percentage points to 15 percent, a little over a month after raising it by 6.5 points to 17 percent, as fears of recession mount following the fall in global oil prices and Western sanctions over the Ukraine crisis.
13. Feb. 3 AUSTRALIA
The Reserve Bank of Australia cuts its cash rate to an all-time low of 2.25 percent, seeking to spur a sluggish economy while keeping downward pressure on the local dollar.
14. Feb. 4/28 CHINA
China’s central bank makes a system-wide cut to bank reserve requirements — its first in more than two years — to unleash a flood of liquidity to fight off economic slowdown and looming deflation. On Feb. 28, the People’s Bank of China cut its interest rate by 25 bps, when it lowered its one-year lending rate to 5.35% from 5.6% and its one-year deposit rate to 2.5% from 2.75%. It also said it would raise the maximum interest rate on bank deposits to 130% of the benchmark rate from 120%.
15. Jan. 19/22/29/Feb. 5 DENMARK
The Danish central bank cuts interest rates a remarkable four times in less than three weeks, and intervenes regularly in the currency market to keep the crown within the narrow range of its peg to the euro.
16. Feb. 13 SWEDEN
Sweden’s central bank cut its key repo rate to -0.1 percent from zero where it had been since October, and said it would buy 10 billion Swedish crowns worth of bonds
17. February 17, INDONESIA
Indonesia’s central bank unexpectedly cut its main interest rate for the first time in three years
18. February 18, BOTSWANA
The Bank of Botswana reduced its benchmark interest rate for the first time in more than a year to help support the economy as inflation pressures ease.
The rate was cut by 1 percentage point to 6.5 percent, the first adjustment since Oct. 2013, the central bank said in an e-mailed statement on Wednesday.
19. February 23, ISRAEL
The Bank of Israel reduced its interest rate by 0.15 percentage points, to 0.10 percent in order to stimulate a return of the inflation rate to within the price stability target of 1–3 percent a year over the next twelve months, and to support growth while maintaining financial stability.
20. March 1, CHINA
China’s Central Bank lowered by a quarter percentage point both the benchmark one-year loan rate, to 5.35%, and the one-year deposit rate, to 2.5%. “Deflationary risk and the property market slowdown are two main reasons for the rate cut this time.”
21. Jan. 15, March 3, INDIA
The Reserve Bank of India surprises markets with a 25 basis point cut in rates to 7.75 percent and signals it could lower them further, amid signs of cooling inflation and growth struggling to recover from its weakest levels since the 1980s. Then on March 3, it followed through on its promise and indeed cut rates one more time, this time to 7.50%
22. March 4, POLAND
The Monetary Policy Council lowered its benchmark seven-day reference rate by 50 basis points to 1.5 percent, matching the prediction of 11 of 36 economists in a Bloomberg survey. Twenty-three analysts forecast a 25 basis-point reduction, while two predicted no change.
23. March 11, THAILAND
The Southeast Asian country — a onetime export powerhouse that’s seen its manufacturing mojo dim somewhat in recent years amid historic flooding and political infighting — lowered its main rate to 1.75 percent.
24. March 11, SOUTH KOREA
In a surprise move, the Bank of Korea cut its policy rate from 2.00% to a record low 1.75%.
end
You thought that a P/E of 18.8 on the Dow/Nasdaq was bad enough.
Europe is now over 20 x Price/Earnings:
(courtesy Edwards/zero hedge)
Albert Edwards’ “WOW!” Chart, Or Why “Draghi Makes Greenspan Look Like A Rank Amateur”
Back in January, when European stocks were only starting their unprecedented QE ramp, we presented the “Driver Behind The European Stock Surge” in which we showed that ever since Mario Draghi’s “whatever it takes” speech in July 2012, European equity prices were up 50% (even higher now) even as corporate earnings had actually declined by 7%.

It is a take on the chart above that has sent Albert Edwards over the edge once again, and in his latest letter he presents another way of visualizing the data above, with the help of what he dubs the “WOW!” chart.
Edwards begins with the standard, and well-deserved, rant against central bankers who now merely need – and create – ever greater bubbles in hopes of preserving a system, which can no longer function away from a “bubble” state.
We have long fulminated against strategists who are unwilling to predict sharp market moves. The violent downmove in the euro over the last few weeks is a case in point.Mario Draghi and the ECB’s manipulation of asset prices makes Greenspan’s Fed look like a rank amateur. More shocking though than the plunge in the euro, and more shocking even that 25% of sovereign eurozone bonds now trade in negative territory, is what has happened to eurozone equity valuations. For, as we approach the sixth anniversary of the US cyclical bull market (a post-war record), the PE expansion of eurozone equities is simply off the scale. History suggests this will end very badly indeed. Ask Alan!
What is he talking about? Presenting Albert Edwards’“WOW!” chart:

Edwards’ explanation:
This extraordinary multiple expansion is most shockingly illustrated by the chart [above] showing eurozone trailing PEs expanding to the moon (on trailing PE, the eurozone now stands at 20x vs 18.5x in the US). The chart below shows developments for only the past couple of years – this time using the 12m forward PE. The interesting point here is how, despite a profit explosion in Japan, the Japanese forward PE is unchanged at around 14x whereas US and eurozone forward PEs have both surged.
While we agree with everything Edwards is saying, we don’t agree with his assessment that Japan’s epic clobbering of its currency is helping its corporations. Sure, there are benefits, mostly in the area of exports and a brief spike in profitability, which Edwards notes in detail…
The surge in Japanese company profits on the back of the yen?s devaluation since early 2013 is truly extraordinary, but this has not (yet?) fed through to a booming Japanese economy. Like QE, the liquidity surplus has just been to a large extent hoarded despite appeals from government ministers to increase nominal wages at a faster pace. I was chatting about this with our FX strategist Kit Juckes. He raised the notion that dollar strength is net deflationary in developed economies since the mega-devaluation in Japan (and now in the eurozone) seem to have benefited margins and profits rather than boosting export and GDP growth to any great degree.
… but that is not the full story. Indeed, as the Bank of Korea showed last night, Japan’s currency “protectionism” is starting to finally anger its immediate east-Asian neighbors, resulting in a surprise rate cut by the BOK to a record low 1.75%. Furthermore, many have suggested that none other than China, that mercantilist par extraordinaire, is about to engage its exporting neighbors, leading to the first full-blown Pacific Rim currency war. The only question is when.
Leaving retaliatory timing against the Bank of Japan aside for the time being, something more troubling is starting to emerge in Japan: the very companies who are supposedly benefiting from the collapsing Yen… are about to mutiny against precisely that! From Reuters:
Japanese firms’ mood worsens as yen slump rattles, dims outlool.
Govt survey suggests weak yen starting to harm confidence
Confidence at big Japanese manufacturers worsened in January-March and is seen turning negative in the second quarter as a slumping yen ramped up the costs of raw material imports, a survey showed, complicating Tokyo’s stimulus-driven campaign to revive the economy.
The quarterly poll by the Ministry of Finance and the Cabinet Office released on Thursday suggests the drawbacks of a weak yen may be outweighing its benefits, which have not spread to broader sectors of the economy.
The loss of confidence comes as the Bank of Japan remains committed to its massive monetary easing programme even as the U.S. Federal Reserve moves closer to raising interest rates, triggering a renewed slide in the yen.
“It could be worrisome if the yen depreciation accelerates under the current deflationary circumstances where companies are unable to pass on costs, causing a profit-squeeze,” said Takeshi Minami, chief economist at Norinchukin Research Institute.
“We hear from companies that they are facing rising raw materials costs on higher import prices, a labour shortage and increase in electricity bills,” said a finance ministry official.
And somehow these increasingly disillusioned companies are expected to boost wages, and cut into their bottom line even more thus allowing the always delayed “trickle down” to take place? Didn’t think so.
What’s worse, once the corporate lobby agrees it has had enough with the collapsing Yen, which over the past year has become the primary carry currency in manipulating none other than the S&P’s E-Mini future, it will end not only the “transitory” Japanese profitability boost, which will promptly roundtrip (as the main problem for Japan is not the price of its imports but their quality, originality and desirability: just as Sony how that is going), but put an end to the great Abenomics experiment, and with it the latest (and this time maybe last) experiment with QE.
As for the ridiculous move in European forward multiples, expect the same outcome, but with a 9-12 month delay.
end
(courtesy Raul Meijer/Automatic Earth Blog)
The following is an extremely important commentary, if you believe what Meijer has to say.
This contention is that Yellen is going to raise interest rates in March regardless of economic climate. He cites two important commentaries:
1. Econmatters
2. Ambrose Evans Pritchard.
Econmatters believes that Yellen will blow up the bond market and in so doing will blow up the emerging markets.
A little background:
The total short position of the USA dollar as highlighted by Econmatters, Ambrose Evans Pritchard and Bill Holter is 9 trillion USA.
In a nutshell here is a breakdown on who is short:
1. Emerging market companies 4.5 trillion USA
2. Chinese companies 1.1 trillion
3. European and others: 3.5 trillion USA
all of these entities borrowed dollars to fund whatever assets they wished to buy. The emerging markets borrowed dollars to fund the sale of commodities to various players. Chinese companies borrowed dollars to purchase commodities which in turn financed buildings inside China. And likewise the European sector, same story as folks there borrowed cheap dollars to fund various operations.
It is Meijer, Econmatters and Ambrose Evans Pritchard’s contention that Yellen wishes to blow these guys up and somehow the USA banks will benefit? I am not sure on that point.
However, I think it is necessary to bring this to your attention in case it is true.
(courtesy, Raul Meijer/Economatters/Ambrose Evans Pritchard)
From Yellen Put To Yellen Massacre
Submitted by Raul Ilargi Meijer via The Automatic Earth blog,
I think I’ll just give you a slew of quotes, and then you can figure out if you can figure out why I chose to call this the Yellen Massacre. Which consists, by the way, of two separate but linked parts, not quite the Siamese twin perhaps, but close. What links them is the upcoming Fed decision to raise interest rates, and the timing of the announcement of that decision. It will blow up both bond markets and a large swath of emerging markets. People keep saying ‘the Fed won’t do it’, or ask ‘why would they do it’, but arguably they’re already quite late. It must be half a year ago now that I wrote it would hike rates, and also told you why: Wall Street banks. First, here’s a fine little ditty published at Econmatters:
Six Days Until Bond Market Crash Begins
Early on Thursday morning, realizing this was going to be a robust selloff in equities, the ‘smart money’, i.e., the big banks, investments banks, hedge funds and the like, ran to the old staple of buying bonds hand over fist with little regard for the yield they are getting paid for stepping in front of the freight train of rate rises coming down the tracks.
Just six days away from the most important FOMC meeting in the last seven years, and another 300k employment report in the rear view mirror, this looks like an excellent place to hide for nervous investors who have far more money than they have grains of common sense. Newsflash for these investors, yes markets are over-valued, and you need to get out of Apple, and about 100 other high flying overpriced momentum stocks, but you can`t hide out in bonds this time.
That party is over, and next Wednesday`s FOMC meeting is going to make this point abundantly clear. There is no place to hide except cash. You should have thought about that before you gorged yourself on ZIRP to the point where you have pushed stocks and bonds to unsupportable price levels, and you keep begging for the Fed to stall just another six months, so you can continue to buy more stocks and bonds.
Well you have done an excellent job hoodwinking the Fed to wait until June, you should thank your lucky stars you have done such a good job manipulating the Federal Reserve; but just like the boy crying wolf, this strategy loses its effectiveness over time. Throwing another temper tantrum right before another important FOMC meeting hoping that Janet Yellen will be alarmed by these Pre-FOMC Selloffs to put off another six months the inevitable rate hike, this blackmail strategy has run its course.
The Fed is forced to finally start the Rate Hiking Cycle after 7 plus years of Recession era Fed policies by an overheating labor market. You knew this day was going to come, but most of you are still in denial. What the heck were you buying 10-year bonds with a 1.6% yield five months before a rate hike?? You only have yourself to blame for the 65 basis point backup in yields on that disaster of an “Investment”.
But really what were you thinking here??That is the problem when the Fed has incentivized such poor investment decisions and poor allocation of capital to useful, growth oriented projects over the past 7 plus years of ZIRP that these ‘investors’ don`t think at all, they have become behaviorally trained ZIRP Crack Addicts!
They can cry over the strong dollar, have a couple of 300 point Dow Selloffs, scare monger over Europe or Emerging Market currencies, but the fact is that the due date has come on your stupidity. You bought all this crap, and now you have to sell it!Well too freaking bad, boo hoo, you shouldn’t have bought so many worthless stocks and bonds at unsustainable levels in the first place. [..]
The positioning for this inevitability is as poor as I have seen in any market. The carnage in the bond market is just going to be gruesome, the denial is so strong, the lack of historical perspective of what normal bond yields look like, and what a normalized economy represents where savers actually get paid to save money in a CD or checking account. The fact that the Fed has so de-sensitized investors to what a normalized rate economy and healthy functioning financial system looks like is probably one of the biggest drawbacks of ZIRP Methodology.
The Federal Reserve, and now the European Union have set the stage for the biggest collapse in bond markets that will make the sub-prime financial crisis look like a cakewalk.
One may question whether 6 days is carved in stone; maybe THE announcement will come the next meeting, not this one. But does it really matter? Yellen has created a narrative about the US economy, especially the (un)employment rate. About which yet another narrative has been created by the BLS, which refuses to count many millions of Americans as unemployed, for various reasons. And that leads to the article’s claim of ‘an overheating labor market’. The only way the US jobs market is overheating is that it seems to have created a huge oversupply of underpaid waiters, greeters and burger flippers.
But the narrative is now firmly in place, so Yellen and her stooges can claim they have no choice but to hike. Not just once, but three times this year, suggests Ambrose Evans-Pritchard in the following very bleak read and weep portrait of the world today. In which he also describes how all of this plays out in sync with the soaring dollar, which will have devastating consequences around the world, starting in the poorer parts of the world (what else is new?).
Global Finance Faces $9 Trillion Stress Test As Dollar Soars
The report – “Global dollar credit: links to US monetary policy and leverage” – was first published by the Bank for International Settlements in January, but its biting relevance is growing by the day. It shows how the Fed’s zero rates and quantitative easing flooded the emerging world with dollar liquidity in the boom years, overwhelming all defences.[..]
Foreigners have borrowed $9 trillion in US currency outside American jurisdiction, and therefore without the protection of a lender-of-last-resort able to issue unlimited dollars in extremis. This is up from $2 trillion in 2000. The emerging market share – mostly Asian – has doubled to $4.5 trillion since the Lehman crisis, including camouflaged lending through banks registered in London, Zurich or the Cayman Islands. The result is that the world credit system is acutely sensitive to any shift by the Fed. “Changes in the short-term policy rate are promptly reflected in the cost of $5 trillion in US dollar bank loans,” said the BIS.
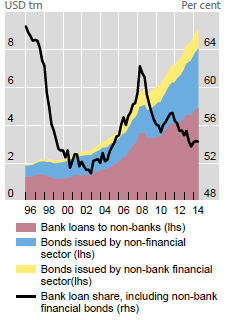
Markets are already pricing in such a change.The Fed’s so-called “dot plot” – the gauge of future thinking by Fed members – hints at three rate rises this year, kicking off in June. The BIS paper’s ominous implications are already visible as the dollar rises at a parabolic rate, smashing the Brazilian real, the Turkish lira, the South African rand and the Malaysian Ringitt, and driving the euro to a 12-year low of $1.06.
The dollar index (DXY) has soared 24pc since July, and 40pc since mid-2011. This is a bigger and steeper rise than the dollar rally in the mid-1990s – also caused by a US recovery at a time of European weakness, and by Fed tightening – which set off the East Asian crisis and Russia’s default in 1998. Emerging market governments learned the bitter lesson of that shock. They no longer borrow in dollars. Companies have more than made up for them.
“The world is on a dollar standard, not a euro or a yen standard, and that is why it matters so much what the Fed does,” said Stephen Jen, a former IMF official now at SLJ Macro Partners. He says the latest spasms of stress in emerging markets are more serious than the “taper tantrum” in May 2013, when the Fed first talked of phasing out quantitative easing. “Capital flows into these countries have continued to accelerate over recent quarters. This is mostly fickle money. The result is that there is now even more dry wood in the pile to serve as fuel,” he said. Mr Jen said Asian and Latin American companies are frantically trying to hedge their dollar debts on the derivatives markets, which drives the dollar even higher and feeds a vicious circle. “This is how avalanches start,” he said.
Companies are hanging on by their fingertips across the world. Brazilian airline Gol was sitting pretty four years ago when the real was the strongest currency in the world. Three quarters of its debt is in dollars. This has now turned into a ghastly currency mismatch as the real goes into free-fall, losing half its value. Interest payments on Gol’s debts have doubled, relative to its income stream in Brazil. The loans must be repaid or rolled over in a far less benign world, if possible at all.
You would not think it possible that an Asian sovereign wealth fund could run into trouble too, but Malaysia’s 1MDM state fund came close to default earlier this year after borrowing too heavily to buy energy projects and speculate on land. Its bonds are currently trading at junk level. It became a piggy bank for the political elites and now faces a corruption probe, a recurring pattern in the BRICS and mini-BRICS as the liquidity tide recedes and exposes the underlying rot.
BIS data show that the dollar debts of Chinese companies have jumped fivefold to $1.1 trillion since 2008, and are almost certainly higher if disguised sources are included. Among the flow is a $900bn “carry trade” – mostly through Hong Kong – that amounts to a huge collective bet on a falling dollar. Woe betide them if China starts to drive down the yuan to keep growth alive.
Manoj Pradhan, from Morgan Stanley, said emerging markets were able to weather the dollar spike in 2014 because the world’s deflation scare was still holding down the cost of global funding. These costs are now rising. Even Singapore’s three-month Sibor used for benchmark lending is ratcheting up fast. The added twist is that central banks in the developing world have stopped buying foreign bonds, after boosting their reserves from $1 trillion to $11 trillion since 2000.
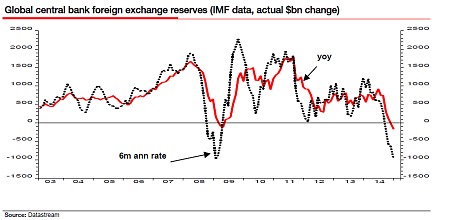
The Institute of International Finance (IIF) calculates that the oil slump has slashed petrodollar flows by $375bn a year. Crude exporters will switch from being net buyers of $123bn of foreign bonds and assets in 2013, to net sellers of $90bn this year. Russia sold $13bn in February alone. China has also changed sides, becoming a seller late last year as capital flight quickened. Liquidation of reserves automatically entails monetary tightening within these countries, unless offsetting action is taken. China still has the latitude to do this. Russia is not so lucky, and nor is Brazil. If they cut rates, they risk a further currency slide.
In short, Janet Yellen will go down into history as the person responsible for what may be the biggest economic crash ever, or at least delivering the final punch of the way into it, a crash that will make the rich banks even much richer. And there is not one iota of coincidence in there. Yellen works for those banks. The Fed only ever held investors’ hands because that worked out well for Wall Street. And now that’s over. Y’all are on the same side of the same trade, and there’s no profit for Wall Street that way.
end
The war of words with Russia is getting louder and louder:
(courtesy zero hedge)
US “Urges” Vietnam To Stop Helping Russian Bombers Re-Fuel
It appears Washington is losing some control among its allies. Amid a flurry of high-level visits to Vietnam last year, the US has been pouring in aid and assistance in health, education, landmines clearance, scholarships and nuclear energy. The reason is now becoming clear. As Reuters reports, Vietnam has been allowing Russia to use a former US military base to refuel nuclear-capable bombers as it rattles its sabre over the Asia-Pac region.. and America would like that to stop: “we have urged Vietnamese officials to ensure that Russia is not able to use its access to Cam Ranh Bay to conduct activities that could raise tensions in the region.” All that was missing was the “or else.”
http://www.reuters.com/assets/iframe/yovideo?videoId=363470433
As Reuters reports, the United States has asked Vietnam to stop letting Russia use a former U.S. base to refuel nuclear-capable bombers engaged in shows of strength over the Asia-Pacific region, exposing strains in Washington’s steadily warming relations with Hanoi…
It is the first time that U.S. officials have confirmed the role of Cam Ranh Bay, a natural deep-water harbor, in Russian bomber plane activity that has increased globally.
Brooks said the planes that circled Guam were refueled by Russian tankers flying from the strategic bay, which was transformed by the Americans during the Vietnam War into a massive air and naval base.
Vietnam’s willingness to allow Russia to use Cam Ranh Bay reflects Hanoi’s complex position in a geopolitical tug-of-war that frequently pits China and Russia on one side and the United States, Japan and much of Southeast Asia on the other.
Washington is keen to secure greater access itself to Cam Ranh Bay as part of its strategic “pivot” to Asia to counter China’s growing strength in the region. U.S. ships have visited for repairs in recent years.
Vietnam, in turn, has sought closer U.S. ties as a hedge against what it sees as China’s aggression, but remains close to Russia in both defense and energy cooperation.
Cam Ranh Bay is now host to three submarines bought by Vietnam’s navy from Russia to counter Chinese expansion in the South China Sea, with two more expected by early next year.
Brooks said in an interview the flights indicated that Vietnam’s Cold War-era allyRussia was acting as “a spoiler to our interests and the interests of others.”
…
Asked about the Russian flights in the region, the State Department official, who spoke on condition of anonymity, said Washington respected Hanoi’s right to enter agreements with other countries.
But the official added: “We have urged Vietnamese officials to ensure that Russia is not able to use its access to Cam Ranh Bay to conduct activities that could raise tensions in the region.”
The Vietnamese government did not immediately respond to a request for comment on the U.S. request.

* * *
And how will the US ‘ensure’ this happens…
U.S. Ambassador to Vietnam Ted Osius said on Friday it was understandable Hanoi would look to “historic partners” when it came to security, but the United States had “much to offer… to enhance Vietnam’s security in the short, medium and long term.”
* * *
It seems not everyone sees Russia as the isolated nation The West would prefer.
end
Iceland formally drops its bid to become part of the EU.
Smart move!!
(courtesy zero hedge)
Iceland Drops Bid For EU Membership
Having thought long and hard (since 2009) about the benefits of becoming a member of the European Union,Iceland has decided to withdraw its application…
- *ICELAND SAYS WON’T RESTART ACCESSION TALKS WITH EU
The 2013-elected (euroskeptic) coalition government had scrapped talks, so this is not entirely surprising, as it sought more trade accords.
Foreign Minister Gunnar Bragi Sveinsson formally withdrew bid for European Union membership in a letter presented to Latvia’s Foreign Minister Edgars Rinkevics, according to an e-mailed statement from the Foreign Ministry in Reykjavik.
According to Agence France-Presse, Iceland is reportedly dropping its bid for membership in the European Union.
Iceland applied for EU membership in 2009, but earlier this year, the Icelandic prime minister said that his country would withdraw its application.
* * *
Daniel Hannan Explains How Democracy Died In Europe
With Greece on the edge of being kicked out of the Eurozone , either voluntarily or otherwise, with an anti-austerity party on the verge of taking over the reins of power in Spain, with Beppe Grillo waiting in the corridors for his chance to pounce in Italy and with Marine le Pen and her nationalist party on the verge of becoming the biggest shocker of Europe over the coming years, here, according to Daniel Hannan, is what killed democracy in Europe. Europe itself.
Here are the punchlines, which are all based documented fact:
We were told the Euro would be an antidote to extremism, that it would make countries get on better, and make moderate politics more mainstream. Well, how’s that working out for you. Look at the elections in Greece – a Trotskyist party came first, a Nazi party came third. And as for the national animosities read the way the German newspaper now refer to the Greeks and vice versa. Would you say this is soothing or stoking national rivalries in Europe?
But worst of all is the impact on democratic accountability. After the Greek election results came in, the German finance minister said “elections change nothing.” He was talking specifically about Greece but this could be a watchword describing the entire Brussels racket. As Jean Claude Juncker put it the next day, “there can be no democratic choice against the European treaties.” This is the same European Commission that in late 2011 in Italy and Greece engaged in practice in civilian coups, toppling elected prime ministers and replacing them with former technocrats.
…
As the former president of the European Commission Barroso puts it, “democratic governments are often wrong. If you trust them too much they make bad decisions.” And so we have this syste,min Europe where power is deliberately vested in the hands of people who are invulnerable to public opinion. Being against that shouldn’t make you anti-Europe, it doesn’t make you Euroskeptic, it makes you pro-democracy. What a tragedy that in the country where democracy was born, in the part of the world that evolved this sublime idea, that our rulers should be accountable to the rest of us, in that same country that wonderful idea that laws should not be passed nor taxes raised except by our own representatives, has been abandoned.”
Tragedy indeed, and while nobody else is willing to admit it, only a violent overthrow of this unelected group of self-serving oligarchs is the only probably outcome.
Oil related stories:
Oil keeps crashing!!
April WTI Crude Futures Plunge To $46 Handle As Contango Soars
Front-month crude oil futures just plunged to new 6-week lows and a $46 handle. The April-May (J-K) spread has soared… no immediate catalyst for this move so we suspect it is Oil ETF and futures-roll-driven flow.
WTI hit 6-week lows…
And contango is soaring…
Charts: Bloomberg
end
Early Thursday morning trading from Europe/Asia
1. Stocks generally lower on major Chinese bourses/ / the yen slightly falls to 121.48
1b Chinese yuan vs USA dollar/ yuan strengthens to 6.2615
2 Nikkei up 58.14 or 0.31%3. Europe stocks all up // USA dollar index up to 99.56/Euro in free fall down to 1.0605
3b Japan 10 year yield .43%/ (Japan buying 100% of bond issuance)/Japanese yen vs usa cross now at 121.35/everybody watching the huge support levels of 117.20 and that level acting as a catapult for the markets.
3c Nikkei still above 17,000/
3e The USA/Yen rate now above the 121 barrier this morning/
3fOil: WTI 48.48 Brent: 56.57 /all eyes are focusing on oil prices. This should cause major defaults as derivatives blow up.3g/ Gold s down /yen slightly down;
3h/ Japan is to buy the equivalent of 108 billion usa dollars worth of bonds per MONTH or $1.3 trillion
Japan’s GDP equals 5 trillion usa/thus bond purchases of 26% of GDP
3i Japan to buy 100% of all new Japanese debt and by 2018 they will have 25% of all Japanese debt. Fifty percent of Japanese budget financed with debt (see Von Greyerz)
3j Oil up this morning for WTI and for Brent
3k European bond buying pushes yields lower on all fronts in the EMU
Except Greece which sees its 2 year rate rise to almost 19% /Greek stocks down .8%/expect huge bank runs on Greek banks
3l Greek 10 year bond yield :10.69% (up 60 basis points in yield)
3m Gold at $1158.50 dollars/ Silver: $15.60
3n USA vs Russian rouble: ( Russian rouble down 5/8 rouble / dollar in value) 61.86!!!!!!.
3 0 oil into the 48 dollar handle for WTI and 56 handle for Brent
3p higher foreign deposits into China sees risk of outflows and a currency depreciation can spell financial disaster for the rest of the world./China may be forced to do QE!!
3Q SNB (Swiss National Bank) still intervening again driving down the SF/window dressing/Swiss rumours of intervention to keep the soft peg at 1.05 Swiss Francs/euro and major support for the Euro.
Rumours SNB may cut rates to negative 1.5%
3r Britain’s Serious fraud squad investigating the Bank of England/
3s the 7 year German bund is now in negative territory/no doubt the ECB will have trouble meeting its quota of purchases and thus European QE will be a total failure (see passage below)
3t Talks with Greece to start today/does not look good
4. USA 10 yr treasury bond at 2.13% early this morning. Thirty year rate well below 3% (2.74%!!!!)/yield curve flattens/foreshadowing recession
5. Details: Ransquawk, Bloomberg/Deutsche bank Jim Reid
Your more important currency crosses early Thursday morning:
Eur/USA 1.0623 up .0977
USA/JAPAN YEN 121.06 down .349
GBP/USA 1.4985 up .0059
USA/CAN 1.2660 down .0080
This morning in Europe, the Euro stopped its spiraling downward movement and reversed by a considerable amount, trading now just above the 1.06 level at 1.0623; Europe is still reacting to deflation, announcements of massive stimulation and the ramifications of a default at the Austrian Hypo bank and possible defaults of Ukraine and Greece.
In Japan Abe went all in with Abenomics with another round of QE purchasing 80 trillion yen form 70 trillion on Oct 31. The yen continues to trade in yoyo fashion as this morning it settled up again in Japan by 35 basis points and trading just above the 121 level to 121.06 yen to the dollar.
The pound was up this morning as it now trades just below the 1.50 level at 1.4985 (very worried about the health of Barclay’s Bank and the FX/precious metals criminal investigation/Dec 12 a new separate criminal investigation on gold, silver and oil manipulation) It is trading at 1.2660 to the dollar. It sees that the 3 major global carry trades are being unwound:
1. the total dollar global short is 9 trillion USA and as such we are now witnessing a sea of red blood on the streets as derivatives blow up with the massive rise in the dollar against all paper currencies (see below)
2. the Nikkei average vs gold carry trade
3. Short Swiss Franc/long assets (European housing), the Nikkei etc.
This has partly blown up (see Hypo bank failure)
These massive carry trades are terribly offside as they are being unwound. It is causing global deflation (we are a debt saturation) as the world reacts to lack of demand and a scarcity of debt collateral. Bourses around the globe are reacting in kind to these events as well as the potential for a GREXIT>


The NIKKEI: Thursday morning : up 267.59 points or 0.31%
Trading from Europe and Asia:
1. Europe stocks mostly in the red
2/ Asian bourses all in the green … Chinese bourses: Hang Sang in the green ,Shanghai in the green, Australia in the green: /Nikkei (Japan) green/India’s Sensex in the green/
Gold very early morning trading: $1160.00
silver:$15.66
Early Thursday morning USA 10 year bond yield: 2.07% !!! down 4 in basis points from Wednesday night/
USA dollar index early Thursday morning: 99.10 down 57 cents from Wednesday’s close.
This ends the early morning numbers, Thursday morning
And now for your closing numbers for Thursday:
Closing Portuguese 10 year bond yield: 1.58% down 13 in basis points from Wednesday (QE kicking in)
Closing Japanese 10 year bond yield: .39% !!! down 8 in basis points from Wednesday/
Your closing Spanish 10 year government bond, Thursday down 9 in basis points in yield from Wednesday night.
Spanish 10 year bond yield: 1.15% !!!!!!
Your Thursday closing Italian 10 year bond yield: 1.13% down 9 in basis points from Wednesday:
trading 2 basis points lower than Spain.
IMPORTANT CURRENCY CLOSES FOR TODAY
Closing currency crosses for Thursday night/USA dollar index/USA 10 yr bond:
Euro/USA: 1.0636 up .0089
USA/Japan: 121.28 down .124
Great Britain/USA: 1.4891 down .0045
USA/Canada: 1.2689 down .0051
The euro rose a bit this afternoon, after cascading southbound all this week. It was up on the day by 89 basis points finishing the day well above the 1.06 level to 1.0636. The yen was slightly up in the afternoon, but it was up by closing to the tune of 12 basis points and closing well above the 120 cross at 121.28. The British pound lost huge ground during the afternoon session and was down on the day closing at 1.4891. The Canadian dollar was well up today despite oil falling. It closed at 1.2689 to the USA dollar
As explained above, the short dollar carry trade is being unwound, the yen carry trade , the Nikkei/gold carry trade, and finally the long dollar/short Swiss franc carry trade are all being unwound and these reversals are causing massive derivative losses. And as such these massive derivative losses is the powder keg that will destroy the entire financial system. The losses on the oil front and huge losses on the USA dollar will no doubt produce many dead bodies. The last asset still rising are the stock exchanges.
Your closing 10 yr USA bond yield: 2.11 par in basis points from Wednesday
Your closing USA dollar index: 99.14 down 54 cents on the day.!!!
European and Dow Jones stock index closes:
England FTSE up 39.56 points or 0.59%
Paris CAC down 10.42 or 0.21%
German Dax down 6.60 or 0.06%
Spain’s Ibex down 10.00 or 0.09%
Italian FTSE-MIB down 24.03 or 0.11%
The Dow: up 259.83 or 1.47%
Nasdaq; down 43.35 or 0.89%
OIL: WTI 46.95 !!!!!!!
Brent: 57.07!!!!
Closing USA/Russian rouble cross: 61.01 /up 3/8 roubles per dollar on the day. (despite lower oil prices)
end
And now for your more important USA economic stories for today:
Your New York trading for today:
Worst Macro Data Since Lehman Sparks Stock Buying Frenzy
Intel slashes guidance, retail sales worst since Lehman, Biz inventories to sales worst since Lehman, GDP expectations have collapsed, leading indicator Lumber plunged, and Jobless Claims holding above 300k on average… but the dip below the 100-day moving average was all that was needed…
Because with US Macro data falling at the fastest pace since Lehman…

And Lumber crashed…

Which matters…

* * *
So why wouldn’t you BTFWRSSL…

From the 330RAMP yesterday, Small Caps have ripped… and Dow (thanks to Goldman)

As S&P rallied perfectly off the 100DMA to top the 50DMA…

Today was led by the financials post-CCAR… as they unleashed their newly found buybacks

But we hate to be the bearers of reality news but credit markets were not as ‘squeezed’ as stocks…

Hhhhmmmm….

On the week, The Dow crept into the green but S&P and Nasdaq remain red… (Goldman And Visa added 75 points alone to The Dow today)

Treasury yields slipped lower still – despite a notably weak 30Y auction – 10Y and 30Y unch from the payrolls print

And a big bounce off 1.04 overnight in EURUSD sparked a tumble in the USD Index…

This 0.4% drop in The USD Index is the biggest in a month as EURUSD surged off 1.04

Commodities were very mixed… Silver up, gold flat, copper up big, crude down big…

Crude crashed back to 6-week lows – near cycle lows…

So terrible news is good news as “The QE Trade” appears to be back (for a day) – Buy Stocks, Buy Bonds, Buy Gold, Sell USDs…
Charts: Bloomberg
Bonus Chart: Fun-durr-mentals…
end
First quarter GDP expectations are crashing. It is closing in on the Atlanta figures of 1.2% growth
(courtesy zero hedge)
Q1 GDP Expectations Are Crashing
Despite the continuing commentary that all is well in America, economic growth expectations for Q1 just collapsed to a new cycle low. From just 4 months ago, growth expectations have been cut 20% to 2.4%… but that is still four times The Atlanta Fed’s dismal 0.6% forecast…

The Atlanta Fed forecasts Q1 growth of just 0.6%…

The GDPNow model forecast for real GDP growth (seasonally adjusted annual rate) in the first quarter of 2015 was 0.6 percent on March 12, down from 1.2 percent on March 6. The nowcast for first-quarter real consumption growth fell from 2.9 percent to 2.2 percent following this morning’s retail sales releasefrom the U.S. Census Bureau.
* * *
* * *
Not “Off The Lows”
One wonders just how The Fed will wriggle out of this box…
end
The first set of bad news: initial claims holds above 300,000:
(courtesy zero hedge)
Initial Jobless Claims Average Holds Above ‘Dreaded’ 300k Level
Despite a 36k drop week-over-week, the less noisy four-week average initial jobless claims remains above 300k for the 2nd week in a row – something we have not seen since in 6 months. At 289k, initial claims beat expectations of 304k but continuing claims printed higher than expected at 2.418 million. Shale state claims remain below the peak levels of January but well above average. The trend remains ‘changed’ from the QE3 regime.

Charts: Bloomberg
end
The consumer is 70% of USA GDP. Retail sales crumbles last month and the worst run since Lehman:
The second piece of bad news for the USA economy:
(courtesy zero hedge)
Retail Sales Crumble, Suffer Worst Run Since Lehman
Earlier today we warned readers that based on actual credit card spending data, today’s retail sales data would continue the worst trend since Lehman…
… and sure enough that’s what happened: moments ago the Commerce department reported that in February, retail sales missed once again and missed big and across the board, the third big miss in a row, with the headline print coming at -0.6%, far below the 0.3% expected, and in line with the -0.8% drop last month. Putting the headline numbers in context: December -0.9%, January -0.8%, February -0.6%. Surely a great time for the Fed to hike.
Excluding the volatile autos and gas, sales dropped once again, sliding -0.2%, below the 0.3% expected – in fact below the lowest estimate – and worse even than last month’s downward revised -0.1% decline. And with that the worst run in retail sales since Lehman is now in the record books.
How the Fed’s rate-hike “reaction function” responds to this data is up to Yellen.

And now we expect economists who once again were completely clueless to suddenly remember that, oh wait, it did snow in February – the same month in which they were setting their forecasts for the month, and that all those forecasts were really off because they had no idea, no idea, it snowed at the time.
As previously reported, the subrpime auto loan bonanza is over, and sure enough, Autos led the February drop, although as the chart below shows, there is still a long way down for Y/Y auto sales data to catch down to trend:

The breakdown in sales shows a decline in most major categories, with the drop most acute in autos (-2.5%) and building materials (-2.3%), but declines were also reported in furniture, food and drinking, health and personal and general merchandise sales. In short – pretty much most places expect internet sales which rose 2.2%, and sporting goods sales which saw a 2.3% increase.

Finally, the all important control group which plugs into the GDP calculation posted an unchanged, 0.0% print, with the previous revised from 0.1% to -0.1%. It was expected to rise 0.4%.

Expect a slew of downward Q1 GDP forecast revisions to start within moments, as every highly-paid sell-side economist realizes what we said last week: that theAtlanta Fed’s 1.2% Q1 GDP forecast (a number which will now be revised even lower) will prove to be spot on, if not overly optimistic.

Business inventories miss for the 8th month out of 9 months and show no change on a month over month. This is the weakest number since May 2013. This complements the wholesale inventory miss reported last week. It indicates that the economy in the uSA is faltering terribly.
The third set of bad news this morning;
(courtesy zero hedge)
Business Inventory-To-Sales Ratio Surges To Worst Since Lehman
And to complete this morning’s trifecta of disappointment, Business Inventories miss (for the 8th of the last 9 months) and show no change MoM – the weakest since May 2013. Building Materials, Furniture, and Autos saw inventories fall as Department Store inventories rose. Coupled with sales weakness (retail sales -0.9%), this is the highest inventory-to-sales ratio since Lehman… just as with Wholesale inventories…
Worst monthly change since May 2013…

and highest inventrory to sales ratio since Lehman…

But apart from that…
Charts: Bloomberg
end
Another global Bellwether: Intel!! They slash Q! revenue forecast by 7% and they correctly blame weak demand.
(courtesy zero hedge)
The “Warnings” Begin: Intel Slashes Q1 Revenue Forecast by 7%, Blames “Weak Demand”
Unpossible? Chipmaker Intel just took an ax to its Q1global revenue expectations:
- *INTC SEES 1Q REV. $12.5B-$13.1B, SAW $13.2B-$14.2B, EST.$13.72B
- *INTEL CITES ‘WEAKER THAN EXPECTED` BUSINESS DESKTOP PC DEMAND
Of course, we will be told this is one-off and that Intel is now no longer a belwether but “weaker than expected conditions in Europe,” is not what the talking heads have been telling us.

Full Intel Statement:
Intel Corporation today announced that first-quarter revenue is expected to be below the company’s previous outlook. The company now expects first-quarter revenue to be $12.8 billion, plus or minus $300 million, compared to the previous expectation of $13.7 billion, plus or minus $500 million.
The change in revenue outlook is a result ofweaker than expected demand for business desktop PCs and lower than expected inventory levels across the PC supply chain. The company believes the changes to demand and inventory patterns are caused by lower than expected Windows XP refresh in small and medium business andincreasingly challenging macroeconomic and currency conditions, particularly in Europe.
The data center business is meeting expectations.
The company is forecasting the mid-point of the gross margin range to remain at 60 percent, plus or minus a couple of percentage points, as lower PC unit volume is offset by higher platform average selling prices. Expectations for R&D and MG&A spending and depreciation in the first quarter remain unchanged.
All other expectations have been withdrawn and will be updated with the company’s first-quarter earnings report on April 14.
end


