
Good evening Ladies and Gentlemen:
We are entering options expiry week.
Comex options expiry Tuesday, July 28.
LMBA options expiry: noon London time July 31.2015
OTC options expiry: midnight July 31.2015
we have no chance whatsoever to see gold above 1100.00 or silver above 15.00 dollars until after the entire options expiry. This is how the crooked bankers fleece poor unsuspecting souls.
Here are the following closes for gold and silver today:
Gold: $1094.00 up $2.60 (comex closing time)
Silver $14.68 down 4 cents.
In the access market 5:15 pm
Gold $1090.30
Silver: $14.70
First, here is an outline of what will be discussed tonight:
At the gold comex today, we had a poor delivery day, registering 0 notices for 0 ounces . Silver saw 53 notices filed for 265,000 oz.
Several months ago the comex had 303 tonnes of total gold. Today, the total inventory rests at 246.35 tonnes for a loss of 57 tonnes over that period.
In silver, the open interest fell by a tiny 629 contracts as yesterday’s price was down by 5 cents and the gold price was pummeled (down $12.00). The total silver OI continues to remain extremely high, with today’s reading at 189,597 contracts now at decade highs despite a record low price. In ounces, the OI is represented by .947 billion oz or 135% of annual global silver production (ex Russia ex China). This dichotomy has been happening now for quite a while and defies logic. There is no doubt that the silver situation is scaring our bankers to no end as they continue to raid as basically they have no other alternative. Today again, we must have had bankers contemplating falling off the roof due to silver’s refusal to buckle with respect to open interest.
In silver we had 53 notices served upon for 265,000 oz.
In gold, the total comex gold OI rests tonight at 451,725 for a loss of 8,035 contracts as gold was down $12.00 yesterday. We had 0 notices filed for nil oz today.
We had another withdrawal in gold tonnage at the GLD to the tune of 2.68 tonnes/ thus the inventory rests tonight at 684.63 tonnes. The appetite for gold coming from China is depleting not only gold from the LBMA and GLD but also the comex is bleeding gold. I thought that 700 tonnes is the rock bottom inventory in GLD gold, but I guess I was wrong. However we must be coming pretty close to a level of only paper gold and the GLD being totally void of physical gold. In silver, we had no change in inventory at the SLV / Inventory rests at 328.834 million oz.
We have a few important stories to bring to your attention today…
1. Today, we had the open interest in silver fall by a tiny 629 contracts to 189,597 as silver was down by 5 cents yesterday in another massive bear raid. We again must have had some shortcovering by the bankers as they feared something was brewing in the silver arena. The OI for gold fell by 8,035 contracts down to 451,725 contracts as the price of gold was down by $12.00 yesterday. We are witnessing bigger liquidation in gold OI but not silver as something big must going on behind the scenes (with respect to silver).
(report Harvey)
2 Today, 2 important commentaries on Greece
(zero hedge, Bloomberg/)
3.Ray Dalio of Bridgewater sounds off on the Chinese markets;
(Ray Dalio/zero hedge)
4. Gold trading overnight
(Goldcore/Mark O’Byrne/)
5.IMF warns that Japanese debt is unsustainable
(zero hedge)
6 Trading of equities/ New York
(zero hedge)
7 USA stories:jobless rate in USA falls
(zero hedge)
plus other topics…
Here are today’s comex results:
The total gold comex open interest fell by 8,035 contracts from 459,760 contracts down to 451,725 as gold was down $12.00 in price yesterday (at the comex close). The bankers got their much needed big liquidation. We are now in the next contract month of July and here the OI fell by 2 contracts to 119 contracts. We had 2 notices filed yesterday and thus we neither lost nor gained any gold contracts standing in this non active delivery month of July. The next big delivery month is August and here the OI decreased by 12,388 contracts down to 183,792. We have a little over one week before first day notice for the big August active gold contract. The estimated volume today (which is just comex sales during regular business hours of 8:20 until 1:30 pm est) was excellent at 309,334. However today’s volume was aided by HFT traders. The confirmed volume yesterday (which includes the volume during regular business hours + access market sales the previous day was good at 220,280 contracts. Today we had 0 notices filed for nil oz.
And now for the wild silver comex results. Silver OI fell by a tiny 629 contracts from 190,226 down to 189,597 as the price of silver was down by 5 cents with respect to yesterday’s price. We continue to have our bankers pulling their hair out with respect to the continued high silver OI as the world senses something is brewing in the silver arena. We are in the delivery month of July and here the OI fell by 2 contracts down to 152. We had 0 notices served upon yesterday and thus we lost 2 contracts or an additional 10,000 ounces of silver will not stand for delivery in this active month of July. This is the first time in quite some time that we have not lost any silver ounces standing immediately after first day notice. The August contract month saw it’s OI rise by 3 contracts up to 189. The next major active delivery month is September and here the OI fell by 873 contracts to 129,062. The estimated volume today was fair at 26,206 contracts (just comex sales during regular business hours). The confirmed volume yesterday (regular plus access market) came in at 38,589 contracts which is also good in volume. We had 53 notices filed for 265,000 oz.
July initial standing
July 23.2015
| Gold |
Ounces |
| Withdrawals from Dealers Inventory in oz | nil |
| Withdrawals from Customer Inventory in oz | 67,560.759 oz (Delaware and Scotia)includes 3 kilobars from Delaware |
| Deposits to the Dealer Inventory in oz | nil |
| Deposits to the Customer Inventory, in oz | 192,803.55 oz (5972 kilobars) |
| No of oz served (contracts) today | 0 contracts (nil oz) |
| No of oz to be served (notices) | 119 contracts (11,900 oz) |
| Total monthly oz gold served (contracts) so far this month | 607 contracts(60,700 oz) |
| Total accumulative withdrawals of gold from the Dealers inventory this month | 203.60 oz |
| Total accumulative withdrawal of gold from the Customer inventory this month | 355,981.4 oz |
Today, we had 0 dealer transactions
total Dealer withdrawals: nil oz
we had 0 dealer deposits
total dealer deposit: zero
and the farce with respect to kilobars continues…
i) Out of Delaware: 96.45 oz (3 kilobars)
ii) Out of Scotia: 67,464.309 oz
total customer withdrawal: 67,560.759 oz oz
We had 2 customer deposit:
i) Into JPMorgan: exactly 4,972 kilobars or 159,849.55 oz
ii) Into Scotia: 32,150.000 oz or 1000 kilobars
Total customer deposit: 192,803.55ounces (or exactly 5972 kilobars)
We had 0 adjustments.
Today, 0 notices was issued from JPMorgan dealer account and 102 notices were issued from their client or customer account. The total of all issuance by all participants equates to 0 contracts of which 0 notices were stopped (received) by JPMorgan dealer and 0 notices were stopped (received) by JPMorgan customer account
To calculate the total number of gold ounces standing for the July contract month, we take the total number of notices filed so far for the month (607) x 100 oz or 60,700 oz , to which we add the difference between the open interest for the front month of July (119) and the number of notices served upon today (0) x 100 oz equals the number of ounces standing.
Thus the initial standings for gold for the July contract month:
No of notices served so far (607) x 100 oz or ounces + {OI for the front month (119) – the number of notices served upon today (0) x 100 oz which equals 72,600 oz standing so far in this month of July (2.258 tonnes of gold).
we lost 1 contract or an additional 100 oz will not stand in this non active delivery month of JULY.
Total dealer inventory 482,778.738 or 15.016 tonnes
Total gold inventory (dealer and customer) = 7,920,334.628 oz or 246.35 tonnes
Several months ago the comex had 303 tonnes of total gold. Today the total inventory rests at 246.35 tonnes for a loss of 57 tonnes over that period.
end
And now for silver
July silver initial standings
July 23 2015:
| Silver |
Ounces |
| Withdrawals from Dealers Inventory | nil |
| Withdrawals from Customer Inventory | 15,817.175 oz (Delaware ) |
| Deposits to the Dealer Inventory | nil |
| Deposits to the Customer Inventory | 106,929.162 oz (CNT, Delaware) |
| No of oz served (contracts) | 53 contracts (265,000 oz) |
| No of oz to be served (notices) | 99 contracts (495,000 oz) |
| Total monthly oz silver served (contracts) | 3382 contracts (16,910,000 oz) |
| Total accumulative withdrawal of silver from the Dealers inventory this month | nil |
| Total accumulative withdrawal of silver from the Customer inventory this month | 8,200,430.7 oz |
Today, we had 0 deposits into the dealer account:
total dealer deposit: nil oz
we had 0 dealer withdrawal:
total dealer withdrawal: nil oz
We had 2 customer deposits:
i) Into CNT: 6,785.200 oz
ii) Into Delaware: 100,143.962 oz
total customer deposit: 106,929.162 oz
We had 1 customer withdrawals:
i)Out of Delaware: 15,817.175 oz
total withdrawals from customer: 15,817.175 oz
we had 1 adjustment and a strange one:
From Delaware:
+ 26,291.557 oz into Dealer
-28,613.00 oz customer ( they really mean an addition)
and the remainder evaporates.
Total dealer inventory: 58.133 million oz
Total of all silver inventory (dealer and customer) 177.988 million oz
The total number of notices filed today for the July contract month is represented by 0 contracts for nil oz. To calculate the number of silver ounces that will stand for delivery in July, we take the total number of notices filed for the month so far at (3382) x 5,000 oz = 16,910,000 oz to which we add the difference between the open interest for the front month of July (152) and the number of notices served upon today (53) x 5000 oz equals the number of ounces standing.
Thus the initial standings for silver for the July contract month:
3382 (notices served so far) + { OI for front month of July (152) -number of notices served upon today (53} x 5000 oz ,= 17,405,000 oz of silver standing for the July contract month.
We lost 2 contracts or an additional 10,000 ounces will not stand in this active delivery month of July.
for those wishing to see the rest of data today see:
http://www.harveyorgan.wordpress.comorhttp://www.harveyorganblog.com
end
The two ETF’s that I follow are the GLD and SLV. You must be very careful in trading these vehicles as these funds do not have any beneficial gold or silver behind them. They probably have only paper claims and when the dust settles, on a collapse, there will be countless class action lawsuits trying to recover your lost investment.
There is now evidence that the GLD and SLV are paper settling on the comex.
***I do not think that the GLD will head to zero as we still have some GLD shareholders who think that gold is the right vehicle to be in even though they do not understand the difference between paper gold and physical gold. I can visualize demand coming to the buyers side:
i) demand from paper gold shareholders
ii) demand from the bankers who then redeem for gold to send this gold onto China
vs no sellers of GLD paper.
And now the Gold inventory at the GLD:
July 23.2015: we had another withdrawal of 2.68 tonnes of gold from the GLD/Inventory rests at 684.63 tonnes
july 22/another withdrawal of 2.38 tonnes of gold from the GLD/Inventory rests at 687.31
July 21.2015: a massive withdrawal of 6.56 tonnes of gold from the GLD.
Inventory rests at 689.69 tonnes. China and Russia need their physical gold badly and they are drawing their physical from this facility.
July 2o.2015: no change in inventory
July 17./a massive withdrawal of 11.63 tonnes in gold tonnage tonight from the GLD/Inventory rests at 696.25 tonnes
July 16./we lost 1.19 tonnes of gold tonight/Inventory rests at 707.88 tonnes
July 15/no change in inventory/gold inventory rests tonight at 709.07 tonnes.
July 14.2015:no change in inventory/gold inventory rests at 709.07 tonnes
July 13.2015: a big inventory gain of 1.49 tonnes/Inventory rests tonight at 709.07 tonnes
July 10/ we had a big withdrawal of 2.07 tonnes of gold from the GLD/Inventory rests this weekend at 707.58 tonnes
July 9/ no change in gold inventory at the GLD/Inventory at 709.65 tonnes
July 8/no change in gold inventory at the GLD/Inventory at 709.65 tonnes
July 7/ no change in gold inventory at the GLD/Inventory at 709.65 tonnes
July 6/no change in gold inventory at the GLD/Inventory at 709.65 tonnes
July 2/we had a huge withdrawal of inventory to the tune of 1.79 tonnes/rests tonight at 709.65 tonnes
July 23 GLD : 684.63 tonnes
end
And now for silver (SLV)
July 23.2015; no change in silver inventory/rests tonight at 328.834 million oz
july 22/no change in silver inventory/inventory rests at 328.834 million oz.
July 21.we had a massive addition of 1.241 million oz into the SLV/Inventory rests tonight at 328.834 million oz.
Please note the difference between gold and silver (GLD and SLV). In GLD gold is being depleted and sent to the east. In silver: no depletions, as I guess this vehicle cannot supply physical metal.
July 20/no change
july 17.2015/no change in silver inventory tonight/inventory at 327.593 million oz
July 16./no change in silver inventory/rests tonight at 327.593 million oz
July 15./no change in silver inventory/rests tonight at 327.593 million oz/
July 14.2015: no change in silver inventory/rests tonight at 327.593 million oz.
July 13./an inventory gain of 1.051 million oz/Inventory rests at 327.593 million oz
july 10/no change in silver inventory at the SLV tonight/inventory 326.542 million oz/
July 9/ a huge increase in inventory at the SLV of 1.337 million oz. Inventory rests tonight at 326.542 million oz
July 8/no change in inventory at the SLV/rests at 325.205
July 7/no change in inventory at the SLV/rests at 325.205 tonnes
July 6/we have a slight inventory withdrawal which no doubt paid fees. we lost 137,000 oz/Inventory rests tonight at 325.205 million oz
July 2/ no change in inventory at the SLV/rests tonight at 325.342 million oz
July 23/2015: tonight inventory rests at 328.834 million oz
end
And now for our premiums to NAV for the funds I follow:
Sprott and Central Fund of Canada.
(both of these funds have 100% physical metal behind them and unencumbered and I can vouch for that)
1. Central Fund of Canada: traded at Negative 12.3 percent to NAV usa funds and Negative 12.20% to NAV for Cdn funds!!!!!!!
Percentage of fund in gold 61.7%
Percentage of fund in silver:38.0%
cash .3%
( July 23/2015)
2. Sprott silver fund (PSLV): Premium to NAV falls to 0.04%!!!! NAV (July 23/2015) (silver must be in short supply)
3. Sprott gold fund (PHYS): premium to NAV falls to – .89% to NAV(July 23/2015)
Note: Sprott silver trust back into positive territory at 0.04%
Sprott physical gold trust is back into negative territory at -.89%
Central fund of Canada’s is still in jail.
Sprott formally launches its offer for Central Trust gold and Silver Bullion trust:
SII.CN Sprott formally launches previously announced offers to CentralGoldTrust (GTU.UT.CN) and Silver Bullion Trust (SBT.UT.CN) unitholders (C$2.64)
Sprott Asset Management has formally commenced its offers to acquire all of the outstanding units of Central GoldTrust and Silver Bullion Trust, respectively, on a NAV to NAV exchange basis.
Note company announced its intent to make the offer on 23-Apr-15 Based on the NAV per unit of Sprott Physical Gold Trust $9.98 and Central GoldTrust $44.36 on 22-May, a unitholder would receive 4.45 Sprott Physical Gold Trust units for each Central GoldTrust unit tendered in the Offer.
Based on the NAV per unit of Sprott Physical Silver Trust $6.66 and Silver Bullion Trust $10.00 on 22-May, a unitholder would receive 1.50 Sprott Physical Silver Trust units for each Silver Bullion Trust unit tendered in the Offer.
* * * * *
>
And now for your overnight trading in gold and silver plus stories
on gold and silver issues:
(courtesy/Mark O’Byrne/Goldcore)
Gold Smash Leads to Surge in Demand For Coins, Bars Around World
– U.S. Mint sees highest monthly gold eagle sales in over two years
– Indians take advantage of low price in a season not typically known for gold buying
– Chinese investors, disillusioned with stock market, are buying gold in large volumes
– Demand for coins from Perth Mint 37% higher in June and even higher for July

The manipulative smash on the gold price on Sunday night has once again led to a surge of buying of gold coins and bars across the globe. Both the Wall Street Journal and Reuters report on how bullion dealers are seeing a spike in demand for gold coins and bars in India and China and indeed Europe, Australia and the U.S.
The U.S. Mint – which ran out of Silver Eagles earlier in the month due to unexpectedly high demand – has sold 110,000 Gold Eagle one ounce coins so far this month according to Reuters. This compares with a mere 21,500 ounces sold in May and 76,000 in June. It represents the highest level of monthly demand in over two years – with more than a week to go till the end of the month.
In India, July is typically a quiet month for gold sales as farmers, who make up the bulk of the population, allocate their cash towards cultivation, according to the WSJ. However, the unusually low price has led to a surge of buying.
“Gold’s plunge to five-year lows this week has prompted a swift rise in demand from jewelry retailers in China and India, the world’s top consumers of gold, leading to a doubling of premiums paid on physical gold,” reports the WSJ viaMarketwatch.
The article goes on to quote an Indian jeweller:
“Until now, the gold demand was very low because of the season. Demand has picked up noticeably as the common man thinks prices have bottomed out.”
Meanwhile, Chinese investors have been allocating money to gold following the bursting of China’s equity bubble.
Interest in gold “had waned in recent months as investors flocked to the soaring stock market.” The surge in demand has caused a doubling in the premiums paid for gold. Demand for investment type “gold biscuits” has “shot up” this week according to a Hong Kong based jeweller. “Our sales are up by 20% to 30% compared to average sales in previous months.”
The Perth Mint in Australia has also seen a sharp rise in demand for gold coins. In June, sales were up 37% on the same month last year with the mint clearing 21,962 ounces.
“Sales in July already matched that level earlier this week and appear to be gaining momentum,” said Ron Currie, sales and marketing director.
The Perth Mint sells coins and bars internationally and is seeing strong demand in the U.S. and EU.
With the price of gold being determined by paper contracts – often regardless of the supply and demand fundamentals of the actual metal itself – spot gold prices today are no longer a barometer of perceived risk in the system.
However, It is clear that many investors in the East and West are accumulating physical gold, the main benefit of which is financial insurance. This would suggest that a great many more people are cautious about the health of the financial system and indeed the global economy than the gold price may indicate.
The experience of the Greek people in not being able to access bank accounts and even cash in safety deposit boxes is also making nervous and leading to gold buying and diversification.
The risks posed by the gargantuan unpayable debt choking the financial system and the economies of the world along with simmering geopolitical tensions remain. We advise clients to hope for the best while planning for the worst by owning physical gold – history’s and today’s store of value.
Must-read guide to bail-ins: Protecting Your Deposits From Confiscation
MARKET UPDATE
Today’s AM LBMA Gold Price was USD 1,101.65, EUR 1003.69 and GBP 705.91 per ounce.
Yesterday’s AM LBMA Gold Price was 1,096.80, EUR 1002.468 and GBP 702.38 per ounce.
Gold fell $6.30 or 0.4% to $1,093.90 per ounce and silver was flat or down 1 cent to $14.80 per ounce yesterday.
Today, gold in Singapore ticked higher, prior to gold bullion in Zurich moved slightly lower.
This morning in European trading, silver for immediate delivery rose 0.6% to $15.00 an ounce. Spot platinum rose 1.1% percent to $995 an ounce, while palladium rose 0.8 percent to $635 an ounce.
Must-read bullion guide: Gold and Silver Storage Must Haves
end
We told you that it was unlikely the Chinese who orchestrated the bear raid. It can only be our same banker crooks:
(courtesy zero hedge)
The Hunt For The “Mystery” Gold “Bear Raid” Leader Begins
In the immediate aftermath of Sunday night’s massive gold slam, which was oddly reminiscent of the great silver crash of 2011 when on May 1 just around 6:25pm, silver plunged by 15%, from $48 to $42 with no news or catalyst…

… marking the all time high price of silver in the current precious metals cycle (that particular ‘malicious seller’ has never been identified) the promptly arranged narrative was that because the gold crash took place in the span of 30 seconds just before Chinese stocks opened and broke the gold futures market not once but twice, that it has to be a China-based seller with Reuters taking the lead and quickly pointing the finger with an article titled “Gold hits five-year low, under $1,100 on Chinese selling.”

Ironically, the very same Reuters last night admitted that it had been wrong and that it was in fact: “New York sell orders in thin trade” that triggered the “Shanghai gold rout”:
In early Asian trading hours on Monday, when typically only tens of contracts of gold are traded, investors dumped more than $500 million worth of bullion in New York in four seconds, triggering the market’s biggest rout in years.
The sell-off began when one or more massive sell orders hit the price of gold on the CME Group’s Comex futures in New York a tenth of a second after 9:29 a.m. in Shanghai, triggering turnover of almost 5,000 lots of gold in a blink of an eye. That equates to 13 tonnes of gold, more than typically trades in hours during this time of day, and the selling knocked the price almost $20 to $1,100 per ounce during those four seconds. It marked the first leg of a dramatic 60-second sell-off that saw prices sink more than 4 percent to five-year lows.
And just like that the narrative shifts again: instead of a Chinese seller, the real culprit appears to have been a US-based entity masking as a Chinese trader, around which the media then conveniently built a further goal-seeked “story” in which the Sunday night selling (by a US entity now) was the result of a PBOC announcement that its gold holdings had risen to “only” 1600 tons… however the problem is that all this had been known since Friday morning.
So, fast forward to this morning when in yet another Reuters piece, we “find” that the narrative has shifted once more and that now, “traders from Hong Kong to New York are pointing the finger at others for being behind the move while struggling to unmask the mystery sellers.”
In other words: the “hunt” for the great gold “bear raid leader” has begun.
Singapore-based futures brokerage Phillip Futures declared “indiscriminate selling by Asian hedge funds at the stroke of the market’s open in Shanghai” as the chief cause of the price fall in a letter to clients.
But the most well known Chinese funds denied involvement, and as futures trading is anonymous, dealers may never know who was buying and selling during those crucial seconds.
Such details often only become available if regulators take action, and amid the regulatory scrutiny following China’s recent equity market tumbles, it’s unlikely any trader or fund will be eager to take credit for setting off another avalanche.
The fact that the selloff occurred while Japan’s markets were closed for a holiday and U.S. and European traders remained on weekend leave served to implicate China-based dealers in the eyes of some market participants.
At this point a Reuters source even dared to use the “M” word:
“That move was aggressive manipulation. Somebody clearly wanted the market lower and timed it very well,” said a gold trader at a bank in Hong Kong, who saw parallels with the way funds have been linked to swings in copper.
Of course it was, but instead of focusing on what truly matters let’s go chasing for red, literally, herrings…
Chinese funds such as Shanghai Chaos Investment Co and Zhejiang Dunhe Investment Co were, according to traders, behind falls in copper, one in March last year when the metal fell more than 8 percent in three days, and again in January this year when copper slid almost 8 percent in two days.
… herrings which however had nothing to do with the actual selling:
Sources familiar with both Zhejiang Dunhe and Chaos, and at similar outfits, say that while China’s status as the dominant copper consumer left that market vulnerable to potential influence, China’s traders have no such sway over bullion.
“Honestly, Chinese hedge funds are not as experienced as the overseas veterans and gold is more connected to U.S. dollar movement and well-dominated by Wall Street,” said a trader with a Shanghai hedge fund.
Then, inexplicably, more truth:
A London-based trader with an investment bank agreed the lead seller might not be from Asia. “The selling was on Comex and could also be a non-Chinese fund just executing in what they thought was an illiquid timezone to get the biggest move,” the trader said.
Others got close to admitting what happened, but were stopped just short, instead falling back to what had already been set up as the false narrative:
Vishnu Varathan, senior economist at Mizuho Bank, added “there’s a good real money presence in centres like Hong Kong and Singapore. But of course, the inside people who knew where the trades were executed probably have their reason for citing Chinese hedge funds, but I don’t think they were alone in this trade.”
“I think one of the triggers was some disappointment with the amount of the buildup in China’s gold reserves so in terms of the proximity of that particular trigger and the markets that were open there was some involvement, I’m sure, but it may not be the full story,” Varathan said.
For the record, here is what we said moments after the “bear raid” took place:
Once again, as in February 2014 and on various prior cases, the fact that someone meant to take out the entire bid stack reveals that this was not a normal order and price discovery was the last thing on the seller’s mind, but an intentional HFT-induced slam with one purpose: force the sell stops.
So what caused it?
The answer is probably irrelevant: it could be another HFT-orchestrated smash a la February 2014, or it could be the BIS’ gold and FX trading desk under Benoit Gilson, or it could be just a massive Chinese commodity financing deal unwind as we schematically showed last March it could be simply Citigroup, which as we showed earlier this month has now captured the precious metals market via derivatives.
We then added: “we won’t know for sure until the CME once again explains who violated exchange rules with last night’s massive orders.”
This is the same CME which took 18 months to admit that the almost identical market halting gold flash crash from January 6, 2014 was the result of potentially premeditated “flawed” algo trading which “resulted in a disruptive and rapid price movement in the February 2014 Gold Futures market and prompted a Velocity Logic event.”
And, anticipating precisely today’s latest development in the great gold crash story, namely the pursuit of the perpetrators we also added: “there are many who do want to know the reason for the gold crash, which just like in January 2014 had a clear algorithmic liquidation component to it. Which means that until the CME opines on precisely who and what caused the latest gold market break, we won’t know with any certainty. That doesn’t mean that some won’t try to “explain” it.'”
Such as Reuters, on several occasions.
But the real answer, which almost certainly once again points to the trading desk of one Benoit Gilson in Basel, will surely never be revealed. Even in the January 2014 case, the CME stopped short of actually identifying precisely who had oredered the gold collapse instead leaving it broad as follows: “this failure resulted in unusually large and atypical trading activity by several of the Firm’s customers.”
Which ones? Or perhaps the $64,000 answer to that question is what the central banks and the BIS, and hence the CME, will guard at all costs.
Finally, as we also noted previously, “while the actual selling reason was irrelevant, the target was clear: to breach the $1080 gold price which also happens to be the multi-decade channel support level.”
So far this has almost succeeded, with gold repeatedly sliding just shy of $1080 but never actually breaching it. We expect this too support level to be taken out as what is now clear and accepted manipulation continues, which in retrospect, will merely afford those who buy gold for its true practical value, as insurance against a systemic collapse which is pretty close to where the Chinese central planners find themselves right now not to mention the imploding European monetary union, to buy more for the same paper price.
As for the “great”, and greatly misdirecting, hunt for the “bear raid” leader, one which will never reveal the true culprit, bring it on – we can always do with some entertainment meant to distract the masses. In fact, we would not be at all surprised if some Indian trader out of his parent’s basement in a London suburb ends up going to prison for this while those guilty of chronic, constant manipulation continue to walk free…


Dave Kranzler: Anti-gold propaganda reaches bubble proportions
1:02p ET Thursday, July 23, 2015
Dear Friend of GATA and Gold:
In his new commentary, “Anti-Gold Propaganda Reaches Bubble Proportions,” Dave Kranzler of Investment Research Dynamics argues that there really isn’t any gold “market” now that central banks and governments are rigging it so much. Kranzler’s commentary is posted at the IRD Internet site here:
http://investmentresearchdynamics.com/anti-gold-propaganda-reaches-bubbl…
CHRIS POWELL, Secretary/Treasurer
Gold Anti-Trust Action Committee Inc.
CPowell@GATA.org
end
A great paper from Alasdair Macleon
his subject:
Gold and Gibson’s Paradox,
Gold and Gibson’s Paradox
- By Alasdair Macleod
- Posted 23 July 2015
There is a myth prevalent today that the gold price always falls when interest rates rise.
The logic is that when interest rates rise it is more expensive to hold gold, which just sits there not earning anything. And since markets discount future expectations, gold will even fall when a rise in interest rates is expected. With the Fed’s Open Market Committee debating the timing of an interest rate rise to take place possibly in September, it is therefore no surprise to market commentators that the gold price continues its bear market. Only the myth is just that: a myth denied by empirical evidence.
The chart below is of a time when the opposite was demonstrably true. From March 1971 to December 1979 the trends in both interest rates and the gold price rose and fell at the same time. It is worth noting that this occurred over more than one business cycle, so it is not a relationship which was cycle-dependant.

The myth is therefore satisfactorily debunked. To understand why this relationship between interest rates and gold is not as simple as commonly believed, we must take the argument further to bring in commodities generally and visit the tricky subject of Gibson’s Paradox. This paradox is based purely on long-run empirical evidence, when gold was transaction money, covering the two centuries between 1730 and 1930. It observes that the level of wholesale prices and interest rates are positively correlated. It is not the price relationship that is consistent with the quantity theory of money, which presupposes that interest rates correlate to the rate of price inflation instead of the price level itself. This maybe a reason why monetarists mistakenly argue, as we also discovered in the seventies, that central banks can manage the rate of inflation through interest rate policy. The common view in markets today about the relationship between interest rates and price inflation is wholly at odds with the longer-run evidence of Gibson’s Paradox and accords with the more fashionable quantity theory instead.
Gibson and his paradox are generally forgotten today, and those who centrally plan our money and markets appear unaware of the challenge it poses to their monetarist preconceptions. Keynes, no less, described Gibson’s Paradox in 1930 as “one of the most completely established empirical facts in the whole field of quantitative economics”, and Irving Fisher also wrote in 1930 that “no problem in economics has been more hotly debated”. Even Milton Friedman agreed in 1976 that “The Gibson Paradox remains an empirical phenomenon without a theoretical explanation”.*
Resolving this paradox can be left to another time; instead we shall consider the implications by looking at price relationships between wholesale prices and interest rates in a post-gold world. The next chart is of producer prices measured in gold compared with one-year Treasury yields.

I have taken the St Louis Fed’s “Producer Price Index by Commodity for Crude Materials for Further Processing” to more closely reflect commodity price trends, and to reduce the additional considerations of changes in processing margins over time. The one-year interest rate is preferred to the original evidence of Gibson’s Paradox, which used the yield on undated British Government Consols stock as being the only continual information on rates available, because we need to more firmly link the evidence to modern interest rate policies.
Looking at the chart, it is hardly surprising that Gibson’s Paradox was quashed from the time of the Nixon Shock in 1971, when the US unlocked a huge rise in the gold price by ending the Bretton Woods Agreement. Instead, the gold price took on a life of its own, driving down wholesale prices priced in gold for the next nine years. The rise in the index from 1980 to 2000 reflected gold’s subsequent bear market when gold fell from $800 to $250, but the influence of Gibson’s Paradox appears to have returned thereafter.
This conclusion might be considered suspect; but the chart tells us that not only are producer prices at their lowest for thirty-five years when measured in sound money, the price level also coincides with zero interest rates. In theory, it accords precisely with Gibson’s Paradox. So where do we go from here?
There is only one way for interest rates to go from the zero bound, it being only a matter of time, time which according to the Fed is now running out. Commodity prices in their role as raw materials therefore seem set to rise with interest rates, if the Paradox is still valid. Furthermore, the evidence from this analysis suggests that wholesale prices are suppressed even more than the price of gold. This being the case, when the interest rate cycle turns the potential for higher raw material prices measured in dollars could be truly spectacular, even more so in the event the gold price rises at the same time, which seems likely in the event that financial markets become destabilised by higher interest rates.
It is worth repeating at this point that the economic consensus, which adheres to the quantity theory of money and has been comforted by the apparent absence of consumer price inflation in the wake of the post-Lehman monetary expansion, takes a diametrically opposite view to that indicated by the Paradox. The prospect of a turn in the interest rate cycle is expected to drive the dollar’s exchange rate higher still, weakening commodity prices and gold even further. In the language of the dealers, everyone is on the same side of the trade, meaning the dollar is technically over-bought and commodities over-sold.
Gibson’s Paradox says it will turn out otherwise, and it could be central to linking the cyclical relationship between interest rates, securities markets, and commodity prices. It becomes much easier to see how these relationships tie together. Rising interest rates would almost certainly be accompanied by a potentially large fall in overpriced bond and stock markets as speculative positions are unwound, the former even undermining bank solvency ratios.
The flight of speculative capital from falling markets has to go somewhere, particularly if cash balances held in the banks are at a growing risk from systemic default. The Paradox tells us that these are the conditions for commodities to become the safe haven of choice for the highest levels of speculative money ever recorded since fiat currencies dispensed with their golden anchor. Ergo, Gibson’s Paradox probably still holds.
*All three quotes are taken from Barsky & Summers, National Bureau of Economic Research Working Paper No. 1680, (August 1985).
end
(courtesy GATA/Reuters)
Now even Reuters acknowledges gold market rigging ….
A London-based trader with an investment bank agreed the lead seller might not be from Asia. “The selling was on Comex and could also be a non-Chinese fund just executing in what they thought was an illiquid timezone to get the biggest move,” the trader said. …
… For the remainder of the report:
http://www.reuters.com/article/201
… but like all news services Reuters may need another few hundred years before it questions any central bank about its surreptitious trading.
* * *
Bullion Dealers Trade Blame in Hunt for ‘Bear Raid’ Leader
By Manolo Serapio Jr. and Ruby Lian
Reuters
Thursday, July 23, 2015
As the global bullion market continues to reel from a dramatic plunge in gold prices on Monday, traders from Hong Kong to New York are pointing the finger at others for being behind the move while struggling to unmask the mystery sellers.
In early Asian trading hours on Monday, investors dumped more than $500 million worth of bullion in New York in four seconds with selling occurring almost simultaneously on Chinese markets.
end
More and more commentaries from the mainstream media on the dysfunctional gold markets
(courtesy Marcia Christoof-Kurapovna/Mises)
Marcia Christoff-Kurapovna: Central banks and our dysfunctional gold markets
11:20a ET Thursday, July 23, 2015
Dear Friend of GATA and Gold:
GATA’s account of gold market rigging has made its way to the Mises Institute, thanks to an essay by financial writer Marcia Christoff-Kurapovna, “Central Banks and Our Dysfunctional Gold Markets.” Your secretary/treasurer even gets quoted, which doesn’t happen much on this planet.
Christoff-Kurapovna writes: “Many investors still view gold as a safe-haven investment, but there remains much confusion regarding the extent to which the gold market is vulnerable to manipulation through short-term rigged market trades and long-arm central bank interventions. First, much of the gold that is being sold as shares, in certificates, or for physical hoarding in dubious ‘vaults’ just isn’t there. Second, paper gold can be printed into infinity just like regular currency. Third, new electronic gold pricing — replacing, as of this past February, the traditional five-bank phone call of the London Gold Fix in place since 1919 — has not necessarily proved a more trustworthy model. Fourth, there looms the specter of the central bank, particularly in the form of volume trading discounts that commodity exchanges offer them.”
Her essay is posted at the Mises Institute’s Internet site here:
https://mises.org/library/central-banks-and-our-dysfunctional-gold-marke…
CHRIS POWELL, Secretary/Treasurer
Gold Anti-Trust Action Committee Inc.
CPowell@GATA.org
end
(courtesy Dave Kranzler/IRD)
The last two reporting gold withdrawals (equals citizen gold demand) came to 106.10 tonnes of gold
Last week’s week reporting: 61.8 tonnes
two weeks ago: 44.3 tonnes
Two Week Shanghai Gold Exchange Withdrawals Exceed All 2014 Comex Deliveries
The Shanghai Gold Exchange is the only major official physical gold trading market in the world. All trades on the exchange are settled with the exchange of ownership on physical gold bullion. Paper future contracts do not trade on the SGE. In contrast, trading occurs on the LBMA and Comex in paper gold. The Comex is de facto a 99.999% paper gold exchange for which the percentage metal backing the paper traded is minuscule. The LBMA has been rapidly “catching up” to the Comex in this regard, although on a percentage basis the LBMA experiences a higher amount physical gold exchanged than the Comex.
Because of the way in which the SGE functions, gold withdrawn from the SGE measures the true demand for gold in China in a given time period. All gold – except for the gold purchased by the Peoples Bank of China – purchased by any form of end user must pass through the SGE by law. It is for this reason that “withdrawals” represent the most accurate measurement of demand for gold in China – except the Central Bank’s demand.
In the past two weeks, 106.1 tonnes of gold were withdrawn from the SGE. As Smaulgld.com has observed:
Gold withdrawals on the Shanghai Gold Exchange the past two weeks were larger than the amount of gold delivered on COMEX during 2014 and greater than the amount of gold Germany has repatriated from the New York Fed since 2013.LINK
I’ll point out one minor correction to the fact above: it’s more gold than the U.S. Government has been able to repatriate back to Germany.
Year to date SGE withdrawals are 1,260 tonnes. This translates into an approximate annualized run-rate of 2400 tonnes – with one of heaviest seasonal periods of Chinese gold demand still to come.
I find it fascinating how the entire world, including and especially the U.S. media, has summarily dismissed the unwillingness of the U.S. Government to return Germany’s gold. Recall, Germany originally asked for over 600 tonnes of gold to be returned. This was after the Fed refused a request by a German delegation to inspect its gold (the Fed allowed the delegation into one of the nine vaults where the gold is supposedly being “safekept”).
If the gold is there and it belongs to Germany, why is the U.S. Government dragging it’s feet on this matter? The question, of course, is highly rhetorical. With China moving more gold into the country and delivering to the entities who pay for this gold, transportation and delivery is not the issue.
At some point in the future, I have no idea when and neither does anyone else, there will be a massive upward explosion in the price of gold which is ignited by investors and Governments holding paper gold and who make move to take delivery of physical gold that no longer exists in the custodial vaults listed on their paper claims
end
And now your overnight trading in bourses, currencies, and interest rates from Europe and Asia:
1 Chinese yuan vs USA dollar/yuan weakens to 6.2095/Shanghai bourse green and Hang Sang: green
2 Nikkei up 90.28 or 0.44%
3. Europe stocks mixed (slightly up/slightly down) /USA dollar index down to 97.01/Euro up to 1.0990
3b Japan 10 year bond yield: rises to 42% !!!!(Japan buying 100% of bond issuance)/Japanese yen vs usa cross now at 123.80
3c Nikkei still just above 20,000
3d USA/Yen rate now just below the 124 barrier this morning
3e WTI 49.18 and Brent: 55.98
3f Gold up /Yen up
3gJapan is to buy the equivalent of 108 billion uSA dollars worth of bond per month or $1.3 trillion. Japan’s GDP equals 5 trillion usa.
Japan to buy 100% of all new Japanese debt and by 2018 they will have 25% of all Japanese debt. Fifty percent of Japanese budget financed with debt.
3h Oil up for WTI and down for Brent this morning
3i European bond buying continues to push yields lower on all fronts in the EMU. German 10 yr bund falls to .73 per cent. German bunds in negative yields from 4 years out.
Except Greece which sees its 2 year rate rises to 24.70%/Greek stocks this morning: still expect continual bank runs on Greek banks /
3j Greek 10 year bond yield rises to: 11.98%
3k Gold at $1101.80 /silver $14.87
3l USA vs Russian rouble; (Russian rouble par in roubles/dollar in value) 57.44,
3m oil into the 49 dollar handle for WTI and 55 handle for Brent/Saudi Arabia increases production to drive out competition.
3n Higher foreign deposits out of China sees huge risk of outflows and a currency depreciation. This can spell financial disaster for the rest of the world/China may be forced to do QE!!
30 SNB (Swiss National Bank) still intervening again in the markets driving down the SF. It is not working: USA/SF this morning .9551 as the Swiss Franc is still rising against most currencies. Euro vs SF is 1.0498 well below the floor set by the Swiss Finance Minister. Thomas Jordan, chief of the Swiss National Bank continues to purchase euros trying to lower value of the Swiss Franc.
3p Britain’s serious fraud squad investigating the Bank of England/
3r the 4 year German bund remains in negative territory with the 10 year moving closer to negativity at +.76%
3s The ELA rose another 900 million euros to 90.4 billion euros. The bank withdrawals were causing massive hardship to the Greek bank. the Greek referendum voted overwhelming “NO”. Greece votes again and agrees to more austerity even though 79% of the populace are against.
4. USA 10 year treasury bond at 2.32% early this morning. Thirty year rate above 3% at 3.04% / yield curve flatten/foreshadowing recession.
5. Details Ransquawk, Bloomberg, Deutsche bank/Jim Reid.
(courtesy Jim Reid/Bloomberg/Deutsche bank/zero hedge)
Futures Drift Higher, Dollar Slides In Quiet Session
A slow week devoid of virtually any macro news – last night the biggest weekly geopolitical event concluded as expected, when Greece voted to pass the bailout bill which “the government does not believe in” just so the ECB’s ELA support for Greek depositors can continue – is slowly coming to a close, as is the busiest week of the second quarter earnings season which so far has been largely disappointing despite aggressive consensus estimate cuts, especially for some of the marquee names, and unlike Q1 when a quarterly drop in EPS was avoided in the last minute, this time we won’t be so lucky, and the only question is on what side of -3.5% Y/Y change in EPS will the quarter end.
Equities remain in focus today, with earning season in full swing as high profile names Credit Suisse (+6.9%), Daimler (0.5%), Roche (+1.0%) and Unilever (+2.3%) all report their earnings. With macro news relatively light, equities have traded without direction this morning (Euro Stoxx: +0.2%), while on a sector specific basis, energy and material names underperform after the recent weakness in the commodity sector.
Bunds reside in positive territory this morning, with no European supply scheduled for today, while T-Notes are relatively flat on the day as participants await the main US data of the day in the form of the weekly jobs numbers and the US 15bIn 10yr TIPS Auction. While elsewhere today, earnings include McDonald’s, Visa, Amazon, Comcast and Bristol Myers.
Asian equities traded mixed following the lacklustre close on Wall Street, where the Nasdaq-100 underperformed following the poor earnings from Apple. Nikkei 225 (+0.4%) traded higher as exporters benefit from a weaker JPY. ASX 200 (-0.4%) fell following the continued slump in commodity prices, while Chinese markets are set for their longest winning streak in 2 months, after the PBoC conducted a net injection of CNY 35b1n into the interbank market.
The only tier 1 data of the European morning saw UK retail sales come out lower than expected in all readings, with Y/Y spending growth the weakest since Q2 2013 (UK Retail Sales Ex Auto Fuel Y/Y 4.20% vs. Exp. 5.10%). As such, GBP saw immediate weakness as GBP/USD broke back below the 1.5500 handle and EUR/GBP broke back above the 0.7000 handle after yesterday’s GBP strength on the back of BoE minutes meeting highlighting some members considering a ‘fine balance’ between voting for a rate hike or not.
Apart from GBP weakness, FX markets have been dominated during the European session by USD weakness (-0.4%) amid no fundamental news with price action in EUR/USD magnetised by the looming option expiry at 1.1000 level (1.9bIn).
Elsewhere, the Greek parliament voted in favour of approving the bailout prior actions bill in a 230 to 63 vote with 5 abstaining, however this was widely expected and saw no reaction in EUR. NZD strengthened after RBNZ cut the OCR by 25bps to 3.00% as expected, which supported the currency as markets were one-sided heading into the decision, while the central bank also omitted its statement that the currency was at an unjustifiable level.
As well as the aforementioned US weekly jobs numbers from the US, today also sees participants look out for comments from ECB’s Weidmann.
The commodity complex has seen prices come off their worst levels amid the recent weakness throughout both the metals and energy complexes . Despite residing in positive territory on the day, WTI remains below firmly below the psychological USD 50/bbl handle, while spot has broken above the USD 1100 handle during the European morning on the back of aforementioned USD weakness.
Looking ahead, today sees the EIA NatGas Storage Change (1530BST/0930CDT), which is expected at 68, of note NatGas outperforms its energy counterparts with analysts at BNP attributing the strength to July weather being hotter than expected.
On today’s US event calendar we get initial jobless claims, Chicago Fed national activity index, Conference Board leading index and Kansas City Fed manufacturing activity for July will be the main releases. It’s set to be a busy day for corporate earnings meanwhile with General Motors, Amazon, AT&T, Comcast, Dow Chemical, McDonalds and Caterpillar the notable reporters.
In summary: European shares remain little changed with the basic resources and oil & gas sectors underperforming and tech, health care outperforming. Greek government votes to approve bailout bill. Companies including Daimler, Credit Suisse, Unilever, Syngenta, Roche, STMicro report results. U.K. June retail sales fall, analysts had expected a rise. Japanese exports rise most in 5 months. The Spanish and Italian markets are the worst-performing larger bourses, the Swiss the best. The euro is stronger against the dollar. Irish 10yr bond yields fall; French yields decline. Commodities little changed, with nickel, natural gas underperforming and wheat outperforming. U.S. jobless claims, continuing claims, Bloomberg consumer comfort, Chicago Fed index, leading index, Kansas City Fed index due later.
Market Wrap:
- S&P 500 futures up 0.2% to 2111.5
- Stoxx 600 down 0.1% to 399.9
- US 10Yr yield down 1bps to 2.32%
- German 10Yr yield down 1bps to 0.74%
- MSCI Asia Pacific up 0.1% to 143.9
- Gold spot up 0.7% to $1101.8/oz
- 7 out of 19 Stoxx 600 sectors rise; tech, health care outperform, basic resources, oil & gas underperform
- Eurostoxx 50 +0.2%, FTSE 100 +0.3%, CAC 40 +0.2%, DAX +0.2%, IBEX +0%, FTSEMIB +0.1%, SMI +1.1%
- Asian stocks rise with the Shanghai Composite outperforming and the Sensex underperforming; MSCI Asia Pacific up 0.1% to 143.9
- Nikkei 225 up 0.4%, Hang Seng up 0.5%, Kospi up 0%, Shanghai Composite up 2.4%, ASX down 0.4%, Sensex down 0.5%
- Anthem Said to Be Nearing Deal to Buy Cigna for $48 Billion
- Pearson Says It’s in Advanced Talks to Sell FT Group
- Euro up 0.59% to $1.0993
- Dollar Index down 0.57% to 97.04
- Italian 10Yr yield down 3bps to 1.91%
- Spanish 10Yr yield down 2bps to 1.97%
- French 10Yr yield down 2bps to 1.04%
S&P GSCI Index down 0% to 395.2 - Brent Futures down 0.2% to $56/bbl, WTI Futures down 0% to $49.2/bbl
- LME 3m Copper up 0.1% to $5366.5/MT
- LME 3m Nickel down 0.9% to $11370/MT
- Wheat futures up 0.9% to 521.5 USd/bu
Bulletin Headline Summary from RanSquawk
- USD has weakened throughout the European session amid no fundamental news, heading into the North American crossover lower by 0.4%
- UK retail sales printed than expected in all readings, with Y/Y spending growth the weakest since Q2 2013
- Despite residing in positive territory on the day, WTI remains below firmly below the psychological USD 50/bbl handle, while spot has broken above the USD 1100 handle
DB’s Jim Reid completes the overnight recap
It is quiet at the moment but the renewed weakness in commodities could be a very important macro story as it might end up being the swing factor in forcing the FOMC to delay policy action in H2. So its certainly a big story to watch. Indeed the weakness in commodities was again the overriding theme in markets yesterday, although it was an Apple-led selloff which saw tech stocks tumble leading to another softer session for risk assets yesterday. The S&P 500 (-0.24%) and Dow (-0.38%) both finished down for the second consecutive day, while the NASDAQ (-0.70%) took another leg lower as markets latched on to a poorly taken after-market report from Apple, helping send the share price 4.2% lower on the day. European equity markets saw similar declines with the Stoxx 600 (-0.59%), DAX (-0.72%) and CAC (-0.47%) all closing lower. It was a weaker day for credit also with CDX IG closing 1.2bps wider and Crossover ending 7bps wider.
Looking at bourses in Asia this morning it’s been a fairly mixed follow up with the Kospi (-0.46%) and ASX (-0.22%) both trading lower, while the Nikkei (+0.35%), Hang Seng (+0.38%) and Shanghai Comp (+0.75%) have moved higher – the latter after a soft start. S&P 500 futures (+0.2%) are pointing towards a modestly firmer open, while credit indices in Asia are unchanged. Trade data out of Japan has been the main point of focus. Despite exports rising less than expected (+9.5% yoy vs. +10% expected), the reading was the highest since January helping to shrink the deficit to ¥69bn (vs. expectations of a surplus of ¥45.8bn) from ¥217bn in May. Imports fell 2.9% yoy last month (vs. -4.3% expected), the smallest contraction since November but the sixth straight monthly decline.
Greece has also been in focus overnight after the Greek parliament approved a second round of reform measures in another stepping stone towards a third bailout package, passing the vote with a 230 to 63 majority while support from Syriza rose slightly after 36 lawmakers failed to support the legislation, down from 39 in the first vote. Speaking in the early hours this morning, Greek PM Tsipras once again reiterated that he will implement the program that he doesn’t believe in, adding that ‘conservative forces within Europe still insist on their plans to kick Greece out of the Euro’. The result also comes after the latest ECB decision to raise the ELA cap by €900m, keeping the pressure on Greek lenders tight.
Back to yesterday, as well as a softer day for S&P 500 tech names (-1.64%), energy stocks (-0.64%) also contributed to the declines on the back of further weakness in the commodity space. Despite Tuesday’s bounce back, oil markets extended their rough stretch with WTI (-3.28%) and Brent (-1.60%) tumbling to $49.17/bbl and $56.13/bbl respectively. The latest leg down in WTI saw it drop back down below $50 and is now $10 lower than where it was at the end of June, nearing a bear market after losing almost 20% in the last six weeks. The latest inventory numbers out of the EIA yesterday certainly didn’t help after stockpiles rose 2.5m barrels following expectations of a drawdown. OPEC, in their latest update meanwhile said that the latest drop in prices this month is likely to be short term and won’t stop them from maintaining output at high levels to defend market share. It wasn’t just oil markets which felt the pain yesterday as Gold wiped out all of Tuesdays gains (and more) to close 0.64% lower at $1094/oz and at a fresh five year low. There’s been little response in the commodity space this morning. WTI and Brent are +0.12% and -0.09% respectively while Gold (+0.39%) has rebounded a little.
There wasn’t a whole lot to report in sovereign bond markets yesterday. 10y Treasuries closed more or less unchanged (-0.2bps) at 2.324% after a choppy session, while similar maturity Bunds were 3.4bps lower at 0.745% and yields in the periphery fell 2-3bps. It was a slightly firmer day for the Greenback with the Dollar index closing up +0.28%.
Yesterday’s data was focused on more second tier releases in the housing sector in the US. June existing home sales bounced in June (as expected with what the pending home sales suggested), rising +3.2% mom (vs. +0.9% expected) to an annualized rate of 5.49m, the highest level in eight years. The FHFA house price index meanwhile was as expected at +0.4% mom, unchanged from the previous month. Over in Europe the lone releases were centered in France where we saw business (99 vs. 98 expected) and manufacturing (102 vs. 101 expected) confidence indicators both come in ahead of expectations.
The Bank of England minutes from the July meeting was the main point of focus closer to home meanwhile. The minutes reflected more of the hawkish rhetoric that we’ve seen of late from BoE members. The text noted that for a number of members, the balance of risks to medium-term inflation relative to the target was becoming more skewed to the upside with rates at current levels. Interestingly however and unlike what we saw in the latest FOMC release there was more of an acknowledgement to the risks emanating from Greece with the minutes stating that ‘for these members, the uncertainty caused by recent developments in Greece was a very material factor in their decision; absent that uncertainty, the decision between holding the bank rate at its current level versus a small increase was becoming more finely balanced’. It’s worth noting that the last meeting was held before the recent progress in Greece. Sterling had a better day on the back of the minutes, finishing 0.36% higher versus the Dollar.
Before we turn over to today’s calendar, the FT ran an interesting story highlighting that Government debt in the eurozone has now reached a record high despite signs of an (albeit slow) economic recovery, highlighting the legacy left behind by the financial crisis. The latest Eurostat data released yesterday showed that at the end of Q1’15, Debt/GDP reached 92.9%, up from 92.0% at Q4’14 and 91.9% in the same period last year and led by Greece (169%), Italy (135%) and Portugal (130%). Although it’s certainly probable that ultra low rates have enticed greater demand for borrowing, the data still highlights that at an aggregate level, the deleveraging story in Europe is still yet to begin despite it now being 8 years since the first signs of the global financial crisis.
Turning over to today’s calendar now, it’s another relatively quiet day for European data with just Euro area consumer confidence and UK retail sales expected. Over in the US, initial jobless claims, Chicago Fed national activity index, Conference Board leading index and Kansas City Fed manufacturing activity for July will be the main releases. It’s set to be a busy day for corporate earnings meanwhile with General Motors, Amazon, AT&T, Comcast, Dow Chemical, McDonalds and Caterpillar the notable reporters.
Greek Lawmakers Clear The Way For Formal Bailout Discussion
As expected, the Greek parliament has approved a second set of prior measures, clearing the way for formal discussions on a third bailout program for the debt-stricken country.
As Bloomberg notes, “several lawmakers of governing Syriza party, including Parliament Speaker Zoi Konstantopoulou, former deputy Finance Minister Nadia Valavani didn’t support bill.”

As a reminder, Wednesday’s vote was largely a formality as the measures – which included EU rules on bank resolutions and civil justice reform – weren’t expected to be as contentious as those presented to lawmakers last week. Alexis Tsipras is desperately trying to regain the support of Syriza MPs who have refused to support the conditions creditors have attached to the €86 billion ESM aid package.
Although negotiations will now likely begin within the next few days, another vote (on pensions and taxes for farmers) is expected during the first week of August.
Earlier today, MNI – citing unnamed sources – reportedthat Tsipras will look to hold elections as soon as the third bailout is in place. Greek government officials promptly denied the report.
As a reminder, here’s what’s next for Greek politics, courtesy of Deutsche Bank.
* * *
From Deutsche Bank
Potential political paths ahead
We see the situation as potentially leading to three different political outcomes over the next few weeks.
The first is near-term political instability that would put ESM negotiations on hold and return pressure on the Greek banking system ahead of the August 20th ECB bond redemption. This would be provoked by the PM tendering his government’s resignation either by losing additional government MPs in coming parliamentary votes or by losing support in the party’s Central Committee. Either would not necessarily cause a general election, with a government of national unity under very limited SYRIZA MP support possible until ESM talks are concluded (only 48 out of 149 MPs would be needed). Irrespectively, talks would be delayed, and the possibility of a more substantial shift in the SYRIZA position against the agreement could not be ruled out, whether before or after a new general election.
The second potential outcome is a Greek PM decision to more aggressively position himself against internal party dissent and in favour of program implementation. This would likely involve a request from dissenting MPs to resign their parliamentary seats or, in case of refusal, exclusion from the SYRIZA parliamentary group. Such a decision would aim to consolidate the PM’s influence, with the ultimate aim of moving the party towards a more moderate direction in a future general election. Current electoral law stipulates that a general election within 12 months of the last one takes place under a “list” system, providing the Greek PM with the political cover to steer SYRIZA’s candidate list towards a more moderate direction.
Still, any such decisions need to be approved by the party’s Central Committee. The latter is similarly responsible for excluding members from the party, even if the PM excludes MPs from the parliamentary group. Any such decision therefore requires the PM to take the risk of more formally splintering the party, with potential unpredictable results given his more uncertain influence over the party’s Central Committee
The third – and what we believe the most likely outcome in coming weeks – is a continuation of the last few days’ status quo: persistent attempts by the PM to work through internal party dissent as well as the ESM negotiations, but without actively precipitating political change. In this instance the Greek PM would continue to preside over a de facto minority government, even if this is not explicitly acknowledged. A confidence vote may be called but dissenting MPs would still vote in favour and/or opposition parties would abstain. Any eventual ESM agreement would be ratified by a broad parliamentary majority, but with very strong SYRIZA dissents. Early elections could be called after. The benefit to this outcome is that near-term political uncertainty would be avoided, with dissenting and non-dissenting SYRIZA MPs as well as the opposition likely wanting to avoid near-term political instability. The cost would be that government commitment to the agreement would remain weak, maintaining the risk of a breakdown in negotiations as ESM negotiations get under way.
Whatever the outcome above, events over the next few weeks are most likely to continue to be driven by the PM’s personal decisions as well as internal developments within SYRIZA. This will in turn depend on the ongoing economic and political cost of program implementation, with large upfront fiscal tightening already being legislated but additional fiscal and structural reform commitments needed to conclude the 3rd ESM program negotiations. The PMs own approval ratings will also matter, with opinion polls released after the negotiations continuing to show higher popularity ratings than other political leaders as well as a strong SYRIZA lead over other opposition parties. It remains to be seen how long this persists given the economic costs of the agreement, but the longer support is maintained, the greater the PM’s influence over internal party politics is likely to be.
The endgame
Irrespective of the near-term outcomes above, the inherent contradiction of program implementation by a government from within which the bulk of opposition originates will have to be resolved. It is unlikely that uncertainty around the stability of the Greek economy and banking system recedes until this is the case.
Resolution could be led by Greek PM and current party president Tsipras moving SYRIZA in a more moderate direction followed by an early general election later this year after ESM negotiations have concluded. This would increase the odds of a government with greater commitment to implementation, irrespective of the electoral outcome. It would however risk a major splintering of the party or Tsipras’ own loss of authority in the process. An alternative is that the party retains its own internal contradictions, but that a government of national unity with broader-based participation is formed irrespectively. However, it remains unclear if this could materialize without an early general election, which the opposition may eventually request.
Either way, implementation risks are likely to remain strong until greater political change materializes, likely driven by the strong internal contradictions within the current ruling party, but ultimately settled by the Greek PMs own political initiatives.
Grexit Remains Most Likely Outcome For JPMorgan
On Wednesday evening, Greece took another step toward transforming itself into a vassal state of Brussels when lawmakers passed a second set of prior actions ahead of formal discussions around a third program for Athens. The vote itself was largely a formality, as the measures under consideration – which included EU rules on bank resolutions and civil justice reform – weren’t as contentious as those Tsipras crammed through parliament last Thursday.
Nevertheless, the vote was important as a litmus test for Syriza. Tsipras executed a cabinet reshuffle late last week after 39 members of his coalition failed to support the first set of bailout prior actions, and analysts were watching Wednesday’s vote closely to see if more Syriza MPs rebelled.
While the number of defectors fell, 31 still failed to support the measures, betraying a still-divided party heading into what are expected to be weeks-long negotiations between Athens and Brussels on the final terms of the third bailout. Here’s more color from BBC:
After another long debate, and plenty of angry exchanges, parliament approved the new reforms in the early hours of the morning.
More than 30 MPs from the governing coalition voted against the measures – but crucially for Alexis Tsipras the number of rebels was slightly lower than last week.
Mr Tsipras was defiant telling parliament that he didn’t really approve of the deal that had been imposed upon him by the rest of the eurozone. But he stressed that it was the only way to keep Greece in the single currency.
Negotiations will now begin on approving the terms of a third bailout, with the aim of completing a deal by the middle of next month.
It’s a tight timetable with scepticism on both sides. And Mr Tsipras still has to decide whether a successful conclusion of negotiations should be followed by early elections.
Yes, early elections, which MNI suggested will occur immediately following the implementation of the new program (Greek officials promptly denied this “rumor”).
Whatever the case, Deutsche Bank is unquestionably correct that there’s something quite absurd about the adoption of the new bailout terms being left to a government whose leader openly opposes the deal. “The inherent contradiction of program implementation by a government from within which the bulk of opposition originates will have to be resolved,” the bank said on Wednesday.
And Deutsche isn’t alone in their skepticism. Here’s JP Morgan on why no one “should put the odds of Greece staying in the euro above 50%”.
From JP Morgan
Greek politics and an economy in flux
The path ahead looks long and difficult. The program is likely to impose a significant fiscal tightening on an economy which is already back in recession, is struggling with a dysfunctional banking system, and where confidence has suffered a big shock. It is tough to know how near-term downward pressure on activity will interact with Greek politics. For many Northern European countries the third program represents a “last chance” for Greek participation in the euro to be made viable. Hence, discussion likely will turn to euro exit immediately should the program fail to be agreed or implemented.
For now, we would not put the odds of Greece staying in the euro area above 50%.
Few in Syriza genuinely support the new program, and we would expect Syriza will seek every opportunity to renegotiate. Given doubts about implementation, the creditors are likely to be unusually prescriptive about the specific steps the Greek authorities are expected to take. The negotiations on the design of the program will be difficult. Prime Minister Tsipras has been forced to rely on support from opposition parties to pass the required legislation through the Greek parliament. However, he appears to have limited that loss of support to the hard-left of his own party. Meanwhile, polls suggest his personal approval rating remains high, and that new elections would see a Syriza administration returned if they were called now. Hence, there has been speculation that Prime Minister Tsipras could prompt snap elections, with his government standing down and preventing another one being formed. Though it is not clear whether that will occur, there is clearly potential for Greek political developments to complicate either the negotiations on the program design or its implementation. And if we do move toward new elections, it remains to be seen how Syriza will square its policy platform with the measures being demanded from the rest of the region for Greece to remain in the Euro.
The proposals from the Greek side prior to the July 5 referendum had suggested fiscal tightening amounting to more than 2% of GDP to be implemented immediately, with a further 1% of GDP to follow at the beginning of 2016. The VAT and pensions measures legislated thus far amount to near 0.5% of GDP. It will be important to see the extent to which the third program sees further fiscal tightening implemented in the near term. The extent of such tightening could be moderated by greater prioritization of privatization and structural reform. But the desire from the rest of the region to limit program financing needs, and an emphasis on more easily verifiable measures, is likely to mean hefty fiscal tightening in the near term. Indeed, the summit statement called for introducing “quasi-automatic spending cuts in the event of deviations from ambitious primary surplus targets.”
Meanwhile, the capital controls regime will be an administrative challenge for the Greek government, as the need to pay for imports of food, fuel, medical supplies, and inputs for industry all compete with the need to keep capital outflows down. There are already reports of supply chain difficulties from this source, which add further downward pressure on activity. Although the recent summit saw the region avoid a Greek euro exit, the coming quarters are likely to be very difficult for the economy, and the mutual distrust between Greece and its creditors is likely to remain. Completing the negotiations on a third program and beginning to implement it may be enough to push the odds of Greece staying in the euro back above 50%. But until that occurs, and even after, we still see plenty of scope for conflict to re-emerge.
end
The IMF is very concerned about Japan stating its debt is unsustainable:
they must have read Kyle Bass’ excellent work on Japanese debt
(courtesy zero hedge)
JPY Slides After IMF Warns Debt Is “Unsustainable”
It appears The IMF is willing to shake the boat of status quo, everything-is-awesome, once again. After proclaiming Greece is screwed and needs a haircut no matter what, the bank to save the world has unleashed a new report on Japan…
- *IMF SAYS JAPAN NEEDS DEEPER CUTS TO CURB ‘UNSUSTAINABLE’ DEBT
- *IMF: YEN MODERATELY WEAKER THAN IS CONSISTENT WITH FUNDAMENTALS
- *JAPAN DEBT RISKS SURGE TO TRIPLE GDP WITHOUT CHANGE, IMF SAYS
We assume Abe and Kuroda will disagree strongly, argue that they just need a little more devaluation and everything will be perfect. The slide in JPY suggests some more capital leaving their shores.

“No Longer Confined To The Lunatic Fringe”: SocGen Admits Markets Are Completely Manipulated
Perhaps the most interesting thing about China’s “unprecedented” plunge protection efforts – which, as we outlined on Wednesday, have succeeded in making China Securities Finance Corp. a top-10 shareholder in at least eight firms – is that in some ways, they aren’t “unprecedented” at all. That is, while some of what we’ve seen out of Beijing over the past month – notably the sweeping trading halts and the Politburo agitprop campaign aimed at “malicious” foreign short sellers – was more overt than what we might expect to see in more “developed’ markets, there’s certainly nothing terribly unusual about a central bank propping up equities.
After all, the BoJ is well on its way to cornering the ETF market in Japan and, as a matter of policy, steps in to support Japanese stocks when sentiment appears weak, while the SNB has amassed a stock portfolio worth nearly $100 billion. As for the US, well, we’ve made no secret of our feelings about the slightly more than arms-length arrangement between the NY Fed and Citadel.
Meanwhile, US corporate management teams are also in the business of propping up stocks as buybacks have served to replace the monthly flow lost to the taper.
Considering the above, one is certainly left to believe that the term “market” may have lost all meaning in the seven years since the crisis. Here with a rather shockingly honest lament on manipulated markets, the disappearance of Benjamin Graham’s “voting machine”, and perhaps most importantly, a vindication of the tinfoil hat fringe blogs, is SocGen.
* * *
Via SocGen
No longer a voting machine
If in the short run, to paraphrase Benjamin Graham, equities are a voting machine, then it seems many of these votes are being coerced by interventionists.China is not alone in trying to influence equity prices, central bankers the world over have become obsessed with asset prices, to the extent that the notion of central banks making outright purchases of equities is no longer confined to the lunatic fringe. Of course none of these institutions are remotely interested in ‘weighing up’ the long-term returns. If they were, given the absence of attractive valuations and actual cash flow growth, they might be a little more circumspect in their cheerleading.
Corporate executives, who are rewarded for achieving EPS and share price targets, typically in the form of stock options, are also experts in the art of creating a short-term positive market impression. And to great effect, given the (literally) incredible performance of some tech stocks last week. Positive price momentum is a powerful force and one that few corporates are likely to readily interrupt with bad news. So while ‘prudence accounting’may inform GAAP earnings, it seems largely absent from many of the pro-forma figures corporates would like us to focus on.
One of our favourite charts below highlights the extent to which near-term earnings are influenced (manipulated …?) by the approaching reporting season. Earnings are usually cut immediately prior to reporting only to see them beaten during that season. We call these “just in time” consensus forecasts. The problem with these manufactured surprises is they create a false impression as ultimately there is no follow-through to higher future expectations – the trend in earnings is still down. So perhaps it is best not to be short during the reporting season.

* * *

Bridgewater’s Ray Dalio Loses His Cool On China: “There Are No Safe Places Left To Invest”
China matters after all. As recently as three weeks ago, Bridgewater – the world’s largest hedge fund – was among the most effusively bullish on China deflecting fears of the stock market drop on the basis that its “movements are not significant reflective of, or influential on, the Chinese economy.” However, that meme that has been spewed by endless talking heads protecting their assets under management, has evolved. In his latest letter to investors, Ray Dalio warns, “our views on China have changed… there are no safe places to invest.” As WSJ reports, the move adds to a growing chorus of high-profile investors who are challenging the long-held view that China’s rise will provide a ballast to a whole host of investments, from commodities to bonds to shares in multinational firms, as they realize, “it appears that the repercussions of the stock market’s declines will probably be greater.”
As The Wall Street Journal reports,
The move adds Mr. Dalio and Bridgewater to a growing chorus of high-profile investors who are challenging the long-held view that China’s rise will provide a ballast to a whole host of investments, from commodities to bonds to shares in multinational firms. For a generation, bets on China’s rising middle class have been commonplace on Wall Street and beyond as investors have looked to diversify their holdings.
But with the country’s stocks on a roller-coaster ride this summer, those beliefs are being tested. The world’s second-largest economy faces renewed questions about the sustainability of its growth and the government’s commitment to loosening its grip on the country’s heavily controlled markets.
And so as Bridgewater’s Ray Dalio explains, our views about China have changed as a result of recent developments in the stock market.
We previously conveyed our thinking about the debt and economic restructurings being negative for growth over the near term and positive for growth over the long term—i.e., that it is a necessary and delicate operation that can be well managed. While we had previously considered developments in the stock market to be supportive to growth,recent developments have led us to expect them to be negative for growth. While we would ordinarily consider the impact of the stock market bubble bursting to be a rather small net negative because the percentage of the population that is invested in the stock market and the percentage of household savings invested in stocks are both small, it appears that the repercussions of the stock market’s declines will probably be greater.
Because the forces on growth are coming from debt restructurings, economic restructurings, and real estate and stock market bubbles bursting all at the same time, we are now seeing mutually reinforcing negative forces on growth. While at this stage it is too early to assess how strongly the stock market’s decline will pass through negatively to credit and economic growth, we will soon have indications of this. We will be watching our short-term indicators of Chinese credit and economic growth carefully to see what the pass through to the economy of these developments is like.
We have seen this happen before, and as Dalio explains, this creates a not insignificant drag on growth…
The stock market and debt bubble bursting simultaneously has happened many times before in many countries. We identified 28 cases among major economies in the last 100 years. While no two cases are exactly the same, the basic dynamics of such cases and the tools for treating them are essentially the same. Looking at these other cases provides perspective concerning the range of possible outcomes and the most effective ways of using the available tools. The most analogous cases created a depressant on real GDP growth of 1.8% on average, annually, for three years relative to what growth would have been without these events; bad cases saw an annual drag of 4% for three years; and, well managed cases saw no drag over three years (i.e., growth averaging its potential). We would expect China’s outcome to be within that range, depending on how Chinese policy makers use their tools.
The negative effects of the stock market declines will come from both the direct shifts in wealth and the psychological effects of the stock market bubble popping. Though stock prices are significantly higher than they were two years ago, the average investor in the stock market has lost money because more stocks were bought at higher prices than were bought at lower prices. We now estimate stock market losses in the household sector to be significant—i.e., about 2.2% of household sector income and 1.3% of GDP. However, these losses appear to be heavily concentrated in a small percentage of the population as only 8.8% of the population owns stocks. These are rough estimates. We don’t yet know who is experiencing what losses. Such information usually surfaces in the days and weeks after the plunge. Even more important than the direct financial effects will be the psychological effects.
As Ray Dalio concludes,
Even those who haven’t lost money in stocks will be affected psychologically by events, and those effects will have a depressive effect on economic activity.
For example, there are now no safe places to invest and the environment looks riskier, which we would expect to encourage the holding of cash and lessen the marginal effectiveness of easing monetary policy.
end
by Wolf Richter • July 22, 2015


Maybe we shouldn’t take our daily corporate samples too seriously. Maybe they don’t adequately represent the global economy. So IBM’s revenues last quarter plunged 13% from a year ago. It blamed China and the dollar, among other culprits. But IBM’s revenues have dropped for 13 quarters in a row. It’s a normal IBM condition and not a reflection of the global economy.
A whole slew of other tech companies chimed in with either disappointing revenues or disappointing outlooks, or both, each blaming a variety of issues, among them China and the dollar. Chip maker Qualcomm just reported a 14% plunge in its quarterly revenues. It’s having trouble in the smartphone market and will lay off a bunch of people. But maybe they’re just running into tougher competitors, rather than a lousy global economy. And the PC business, which is cratering, is dragging down all those involved. That’s structural and has little to do with the state of the global economy.
Then there’s industrial giant United Technology which reported that its revenues last quarter dropped 5%. Today Caterpillar reported that global machine sales plunged 15% in June compared to a year ago, after having dropped 12% in May and 11% in April, In Asia, machine sales plunged 19%, in Latin America 50%. And in booming North America? Down 5%, after having been up for the prior two months.
So CAT is facing Japanese, Chinese, and German competitors. It’s having to slug it out with them in China precisely when China is slowing. So it may be just CAT that’s having a hard time.
But don’t look at energy. Energy is getting clobbered….
So maybe we’re cherry-picking negative data. There are companies with actual revenue increases and positive outlooks, like Equifax, the credit bureau, which just reported a 10% jump in revenues (14% “in local currency,” as it says). Consumer borrowing is king, and Equifax expedites the process.
So what the heck is going on?
Turns out, global trade during the quarter and during the first five months of the year experienced the sharpest drop-off since the Financial Crisis.
The CPB Netherlands Bureau for Economic Policy Analysis, a division of the Ministry of Economic Affairs, just released its latest Merchandise World Trade Monitor, which covers global import and export volumes. It was dreary.
World trade shrank 1.2% in May from the previous month. The index fell to 135.1, the lowest level since July 2014, having dropped nearly every month so far this year. It’s down 4.7 points from its peak in December, the sharpest and longest decline since the Financial Crisis.
This chart, going back to January 2012, shows the very crummy state of the global economy, expressed in global trade:
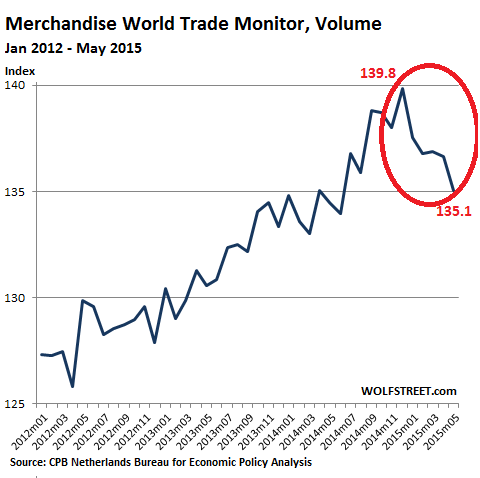
To smoothen out the volatility of these sorts of monthly numbers – though there hasn’t been much volatility this year, it’s been just down – the CPB offers a measure of trade volume “momentum,” which it defines as “the change in the three months average up to the report month relative to the average of the preceding three months.”
That trade momentum measure slumped 1.3% in May, after having dropped 1.2% in April. It now amounts to the most negative “momentum” since the Financial Crisis.
The report explains: “Import and export momentum were close to zero in advanced economies, while both numbers were below 2% in emerging economies.” The chart from CBP, going back to 2010:
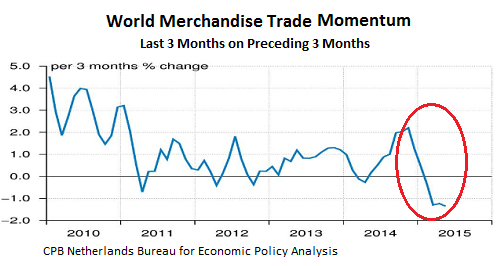
This isn’t stagnation or sluggish growth. This is the steepest and longest decline in world trade since the Financial Crisis. Unless a miracle happened in June, and miracles are becoming exceedingly scarce in this sector, world trade will have experienced its first back-to-back quarterly contraction since 2009.
Both of the measures above track import and export volumes. As volumes have been skidding, new shipping capacity has been bursting on the scene in what has become a brutal fight for market share [read… Container Carriers Wage Price War to Form Global Shipping Oligopoly].
Hence pricing per unit, in US dollars, has plunged 14% since May 2014, and nearly 20% since the peak in March 2011. For the months of March, April, and May, the unit price index has hit levels not seen since mid-2009.
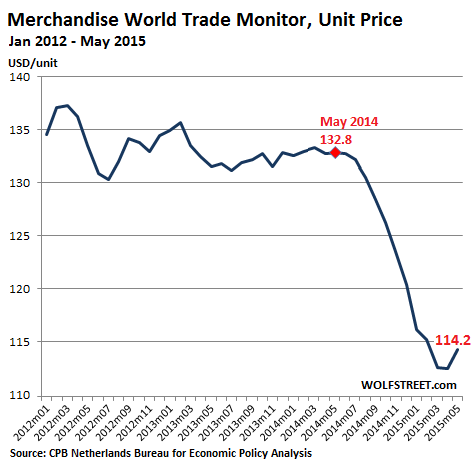
World trade isn’t down for just one month, or just one region. It wasn’t bad weather or an election somewhere or whatever. The swoon has now lasted five months. In addition, the CPB decorated its report with sharp downward revisions of the prior months. And it isn’t limited to just one region. The report explains:
The decline was widespread, import and export volumes decreasing in most regions and countries, both advanced and emerging. Import and export growth turned heavily negative in Japan. Among emerging economies, Central and Eastern Europe was one of the worst performers.
Given these trends, the crummy performance of our heavily internationalized revenue-challenged corporate heroes is starting to make sense: it’s tough out there.
But not just in the rest of the world. At first we thought it might have been a blip, a short-term thing. Read… Americans’ Economic Confidence Gets Whack
end
Commodity Carnage Continues – Copper Crashes To 6 Year Lows
Across the board commodities are weak again today as CCFD unwinds and mal-investment booms collapse across the world. Copper is under the most pressure today, plunging to its lowest since June 2009… but of course, Dr.Copper now knows nothing about economics because eyeballs trump reality in the new normal…
In July, things are not going well…

Smashing copper to its lowest since June 2009…

Charts: Bloomberg
China Electricity Consumption Grows At Slowest Pace In 30 Years
Chinese Electricity Consumption year-to-date grew at 1.3% year-over-year in June. As China People’s Daily reports, this is the slowest pace for mid-year in 30 years according to China Electricity Council.

As China People’s Daily reports,
China Electricity Council released “A Brief on 2015 Jan.-Jun. Electricity Industry” on July 21,reporting a declined acceleration rate onpower consumption of 1.3%- the lowest acceleration rate in 30 years.
According to the brief, the first half of 2015 sees a total electricity consumption of 2662.4 billion kWh all over China. Electricity supply relatively surpasses the demand, but the investment in electricity construction still increases.
The data varies in different areas. There are 19 provinces whose acceleration rates are above the 1.3% national average, and there are 9 provinces whose acceleration rates are below zero.
The data also varies in different industries.Electricity consumption in secondary industry decreases by 0.5%: the very first time to decrease in five years.Electricity consumption in light industry increases by 2.1%, while heavy industry decreases by 0.9%.
Electricity data has long been the barometer of economy. According to China Energy News, experts point out that the decreased acceleration rate is the indicator that China has entered a phase of slower economic development.
* * *
While we know only a tin-foil-hat-wearing fringe blog would question the honesty of China’s headline macro data, the weakest growth in Electricity consumption in 30 years does tend to suggest things are not as ‘unicorns and ponies’ as some would have the world believe.
end
WTI Crude Tumbles To $48 Handle, Energy Stocks At Dec 2012 Lows
WTI gave up earlier gains and is tumbling once again to 4-month lows, back into the $48 handle range… S&P Energy stocks are now back at Dec 2012 levels.

Smashing stocks back to Dec 2012 lows…

As Fwd P/Es collapse back to reality…

Charts: Bloomberg
end
Turkey seems set on invading Syria:
(courtesy zero hedge)
Turkey Permits U.S. To Use Its Airbase For Air Strikes Against Syria
Earlier we reported that in an apparent retaliation against Monday’s alleged suicide bombing and today’s follow up killing of a Turkish soldier on the border with Syria, the Turkish army launched what under normal conditions would be deemed a land invasion of Turkey when four of its tanks entered Syrian territory. Rhetorically, we asked in “one may wonder if NATO-member Turkey’s land invasion of Syria, which many have said was long overdue following months of rhetoric and belligerent posturing, under the pretext of ISIS “liberation”, has just begun.”
A following report from the WSJ largely answers our question: citing unnamed defense officials, WSJ reportsthat after months of negotiations, “Turkey has agreed to let the U.S. military carry out airstrikes against Islamic State fighters from a U.S. air base near the Syrian border.”
This is the same authoritarian president who has repeatedly cracked down against protesters using various less than media friendly means, and one whom Obama has lashed out at diplomatically. It appears that when pursuing grander visions, Obama is will to forgive anyone’s humanitarian record, or lack thereof, and do anything to achieve America’s real politik ambitions.
Like in this case: the deal, agreed to by President Barack Obama and Turkish President Recep Tayyip Erdogan, will allow the U.S. to use Incirlik Air Base in eastern Turkey to send manned and unmanned planes to attack Islamic State fighters, the officials said. The two leaders spoke on Wednesday, the White House said.
Use of Incirlik is part of a broader deal between the U.S. and Turkey to deepen their cooperation in the fight against Islamic State that is growing increasingly perilous for Turkey.
On Thursday, Islamic State forces in Syria and the Turkish military engaged in a deadly cross-border battle that left at least one Turkish officer dead.
“They’re in a counter-ISIL fight right across the border,” said one defense official, using one of the acronyms for Islamic State, which is also known as ISIS.
And with that the northern wing of the anti-Syria, pardon anti-ISIS campaign is complete, with the US covering air sorties while Turkey will use NATO tanks to secure the ground and slowly but surely, together with the eastern front where the US will soon deplay troops, close in on Damascus to eliminate the biggest Syrian ISIS threat of them all: president Assad and his (and the Kremlin’s) stern anti-Qatar pipeline position.
Your early morning currency, and interest rate moves
Euro/USA 1.0990 up .0067
USA/JAPAN YEN 123.80 down .267
GBP/USA 1.5596 down .0017
USA/CAN 1.2983 down .0058
Early this morning in Europe, the Euro rose by a considerable 67 basis points, trading now well above the 1.09 level at 1.0990; Europe is still reacting to deflation, announcements of massive stimulation, a proxy middle east war, and the ramifications of a default at the Austrian Hypo bank, an imminent default of Greece and the Ukraine, rising peripheral bond yields.
In Japan Abe went all in with Abenomics with another round of QE purchasing 80 trillion yen from 70 trillion on Oct 31. The yen continues to trade in yoyo fashion as this morning it settled up again in Japan by 27 basis points and trading just below the 124 level to 123.80 yen to the dollar.
The pound was down this morning by 17 basis points as it now trades just above the 1.56 level at 1.5609, still very worried about the health of Barclay’s Bank and the FX/precious metals criminal investigation/Dec 12 a new separate criminal investigation on gold, silver and oil manipulation.
The Canadian dollar is finally up, rising by 58 basis points at 1.2983 to the dollar.
We are seeing that the 3 major global carry trades are being unwound. The BIGGY is the first one;
1. the total dollar global short is 9 trillion USA and as such we are now witnessing a sea of red blood on the streets as derivatives blow up with the massive rise in the rise in the dollar against all paper currencies
2, the Nikkei average vs gold carry trade (still ongoing)
3. Short Swiss franc/long assets (European housing/Nikkei etc. This has partly blown up (see Hypo bank failure).
These massive carry trades are terribly offside as they are being unwound. It is causing global deflation ( we are at debt saturation already) as the world reacts to lack of demand and a scarcity of debt collateral. Bourses around the globe are reacting in kind to these events as well as the potential for a GREXIT>
The NIKKEI: this morning: up 90.28 or 0,44%
Trading from Europe and Asia:
1. Europe stocks mixed
2/ Asian bourses mixed … Chinese bourses: Hang Sang green (massive bubble forming) ,Shanghai in the green (massive bubble ready to burst), Australia in the red: /Nikkei (Japan) green/India’s Sensex in the red/
Gold very early morning trading: $1101.80
silver:$14.89
Early Thursday morning USA 10 year bond yield: 2.32% !!! down 1 in basis points fromWednesday night and it is trading well above resistance at 2.27-2.32%
USA dollar index early Thursday morning: 97.05 down 40 cents from Wednesday’s close. (Resistance will be at a DXY of 100)
This ends the early morning numbers, Thursday morning
And now for your closing numbers for Thursday:
Closing Portuguese 10 year bond yield: 2.57% down 4 in basis points from Wednesday
Closing Japanese 10 year bond yield: .42% !!! par in basis points from Wednesday/still very ominous
Your closing Spanish 10 year government bond, Thursday, down 4 in basis points
Spanish 10 year bond yield: 1.95% !!!!!!
Your Thursday closing Italian 10 year bond yield: 1.90% down 2 in basis points from Wednesday: (very ominous)
trading 5 basis point lower than Spain.
IMPORTANT CURRENCY CLOSES FOR TODAY
Closing currency crosses for Thursday night/USA dollar index/USA 10 yr bond: 4 pm
Euro/USA: 1.1000 up .0076 ( Euro up 76 basis points)
USA/Japan: 123.79 down .274 ( yen up 27 basis points)
Great Britain/USA: 1.5515 down .0098 (Pound down 98 basis points)
USA/Canada: 1.3039 down .0003 (Can dollar up 3 basis points)
The euro rose considerably today. It settled up 76 basis points against the dollar to 1.1000 as the dollar traded southbound today against most of the various major currencies. The yen was up by 27 basis points and closing well below the 124 cross at 123.79. The British pound was down considerably by 98 basis points, closing at 1.5515. The Canadian dollar went slightly up again rising by 34 basis points closing at 1.3039.
As explained above, the short dollar carry trade is being unwound, the yen carry trade , the Nikkei/gold carry trade, and finally the long dollar/short Swiss franc carry trade are all being unwound and these reversals are causing massive derivative losses. And as such these massive derivative losses is the powder keg that will destroy the entire financial system. The losses on the oil front and huge losses on the USA dollar will no doubt produce many dead bodies.
Your closing 10 yr USA bond yield: 2.27% down 6 in basis point from Wednesday// (at the resistance level of 2.27-2.32%)/ominous
Your closing USA dollar index:
97.12 down 34 cents on the day
.
European and Dow Jones stock index closes:
England FTSE down 12.33 points or 0.18%
Paris CAC up 4.17 points or 0.08%
German Dax down 8.56 points or 0.07%
Spain’s Ibex up 42.40 points or 0.37%
Italian FTSE-MIB down 48.06 or 0.20%
The Dow down 119.12 or 0.67%
Nasdaq; down 25.36 or 0.49%
OIL: WTI 48.59 !!!!!!!
Brent:55.26!!!
Closing USA/Russian rouble cross: 57.94 down 1/2 rouble per dollar on the day
end
And now for your more important USA stories.
Your closing numbers from New York
Commodity Carnage Contagion Crushes Stocks & Bond Yields
Summing up Mainstream media today…
Where to start…
Bonds – Good!

Stocks – Bad!

Commodities – Ugly!

* * *
Everything was red in equity index land today… Trannies worst day since January

Stocks are all red for the week… Dow is down over 400 points from Monday’s highs back below its 200DMA; S&P 500 cash is back below its 50DMA; and Russell 2000 broke below its 50 & 100DMA

Financials have given up their earlier week gains(as rates flatten) and only builders remain green on the week…

Leaving The Dow red for 2015…

52-Week Lows are at their highest since 2014…

On the week, the Treasury complex is seeing major flattening as the long-end collapses while short-end lifts on rate hike expectations…

With 30Y retracing all “Greece is fixed” weakness…

With 2s30s near 3 month flats…

Maybe all that NIM hope is overprices after all…

The US Dollar leaked lower on the day as EUR strengthened and cable weakened…

But that did nothing to support commodities…

Copper now at 6 year lows

And front-month crude getting close to cycle lows…

Charts: Bloomberg
Bonus Chart: Protection costs are dramatically diverging between credit and stocks…

As Bloomberg notes, the last time the VIX diverged from high-yield CDS this much was in August 2013, when investors were anticipating the Federal Reserve would start reducing its quantitative easing program.The equity volatility gauge jumped more than 70 percent in the next two months as the S&P 500 lost as much as 4.6 percent.
Bonus Bonus Chart: The real fear index is the most complacent since before Lehman… (details on Implied Correlation here)

Jobless claims plunge. USA investors are now worried that Janet will initiate an interest rate hike in September.
(courtesy BLS>zero hedge0
Initial Jobless Claims Plunge To Lowest Level In 42 Years
Time for a rate hike?
Initial jobless claims dropped 26,000 to 255k – its lowest since Nov 1973

While July 4th adjustments may indeed be a factor, it appears things have hardly ever been better – according to this data anyway.
Charts: Bloomberg


[…] JULY 23/ANOTHER 2.68 TONNES OF GOLD LEAVES GLD/AGAIN SILVER INVENTORY AT SLV REMAINS FLAT/COPPER AND… […]
LikeLike
Thanks Harvey. We all do so appreciate your diligence. A question (or two) for you, I still don’t quite understand the Open Interest thing….does the rising (Silver) OI indicate that these are entities which are Short or Long?
Also, it seems Gold is really being raided (delivered) from the GLD and Comex lately ,what about the LBMA’s holdings?? (maybe I missed it in the write-up)…this would indicate to me that they are on track to run out fairly soon, especially as global production could be dropping due to the price action…am I wrong? and if so, the (manipulation) jig should be up! Would you care to speculate?
Yours truly,
Jd
LikeLike
[…] by Harvey Organ Harvey Organ’s Blog […]
LikeLike
Harvey: The New York Fed in june 2015 did not deliver any earmarked gold to germany. The release for june was late – it was released 8/3/15. No one has picked up on this story. I think it’s because the 6000 tons at the new york fed being held for foreign sovereigns is gone.
LikeLike