
GOLD: $1272.35 DOWN $0.65
Silver: $16.74 DOWN 5 cent(s)
Closing access prices:
Gold $1266.30
silver: $16.57
SHANGHAI GOLD FIX: FIRST FIX 10 15 PM EST (2:15 SHANGHAI LOCAL TIME)
SECOND FIX: 2:15 AM EST (6:15 SHANGHAI LOCAL TIME)
SHANGHAI FIRST GOLD FIX: $1271.99 DOLLARS PER OZ
NY PRICE OF GOLD AT EXACT SAME TIME: $12766.40
PREMIUM FIRST FIX: $5.59
xxxxxxxxxxxxxxxxxxxxxxxxxxxxxxxxxxxxxxxxxxxxxx
SECOND SHANGHAI GOLD FIX: $1272,17
NY GOLD PRICE AT THE EXACT SAME TIME: $1265.30
Premium of Shanghai 2nd fix/NY:$6.87
xxxxxxxxxxxxxxxxxxxxxxxxxxxxxxxxxxxxxxxxxxxxxxxxxxx
LONDON FIRST GOLD FIX: 5:30 am est $1266.65
NY PRICING AT THE EXACT SAME TIME: $1266.60
LONDON SECOND GOLD FIX 10 AM: $1269.60
NY PRICING AT THE EXACT SAME TIME. $1269.55
For comex gold:
AUGUST/
NOTICES FILINGS TODAY FOR APRIL CONTRACT MONTH: 193 NOTICE(S) FOR 19,300 OZ.
TOTAL NOTICES SO FAR: 3139 FOR 313,900 OZ (9.7636 TONNES)
For silver:
AUGUST
107 NOTICES FILED TODAY FOR
535,000 OZ/
Total number of notices filed so far this month: 411 for 2,055,000 oz
XXXXXXXXXXXXXXXXXXXXXXXXXXXXXX
Yesterday I wrote the following:
“it now looks like the boys have lost control of the gold/silver market/for sure silver with today’s attempted raid and failure. The bankers have decided to take their anger by hitting on the gold/silver equity shares.”
Again the bankers took out their frustration by whacking the gold and silver equity shares. They also whack gold and silver within seconds after the comex closes..Such crooks
end
Let us have a look at the data for today
xxxxxxxxxxxxxxxxxxxxxxxxxxxxxxxxxxxxxxxxxxxxxxxxxxxxxxxxxxxxxxxxxxxxxxxxxx
In silver, the total open interest FELL BY A TINY 358 contracts from 207,643 DOWN TO 207,258 WITH NO GAIN IN THE PRICE THAT SILVER TOOK WITH RESPECT TO YESTERDAY’S TRADING (UP 0 CENT(S). WHEN YOU COMPARE THE HUGE GAIN IN OI FOR GOLD THEN YOU MUST ADMIT THAT IT SURE LOOKS LIKE BOTH THE SPECULATOR SHORTS AND THE BANKER SHORTS ARE HAVING SEVERE PROBLEMS TRYING TO COVER THEIR SHORTFALL WHICH CANNOT COME TO FRUITION. THE LONGS REMAIN STOIC AND NOTHING WILL BUDGE OUR SILVER LEAVES FROM DEPARTING OUR SILVER TREE. YESTERDAY’S TRADING IS EVIDENCE OF THAT
In ounces, the OI is still represented by just OVER 1 BILLION oz i.e. 1.038 BILLION TO BE EXACT or 148% of annual global silver production (ex Russia & ex China).
FOR THE NEW FRONT MAY MONTH/ THEY FILED: 107 NOTICE(S) FOR 535,000 OZ OF SILVER
In gold, the open interest ROSE by A MONSTROUS 11,747 with the RISE in price of gold ($4.95 yesterday.) The new OI for the gold complex rests at 448,709. Yesterday we had the bankers supplying a major amount of short paper to newbie longs who entered the arena like gangbusters. The specs shorts covered but at a higher price.No wonder a raid was orchestrated overnight with the intention of cooling gold’s jets. It seems that the raid failed again. The bankers are losing control over the precious metal markets
we had: 193 notice(s) filed upon for 19,300 oz of gold.
xxxxxxxxxxxxxxxxxxxxxxxxxxxxxxxxxxxxxxxxxxxxxxxxxxxxxxxxxxx
With respect to our two criminal funds, the GLD and the SLV:
GLD:
Today, no changes in gold inventory
Inventory rests tonight: 791.88 tonnes
IN THE LAST 14 DAYS: GLD SHEDS 45.62 TONNES YET GOLD IS HIGHER BY $48.85 . GO FIGURE!!
SLV
Today: : WE HAD NO CHANGES IN SILVER INVENTORY TONIGHT:
INVENTORY RESTS AT 341.732 MILLION OZ
end
.
First, here is an outline of what will be discussed tonight:
1. Today, we had the open interest in silver FALL BY A TINY 358 contracts from 207,643 DOWN TO 207,258 (AND now A LITTLE FURTHER FROM THE NEW COMEX RECORD SET ON FRIDAY/APRIL 21/2017 AT 234,787). THE FALL IN OPEN INTEREST WAS ACCOMPANIED BY A NO GAIN IN PRICE FOR SILVER WITH RESPECT TO YESTERDAY’S TRADING (UP 0 CENTS ). WHEN WE SEE THE MASSIVE RISE IN GOLD OPEN INTEREST YESTERDAY, WE NO DOUBT WITNESSED MORE SPEC LONGS ENTER THE ARENA (with political unrest) WITH THE MAJORITY OF THE SPEC LONGS AGAIN BASICALLY REMAINING STOIC. THE SPEC LONGS SEEM TO BE TAKING ON THE BANKERS. THE SPEC SHORTS ARE DESPERATE TO COVER THEIR SHORTFALL BUT THEY ARE COMING IN CONTACT WITH A LARGE NUMBER OF NEW SPEC LONGS . THE BANKERS HAD NO CHOICE BUT TO COVER SOME OF THEIR MASSIVE SHORT PAPER DESPITE THE ZERO PRICE GAIN FROM SILVER. THE NET RESULT: A COMEX SILVER OPEN INTEREST SLIGHT DECREASE.
(report Harvey)
.
2.a) The Shanghai and London gold fix report
(Harvey)
2 b) Gold/silver trading overnight Europe, Goldcore
(Mark O’Byrne/zerohedge
and in NY: Bloomberg
3. ASIAN AFFAIRS
i)Late TUESDAY night/WEDNESDAY morning: Shanghai closed DOWN 7.58 POINTS OR 0.23% / /Hang Sang CLOSED UP 67.15 POINTS OR 0.24% The Nikkei closed UP 94.25 POINTS OR .17%/Australia’s all ordinaires CLOSED DOWN 0.45%/Chinese yuan (ONSHORE) closed DOWN at 6.7228/Oil DOWN to 49.16 dollars per barrel for WTI and 51.99 for Brent. Stocks in Europe OPENED IN THE RED , Offshore yuan trades 6.7296 yuan to the dollar vs 6.7228 for onshore yuan. NOW THE OFFSHORE IS WEAKER TO THE ONSHORE YUAN/ ONSHORE YUAN WEAKER (TO THE DOLLAR) AND THE OFFSHORE YUAN IS MUCH WEAKER TO THE DOLLAR AND THIS IS COUPLED WITH THE SLIGHTLY WEAKER DOLLAR. CHINA IS HAPPY TODAY
3a)THAILAND/SOUTH KOREA/NORTH KOREA
i)NORTH KOREA//USA
The USA launches a minuteman ICBM in a warning to North Korea
( zero hedge)
b) REPORT ON JAPAN
c) REPORT ON CHINA
Trump set to initiate section 301 of the 1974 Trade Act which calls for an investigation into the trade practices of a particular country. If it finds fault, then sanctions and cancelling of licenses etc can be called into play. The USA seems to be snubbing the WTO
( zero hedge)
4. EUROPEAN AFFAIRS
EU/ITALY
the European migrant crisis escalates again with Italy impounding a German NGO refugee ship. Italy is getting no help from the EU on the migrant issue.
( zero hedge)
5. RUSSIAN AND MIDDLE EASTERN AFFAIRS
the mood is quite sombre as USA officials begin packing up reading to leave Moscow on orders from Putin
( zero hedge)
ibJust out and great reason for the crooks to hit on gold and silver
we are back to square one with respect to the original 13 demands of Qatar from the Saudi block
(courtesy Paraskova/OilPrice.com)
6 .GLOBAL ISSUES
7. OIL ISSUES
WTI slides again after another disappointing crude drawdown. Production continues to rise with all of the rigs going at full blast
( zero hedge)
8. EMERGING MARKET
VENEZUELA
We are now witnessing the beginning of hyperinflation in Venezuela. In a few short weeks-to a few months, we will see bolivar rates equal to that of Zimbabwe.
(courtesy zero hedge)
9. PHYSICAL MARKETS
wow!! this is developing to be a quite a story. Turkey imported a huge 2.8 billion USA dollars worth of gold or 68.4 tonnes in July. In June 2.1 billion dollars or 52.5 tonnes. Let’s average the two months at 60 tonnes. Then these guys will import from this day forward 720 tonnes of gold. My goodness, we have China at around 2,000 tonnes, India 1000 tonnes, Russia around 120 tonnes and the world produces 2,200 tonnes net China net Russia which do not let one oz out of the countries. Some sovereign is liquidating their official reserves!!
( zerohedge)
10. USA Stories
v)This looks ominous: Mueller just added another Obama ally to his team, Greg Andres a former Dept. of Justice attorney who served under Eric Holder.
vi)Trump signs the Russia sanction bill “with reservations” commenting that this bill encroaches on executive privilege. We now await Europe’s response
( zerohedge)
vii)Dave Kranzler of IRD talks about the crashing auto sales
viii)It looks like another 30% rise in Obamacare premiums and this is with the Fed subsidies. You can imagine what will happen if Trump cuts them off. Actually the press is now blaming Trump for all of those Obamacare increases
Let us head over to the comex:
The total gold comex open interest ROSE BY A MONSTROUS 11,747 CONTRACTS UP to an OI level of 448,709 WITH THE RISE IN THE PRICE OF GOLD ($4.95 with YESTERDAY’S trading). We had a huge number of newbie longs enter the gold area to which our crooked bankers were more than happy to comply. The specs shorts covered as fast as their feet could carry them.
We are now in the contract month of August and it is the 3rd best of the delivery months after December and June.
The active August contract LOST 1290 contract(s) to stand at 2972 contracts. We had 1,309 notices filed upon yesterday so we SURPRISINGLY GAINED 19 contracts or an additional 1900 oz will stand at the comex and 0 EFP’s were issued which entitles the long holder to a fiat bonus plus a futures contract and most probably that would be a London based forward. That is a first for gold: the longs refusing an EFP!!!!
The non active September contract month saw it’s OI fall by 22 contracts up to 1867.
The next active contract month is Oct and here we saw a rise of 5233 contracts up to 48,330.
The very big active December contract month saw it’s OI rise by 7744 contracts up to 344,426.
We had 193 notice(s) filed upon today for 19,300 oz
For those keeping score: in the upcoming front delivery month of August:
LAST YEAR WE HAD A MONSTROUS 44.7 TONNES OF GOLD INITIALLY. BY THE CONCLUSION OF THE AUGUST CONTRACT MONTH 44.358 TONNES STOOD FOR DELIVERY.
We are now in the next big non active silver contract month of August and here the OI SURPRISINGLY FELL BY ONLY 53 contracts. We had 71 notices filed yesterday. Thus we gained a huge 18 contracts or an additional 90,000 oz will stand. We are proceeding again where we left off last month (July) and the month before that (June), and finally the month before that(May), where the amount standing increases as the month proceeds and it begins right on day 2.
The next active contract month is September (and the last active month until December) saw it’s OI fall by 1493 contacts down to 138,414. The next non active contract month for silver after September is October and here the OI 20 contacts. After October, the big active contract month is December and here the OI rose by 1033 contracts up to 59,254 contracts.
We had 107 notice(s) filed for 535,000 oz for the AUGUST 2017 contract
VOLUMES: for the gold comex
Today the estimated volume was 109,249 contracts which is POOR/
Yesterday’s confirmed volume was 231,323 contracts which is GOOD
volumes on gold are STILL HIGHER THAN NORMAL!
August 2/2017.
| Gold | Ounces |
| Withdrawals from Dealers Inventory in oz | nil |
| Withdrawals from Customer Inventory in oz |
nil oz
|
| Deposits to the Dealer Inventory in oz | oz |
| Deposits to the Customer Inventory, in oz |
32,150.000 oz
Scotia
1000 kilobars
|
| No of oz served (contracts) today |
193 notice(s)
19,300 OZ
|
| No of oz to be served (notices) |
2779 contracts
(277,900 oz)
|
| Total monthly oz gold served (contracts) so far this month |
3139 notices
313,900 oz
9.7636 tonnes
|
| Total accumulative withdrawals of gold from the Dealers inventory this month | NIL oz |
| Total accumulative withdrawal of gold from the Customer inventory this month | nil oz |
Today, 0 notice(s) were issued from JPMorgan dealer account and 3 notices were issued from their client or customer account. The total of all issuance by all participants equates to 193 contract(s) of which 0 notices were stopped (received) by j.P. Morgan dealer and 10 notice(s) was (were) stopped/ Received) by j.P.Morgan customer account.
| Silver | Ounces |
| Withdrawals from Dealers Inventory | nil |
| Withdrawals from Customer Inventory |
190,814.170 oz
Scotia
|
| Deposits to the Dealer Inventory |
nil oz
|
| Deposits to the Customer Inventory |
599451.890
oz
Scotia
|
| No of oz served today (contracts) |
107 CONTRACT(S)
(535,000 OZ)
|
| No of oz to be served (notices) |
209 contracts
( 1,045,000 oz)
|
| Total monthly oz silver served (contracts) | 411 contracts (2,055,000 oz) |
| Total accumulative withdrawal of silver from the Dealers inventory this month | NIL oz |
| Total accumulative withdrawal of silver from the Customer inventory this month | 190,814.170 oz |
NPV for Sprott and Central Fund of Canada
Sprott’s hostile 3.1 billion bid to take over Central Fund of Canada
(courtesy Sprott/GATA)
Sprott makes hostile $3.1 billion bid for Central Fund of Canada
Submitted by cpowell on Thu, 2017-03-09 01:19. Section: Daily Dispatches
From the Canadian Press
via Canadian Broadcasting Corp. News, Toronto
Wednesday, March 8, 2017
http://www.cbc.ca/news/canada/calgary/sprott-takeover-bid-central-fund-c…
Toronto-based Sprott Inc. said Wednesday it’s making an all-share hostile takeover bid worth $3.1 billion US for rival bullion holder Central Fund of Canada Ltd.
The money-management firm has filed an application with the Court of Queen’s Bench of Alberta seeking to allow shareholders of Calgary-based Central Fund to swap their shares for ones in a newly-formed trust that would be substantially similar to Sprott’s existing precious metal holding entities.
The company is going through the courts after its efforts to strike a friendly deal were rebuffed by the Spicer family that controls Central Fund, said Sprott spokesman Glen Williams.
“They weren’t interested in having those discussions,” Williams said.
Sprott is using the courts to try to give holders of the 252 million non-voting class A shares a say in takeover bids, which Central Fund explicitly states they have no right to participate in. That voting right is reserved for the 40,000 common shares outstanding, which the family of J.C. Stefan Spicer, chairman and CEO of Central Fund, control.
If successful through the courts, Sprott would then need the support of two-thirds of shareholder votes to close the takeover deal, but there’s no guarantee they will make it that far.
“It is unusual to go this route,” said Williams. “There’s no specific precedent where this has worked.”
Sprott did have success last year in taking over Central GoldTrust, a similar fund that was controlled by the Spicer family, after securing support from more than 96 percent of shareholder votes cast.
The firm says Central Fund’s shares are trading at a discount to net asset value and a takeover by Sprott could unlock US$304 million in shareholder value.
Central Fund did not have any immediate comment on the unsolicited offer. Williams said Sprott had not yet heard from Central Fund on the proposal but that some shareholders had already contacted them to voice their support.
Sprott’s existing precious metal holding companies are designed to allow investors to own gold and other metals without having to worry about taking care of the physical bullion.
end
And now the Gold inventory at the GLD
August 2/NO CHANGES IN GOLD INVENTORY AT THE GLD/INVENTORY RESTS AT 791.88 TONNES
Aug 1/NO CHANGE IN GOLD INVENTORY AT THE GLD/INVENTORY RESTS AT 791.88 TONNES
July 31/NO CHANGES AT THE GLD/INVENTORY RESTS AT 791.88 TONNES
July 28/ANOTHER MASSIVE WITHDRAWAL OF 3.54 TONNES OF GOLD WITH GOLD UP $9.15/INVENTORY RESTS AT 791.88 TONNES
July 27/LATE LAST NIGHT, A HUGE WITHDRAWAL OF 5.03 TONNES WITH GOLD UP $10.45 ON THE DAY/INVENTORY RESTS AT 795.42 TONNES
July 26/NO CHANGE IN GLD INVENTORY WITH GOLD DOWN $2.55/INVENTORY RESTS AT 800.45 TONNES
July 25/A MASSIVE 9.17 TONNES OF GOLD WITHDRAWN FROM THE GLD/INVENTORY RESTS AT 800.45 TONNES
July 24/A massive 9.62 tonnes withdrawal and yet the price remains constant (down only 25 cents)..inventory drops to 809.62 tonnes
July 21/with gold up $8.75 again, we had no changes in gold inventory at the GLD/inventory rests at 816.13 tonnes
July 20/WITH GOLD UP AGAIN TODAY ($3.50) WE HAD NO CHANGES IN GOLD INVENTORY AT THE GLD/INVENTORY RESTS AT 816.13 TONNES
jULY 19/STRANGE!! AGAIN WITH GOLD UP $0.50 WE HAD ANOTHER HUGE 5.32 TONNES WITHDRAWAL FROM THE GLD/INVENTORY RESTS AT 816.13 TONNES THIS GOLD IS HEADING TO SHANGHAI
July 18/STRANGE AGAIN/WITH GOLD UP $7.50 WE HAD ANOTHER HUGE 5.62 TONNES WITHDRAWAL FROM THE GLD/INVENTORY RESTS AT 821.45 TONNES
July 17/strange again! with gold up $4.20 we had another huge withdrawal of 1.77 tonnes/inventory rests at 827.07 tonnes
July 14/strange@!!with gold up $12.00 today, we had a huge withdrawal of 3.55 tonnes/inventory rests at 828.84 tonnes
July 13/no change in gold inventory at the GLD/inventory rests at 832.39 tonnes
JULY 12/no change in gold inventory at the GLD/inventory rests at 832.39 tonnes
July 11/strange!@! we had a big withdrawal of 2.96 tonnes despite gold’s advance today/inventory rests tonight at 832.39 tonnes
July 10/no changes in gold inventory at the GLD/inventory rests at 835.35 tonnes
July 7/a massive withdrawal of 5.32 tonnes of paper gold were removed and this was used in the attack today/inventory rests at 835.35 tonnes
July 6/no changes in tonnage at the GLD/Inventory rests at 840.67 tonnes
July 5/A MASSIVE 5.62 TONNES OF GOLD LEFT THE GLD AND NO DOUBT WAS USED IN THE RAID THIS MORNING/INVENTORY REST
July 3/ A MASSIVE 7.37 TONNES OF GOLD LEAVE THE GLD/INVENTORY RESTS AT 846.29 TONNES
end
Now the SLV Inventory
August 2/NO CHANGES IN SILVER INVENTORY AT THE SLV
INVENTORY RESTS AT 341.732 MILLION OZ/
August 1/A HUGE WITHDRAWAL OF 945,000 OZ/INVENTORY RESTS AT 341.732 MILLION OZ/
July 31/no change in silver inventory at the SLV/inventory rests at 342.677 million oz
July 28/ A HUGE WITHDRAWAL OF 1.15 MILLION OZ OF SILVER LEAVES THE SLV DESPITE SILVER BEING UP 11 CENTS TODAY/INVENTORY RESTS AT 342.677 MILLION OZ
July 27/NO CHANGE IN SILVER INVENTORY/INVENTORY RESTS AT 343.812 MILLION OZ WITH SILVER UP 13 CENTS TODAY.
July 26/NO CHANGE IN SILVER INVENTORY/INVENTORY RESTS AT 343.812 MILLION OZ
July 25/A MASSIVE 3.309 MILLION OZ OF INVENTORY WITHDRAWN FROM THE SLV DESPITE SILVER’S 10 CENT RISE TODAY.
July 24/no change in silver inventory despite its 4 cent drop/inventory remains at 347.121 million oz
July 21/STRANGE! WITH SILVER UP AGAIN TODAY (11 CENTS), NO CHANGE IN SILVER INVENTORY AT THE SLV/inventory 347.121 million oz/
July 20/STRANGE! WITH SILVER UP AGAIN TODAY, THE SLV INVENTORY LOWERS BY 945,000 OZ/INVENTORY RESTS AT 347.121 MILLION OZ/
July 19/NO CHANGE IN SILVER INVENTORY AT THE SLV/INVENTORY RESTS AT 348.066 MILLION OZ
July 18/a huge 946,000 oz withdrawal from the SLV despite silver’s 16 cent gain!
Inventory rests at 348.066 million oz
July 17/no change in silver inventory at the SLV/Inventory rests at 349.012 million oz
July 14/no change in silver inventory/inventory rests at 349.012 million oz/
July 13/no change in silver inventory/inventory at the SLV rests at 349.012 million oz/
JULY 12/another massive 1.986 million oz of silver added into the SLV/inventory rests at 349.012 million oz/the last 3 days saw 7.281 million oz added into the SV
July 11/ANOTHER MASSIVE INCREASE OF 2.364 MILLION OZ into the SLV inventory/inventory rests at 347.026 million oz
July 10/ A HUGE INCREASE OF 2.931 MILLION OZ OF SILVER DESPITE THE EARLY HIT ON SILVER THIS MORNING/INVENTORY RESTS AT 344.662 MILLION OZ.
July 7/Strange: no change in inventory (compare that with gold) Inventory rests at 341.731 million oz
July 6/ANOTHER MASSIVE DEPOSIT OF 2.126 MILLION OZ INTO THE SLV INVENTORY/INVENTORY RESTS AT 341.731 MILLION OZ.
July 5/STRANGE! NO CHANGE IN SILVER INVENTORY AT THE SLV/INVENTORY RESTS AT 339.605 MILLION OZ
July 3/strange! with the huge whacking of silver we got an increase of 379,000 oz into inventory.
August 2.2017:
-
 Indicative gold forward offer rate for a 6 month duration+ 1.27%
 -
+ 1.44%

end
END
Major gold/silver trading/commentaries for WEDNESDAY
GOLDCORE/BLOG/MARK O’BYRNE.
GOLD/SILVER
Greenspan Warns Stagflation Like 1970s “Not Good For Asset Prices”
– Former Fed Chairman warns of bond bubble, stagflation
– “Moving into a … stagflation not seen since the 1970s”
– This will not be “good for asset prices”
– 10 Yr Gov bond yields fell from 15.8% in 1981 to 2.3%
– Interest rates will not stay low, will rise ‘reasonably fast’
– “Normal” interest rates in 4%-5% range
– Inflation will not stay at historically low levels
– Gold “protects savings” and is “store of value”
– Gold is the “ultimate insurance policy” says Greenspan
Editor: Mark O’Byrne
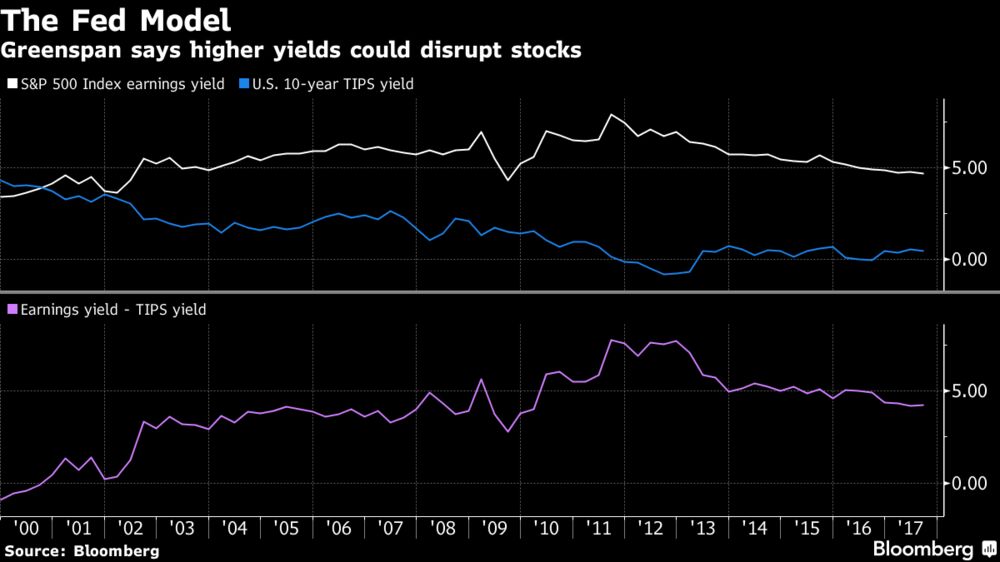
Greenspan warns of Bond Bubble
‘We are experiencing a bubble, not in stock prices but in bond prices. This is not discounted in the marketplace.’
There are a lot of warnings on Bloomberg, CNBC and other financial media these days about a bubble in the stock market, particularly in FANG stocks and the tech sector.
But former Fed Chair Alan Greenspan is not in agreement. He is continuing his message of the last two years, that there is a bond bubble and which is more dangerous than what is going on in the stock market.
He is not the only one, in recent months there has been a growing number of those who are concerned that real bond yields in the U.S., UK, EU and elsewhere are well below where growth and inflation rates seem to suggest they should be.

They correctly warn that it is only a matter of time before the inflationary pressures (that we are feeling) hit the bond market.
Stagflation on the horizon
Greenspan’s warning this week comes a little over a year after he last warned us that we were currently in the worst period he has seen since he began public service, including the financial crisis.
Things are so bad, he said that he wished he could “find something positive to say.”
At the time he pointed towards the problem of ‘entitlements’ (welfare / warfare spending of the ‘welfare warfare state’). Something, he argued, is uneconomic and unsustainable. The main reason for its lack of sustainability is the low growth rates developed countries around the world are experiencing (around 2%).
Now, this lack of growth is prompting calls of concern from Greenspan regarding stagflation:
“We’ve been in a period of stagnation since 2008 as a consequence of the sharp decline of capital investment and productivity growth… We are moving into a different phase of the economy — to a stagflation not seen since the 1970s. That is not good for asset prices.”

Felder Report via ZeroHedge
Asset prices obviously include the bond market, and this is where Mr Greenspan believes we should focus our concerns. Thanks to the unsustainable levels of low interest rates. Something which he has expressed concern about before.
Worried about interest rates
“By any measure, real long-term interest rates are much too low and therefore unsustainable,” the former Federal Reserve chairman, 91, said in this latest interview.
“When they move higher they are likely to move reasonably fast. We are experiencing a bubble, not in stock prices but in bond prices. This is not discounted in the marketplace.”
Two years ago Greenspan told Bloomberg that the bond market price-to-earnings ratio was in an ‘extraordinary position’ and that interest rates sitting below 4% was not normal.
“We have pressed the interest rates well below normal for a protracted period of time and the danger is they will come up to back up to where they have always been…There are two possibilities. Either we move slowly back to normal, or we do it in a fairly aggressive manner. History tells us it’s the latter which tends to be more prevalent than the former,” Greenspan said, the market impact, therefore, will be “not good.”
Yields on the US 10-year Treasury note have been below 4% since the summer of 2008 (see chart below).

No more air for the bubble
Currently around $1.5 trillion a year is created by central banks through money printing schemes. The major central banks (US Federal Reserve, the European Central Bank and the Bank of Japan) have collectively gathered around $13 trillion of government bonds on their balance sheets.
All of them, including others such as the Bank of England, are signalling that times are changing. For as long as money is being printed then bond prices have been going up. Great news for investors and pension owners, but those same investors would like to be able get out quickly.
This has been possible in recent years, thanks to what is basically a globally co-ordinated scheme of massive currency creation and bond buying.
However, we now appear to be heading into a period of co-ordinated global rate-hiking. This means that as interest rates start to climb then liquidity conditions will not work in investors’ favours.
There is little reason why we will not see a domino effect of increased interest rates, heightened volatility, falling bond prices and then perhaps even a crash in the stock and bond markets.
According to the 207 investment professionals surveyed by BAML last month, this would be disastrous for the market. They warned that a crash in the global bond market is the biggest tail risk for markets.
But so far these warning cries are little heeded in the mutual fund and wider market. According to Morningstar retail and high net worth investors alike are still ploughing cash into bonds.
Fixed-income products attracted $355bn in net new money between January to May 2017. Consider that next to the $375bn of net inflows for all of 2016. The figure also surpasses the entire year’s figures for 2013, 2014 and 2015.
Some of those who are buying believe that as inflation rates are low then it is unlikely to be a cause for concern to central banks, who are then less likely to raise rates rapidly. However, as we have covered here, the real rates of inflation really are a growing concern and are now on the radar of concerned central bankers.
At this point it is worth recalling another nugget of wisdom from Greenspan. He said back in 2014, ‘When bubbles emerge, they take on a life of their own. It is very difficult to stop them, short of a debilitating crunch in the marketplace.’
What does this mean for gold?
Mr Greenspan is a well-known gold-bug. Just earlier this year he said in an interview that investors were diversifying into gold and silver due to the deepening lack of trust in the financial system and currency markets.

Whilst interest rates are likely to rise, so is inflation which as Greenspan has previously argued, is good for gold:
“Significant increases in inflation will ultimately increase the price of gold. Investment in gold now is insurance.”
Gold is not only insurance against inflationary pressures but it is insurance against the unknown whether that be the outlook for the dollar or for the survival of the euro itself which Greenspan warned about earlier this year.
Earlier interviews with Greenspan have provided insight into how often bodies such as the Federal Reserve misjudge economic situations which then results in poor policy making. Of course, no one knows how the financial future will evolve, especially as each crisis comes with new financial strategies, technology and human behaviour.
Greenspan is unable to predict when the bond bubble will burst, and many disagree that it will happen, instead pointing to a stock market problem.
The bottom line is no one has a crystal ball. We simply don’t know now how this will pan out.
But we do know that the current situation is unsustainable. Most asset markets look overvalued and the value of major currencies are slowly being eroded.
Gold will hedge and insure against these real risks.
Related
Greenspan Says Gold “Ultimate Insurance Policy” as has “Grave Concerns About Euro”
News and Commentary
Irish gold bullion broker GoldCore tops sales of $1bn (IrishTimes.com)
Gold edges away from 7-week high as dollar steadies (Reuters.com)
Gold settles at nearly 8-week high (MarketWatch.com)
Greenspan stresses ‘ominous’ worries about bond bubble (MarketWatch.com)
Fears rise on £200bn debt pile as Moody’s warns Britons may be borrowing too much (CityAM.com)

Source Bank of England via CityAm
Greenspan Sees No Stock Excess, Warns of Bond Market Bubble (Bloomberg.com)
Independent German Central Bank Responsible For Two Monetary Disasters (HandelsBlatt.com)
Importance of Rebalancing Portfolio – Now Good Time To Rebalance (StansBerryChurcHouse.com)
This Chart Might Make You Rethink the Adage “Stocks Always Come Back” (TheDailyCoin.org)
Popularity Rises For Precious Metals’ Initial Coin Offerings (ICOs) (Gold-Eagle.com)
Rickards: Scaramucci’s Chinese Operation May Have Pushed Him Out (DailyReckoning.com)
Gold Prices (LBMA AM)
02 Aug: USD 1,266.65, GBP 956.83 & EUR 1,069.56 per ounce
01 Aug: USD 1,267.05, GBP 957.76 & EUR 1,072.30 per ounce
31 Jul: USD 1,266.35, GBP 965.59 & EUR 1,079.06 per ounce
28 Jul: USD 1,259.60, GBP 961.96 & EUR 1,075.45 per ounce
27 Jul: USD 1,262.05, GBP 960.29 & EUR 1,076.53 per ounce
26 Jul: USD 1,245.40, GBP 956.72 & EUR 1,071.29 per ounce
25 Jul: USD 1,252.00, GBP 960.78 & EUR 1,074.59 per ounce
Silver Prices (LBMA)
02 Aug: USD 16.67, GBP 12.60 & EUR 14.09 per ounce
01 Aug: USD 16.74, GBP 12.67 & EUR 14.17 per ounce
31 Jul: USD 16.76, GBP 12.77 & EUR 14.29 per ounce
28 Jul: USD 16.56, GBP 12.66 & EUR 14.15 per ounce
27 Jul: USD 16.79, GBP 12.77 & EUR 14.34 per ounce
26 Jul: USD 16.37, GBP 12.54 & EUR 14.06 per ounce
25 Jul: USD 16.31, GBP 12.52 & EUR 14.00 per ounce
Recent Market Updates
– What Investors Can Learn From the Japanese Art of Kintsukuroi
– Bitcoin, ICO Risk Versus Immutable Gold and Silver
– This Is Why Shrinkflation Is Making You Poor
– Gold A Good Store Of Value – Protect From $217 Trillion Global Debt Bubble
– Why Surging UK Household Debt Will Cause The Next Crisis
– Gold Seasonal Sweet Spot – August and September – Coming
– Commercial Property Market In Dublin Is Inflated and May Burst Again
– Gold Hedges Against Currency Devaluation and Cost Of Fuel, Food, Beer and Housing
– Millennials Can Punt On Bitcoin, Own Gold and Silver For Long Term
– “Time To Position In Gold Is Right Now” says Jim Rickards
– Bloomberg Silver Price Survey – Median 12 Month Forecast Of $20
– “Bigger Systemic Risk” Now Than 2008 – Bank of England
– “Financial Crisis” Coming By End Of 2018 – Prepare Urgently
end
wow!! this is developing to be a quite a story. Turkey imported a huge 2.8 billion USA dollars worth of gold or 68.4 tonnes in July. In June 2.1 billion dollars or 52.5 tonnes. Let’s average the two months at 60 tonnes. Then these guys will import from this day forward 720 tonnes of gold. My goodness, we have China at around 2,000 tonnes, India 1000 tonnes, Russia around 120 tonnes and the world produces 2,200 tonnes net China net Russia which do not let one oz out of the countries. Some sovereign is liquidating their official reserves!!
I
(courtesy zerohedge)
Turks Panic-Buy The Most Gold Ever In July
A funny thing has happened in Turkey since President Recep Tayyip Erdogan installed himself as ‘Sultan for life’…
The Lira collapsed...

And Turks have been importing gold at an unprecedented rate…

As Bloomberg reports, preliminary trade data from Turkey’s Ministry of Customs and Trade showed the deficit widening to $8.8 billion in July.
An eight-fold increase in gold imports to $2.8 billion from $354 million in the same month last year made the precious metal the second-most imported product and one of the main contributors to the trade gap.
June gold imports were also up by 216 percent year-on-year to $2.1 billion, according to final figures reported by Turkstat, the state statistics agency.
The question is – just like in India – how long before Erdogan ‘dictates’ an end to gold imports, imposes tariffs, or confiscates the precious metal?
end
Your early WEDNESDAY morning currency, Asian stock market results, important USA/Asian currency crosses, gold/silver pricing overnight along with the price of oil Major stories overnight
1 Chinese yuan vs USA dollar/yuan WEAKER 6.7228(DEVALUATION SOUTHBOUND /OFFSHORE YUAN MOVES WEAKER TO ONSHORE AT 6.7296/ Shanghai bourse CLOSED DOWN 7.58 POINTS OR 0.23% / HANG SANG CLOSED UP 67.15 POINTS OR 0.24%
2. Nikkei closed UP 94.25 POINTS OR .17% /USA: YEN RISES TO 110.75
3. Europe stocks OPENED IN THE RED ( /USA dollar index FALLS TO 92.96/Euro UP to 1.1827
3b Japan 10 year bond yield: FALLS TO +.078%/ GOVERNMENT INTERVENTION !!!!(Japan buying 100% of bond issuance)/Japanese yen vs usa cross now at 114.34/ THIS IS TROUBLESOME AS BANK OF JAPAN IS RUNNING OUT OF BONDS TO BUY./JAPAN 10 YR YIELD FINALLY IN THE POSITIVE/BANK OF JAPAN LOSING CONTROL OF THEIR YIELD CURVE AS THEY PURCHASE ALL BONDS TO GET TO ZERO RATE!!
3c Nikkei now JUST BELOW 17,000
3d USA/Yen rate now well below the important 120 barrier this morning
3e WTI:: 49.16 and Brent: 51.99
3f Gold DOWN/Yen DOWN
3g Japan is to buy the equivalent of 108 billion uSA dollars worth of bond per month or $1.3 trillion. Japan’s GDP equals 5 trillion usa./“HELICOPTER MONEY” OFF THE TABLE FOR NOW /REVERSE OPERATION TWIST ON THE BONDS: PURCHASE OF LONG BONDS AND SELLING THE SHORT END
Japan to buy 100% of all new Japanese debt and by 2018 they will have 25% of all Japanese debt. Fifty percent of Japanese budget financed with debt.
3h Oil DOWN for WTI and DOWN for Brent this morning
3i European bond buying continues to push yields lower on all fronts in the EMU. German 10yr bund FALLS TO +.494%/Italian 10 yr bond yield DOWN to 2.021%
3j Greek 10 year bond yield RISES to : 5.493???
3k Gold at $1266.80 silver at:16.65 (8:15 am est) SILVER BELOW RESISTANCE AT $18.50
3l USA vs Russian rouble; (Russian rouble DOWN 30/100 in roubles/dollar) 60.65-
3m oil into the 49 dollar handle for WTI and 51 handle for Brent/
3n Higher foreign deposits out of China sees huge risk of outflows and a currency depreciation (already upon us). This can spell financial disaster for the rest of the world/China forced to do QE!! as it lowers its yuan value to the dollar/GOT A SMALL SIZED DEVALUATION SOUTHBOUND
JAPAN ON JAN 29.2016 INITIATES NIRP. THIS MORNING THEY SIGNAL THEY MAY END NIRP. TODAY THE USA/YEN TRADES TO 110.75 DESTROYING JAPANESE CITIZENS WITH HIGHER FOOD INFLATION
30 SNB (Swiss National Bank) still intervening again in the markets driving down the SF. It is not working: USA/SF this morning 0.9691 as the Swiss Franc is still rising against most currencies. Euro vs SF is 1.1462 well above the floor set by the Swiss Finance Minister. Thomas Jordan, chief of the Swiss National Bank continues to purchase euros trying to lower value of the Swiss Franc.
3p BRITAIN VOTES AFFIRMATIVE BREXIT/LOWER PARLIAMENT APPROVES BREXIT COMMENCEMENT/ARTICLE 50 COMMENCES MARCH 29/2017
3r the 10 Year German bund now POSITIVE territory with the 10 year FALLING to +0.494%
The bank withdrawals were causing massive hardship to the Greek bank. the Greek referendum voted overwhelming “NO”. Next step for Greece will be the recapitalization of the banks and that will be difficult.
4. USA 10 year treasury bond at 2.2745% early this morning. Thirty year rate at 2.8798% /POLICY ERROR)GETTING DANGEROUSLY HIGH
5. Details Ransquawk, Bloomberg, Deutsche bank/Jim Reid.
(courtesy Jim Reid/Bloomberg/Deutsche bank/zero hedge)
Dow To Rise Above 22,000 On Apple Earnings; Europe Pressured By Surging Euro
Nasdaq 100 futures jumped 0.8% after Apple surged to record highs following a strong beat and optimistic projections ahead of the launch of the company’s new batch of iPhones. Eminis are little changed, up 0.1% to 2,475, trailing Asian markets, while European stocks and crude oil fall.
Apple surged 6% after-hours to a new record highm taking its market capitalization above $830 billion. That should help carry the Dow through the 22,000 mark when the market opens. Among Asia’s Apple suppliers, LG Innnotek jumped 10 percent and SK Hynix, the world’s second-biggest memory chip maker, rose 3.8 percent. Murata Manufacturing firmed 4.9 percent and Taiyo Yuden 4.4 percent, helping the Nikkei up 0.47 percent.
“It is all about Apple,” said Naeem Aslam chief market analyst at Think Markets. “The firm comfortably topped its forecast and produced stellar numbers for its revenue and profit.”
Oil came under pressure again as higher than expected US inventories and reports of rising OPEC output helped drive prices below back below $48/bbl (WTI crude). In FX markets, the USD dollar gave up some gains late in the session with DXY edging down by 0.1% and the euro rising to $1.1827. Treasury yields are 0.5-2bps higher across the curve with the 10y at 2.273%.
The MSCI tech index for Asia climbed 0.9 percent to ground not trod since early 2000, bringing its gains for the year to a heady 40 percent. Asian markets rose, supported by tech shares after Apple’s surprising beat guidance boost as well as stronger Chinese manufacturing PMIs (the Caixin/Markit survey of private Chinese manufacturing rose to 51.1 in July, its highest level in four months). Japan’s Nikkei gained after the strong Apple sales outlook helped boost tech shares; Korea’s Kospi and the Hang Seng were also firmer while the ASX 200 slipped on commodities pullback. The NZ kiwi dropped sharply after New Zealand’s employment unexpectedly fell. Australian government bonds trimmed early gains after monthly building approvals surged; WTI crude futures drift lower toward $48.50; Dalian iron ore January futures 1.6% weaker
In Europe, the Stoxx Europe 600 Index declined 0.2%, the U.K.’s FTSE 100 Index decreased 0.3 % while Germany’s DAX Index dropped 0.1%. Mining and oil shares weighed on Europe’s benchmark equity index as crude fell for a second day and most industrial metals traded lower. Meanwhile, following its best month since March 2016 the Euro’s gains continued, reached a new two-and-a-half-year high against the ailing dollar, and leading to a stop-loss triggered spike around 4:30am ET, which sent the EURUSD as high as 1.1870, pressuring the Eurostoxx 600 lower, as traders ktrimmed long-dollar positions ahead of U.S. payrolls data on Friday. Rio Tinto Plc led the decline among basic resources shares after first-half profit missed estimates. Banks dropped after Standard Chartered Plc said it can’t resume dividends amid an uncertain recovery, while Societe Generale SA slumped as litigation costs increased. Oil extended a retreat from its brief rise above $50 a barrel as U.S. crude stockpiles expanded, while copper dropped a second day.

“The ECB is going to be the central bank to watch for the rest of the year,” said JP Morgan Asset Management global market strategist Alex Dryden. “We think they are going to take 9-12 months to get out of the market but that is a big question … it could even be six months,” he added.
With the dollar index near a two-year low, the options market shows that traders are gearing up for more euro strength with demand growing for calls, according to Bloomberg. The currency’s strength has pushed European earnings revisions into negative territory, according to Credit Suisse Group AG.

The pound retains bullish trading ahead of the Bank of England policy decision on Thursday, rising as high as 1.3240. European government bonds slipped before Germany’s sale of 10-year bunds, which priced at an average yield of 0.49%, down from 0.59% previously (Bid to cover 1.52, retention of 19.5%).
The key overnight FX move included a tumble in the New Zealand dollar, which fell more than half a percent after second-quarter employment unexpectedly declined. Most emerging Asian currencies fell initially as the dollar recovered after capping a fifth straight month of declines in July. The MSCI EM Asia Index of shares is up for a third day, with bonds in the region mostly higher. However, as the night progressed, dollar gains fizzled and the Bloomberg Dollar Index was down less than 0.1% after bing up 0.1% earlier, following Tuesday’s 0.2% advance, which came after a sharp 2.6% slide in July.
China’s money-market squeeze returned, with sovereign bonds beginning to feel the heat as the central bank keeps liquidity on a tight leash, without adding any net new reverse repo liquidity for another day, and concerns grow about a wall of fund maturities this month. 10-year bond yield little changed at 3.64%, hovering near the highest level in 8 weeks as PBOC refrains from boosting liquidity for third day. Onshore, offshore yuan both drop; Shanghai Composite Index down 0.2%. In a statement on its microblog, SAFE said it didn’t target specific companies as in a media report that it checked their collaterals for loans overseas.
Expect data on MBA mortgage applications later, along with earnings reports from Tesla, MetLife and Time Warner among others.
Market Snapshot
- Dow futures +53
- Dow cash closed +72.80 to 21,963.92
- S&P 500 futures +3.5, up 0.1% to 2,474.75
- S&P 500 cash closed +0.24% to 2,476.35
- 10Y UST yield +2bps to 2.273%
- STOXX Europe 600 down 0.2% to 379.33
- MSCI Asia Pacific down 0.02% to 161.30
- MSAPJ up 0.05% to 531.62
- Nikkei up 0.5% to 20,080.04
- Topix up 0.4% to 1,634.38
- Hang Seng Index up 0.2% to 27,607.38
- Shanghai Composite down 0.2% to 3,285.06
- Sensex down 0.08% to 32,549.91
- Australia S&P/ASX 200 down 0.5% to 5,744.20
- Kospi up 0.2% to 2,427.63
- German 10Y yield rose 0.4 bps to 0.495%
- Euro up 0.5% to 1.1866 per US$
- Italian 10Y yield fell 7.4 bps to 1.727%
- Spanish 10Y yield rose 3.9 bps to 1.477%
- Brent Futures down 0.5% to $51.53/bbl
- old spot down 0.1% to $1,267.36
- U.S. Dollar Index down 0.3% to 92.80
Top Overnight News from BBG
- Apple Results Push Global Tech Higher; White House Considers China Trade Action; Oil Slips on Surprise Jump in Stockpiles
- Apple Inc. gave a revenue forecast that highlighted resilient demand for the iPhone ahead of the launch of its new models and the growing significance of the company’s supporting businesses
- Deutsche Bank AG envisions shifting almost half its U.K. positions to the European continent over coming years as the lender’s Brexit plans take shape
- Auto sales fell the most since August 2010, a year after the federal government’s “Cash for Clunkers” program to stimulate demand came to an end
- Central banks around the globe are stocking up on Treasuries again, giving bond traders one more reason to wager on a steeper U.S. yield curve in the months ahead
- Clients said to have pulled 15% of their assets from Paul Tudor Jones main fund in 2Q
- Trump’s Russia Ties Get No Scrutiny as House Panel Eyes Clinton
- Trump’s CEO Brain Trust Comes Up Short on Big Ideas for Policies
- Democrats Say They Had ‘Bizarre’ Meeting With Trump’s Ex-Im Pick
- Wal-Mart Puts New Scrutiny on Suppliers With Chemicals Project
- Apple FY4Q Rev. View Midpoint Tops Est; Gross Margin View Trails
- Fleetcor Raised $3.975b of Pro-Rata Loans Alongside $350m TLB
- Global Smartphone Sales Rise 5.5% as Xiaomi Re-Joins Top Five
- Teck Says BC Hydro Exercised Right on Interest in Waneta Dam
- Methode to Buy All Pacific Insight Shares for About C$144m Cash
- CVS Sees Removing 17 Products From Standard Control Formulary
- Match Group Names Mandy Ginsberg to Succeed Greg Blatt as CEO
- Amazon Cloud Users Told Not to Bypass China Internet Rules: WSJ
Asian stocks traded mostly higher taking the impetus from Wall Street’s gains where the DJIA homed in on the 22,000 level and NASDAQ futures surged after-market following Apple’s (+5% after-market) strong Q3 earnings. This supported the Apple supply chain and resulted to outperformance of the TAIEX (+0.7%), while Nikkei 225 (+0.6%) was underpinned by a weaker currency. Conversely, losses in the commodities complex and financials weighed on ASX200 (-0.4%), while Shanghai Comp (+0.1%) was indecisive and traded choppy due to a lack of drivers and a reduced liquidity operation by the PBoC. Finally, 10Y JGBs were relatively flat amid the positive risk tone in Japan with only mild gains seen following a respectable Rinban announcement in which the BoJ are in the market for over JPY ltln JGBs ranging from ly to 10Y maturities.
The Kiwi tumbled after ugly jobs data:
- New Zealand Employment Change (Q2) Q/Q -0.2% vs. Exp. 0.7% (Prey. 1.2%)
- New Zealand Employment Change (Q2) Y/Y 3.1% vs. Exp. 4.1% (Prey. 5.7%)
- New Zealand Unemployment Rate (Q2) 4.8% vs. Exp. 4.8% (Prey. 4.9%)
Top Asian News
- GIC Is Said to Invest $100 Million in Japan Activist Fund Misaki
- China Billionaire Triples Wealth and Shorts See a Fat Target
- Hongqiao to Shut and Replace More Than 2 Mln Tons Alu Capacity
- Sleepy Japan Stocks Set for Rude Awakening, Strategists Say
- Noble Group May Challenge Yancoal Equity Raising for Rio Deal
- BNP Paribas Is Said to Expand Japan Operations With 30 Hires
European bourses traded with modest losses with energy and material names underperforming, the latter weighed by Rio Tinto post their soft earnings report. Apple suppliers performing well this morning with the likes of Dialog Semiconductors trading with modest gains after Apple profits rose ahead of analyst estimates. Standard Chartered and SocGen lower this morning following soft financial results. EGB yields ticking higher this morning, while firmer Eurozone PPI figures have also led to the upside. Notable outperformance observed in the German 5Y with the yield falling 0.2bps.
Top European News
- Deutsche Bank Brexit Base Case Said to See 4,000 Jobs Move
- Standard Chartered First Half Adjusted Operating Income $7.2 Bln
- U.K. July Construction PMI 51.9 vs 54.8 in June; Est. 54
- Glencore Asks Australia to Focus on Economy Before Climate Deal
- Brexit Angst Is So 2016 as These Indicators Show: Markets Live
- UniCredit, Mediobanca, Generali to Cut Crossholdings: Repubblica
- Thyssenkrupp Said to Consider Break-Up as Plan B to Tata
In currencies, NZD underperformed last night post the release of soft jobs figures which took NZD back towards 0.74. Consequently, the jobs data alongside the relatively tepid Fonterra GDT auction reinforces the RBNZ’s current neutral stance on interest rates, in the wake of the data, AUD/NZD broke back above 1.07. CAD noticeably weaker this morning, largely on the back of softer crude prices following last night’s surprise API build. The recent bearish trend looks to have broken down with USDCAD now hovering around last week’s high of 1.2577 and looking to make a move above 1.26. JPY weaker across the board, USD/JPY eying 111.00 to the upside after offers just above 110.50 failed to cap strength. EURJPY holding 131.00 for now as gains have been led by rise in EUR/USD which tripped through 118.00. GBP relatively choppy this morning following a sizeable miss on the Construction PMI reading (51.9 vs. Exp. 54.5), GBPUSD ticking off some 20 pips before trading back to pre-announced levels
In commodities, WTI crude futures were drilled below USD 49/bbl following a surprise build in API inventories and a survey which suggested OPEC supply rose in July. Elsewhere, gold (-0.3%) retreated from near 8-week highs amid profit taking and with the safe-haven also dampened by the increased risk appetite, while copper prices were also lower alongside the broad-based weakness across the commodities complex. WTI and Brent crude futures tracking lower following last night’s API report. Iron ore futures also saw a slight pullback from its recent advances, declining over 1% in Asian trade.
Taking a look now at the day ahead, we will get the ADP employment number for July due (190k expected; 158k previous). At present the three month trailing average of ADP private employment gains (179k) is tracking close to that of BLS private payrolls (180k). So our US economist believes it would take a material miss relative to expectations for us to change our payroll forecast. Major US companies due to report earnings include: American International Group (AIG), Metlife, Mondelez International and Time Warner.
US Event Calendar
- 7am: MBA Mortgage Applications, prior 0.4%
- 8:15am: ADP Employment Change, est. 190,000, prior 158,000
- 11am: Fed’s Mester Speaks to Community Banking Conference
- 3:30pm: Fed’s Williams Speaks in Las Vegas on Monetary Policy
DB’s Jim Reid concludes the overnight wrap
Many in the market continue to talk about it being a carry trade until at least Jackson Hole in 3 and a half weeks’ time. The chatter on the US debt ceiling that we’ve discussed before also continues in the background with some saying the Trump administration will struggle to build a consensus around the smooth raising of it as we approach it around October time. The thing that worries investors most from an immediate event risk point of view is an escalation of tensions between the US and North Korea. Could we wake up one morning to find the US has used force in some way in the peninsula? Clearly its impossible to predict but that doesn’t prevent some from using it to handicap their view. We also have the Fed and the ECB likely to stop reinvestment and announce a fresh taper in September and October respectively. So plenty to think about after the holidays are over but for now most investors are riding carry trades. In the days leading up Jackson Hole it’ll be interesting to see if that changes but markets probably have two weeks before it comes into view enough to focus on.
Ahead of the likely August lull, government bond yields fell across all regions and maturities yesterday, with the German Bunds down to the lowest level since early July (2Y: -2bp; 10Y: -5bps). For other sovereigns, the Italian BTPs (2Y: -3bps; 10Y: -8bps) fell the most, followed by the OATs (2Y: -6bps; 10Y: -6bps) and Gilts (2Y: -1bps; 10Y: -2bps). The bund yield started higher in the morning, but fell ~5bp in the afternoon to 0.49%. The change was similar to intraday falls in the UST 10Y, partly driven by the mixed US macro data and lower auto sales by US car markers (sales at GM -15% yoy). To be fair, as we type, UST 10Y yields have bounced back from the lows and is now ~1.5bp higher this morning.
In commodities, WTI oil fell 2 %, marking the first decline after 6 consecutive days of gain. The softness was partly associated with an industry report (American Petroleum Institute) showing rising US inventories and a Reuters survey indicating higher OPEC production in July, led by a further recovery in supply from Libya. Iron ore softened 0.2%, after a 7% rise the day before on positive Chinese steel PMI data. Elsewhere, precious metals were slightly lower (Gold -0.1%; Silver -0.2%) and industrial metals also softened (Copper -0.4%; Aluminium -0.1%).
Onto equities, US bourses continue to edge ahead, following supportive results. The S&P and the Nasdaq were both up 0.2%. The Dow was up 0.3% to another record close – the fifth record high and closer to the 22,000 mark. Within the S&P, modest gains in the financials (+0.8%) and IT sector (+0.5%) were partly offset by losses in health care and industrials. After the bell, Apple was up ~4% on a solid quarterly result and upgraded revenue forecast.
European markets also strengthened, aided by the lower Euro and sound results from BP and Rolls-Royce. The Stoxx 600 was up 0.6%, with most sectors increasing on the day. Utilities and the energy sector was up 1%, while health care was the only sector down (-0.2%). The DAX was up 1.1%, with similar increases across the region: FTSE 100 (+0.7%), CAC (+0.7%) and Italian FTSE MIB (+0.6%). Turning to currency, the US dollar index gained 0.2% on the back of mixed but slightly supportive data. The Euro/USD and Sterling/USD both softened marginally, falling 0.3% and 0.1% respectively.
Turning to Tuesday’s data, the key focus was on the Markit PMI and ISM data out of Europe and the US respectively. Before we take a detailed look at these numbers, we quickly recap some of the other economic data releases out yesterday. Away from the PMIs in Europe we saw the advance Q2 GDP estimate for the Eurozone that came in line with expectations at +2.1% YoY (+0.6% mom), up from +1.9% YoY in Q1. After factoring this in and the clear lift in momentum seen in other indicators, our European team now expects full year growth in 2017 to be 2.2% up (vs. 1.9% previous) and 2018 growth to be 2.0% (vs. 1.6% previous). Meanwhile over in the US personal income growth was flat in June (vs. +0.4% expected) while personal spending also slowed in line with expectations at +0.1% mom (+0.2% previous). Real personal spending was however flat on the month against expectations of an increase of +0.1%.
Turning to the manufacturing PMI data now. In Europe we saw manufacturing PMIs for Germany (58.1 vs. 58.3 flash), France (54.9 vs. 55.4 flash) and the Eurozone (56.6 vs. 56.8 flash) all revised slightly lower. Elsewhere we also got the first look at the Spanish PMI (54.0 vs. 54.5 expected) that disappointed while Italy (55.1 vs. 55.0 expected) and the UK (55.1 vs. 54.5 expected) beat expectations. The UK number had fallen for the last three months and the rise was on the back of the strongest rise in export orders since April 2010. Has the devaluation finally had an impact?
Across the pond the ISM reading dipped to 56.3 (vs. 56.4 expected; 57.8 previous), but was largely in line with expectations. The production index fell to 60.6 (vs. 62.4 previous) while new orders slipped to 60.4 (vs. 63.5 previous). New export orders also fell to 57.5 (vs. 59.5 expected). One interesting dynamic to take note of is the prices paid index that climbed significantly more than expected to 62.0 (vs. 55.8 expected; 55.0 previous). Of the 18 manufacturing industries surveyed, 14 reported an increase in the prices paid for raw materials in July. While part of the climb could be attributed to the fact that the index was quite low in June (lowest level since November 2016), the US dollar weakness in July likely played an important role in driving up raw material costs for US manufacturers.
Away from the markets, the WSJ reported that US senate democratic leader Schumer wrote to President Trump and urged him to put all Chinese M&A activity in the US on hold until China takes more aggressive actions to address the evolving North Korean situation.
This morning, Asian markets have followed the lead from US, with the Nikkei (+0.4%), the Kospi (+0.2%) and Hang Seng (+0.3%) all higher but with Chinese bourses broadly flat.
Taking a look now at the day ahead, today’s calendar appears to be fairly quiet. In Europe the Eurozone PPI for June (-0.1% mom expected; -0.4% previous) is the only data of note, while the US has the ADP employment number for July due (190k expected; 158k previous). At present the three month trailing average of ADP private employment gains (179k) is tracking close to that of BLS private payrolls (180k). So our US economist believes it would take a material miss relative to expectations for us to change our payroll forecast. Major US companies due to report earnings include: American International Group (AIG), Metlife, Mondelez International and Time Warner.
3. ASIAN AFFAIRS
i)Late TUESDAY night/WEDNESDAY morning: Shanghai closed DOWN 7.58 POINTS OR 0.23% / /Hang Sang CLOSED UP 67.15 POINTS OR 0.24% The Nikkei closed UP 94.25 POINTS OR .17%/Australia’s all ordinaires CLOSED DOWN 0.45%/Chinese yuan (ONSHORE) closed DOWN at 6.7228/Oil DOWN to 49.16 dollars per barrel for WTI and 51.99 for Brent. Stocks in Europe OPENED IN THE RED , Offshore yuan trades 6.7296 yuan to the dollar vs 6.7228 for onshore yuan. NOW THE OFFSHORE IS WEAKER TO THE ONSHORE YUAN/ ONSHORE YUAN WEAKER (TO THE DOLLAR) AND THE OFFSHORE YUAN IS MUCH WEAKER TO THE DOLLAR AND THIS IS COUPLED WITH THE SLIGHTLY WEAKER DOLLAR. CHINA IS HAPPY TODAY
3a)THAILAND/SOUTH KOREA/NORTH KOREA
NORTH KOREA/USA
The USA launches a minuteman ICBM in a warning to North Korea
(courtesy zero hedge)
In Warning To North Korea, US Releases Video Of Overnight Minuteman ICBM Launch
As previewed last night, at 2:10am PT, the U.S. military successfully test-launched an unarmed Intercontinental Ballistic Missile from Vandenberg Air Force Base in California, about 130 miles northwest of Los Angeles, and just days after North Korea’s second test of an ICBM. An Air Force statement said that the test was not a response to recent North Korean actions, but shows that America’s nuclear enterprise is “safe, secure, effective and ready to be able to deter, detect and defend against attacks on the United States and its allies.”
The launch is said to “validate and verify the effectiveness, readiness, and accuracy of the weapon system,” according to Colonel Michael Hough, commander of Air Force Global Strike Command’s 30th Air Wing.
“Team V is postured to work with Air Force Global Strike Command to test launch the Minuteman III missile,” Hough said in a statement. “Our long history in partnering with the men and women of the 576th Flight Test Squadron shows that the Western Range stands ready and able to create a safe launch environment.”
The ICBM was equipped with a test reentry vehicle – just like the previous three launches in 2017 – which officials said showed it traveled about 4,200 miles to the Kwajalein Atoll in the Marshall Islands. The operation was conducted by a team of Air Force Global Strike Command Airmen from the 90th Missile Wing, along with the 576th Flight Test Squadron and the 30th Space Wing stationed at Vandenberg.
This is the fourth Minuteman ICBM launched from the Vandenberg base this year. The first 2017 test took place in February, involving a Minuteman III that traveled to the Marshall Islands, carrying a non-explosive warhead. Another test was conducted by the Air Force on April 26. Days later, a third test missile launched from Vandenberg base.
Air Force Global Strike Command has tested 299 Minuteman III ICBMs over the program’s history. The Minuteman IIIs are the U.S. military’s only land-based ICBMs. And while some have suggested that the launches are in direct retaliation to the recent NKorea ICBM launch, the U.S. military schedules four test-launches each fiscal year, with the actual schedule plotted out several years in advance, so it’s unrelated to recent events, Air Force Capt. Michele Rollins, a spokesperson for the strike command, told NBC.
Last week, North Korea tested an ICBM for the second time. The missile flew for 45 minutes and traveled more than 1,000 kilometers laterally, defense officials and analysts said. U.S. officials believe the missile broke up upon re-entering the atmosphere.

The Minuteman III ICBM launches during an operational test at 2:10 a.m. PT
on Aug. 2, 2017, at Vandenberg Air Force Base in California
Analysts said that the North’s test Friday demonstrated that a broader part of the mainland United States, including Los Angeles and Chicago, is now in range of Pyongyang’s weapons. Asked about possible U.S. military action against North Korea, White House Press Secretary Sarah Huckabee Sanders reiterated on Tuesday that “all options are on the table” but the administration would not “broadcast what we’re going to do.”
The focus for the administration remains on stopping North Korea’s nuclear program and halting their aggression, Sanders said.
As we reported yesterday, Sen. Lindsey Graham said Tuesday that President Donald Trump has told him he’s willing to go to war over North Korea’s missile program if the rogue nation continues to aim ICBMs at America.
Meanwhile, Japanese Foreign Ministry spokesman Norio Maruyama said he was unaware of the remarks, but that his country was in favor of the Trump administration’s posture “using both words and action to show that all choices are on the table.”
Separately, another longstanding ally in the region, the Philippines, is set to host an international regional security meeting on Monday, when leaders could pressure Pyongyang to halt its intermediate-range missile tests. Secretary of State Rex Tillerson is expected to attend the meeting in Manila. On Wednesday, Philippine President Rodrigo Duterte went on the attack against North Korean leader Kim Jong Un, whom he referred to in a speech as a “fool” and a “son of a bitch” according to Reuters.
“That chubby face that looks kind … If he commits a mistake, the Far East will become an arid land,” Duterte said. “It must be stopped, this nuclear war.”
“A limited confrontation and it blows up here, I will tell you, the fallout can deplete the soil, the resources and I don’t know what will happen to us,” he added. Duterte has previously called for the U.S. to show restraint in dealing with Kim’s totalitarian regime.
b) REPORT ON JAPAN
end
c) REPORT ON CHINA
Trump set to initiate section 301 of the 1974 Trade Act which calls for an investigation into the trade practices of a particular country. If it finds fault, then sanctions and cancelling of licenses etc can be called into play. The USA seems to be snubbing the WTO
(courtesy zero hedge)
Trump Set To Retaliate To China’s “Unfair Trade Practices”
President Trump has given China six months to prove that it is committed to preventing a nuclear-armed North Korea, and it seems his tolerance for China’s dithering has finally reached its limit. Now that President Xi Jinping has established that his government is unwilling to engage in a meaningful crackdown on its neighbor, the era of using carrots like improving trade relations to coax China into helping solve the “North Korea problem” has ended. It is now time for the stick.
According to reports in the New York Times, Wall Street Journal and Associated Press, the Trump administration is planning to use an obscure 1970s law to launch a “broad-based” investigation into whether China’s trade-related intellectual property policies constitute “unfair trade practices.
The US inquiry could become an obstacle for one of the Communist Party’s top economic priorities: the Made in China 2025 initiative, which calls for China to become a “global leader” in ten industries with the help of huge infusions of state money.

In the coming days, the US trade rep will launch a “Section 301” investigation, named after a portion of the 1974 Trade Act. Here’s a breakdown of the likely timeline for the investigation, as well as possible outcomes, courtesy of the NYT:
“Under the process that the Trump administration plans to set in motion, the Office of the United States Trade Representative will start an investigation into China’s trade practices. Following the investigation, which could be completed in as little as a few months, the United States could impose steep tariffs on Chinese imports, rescind licenses for Chinese companies to do business in the United States, or take other measures. The process is known as a Section 301 investigation, after the relevant portions of the 1974 Trade Act.”
Another option being considered by the Trump administration would involve invoking the International Emergency Economic Powers Act, another 1970s law that gives the president broad powers to regulate commerce after declaring a “national emergency,” according to WSJ.
A Section 301 investigation could “pave the way for the U.S. to impose sanctions on Chinese exporters or to further restrict the transfer of advanced technology to Chinese firms or to U.S.-China joint ventures.”
This latest – and, to date, most aggressive – change of heart follows an unsuccessful meeting on July 21 between US and Chinese trade officials where the two sides failed to agree to anything beyond an Obama-era trade deal. Bilateral trade talks had earlier shown some progress when the two sides agreed to an expansion of the Obama trade deal back in May.
It’s also the latest vacillation in the administration’s China stance since Trump initially decided to soften his China-bashing campaign rhetoric following a meeting with President Xi at Mar-a-Lago back in April.
In the past, Trump has hammered China for its massive trade surplus and widespread government intervention in its corporate sector. But by instead focusing the investigation on intellectual property, the administration is going to bat for business groups that have long griped about China’s penchant for stealing trade secrets, according to WSJ.
“American business frustration with Chinese trade and market-access practices has mounted in recent years, with U.S. business groups urging the government to take a tougher trade line with China. Many organizations have complained that the Trump administration hasn’t pushed hard enough in areas like intellectual property, as it has focused more on Chinese manufacturing and China’s $347 billion trade surplus with the U.S. last year.
That discontent has intensified as China’s economy continued to expand and its computer and software sectors became bigger competitors internationally. Western firms fear China will use the regulations to bar foreign investments in areas that Beijing targets for investment, including semiconductors, advanced-machine tools and artificial intelligence.”
Many questions remain, but one of the biggest is the role that the WTO will play in resolving a trade dispute between the world’s two largest economies. Trump administration officials have in the past favored a unilateral approach that circumvents the WTO, according to WSJ.
“One big question hanging over the White House review is whether the administration pursues any complaint through the World Trade Organization, or whether it chooses to impose penalties on its own without first seeking permission from the international body, which some Trump advisers have argued is incapable of dealing with China’s trade practices. Trump aides have regularly vowed to pursue a more unilateral approach to trade but have so far done little along those lines.”
Just invoking Section 301 would be an implicit snub to the WTO, which was created to prevent unilateral actions in trade disputes, WSJ continues.
“Widely used in the 1970s and 1980s, Section 301 cases have largely disappeared since the 1995 creation of the WTO, which has its own dispute-settlement process. A main goal of the Geneva-based institution was to curb such unilateral trade actions and to have them handled by a more neutral international arbiter. U.S. administrations over the past two decades have decided to steer nearly all trade complaints through the WTO and have rarely touched Section 301.”
Notably, the last Section 301 case was brought by a union, and was largely ineffective, as the NYT notes.
“The last Section 301 case was in 2010 and was initiated by a labor union, the United Steel Workers, instead of by the government, as the Trump administration is preparing to do. The case focused on Chinese business practices in the solar panel and wind turbine industries, and the Chinese government later promised to limit some of these practices.
But China’s solar and wind turbine industries have gone on to dominate their global industries, after receiving multibillion-dollar loans from China’s state-controlled banking system despite major defaults on earlier loans.”
Trade Representative Robert Lighthizer worked on many Section 301 investigations during his stint as a deputy trade rep in the Reagan administration. As the NYT notes, the US “energetically” invoked Section 301 to resolve trade disputes during the 1980s (notably before the birth of the WTO).
Of course, other WTO members could be reluctant to chastise the US for confronting China over its intellectual-property policies, which in many cases are tantamount to extortion, as China demands companies essentially hand over their trade secrets in exchange for access to the Chinese market. According to the AP, “foreign companies have long complained over rampant piracy and technology theft by Chinese companies.” It’s a testament to the Communist Party’s power that China has been allowed to steal technology from other companies and countries with impunity.
A confrontation is overdue.
4. EUROPEAN AFFAIRS
EU/ITALY
the European migrant crisis escalates again with Italy impounding a German NGO refugee ship. Italy is getting no help from the EU on the migrant issue.
(courtesy zero hedge)
European Migrant Crisis Escalates: Italy Impounds German NGO Refugee Ship
In the latest shot across the bow by Italy in Europe’s latest refugee crisis, BBC and AP report that the Italian Coast Guard has impounded a German NGO migrant rescue boat and is questioning its crew on the isle of Lampedusa, amid a growing dispute over Italy’s code of conduct for handling migrants at sea. Lampedusa is a tiny Italian island near North Africa which has struggled to house boatloads of migrants in recent years.
The Iuventa, which is operated by the German NGO Jugend Rettet previously discussed in “NGO Fleet Bussing Migrants Into The EU Has Ties To George Soros, Hillary Clinton Donors“, called the Italian check “a standard procedure”.
The reason for the escalation is that Jugend Rettet, Doctors Without Borders (MSF) and various other aid NGOs have rejected a new Italian “code of conduct” when it comes to dealing with refugees, according to which Italy plans to send warships close to the Libyan coast to pick up migrants, bypassing Europe’s NGO fleet altogether. According to BBC, the Italian parliament is debating the plan, which has already been agreed upon by the government, and aims to stopping the flow of unstable, overcrowded migrant boats across the Mediterranean to Italy.

A tweet from Jugend Rettet (Youth Rescues) said the Iuventa “was not confiscated. Our crew is not arrested. What happened is a standard procedure,” it said.
The IUVENTA was not confiscated. Our Crew is not arrested. What happened is a standard procedure. We wait for more Infos.
Two Syrian migrants were taken ashore from the vessel, Italian media reported.
One week ago, Libya asked for Italian naval support in its battle against human smugglers operating in its territorial waters, a move that Rome has long considered vital to stemming the wave of migration from north Africa to Europe. After meeting Fayez al-Serraj, head of Libya’s UN-backed government, Paolo Gentiloni, Italy’s prime minister, said the request was being weighed by the Italian defence ministry. Most of the migrants arriving in Italy set off from a stretch of coastline west of Tripoli, the Libyan capital.
“It is very relevant news in the fight against human trafficking in Libya, if we respond positively. I believe this is necessary,” said Mr Gentiloni.
Italy has already offered the Libyan coast guard aid and training to intercept migrants before they reach international waters. Even so, the Libyan coast guard’s ability to monitor its coastline is limited by a lack of resources and the weakness of Mr Serraj’s government, which has struggled to exert its influence beyond Tripoli.
As the FT reported last week, the breakthrough on the joint Libyian-Italian naval missions came a day after Serraj met General Khalifa Haftar, a renegade military officer whose forces control much of eastern Libya, to try to forge a peace deal and move to elections next year. Serraj and Gen Haftar met in Paris, shepherded by Emmanuel Macron, the French president, in a diplomatic move which as discussed previously infuriated Rome as Italy is at the centre of diplomatic activity in Libya.
On Monday three out of nine aid NGOs nine operating in the central Mediterranean, accepted the Italian code of conduct. But MSF and Jugend Rettet object to the requirement for armed police to board their ships and for rescuers to stop transferring migrants from one ship to another. They want to minimise their trips back to port, because those trips cost them precious time and money.
As a reminder, Médicins Sans Frontiéres also operates several ships in the migrant fleet – the Dignity 1, the Bourbon Argos and the Aquarius. As reported previously, MSF has received funding from George Soros’ Open Society Foundation.
Meanwhile, Italy which has expressed growing frustration and recently anger with Europe’s unwillingness to assist it with its growing refugee problem which has resulted in nearly 100,000 migrants landing in Italy with an uncertain future, says its naval deployment is being negotiated with the UN-recognised Libyan government in Tripoli, led by Prime Minister Fayez Sarraj. Sarraj said his administration had agreed to receive only training and arms from Italy. “Libya’s national sovereignty is a red line that nobody must cross,” he said.
The Libyan foreign ministry later said preventing the illegal flow of migrants – a lucrative business for people smugglers – “may require the presence of some Italian naval vessels to work from Tripoli’s maritime port, for this purpose only“. But Italy’s role would have to be coordinated with the Libyan authorities, the statement said.
As reported previously, more than 94,000 migrants have crossed the Mediterranean to Italy so far this year, – a record number. More than 2,370 have died trying to reach Italy.
Migrants picked up in Libyan coastal waters – and not international waters – can be legally returned to Libya, but aid workers say conditions in migrant reception camps there are dire, in large part because nobody else in Europe wants to grant the refugees currently in Italy access. Since 2015 as many as a dozen NGO aid ships have been patrolling off Libya to pick up migrants in distress. So far this year they have handled 35% of the rescues, Italy’s Coast Guard says.
end
5. RUSSIA AND MIDDLE EASTERN AFFAIRS
Russia/USA
the mood is quite sombre as USA officials begin packing up reading to leave Moscow on orders from Putin
(courtesy zero hedge)
“The Mood Is Very Pessimistic”: US Begins “Removing Furniture And Equipment” From Seized Compound In Russia
Two days after Russian President Vladimir Putin formally expelled 755 American diplomats and announced plans to seize two compounds used by US State Department employees, US officials have started “removing furniture and equipment from the compounds”, according to Reuters.
The early start suggests that the US is making every effort to comply with Putin’s demand that the US reduce its 1,200 diplomatic personnel by 60% before Sept. 1, made in retaliation to a bill authorizing fresh sanctions against Russia that President Donald Trump is expected to sign. Late last year, the Obama administration expelled 35 Russian diplomats and seized two Russian diplomatic compounds near Washington, D.C. Putin refrained from responding at the time.

According to Reuters, the movers at the US compounds arrived at around 7 a.m. (0400 GMT) and were seen packing furniture, including beds and lamps, into three white vans over the course of three hours.
Ironically, the US is allowed to choose who stays and who leaves. Because of this, it’s expected that many of those who will be let go will be Russian citizens, Reuters noted. Putin’s decision has severely impacted morale among State Department employees, many of whom have given up on working and are instead updating their resumes and looking for new jobs online, Reuters reports.
“One person at the embassy, who spoke on condition of anonymity because they are not authorized to talk to the media, said staff there were feeling depressed and despondent as they came to terms with the Kremlin’s order.
‘The mood in the office is very pessimistic,’ the person said. ‘Everyone is just loitering, or sitting on job websites looking for a new job.’”
Reuters also noted that Putin’s ultimatum was carefully calibrated to preserve his relationship with Trump after the two world leaders purportedly hit it off over the course of several meetings at a G-20 summit in Hamburg last month.
“The ultimatum issued by the Russian leader is a display to voters at home that he is prepared to stand up to Washington – but is also carefully calibrated to avoid directly affecting the U.S. investment he needs, or burning his bridges with Trump.”
Congress’s sanctions bill risks derailing already tense US-Russia relations, despite Trump’s expressed desire to work more closely with Russia on areas of mutual benefit like containing ISIS in Syria. Vetoing the bill would be seen as a waste of political capital by Trump, who is fighting off allegations that his campaign colluded with the Russian government to tilt the election in his favor, because Congress, which passed the bill with overwhelming majorities in both the House and Senate, would likely be able to override it with a 2/3rds majority.
Despite Trump’s calls for closer ties, the Pentagon may be already contemplating its next steps in the escalating conflict with Russia, which as the WSJ reported will likely involve supplying Ukraine with antitank missiles and other weaponry – a red line for the Kremlin not even the Obama administration dared to cross.
By escalating tensions with Russia, the US also risks straining its relationship with Europe. On Monday, the Germany economy minister said that new penalties against Moscow proposed by US lawmakers violate international law, and that officials in Brussels should consider countermeasures.
Speaking to Funke Mediengruppe newspaper, Brigitte Zypries said that “we consider this as being against international law, plain and simple.” She added that “of course we don’t want a trade war. But it is important the European Commission now looks into countermeasures.”
She also said that “the Americans can not punish German companies because they operate economically in another country.” Retaliatory measures may include limiting US jurisdiction over EU companies, according to a memo leaked to the Financial Times and Politico last month. Some European government officials object to language in the sanctions bill that could limit interactions between US and Russian energy firms related to the construction of pipelines, which European officials believes could damage their trade relationship with Russia.
Russian PM: “The U.S. Just Declared Full-Scale Trade War On Russia”
Several hours after President Trump officially signed the new Russian sanctions into law – despite his reservations and his statement that while he favors “tough measures to punish and deter aggressive and destabilizing behavior by Iran, North Korea, and Russia, this legislation is significantly flawed” – Russia responded when moments ago Russian Prime Minister Dmitry Medvedev said on his FaceBook page that any hopes of improving Russian relations with the new US administration are dead, that the Trump administration demonstrated complete impotence by transferring executive power to Congress “in the most humiliating manner”, and most notably, that the US just declared a full-scale trade war on Russia.
From Medvedev’s facebook page:
The signing of new sanctions against Russia into law by the US president leads to several consequences. First, any hope of improving our relations with the new US administration is over. Second, the US just declared a full-scale trade war on Russia. Third, the Trump administration demonstrated it is utterly powerless, and in the most humiliating manner transferred executive powers to Congress. This shifts the alignment of forces in US political circles.
What does this mean for the U.S.? The American establishment completely outplayed Trump. The president is not happy with the new sanctions, but he could not avoid signing the new law. The purpose of the new sanctions was to put Trump in his place. Their ultimate goal is to remove Trump from power. An incompetent player must be eliminated. At the same time, the interests of American businesses were almost ignored. Politics rose above the pragmatic approach. Anti-Russian hysteria has turned into a key part of not only foreign (as has been the case many times), but also domestic US policy (this is recent).
The sanctions codified into law will now last for decades, unless some miracle occurs. Moreover, it will be tougher than the Jackson-Vanik law, because it is comprehensive and can not be postponed by special orders of the president without the consent of the Congress. Therefore, the future relationship between the Russian Federation and the United States will be extremely tense, regardless of the composition of the Congress or the personality of the president. Relations between the two countries will now be clarified in international bodies and courts of justice leading to further intensification of international tensions, and a refusal to resolve major international problems.
What does this mean for Russia? We will continue to work on the development of the economy and social sphere, we will deal with import substitution, solve the most important state tasks, counting primarily on ourselves. We have learned to do this in recent years. Within almost closed financial markets, foreign creditors and investors will be afraid to invest in Russia due to worries of sanctions against third parties and countries. In some ways, it will benefit us, although sanctions – in general – are meaningless. We will manage.
Separately, Russia’s foreign minister Sergey Lavrov said that Russia retains the right to impose new counter-measures, adding the US sanctions are short-sighted, and risk harming global stability. He concludes that and attempts to pressure Russia will not make it change course.
Echoing Lavrov, earlier on Wednesday the permanent representative to the UN, Vassily Nebenzia said Moscow “won’t bend” and has no plans to change its policies following Donald Trump’s signing of new anti-Russian sanctions.
“Those who invented this bill, if they were thinking that they might change our policy they were wrong, as history many times proved. They should have known better that we do not bend and do not break,” Nebenzia told journalists in New York.
“Some of the US officials were saying that this is a bill that might encourage Russia to cooperate… This is a strange form of encouragement. But it is not our habit to be resentful children,” continued the diplomat, who promised that Moscow would “not relent on finding means and ways” to cooperate in the international arena over issues such as Syria.
The Kremlin also chose not to escalate the situation further. “This changes nothing. There is nothing new here,” Vladimir Putin’s press secretary, Dmitry Peskov, told the media in Moscow. “Counter-measures have already been taken.”
And now we await a similar announcement from the European Union.

Surreal headline of the day
Turkey Bans Concerts, Hunger Strikes, Public Gatherings And Protests In Ankara
In the latest Turkish crackdown on civil freedoms, the governor’s office in Turkey’s capital, Ankara, announced a month-long ban on public gatherings and all forms of protests, including sit-ins, hunger strikes, concerts and similar gatherings in order to “protect public order” claiming that such activities increase the chances of terrorist attacks. The statement from the Ankara governor’s office was released amid fears of protests following the arrest of two Turkish teachers, Nuriye Gulmen and Semih Ozakca, who have been on hunger-strike for 140 days after losing their jobs during the public sector purges that followed the failed coup in July 2016.
The governor’s office said all mass events such as sit-ins, hunger-strikes and open-air concerts offered a target to groups like the Islamic State terror organization and are therefore to be banned in Ankara throughout the month of August.
Previously, the Turkish Constitutional Court rejected a petition for the release of the two fired educators and argued that being in prison did “not pose a threat to their lives and physical or moral integrity” although a statement by the lawyers of educationists said their health was deteriorating and they were facing heart failure.
This crackdown on virtually all forms of public gatherings was put in place in accordance to an article of a law on meetings and demonstrations under the national state of emergency that has been in effect since the failed coup.
Officials gave further justification to their latest ruling by linking the detained teachers to the Revolutionary People’s Liberation Party, a far-left group that is considered a terrorist organization by Turkey, the United States and the European Union.
Under the current – and unlikely to ever end – state of emergency, Turkish officials can cite public safety concerns to directly impose laws that may strip away fundamental rights, such as the right to peaceful protest, without having to pass legislation through the traditional channels.
end
Saudi Arabia/Qatar
we are back to square one with respect to the original 13 demands of Qatar from the Saudi block
(courtesy Paraskova/OilPrice.com)
“We’re Back To Square One” – Saudi Bloc Reinstates Demands As Qatar Economy Collapses
Authored by Tsvetana Paraskova via OilPrice.com,
The four countries leading the boycott against Qatar are going back to their list of 13 demands for Doha to meet before talks can start, essentially reverting the Arab Gulf spat back to square one.

At the same time, economic data for June shows that Qatar’s imports plummeted due to the blockade imposed by most of its neighbors, and foreign deposits at Qatari banks dropped to their lowest in nearly two years.
However, Qatar has a huge sovereign wealth fund, and boasts considerable foreign exchange reserves. Although Qatar’s non-oil economy is expected to see some pressure due to the fact that it has to use alternative trade routes, the world’s largest LNG exporter has not seen its LNG trade disrupted yet, which is precisely why analysts do not see the blockade as potentially crippling Qatar’s economy. Rather, they see it as merely straining economic growth.
Saudi Arabia, Bahrain, Egypt, and the United Arab Emirates (UAE) – the four countries leading the boycott on Qatar – issued on June 22 a list of 13 demands to Qatar, which included severing ties with Saudi archrival Iran, and shutting down the Al-Jazeera TV network.
Two weeks ago, diplomats from the four countries signaled that they no longer wanted Qatar to comply with the 13 demands, instead proposing six broad principles that they want Qatar to sign onto. The principles included denying safe havens and financing to terrorists, combating terrorism and extremism, stopping incitement of hatred and violence, and refraining from interfering in the internal politics of other countries, the New York Times reported.
This past Sunday, however, the four countries said that apart from the six principles, they insisted on Qatar meeting those 13 demands, reverting to their original conditions, which analysts had thought were too steep for Qatar to meet.
“We are back to square one,” Abdullah Al-Shayji, a political science professor at Kuwait University, told Bloomberg, commenting on the latest twist in the Qatar crisis.
“We have not progressed an inch because we were under the impression that the 13 demands were not only null and void but channeled into six principles. It seems that they are not budging and are escalating,” Al-Shayji said.
The blockade imposed by the four states is forcing Qatar to seek alternative—and more expensive—routes for trade, and its imports dropped in June by 40 percent compared to June last year, Bloomberg data show.

Qatar is flying in cows from Germany to address milk demand, and is arranging new shipping routes through ports in neutral Oman.
But Qatar’s continuing oil and gas exports, as well as significant forex reserves, are the reason why analysts are not as pessimistic as they would have been if LNG trade were disrupted or cash reserves low. The latest Reuters poll on the Gulf economies lowered expectations for Qatar’s economic growth this year to 2.3 percent from the previous 3.5-percent-growth forecast. Still, analysts expected Qatar to outperform most of its neighbors, including Saudi Arabia whose median GDP growth estimate was reduced to just 0.1 percent this year, from 0.5 percent expected earlier.
The Qatar Central Bank has US$40 billion in cash reserves plus gold, while the Qatar Investment Authority has US$300 billion in reserves that it could liquidate, the Governor of Qatar Central Bank, Sheikh Abdulla Bin Saud Al-Thani, told CNBC in an interview in early July, one month into the blockade. “We have enough cash to preserve any – any kind of shock,” the governor said.
Qatar’s LNG flows are stable, Steve Hill, Executive Vice-President for Gas and Energy Marketing and Trading at one of the largest LNG traders, Shell, said on July 10.
On July 4, Moody’s changed the outlook on Qatar’s rating to negative from stable, on expectations that the dispute would not end quickly. But the rating agency affirmed the long-term issuer and senior unsecured debt ratings of Qatar, citing “sizable net asset position of the government and exceptionally high levels of wealth.”
“Moody’s also acknowledges the fact that as long as hydrocarbon exports are not disrupted, the ongoing dispute will not affect the overwhelming majority of foreign exchange receipts in the current account balance and the bulk of government revenues,” the rating agency noted.
An end to the dispute is currently nowhere in sight. Just a day after the four states reverted to their 13 demands, Qatar said that it had filed a complaint with the World Trade Organization (WTO) to challenge the boycott.
Qatar requested consultations with Saudi Arabia, Bahrain, and the UAE, triggering a 60-day period for the three countries to either settle the trade complaint or face litigation at the WTO, Reuters reported, citing the director of Qatar’s WTO office Ali Alwaleed al-Thani.
6 .GLOBAL ISSUES
7. OIL ISSUES
WTI slides again after another disappointing crude drawdown. Production continues to rise with all of the rigs going at full blast
(courtesy zero hedge)
WTI Slides After Disappointing Crude Draw & Production Surge
WTI prices dumped on last night’s surprise crude build but have limped back above $49 heading into the DOE prints this morning (although Russia sanctions headlines dipped it). DOE did not help as the report was a disappointment for the bulls with production rising to a new cycle high, crude inventories drawing less than expected but total U.S. oil inventories (that’s crude plus all products, including the often volatile “other oil” category) rose by 1.1 million barrels last week.
API
- Crude +1.78mm (-3.1mm exp)
- Cushing +2.562mm (-700k exp)
- Gasoline -4.827mm (-1mm exp)
- Distillates -1.225mm
DOE
- Crude -1.53mm (-3.1mm exp)
- Cushing -39k (-700k exp)
- Gasoline -2.52mm (-1mm exp)
- Distillates -150k
API’s surprise crude build was offset by DOE’s draw – but it was a disappointingly small draw… and gasoline’s draw was smaller than API’s…Cushing inventory is now down 15 of the last 16 weeks while crude inventories are down 15 of the last 17 weeks.

Gaoline demand rose to a new record high 9.84mm b/d.
Venezuela shipped 820,000 barrels a day, a 23 percent increase over last week, even amid reports that some U.S. refiners have started to seek alternatives to barrels from the imperiled Latin American producer.

As Bloomberg’s Javier Blas noites, Saudi Arabia has shipped 1.088 million barrels a day on average to the U.S. over the last twelve months. Last week, it shipped 1.174 million b/d, above the annual average and despite promises earlier this year that it will cut significantly supplies into the U.S. For the kingdom, the surge has two big problems: 1) it delays the rebalance of the U.S. market, 2) it destroys the credibility of Saudi oil minister Khalid Al-Falih, who put its reputation at risk promising publicly a “measured” drop in flows.

Crude Production (in the Lower 48) topped 9mm last week for the first time since July 2015, and this week it rose once again to a new cycle high…

WTI bounced back from the API surprise plunge but dropped into the DOE print on Russia sanctions headlines… and then extended its losses – back to API lows – on the production surge and total inventoiry build…

Nitesh Shah, a commodities strategist at ETF Securities told Bloomberg: “The headlines from Saudi Arabia’s export cuts a few days ago pushed prices over $50 but when you scratch under the surface there’s still a lot of bearishness out there.”
8. EMERGING MARKET
VENEZUELA
We are now witnessing the beginning of hyperinflation in Venezuela. In a few short weeks-to a few months, we will see bolivar rates equal to that of Zimbabwe.
(courtesy zero hedge)
Venezuela Bolivar Loses A Third Of Its Value In The Past Week
With events in Venezuela now well into the endgame, following US sanctions that named “dictator” Maduro personally and a likely subsequent sanction that will cripple Venezuela’s oil industry promptly resulting in the nation’s insolvency as it loses its last remaining source of revenue, things are moving fast. So fast, in fact, that according to Reuters, Venezuela’s money supply surged 10% in just one week earlier this month, its largest single-week rise in a quarter of a century.
Meanwhile, in addition to now daily protests and strikes, Venezuela is undergoing a major economic crisis, with millions suffering food shortages, monthly wages worth only the tens of U.S. dollars, and soaring inflation – although no official data is available. The central bank said late on Friday the total amount of local currency in circulation, or M2 as of July 21, was 27.3 trillion bolivars, up 9.66% from the previous week.
Obviously, the exponential rise in M2, the sum of cash, together with checking, savings, and other deposits, also means an exponential rise in the amount of currency circulating. As a result, Venezuela’s money supply is up 384% in the last year. In contrast, the United States’ money supply is up 5.5% in the same period.
This means that Venezuelans are forced to carry huge bundles of cash to make basic purchases, if they can afford to do so given weekly price rises on many goods of course.
This means hyperinflation.
Today, the Dolar Today website reported that Venezuela’s black market exchange rate surged past 14,000 bolivars per dollar.

When President Nicolas Maduro came to power in April 2013, it was at 24 per dollar.
Putting the country’s bitter economic end in context, the bolivar has lost a third of its value in the past week.

That takes care of the economy, as for how how socialism ends in a social context, in a poll released today Gallup found the Venezuela is now the least safe country in the world.
Venezuela’s score on Gallup’s Law and Order Index — its annual global gauge of how secure people feel — continued to follow the country’s descent into chaos in 2016. The country’s index score of 42 out of 100 was the lowest in the world last year. This number is likely even worse now as the country’s economic and political crisis deepens, including the election on Sunday that critics, including the U.S. and a growing list of nations, are denouncing as a “sham.”
Across 135 countries, Law and Order Index scores in 2016 ranged from a high of 97 in Singapore to the low of 42 in Venezuela. The index is based on people’s reported confidence in their local police, their feelings of personal safety, the incidence of theft in the past year and — for the first time in 2016 — the incidence of assault and mugging in the past year.
Venezuela’s scores on all of the individual questions that make up the current index were worse last year than at any point in the past decade. Just 12% of Venezuelans in 2016 said they felt safe walking alone at night where they live, and 14% expressed confidence in their police. These are not only the worst on record for Venezuela, but the worst for any country last year — and for the past 10 years.
To put Venezuela’s 12% who feel safe walking alone at night into perspective, the next-lowest figure in 2016 was more than twice as high as Venezuela: 28% in El Salvador. Among the 12 countries in which residents are least likely to say they feel safe walking alone at night, five are in Latin America. Another six are in sub-Saharan Africa — including two of that region’s more economically developed countries, South Africa (37%) and Botswana (38%).
At the same time, 38% of Venezuelans said they had had property or money stolen in the past year. This is up more than 10 percentage points from the previous year and a new record high for the country. Only five countries — all in sub-Saharan Africa — had higher percentages than Venezuela in 2016.

Your early morning currency/gold and silver pricing/Asian and European bourse movements/ and interest rate settings WEDNESDAY morning 7:00 am
Euro/USA 1.1827 UP .0017/REACTING TO + huge Deutsche bank problems + USA election:/TRUMP HEALTH CARE DEFEAT//ITALIAN REFERENDUM DEFEAT/AND NOW ECB TAPERING BOND PURCHASES/ /USA FALLING INTEREST RATES AGAIN/EUROPE BOURSES ALL IN THE RED
USA/JAPAN YEN 110.75 UP 0.312(Abe’s new negative interest rate (NIRP), a total DISASTER/SIGNALS U TURN WITH INCREASED NEGATIVITY IN NIRP/JAPAN OUT OF WEAPONS TO FIGHT ECONOMIC DISASTER/KURODA: HELICOPTER MONEY ON THE TABLE AND DECISION ON SEPT 21 DISAPPOINTS WITH STIMULUS/OPERATION REVERSE TWIST/LABOUR PARTY LOSES IN LOCAL ELECTIONS
GBP/USA 1.3224 UP .0017 (Brexit March 29/ 2017/ARTICLE 50 SIGNED
THERESA MAY FORMS A NEW GOVERNMENT/STARTS BREXIT TALKS
USA/CAN 1.2549 UP .0003 (CANADA WORRIED ABOUT TRADE WITH THE USA WITH TRUMP ELECTION/ITALIAN EXIT AND GREXIT FROM EU/TRUMP INITIATES LUMBER TARIFFS ON CANADA)
Early THIS WEDNESDAY morning in Europe, the Euro ROSE by 17 basis points, trading now ABOVE the important 1.08 level RISING to 1.1827; Europe is still reacting to Gr Britain HARD BREXIT,deflation, announcements of massive stimulation (QE), a proxy middle east war, and the ramifications of a default at the Austrian Hypo bank, an imminent default of Greece, Glencore, Nysmark and the Ukraine, along with rising peripheral bond yield further stimulation as the EU is moving more into NIRP, and now the Italian referendum defeat AND NOW THE ECB TAPERING OF ITS PURCHASES/ THE USA’S NON tightening by FAILING TO RAISE THEIR INTEREST RATE AND NOW THE HUGE PROBLEMS FACING TOO BIG TO FAIL DEUTSCHE BANK + THE ELECTION OF TRUMP IN THE USA+ TRUMP HEALTH CARE BILL DEFEAT AND MONTE DEI PASCHI NATIONALIZATION / Last night the Shanghai composite CLOSED DOWN 7.58 POINTS OR .23% / Hang Sang CLOSED UP 67.15 POINTS OR 0.24% /AUSTRALIA CLOSED DOWN 0.45% / EUROPEAN BOURSES OPENED IN THE RED
We are seeing that the 3 major global carry trades are being unwound. The BIGGY is the first one;
1. the total dollar global short is 9 trillion USA and as such we are now witnessing a sea of red blood on the streets as derivatives blow up with the massive rise in the rise in the dollar against all paper currencies and especially with the fall of the yuan carry trade. The emerging market which house close to 50% of the 9 trillion dollar short is feeling the massive pain as their debt is quite unmanageable.
2, the Nikkei average vs gold carry trade ( NIKKEI blowing up and the yen carry trade HAS BLOWN up/and now NIRP)
3. Short Swiss franc/long assets blew up ( Eastern European housing/Nikkei etc.
These massive carry trades are terribly offside as they are being unwound. It is causing global deflation ( we are at debt saturation already) as the world reacts to lack of demand and a scarcity of debt collateral. Bourses around the globe are reacting in kind to these events as well as the potential for a GREXIT>
The NIKKEI: this WEDNESDAY morning CLOSED UP 94.25 POINTS OR .17%
Trading from Europe and Asia:
1. Europe stocks OPENED ALL IN THE RED
2/ CHINESE BOURSES / : Hang Sang CLOSED UP 67.15 POINTS OR 0.24% / SHANGHAI CLOSED DOWN 7.58 POINTS OR 0.23% /Australia BOURSE CLOSED DOWN 0.45% /Nikkei (Japan)CLOSED UP 94.25 POINTS OR .17% / INDIA’S SENSEX IN THE RED
Gold very early morning trading: 1266.95
silver:$16.65
Early WEDNESDAY morning USA 10 year bond yield: 2.2745% !!! UP 3 IN POINTS from TUESDAY night in basis points and it is trading JUST BELOW resistance at 2.27-2.32%.
The 30 yr bond yield 2.8798, UP 2 IN BASIS POINTS from TUESDAY night.
USA dollar index early WEDNESDAY morning: 92.96 DOWN 9 CENT(S) from TUESDAY’s close.
This ends early morning numbers WEDNESDAY MORNING
xxxxxxxxxxxxxxxxxxxxxxxxxxxxxxxxxxxxxxxxxxxxxxxxxxxxxxxxxxxxxxxxxxxxxxxxxxxxxxxxxxxxxxxxxxxxxxxxxxxxxxxxxxxxxxx
And now your closing WEDNESDAY NUMBERS
Portuguese 10 year bond yield: 2.864% UP 2 in basis point(s) yield from TUESDAY
JAPANESE BOND YIELD: +.078% DOWN 0 in basis point yield from TUESDAY/JAPAN losing control of its yield curve
SPANISH 10 YR BOND YIELD: 1.458% UP 2 IN basis point yield from TUESDAY
ITALIAN 10 YR BOND YIELD: 2.015 DOWN 0 POINTS in basis point yield from TUESDAY
the Italian 10 yr bond yield is trading 55 points HIGHER than Spain.
GERMAN 10 YR BOND YIELD: +.486% DOWN 1 IN BASIS POINTS ON THE DAY
END
xxxxxxxxxxxxxxxxxxxxxxxxxxxxxxxxxxxxxxxxxxxxxxxxxxxxxxxxxxxxxxxxxxxxxxxxxxxxxxxxxxxxxxxxxxxxxxxxxxxxxxxxxxxxxxxxxxxxxxxxxxxxxxxxxxxxx
IMPORTANT CURRENCY CLOSES FOR WEDNESDAY
Closing currency crosses for WEDNESDAY night/USA DOLLAR INDEX/USA 10 YR BOND YIELD/12:30 PM
Euro/USA 1.1865 UP .0054 (Euro UP 54 Basis points/ represents to DRAGHI A COMPLETE POLICY FAILURE/
USA/Japan: 110.44 UP 0.050(Yen DOWN 1/2 basis points/
Great Britain/USA 1.3240 UP 0.0033( POUND UP 33
basis points)
USA/Canada 1.2549 UP .0028 (Canadian dollar DOWN 28 basis points AS OIL FELL TO $49.48
xxxxxxxxxxxxxxxxxxxxxxxxxxxxxxxxxxxxxxxxxxxxxxxxxxxxxxxxxxxxxxxxxxxxxxxxxxxxxxxx
This afternoon, the Euro was UP by 54 basis points to trade at 1.1854
The Yen FELL to 110.44 for a LOSS of 1/2 Basis points as NIRP is STILL a big failure for the Japanese central bank/HELICOPTER MONEY IS NOW DELAYED/BANK OF JAPAN NOW WORRIED AS AS THEY ARE RUNNING OUT OF BONDS TO BUY AS BOND YIELDS RISE /OPERATION REVERSE TWIST ANNOUNCED SEPT 21.2016
The POUND ROSE BY 33 basis points, trading at 1.3240/
The Canadian dollar FELL by 28 basis points to 1.2549, WITH WTI OIL FALLING TO : $49.48
Your closing 10 yr USA bond yield DOWN 1 IN basis points from TUESDAY at 2.251% //trading well ABOVE the resistance level of 2.27-2.32%) very problematic USA 30 yr bond yield: 2.838 DOWN 3 in basis points on the day /
Your closing USA dollar index, 92.77 DOWN 28 CENT(S) ON THE DAY/1.00 PM
Your closing bourses for Europe and the Dow along with the USA dollar index closing and interest rates for WEDNESDAY: 1:00 PM EST
London: CLOSED DOWN 12.23 POINTS OR 0.16%
German Dax :CLOSED DOWN 69.81 POINTS OR 0.57%
Paris Cac CLOSED DOWN 19.78 POINTS OR 0.39%
Spain IBEX CLOSED DOWN 72,80 POINTS OR 0.69%
Italian MIB: CLOSED DOWN 39.20 POINTS/OR 0.18%
The Dow closed UP 52.32 OR 0.24%
NASDAQ WAS closed UP 0.29 POINTS OR 0.00% 4.00 PM EST
WTI Oil price; 49.48 at 1:00 pm;
Brent Oil: 52.16 1:00 EST
USA /RUSSIAN ROUBLE CROSS: 60.59 UP 24/100 ROUBLES/DOLLAR (ROUBLE LOWER BY 24 BASIS PTS)
TODAY THE GERMAN YIELD RISES TO +0.486% FOR THE 10 YR BOND 4.PM EST EST
END
This ends the stock indices, oil price, currency crosses and interest rate closes for today
Closing Price for Oil, 5 pm/and 10 year USA interest rate:
WTI CRUDE OIL PRICE 5:00 PM:$49.48
BRENT: $52.22
USA 10 YR BOND YIELD: 2.266% (ANYTHING HIGHER THAN 2.70% BLOWS UP THE GLOBE)
USA 30 YR BOND YIELD: 2.848%
EURO/USA DOLLAR CROSS: 1.1856 up .0045
USA/JAPANESE YEN:110.71 up 0.270
USA DOLLAR INDEX: 92.89 down 16 cent(s)
The British pound at 5 pm: Great Britain Pound/USA: 1.3224 : UP 17 POINTS FROM LAST NIGHT
Canadian dollar: 1.2563 down 17 BASIS pts
German 10 yr bond yield at 5 pm: +0.486%
END
And now your more important USA stories which will influence the price of gold/silver
TRADING IN GRAPH FORM FOR THE DAY
Dow Tops 22,000 As Dollar Drops To 27-Month Lows

It appears the market’s attitude today was simple..,
Summarizing today:
- Despite the biggest comany in the world blowing out earnings – Stocks ended the day ‘unchish’, VIX ended the day marginally higher
- Despite weaker than expected jobs data, escalating tensions with Russia, and China and India facing off against each other – Bonds ended the day ‘unchish’, the Dollar ended the day ‘unchish’, and Gold was very modestly lower.
- Despite weaker than expected inventory data, OPEC and NOPEC production rising – WTI ended the day notably higher.
Despite the exuberance of record highs in AAPL shares…


Stocks drifted aimlessly for much of the day with Small Caps the notable loser (worst day in a month)…

But of course – The Dow topped 22,000…thansk to 4 VIX stomps…

Almost 5% difference between INDU and TRAN in last 5 days and S&P is unch…

Here’s why The Dow is surging...

Oh no sorry, here’s why...

But ‘Dow Theory’ is not buying it – Trannies are testing their 200-day moving average, massively diverging from Industrials...

FANG Stocks sank again today (down almost 6% from last week’s highs)…

The listless drift continues for the S&P 500, which hasn’t gained 1% or more in a single day for 69 straight days, the longest streak since March 2007

There was a notable difference in the advance/decline line at today’s open that continued for the day…

Treasury yields were mixed on the day with the long-end outperforming…

30Y Yield are hovering at 1-week lows…

The dollar index tested new 27-month lows before v-shaped-recovering…

As EUR strength (testing 1.19 intrday highs) and CAD weakness offset each other…

Silver fell back below its 50DMA – after flash smashing last night...

WTI is up 7 of the last 8 days – Despite disappointing inventory data and surging production, the machinese decided that the DOE-driven dip was for buying… (NOTE – the sudden jerk higher in prices was off support at the 100DMA)

Manufacturing Loses Most Jobs Since Election As ADP Employment Growth Weakens
After April and June’s disappointment, ADP reports the US economy added 178k jobs in July (less than the 190k expectation and below June’s upwardly revised 191k). This is somewhat in line with the 180k expectation for NFP on Friday.
Two months in a row, ADP has weakened as ISM surveys suggested employment is rolling over.

Once again Service-providing jobs dominated (+174k vs +4k for goods) with manufacturing losing 4,000 jobs in July.

“Job gains continued to be strong in the month of July,” said Ahu Yildirmaz, vice president and co-head of the ADP Research Institute.
“However, as the labor market tightens employers may find it more difficult to recruit qualified workers.”
Mark Zandi, chief economist of Moody’s Analytics, said,
“The American job machine continues to operate in high gear. Job gains are broad-based across industries and company sizes, with only manufacturers reducing their payrolls. At this pace of job growth, unemployment will continue to quickly decline.”
Some more charts: total employment change – second worst month since October:

Change in Total Nonfarm Private Employment by Company Size

Full Breakdown:

About 4% of all US auto loans are now 90 days delinquent which stands around $1.2 Trillion now. As awful, as this is, it gets worse.
Delinquency rates are rising in seven of the 11 loan categories tracked by the American Bankers Association.
The good news is that delinquency rates are still below their historical averages. But they won’t be for much longer. And it is why consumers are tightening up their wallets in new spending which translates into lower retail sales. Not all retail sales decline can be blamed on Amazon.
A recent study by the UBS Group found that 17% of Americans expect to default on a loan within the next 12 months. That’s up from 12% a year ago.
The numbers of potential lost are staggering !!!!!!
Cheers
Crashing Auto Sales Reflect Onset Of Debt Armageddon
July auto sales was a blood-bath for U.S auto makers. The SAAR (Seasonally Manipulated Adjusted Annualized Rate) metric – aka “statistical vomit” – presented a slight increase for July over June (16.7 SAAR vs 16.5 SAAR). But the statisticians can’t hide the truth. GM’s total sales plunged 15% YoY vs an 8% decline expected. Ford’s sales were down 7.4% vs an expected 5.5% drop. Chrysler’s sales dropped 10.5% vs. -6.1% expected. In aggregate, including foreign-manufactured vehicles, sales were down 7% YoY.
Note: These numbers are compiled by Automotive News based on actual monthly sales reported by manufactures. Also please note: A “sale” is recorded when the vehicle is shipped to the dealer. It does not reflect an economic transaction between a dealer and an end-user. As Automotive News reports: “[July was] the weakest showing yet in a year that is on tract to generate the industry’s first decline in volume since the 2008-2009 market collapse.”
The domestics blamed the sharp decline in sales on fleet sales. But GM’s retail sales volume plunged 14.4% vs its overall vehicle cliff-dive of 15% And so what? When the Obama Government, after it took over GM, and the rental agencies were loading up on new vehicles, the automakers never specifically identified fleet sales as a driver of sales.
What really drove sales was the obscenely permissive monetary and credit policies implemented by the Fed since 2008. But debt-driven Ponzi schemes require credit usage to expand continuously at an increase rate to sustain itself. And this is what it did from mid-2010 until early 2017:

Auto sales have been updated through June and the loan data through the end of the Q1. You can see the loan data began to flatten out in Q1 2017. I suspect it will be either “flatter” or it will be “curling” downward when the Fed gets around to update the data through Q2. You can also see that, since the “cash for clunkers” Government-subsidized auto sales spike up in late 2009, the increase in auto sales since 2010 has been driven by the issuance of debt.
Since the middle of 2010, the amount of auto debt outstanding has increased nearly 60%. The average household has over $29,000 in auto debt. Though finance companies/banks will not admit it, more than likely close to 40% of the auto loans issued are varying degrees of sub-prime to not rated (sub-sub-prime). Everyone I know who has taken out an auto loan or lease has told me that they were not asked to provide income verification.
Like all orgies, the Fed’s credit orgy has lost energy and stamina. The universe of warm bodies available to pass the “fog a mirror” test required to sign auto loan docs is largely tapped out. The law of diminishing returns has invaded the credit market. Borrower demand is tapering and default rates are rising. The rate of borrowing is rolling over and lenders are tightening credit standards – a little, anyway – in response to rising default rates. The 90-day delinquency rate has been rising since 2014 and is at a post-financial crisis high. The default rates are where they were in 2008, right before the real SHTF.

The graph above shows the 60+ day delinquency rate (left side) and default rate (right side)
for prime (blue line) and subprime (yellow line) auto loans. As you can see, the 60+ day
delinquency rate for subprime auto loans is at 4.51%, just 0.18% below the peak level hit in
2008. The 60+ day delinquency rate for prime auto loans is 0.54%, just 0.28% below the
2008 peak. In terms of outright defaults, subprime auto debt is just a shade under 12%,
which is about 2.5% below its 2008 peak. Prime loans are defaulting at a 1.52% rate, about
200 basis points (2%) below the 2008 peak. However, judging from the rise in the 60+ day
delinquency rate, I would expect the rate of default on prime auto loans to rise quickly this
year.
We’re not in crisis mode yet and the delinquency/default rates on subprime auto debt is near the levels at which it peaked in 2008. These numbers are going to get a lot worse this year and the amount of debt involved is nearly 60% greater. But the real problem will be, once again, the derivatives connected to this debt.
The size of the coming auto loan implosion will not be as large as the mortgage implosion in 2008, but it will likely be accompanies by an implosion in student loan and credit card debt – combined it will likely be just as systemically lethal. It would be a mistake to expect that this problem will not begin to show up in the mortgage market.
Despite the Dow etc hitting new record highs, many stocks are declining, declining precipitously or imploding. For insight, analysis and short-sell ideas on a weekly basis, check out the Short Seller’s Journal. The last two issues presented a uniquely in-depth analysis of Netflix and Amazon and why they are great shorts now.
end
30Y Yields Slide After Treasury Refunding Does Not Mention Ultra-Longs; Can Fund Through September
Contrary to expectations that the Treasury may address the growing financing need (with implications for curve) by announcing a higher than expected amount of near-term Treasury issuance, the US Treasury announced a $62.0 billion refunding package this morning, in line with expectations and unchanged from recent Refundings. The Refunding auctions will consist of a $24.0 billion 3-year note, a $23.0 billion 10-year note and a $15.0 billion 30-year bond.
The Refunding auctions, which will be held next Tuesday, Wednesday and Thursday, will raise a combined $14.7 billion after accounting for maturing issues excluding Fed holdings, based on SMRA calculations. The 3-year note auction will pay down $3.0 billion when the auctions settle, the 10-year note auction will raise $7.5 billion, and the 30-year bond auction will raise $10.2 billion.
The Fed holds approximately $12.5 billion of the maturing 10-year note and $6.1 billion of the maturing 30-year bond. The combined $18.7 billion in Fed holdings that will mature on the 15th will be rolled over into the Three Refunding issues in amounts proportional to the auction sizes. As a result, the Fed will roll over approximately $7.2 billion in to the 2-year note auction, $6.920 billion into the 10-year note auction, and $4.513 billion into the 30-year bond auction. Those roll overs will all be treated as add-ons, and as such should not directly influence the auctions.
In addition, Treasury will pay out approximately $23.8 billion in coupon interest payments to the public as the auctions settle on Tuesday, along with $16.0 billion in coupon interest payments to the Federal Reserve. Treasury said again this morning that they will not change the size of nominal coupon auctions during the quarter ahead. Separately, regarding the debt ceiling, they expect to “be able to fund the government through the end of September.”
While the Treasury did not offer any updates on any future plans for issues longer than 30-year, it did note the need for adjustments if and when the Fed begins to normalize their balance sheet, stating they would “likely respond” by “increasing both Treasury bill and Treasury nominal coupon auction sizes, beginning with bills and then coupons.”
Addressing future funding needs, in its minutes the TBAC said “the Committee was generally of the view that the borrowing needs would likely be best addressed by increasing issuance in bills and a broader set of coupons, but concluded that it was premature to make specific recommendations regarding sequencing or tenors at this time. Instead, the Committee generally agreed that Treasury consider making a decision about a strategy as early as the November refunding, but no later than the first calendar quarter of 2018.”
Following the report, 30Y yields slid to session lows of 2.85%, prompted by the lack of discussion of ultra-long dated debt.

Amazon is the New Tech Crash
It won’t be long now. During the last 31 months the stock market mania has rapidly narrowed to just a handful of shooting stars.
At the forefront has been Amazon.com, Inc., which saw its stock price double from $285 per share in January 2015 to $575 by October of that year. It then doubled again to about $1,000 in the 21 months since.
By contrast, much of the stock market has remained in flat-earth land. For instance, those sections of the stock market that are tethered to the floundering real world economy have posted flat-lining earnings, or even sharp declines, as in the case of oil and gas.
Needless to say, the drastic market narrowing of the last 30 months has been accompanied by soaring price/earnings (PE) multiples among the handful of big winners. In the case of the so-called FAANGs + M (Facebook, Apple, Amazon, Netflix, Google and Microsoft), the group’s weighted average PE multiple has increased by some 50%.
The degree to which the casino’s speculative mania has been concentrated in the FAANGs + M can also be seen by contrasting them with the other 494 stocks in the S&P 500. The market cap of the index as a whole rose from $17.7 trillion in January 2015 to some $21.2 trillion at present, meaning that the FAANGs + M account for about 40% of the entire gain.
Stated differently, the market cap of the other 494 stocks rose from $16.0 trillion to $18.1 trillion during that 30-month period. That is, 13% versus the 82% gain of the six super-momentum stocks.
Moreover, if this concentrated $1.4 trillion gain in a handful of stocks sounds familiar that’s because this rodeo has been held before. The Four Horseman of Tech (Microsoft, Dell, Cisco and Intel) at the turn of the century saw their market cap soar from $850 billion to $1.65 trillion or by 94% during the manic months before the dotcom peak.
At the March 2000 peak, Microsoft’s PE multiple was 60X, Intel’s was 50X and Cisco’s hit 200X. Those nosebleed valuations were really not much different than Facebook today at 40X, Amazon at 190X and Netflix at 217X.
The truth is, even great companies do not escape drastic over-valuation during the blow-off stage of bubble peaks. Accordingly, two years later the Four Horseman as a group had shed $1.25 trillion or 75% of their valuation.
More importantly, this spectacular collapse was not due to a meltdown of their sales and profits. Like the FAANGs +M today, the Four Horseman were quasi-mature, big cap companies that never really stopped growing.
Now I’m targeting the very highest-flyer of the present bubble cycle, Amazon.
Just as the NASDAQ 100 doubled between October 1998 and October 1999, and then doubled again by March 2000, AMZN is in the midst of a similar speculative blow-off.
Not to be forgotten, however, is that one year after the March 2000 peak the NASDAQ 100 was down by 70%, and it ultimately bottomed 82% lower in September 2002. I expect no less of a spectacular collapse in the case of this cycle’s equivalent shooting star.
In fact, even as its stock price has tripled during the last 30 months, AMZN has experienced two sharp drawdowns of 28% and 12%, respectively. Both times it plunged to its 200-day moving average in a matter of a few weeks.
A similar drawdown to its 200-day moving average today would result in a double-digit sell-off. But when — not if — the broad market plunges into a long overdue correction the ultimate drop will exceed that by many orders of magnitude.
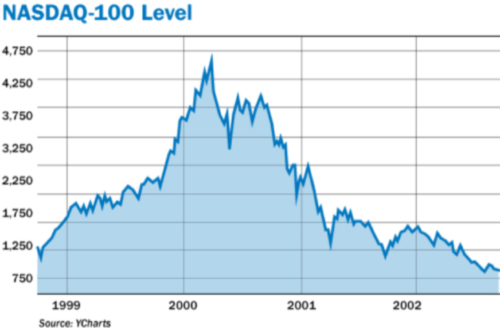
Amazon’s stock has now erupted to $1,000 per share, meaning that its market cap is lodged in the financial thermosphere (highest earth atmosphere layer). Its implied PE multiple of 190X can only be described as blatantly absurd.
After all, Amazon is 24 years-old, not a start-up. It hasn’t invented anything explosively new like the iPhone or personal computer. Instead, 91% of its sales involve sourcing, moving, storing and delivering goods. That’s a sector of the economy that has grown by just 2.2% annually in nominal dollars for the last decade, and for which there is no macroeconomic basis for an acceleration.
Yes, AMZN is taking share by leaps and bounds. But that’s inherently a one-time gain that can’t be capitalized in perpetuity at 190X. And it’s a source of “growth” that is generating its own pushback as the stronger elements of the brick and mortar world belatedly pile on the e-commerce bandwagon.
Wal-Mart’s e-commerce sales, for example, have exploded after its purchase of Jet.com last year — with sales rising by 63% in the most recent quarter.
Moreover, Wal-Mart has finally figured out the free shipments game and has upped its e-commerce offering from 10 million to 50 million items just in the past year.
Wal-Mart is also tapping for e-commerce fulfillment duty in its vast logistics system — including its 147 distribution centers, a fleet of 6,200 trucks and a global sourcing system which is second to none.
In this context, even AMZN’s year-over-year sales growth of 22.6% in Q1 2017 doesn’t remotely validate the company’s bubblicious valuation — especially not when AMZN’s already razor thin profit margins are weakening, not expanding.
Based on these basic realities, Jeff Bezos will never make up with volume what he is losing in margin on each and every shipment.
The Amazon business model is fatally flawed. It’s only a matter of the precise catalyst that will trigger the realization in the casino that this is another case of the proverbial naked emperor.
Needless to say, I do not think AMZN is a freakish outlier. It’s actually the lens through which the entire stock market should be viewed because the whole enchilada is now in the grips of a pure mania.
Stated differently, the stock market is no longer a discounting mechanism nor even a weighing machine. It’s become a pure gambling hall.
So Bezos’ e-commerce business strategy is that of a madman — one made mad by the fantastically false price signals emanating from a casino that has become utterly unhinged owing to 30 years of Bubble Finance policies at the Fed and its fellow central banks around the planet.
Indeed, the chart below leaves nothing to the imagination. Since 2012, Amazon stock price has bounded upward in nearly exact lock-step with the massive balance sheet expansion of the world’s three major central banks.
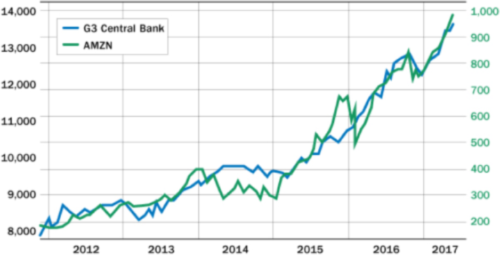
At the end of the day, the egregiously overvalued Amazon is the prime bubble stock of the current cycle. What the Fed has actually unleashed is not the healthy process of creative destruction that Amazon’s fanboys imagine.
Instead, it embodies a rogue business model and reckless sales growth machine that is just one more example of destructive financial engineering, and still another proof that monetary central planning fuels economic decay, not prosperity.
Amazon’s stock is also the ultimate case of an utterly unsustainable bubble. When the selling starts and the vast horde of momentum traders who have inflated it relentlessly in recent months make a bee line for the exits, the March 2000 dotcom crash will seem like a walk in the park.
Regards,
Special Counsel Mueller Adds Another Obama Ally To His Team
With each passing day, it’s looking increasingly like the only people qualified to serve on Special Counsel Mueller’s investigative team are lawyers who have either directly worked for and/or contributed to the campaigns of Barack Obama and/or Hillary Clinton. As Reuters points out today, Mueller’s latest hire is Greg Andres, a former DOJ attorney who was appointed during the Obama administration and served under Attorney General Eric Holder.
A former U.S. Justice Department official has become the latest lawyer to join special counsel Robert Mueller’s team investigating Russia’s interference in the 2016 presidential election, a spokesman for the team confirmed.
Greg Andres started on Tuesday, becoming the 16th lawyer on the team, said Josh Stueve, a spokesman for the special counsel.
Most recently a white-collar criminal defense lawyer with New York law firm Davis Polk & Wardwell, Andres, 50, served at the Justice Department from 2010 to 2012. He was deputy assistant attorney general in the criminal division, where he oversaw the fraud unit and managed the program that targeted illegal foreign bribery.
Here’s more on Adres’ background:
Among the cases Andres oversaw at the Justice Department was the prosecution of Texas financier Robert Allen Stanford, who was convicted in 2012 for operating an $8 billion Ponzi scheme.
Before that, Andres was a federal prosecutor in Brooklyn for over a decade, eventually serving as chief of the criminal division in the U.S. attorney’s office there. He prosecuted several members of the Bonanno organized crime family, one of whom was accused of plotting to have Andres killed.
A graduate of Notre Dame and University of Chicago Law School, Andres was a Peace Corps volunteer in Benin from 1989 to 1992.
He is married to Ronnie Abrams, a U.S. district judge in Manhattan nominated to the bench in 2011 by Democratic President Barack Obama.

As we’ve pointed out before, several of Mueller’s early, notable hires were all been contributors to Hillary’s and/or Obama’s previous campaigns and Jeannie Rhee actually represented the Clinton Foundation.
Michael Dreeben, who serves as the Justice Department’s deputy solicitor general, is working on a part-time basis for Mueller, The Washington Post reported Friday.
Dreeben donated $1,000 dollars to Hillary Clinton’s Senate political action committee (PAC), Friends of Hillary, while she ran for public office in New York. Dreeben did so while he served as the deputy solicitor general at the Justice Department.
Jeannie Rhee, another member of Mueller’s team, donated $5,400 to Hillary Clinton’s presidential campaign PAC Hillary for America.
Andrew Weissmann, who serves in a top post within the Justice Department’s fraud practice, is the most senior lawyer on the special counsel team, Bloomberg reported. He served as the FBI’s general counsel and the assistant director to Mueller when the special counsel was FBI director.
Before he worked at the FBI or Justice Department, Weissman worked at the law firm Jenner & Block LLP, during which he donated six times to political action committees for Obama in 2008 for a total of $4,700.
James Quarles, who served as an assistant special prosecutor on the Watergate Special Prosecution Force, has donated to over a dozen Democratic PACs since the late 1980s. He was also identified by the Washington Post as a member of Mueller’s team.
Starting in 1987, Quarles donated to Democratic candidate Michael Dukakis’s presidential PAC, Dukakis for President. Since then, he has also contributed in 1999 to Sen. Al Gore’s run for the presidency, then-Sen. John Kerry’s (D-Mass.) presidential bid in 2005, Obama’s presidential PAC in 2008 and 2012, and Clinton’s presidential pac Hillary for America in 2016.
Of course, just yesterday House Judiciary Committee member, Representative Trent Franks (R-AZ), called on Mueller to resign over his alleged “conflicts of interest”…
“Bob Mueller is in clear violation of federal code and must resign to maintain the integrity of the investigation into alleged Russian ties,” Franks said. “Those who worked under them have attested he and Jim Comey possess a close friendship, and they have delivered on-the-record statements effusing praise of one another.”
“No one knows Mr. Mueller’s true intentions, but neither can anyone dispute that he now clearly appears to be a partisan arbiter of justice. Accordingly, the law is also explicitly clear: he must step down based on this conflict of interest,” Franks said.
“Already, this investigation has become suspect – reports have revealed at least four members of Mueller’s team on the Russia probe donated to support Hillary Clinton for President, as President Trump pointed out. These obviously deliberate partisan hirings do not help convey impartiality,” Franks said. “Until Mueller resigns, he will be in clear violation of the law, a reality that fundamentally undermines his role as Special Counsel and attending ability to execute the law.”
…but somehow we don’t suspect that’s going to happen anytime soon.
end
Trump signs the Russia sanction bill “with reservations” commenting that this bill encroaches on executive privilege. We now await Europe’s response
(courtesy zerohedge)
Trump Signs Russia Sanctions Bill “With Reservations”
After several days of delays, which prompted speculation among politicians and the media why the White House is dragging its feet on the issue and was the topic of several questions during Rex Tillerson’s Tuesday media press conference, moments ago the Donald Trump officially signed the Russian Sanctions that prevents the president from acting unilaterally to remove certain sanctions on Russia and adds sanctions against Russia, Iran and North Korea, a White House official told Bloomberg News.
- TRUMP IS SAID TO SIGN RUSSIA SANCTIONS BILL, OFFICIAL SAYS
- WHITE HOUSE OFFICIAL SAYS TRUMP SIGNED SANCTIONS LEGISLATION
However, as Bloomberg also adds, the administration said it will carry out the law but “with reservations” about its impact and the constitutionality of some provisions.
The so-called signing statement, obtained by Bloomberg, lays out Trump’s concerns about the legislation, including that it encroaches on presidential authority and may hurt U.S. ability to work with allies.
Some more details on Trump’s reservations:
Trump’s statement doesn’t signal any intent to bypass or circumvent aspects of the law. Instead, the president indicates he intends for his administration to carry out the law in a way consistent with his constitutional authority, language that leaves open some room for interpretation of how the law is executed.
Trump’s concerns cover four areas: encroachment on executive authority, unintentional harm to U.S. companies and business, as well as U.S. international partners, and limits on the flexibility of the administration to act in concert with allies in dealing with Russia.
And while Russia already announced its response, expelling some 755 US diplomats and seizing two US compounds, the spotlight now shifts to the European Union – which previously warned of an “imminent response” if European companies are hobbled by sanctions aimed at squeezing Russia’s energy exports – whose retaliation will be unveiled shortly.
Previously, Congressional lawmakers said they wanted to prevent the president from acting unilaterally to lift penalties imposed by Trump’s predecessor, former President Barack Obama, for meddling in last year’s U.S. election and for aggression in Ukraine.
White House officials had argued that it hampered the president’s ability to negotiate. But the legislation cleared both the House and Senate by wide margins, indicating any presidential veto would be overridden. Recent presidents including Obama and George W. Bush also used signing statements to express displeasure or signal planned modifications to legislation they felt compelled to sign over their own objections.
“This is an area, though, where the administration is going to be watched very carefully,” said Peter Feaver, a Duke University professor and director of the Triangle Institute for Security Studies, who served on the National Security Council staffs of Presidents Bill Clinton and George W. Bush. This sanctions bill, he said, was passed “by overwhelming majorities in both houses and it’s on one of the most important issues of the day. If the president tries to wiggle out from under the constraints of the law, I think he will pay a high political price for doing so.”
Feaver also said he expects Congress will replace this sanctions bill with one that returns more flexibility to Trump once the administration comes up with a clear and tough Russia policy.
“It’s driven by a perception on Capitol Hill that the administration does not have a coherent Russia policy yet and the administration has not yet spoken with one voice about what Russia did,” he said. “When they do, and it has bipartisan support, Congress will replace this form of sanctions with another one that gives the president a national security waiver or some form of more wiggle room that is more customary.”
Curiously, following the news, oil took a leg lower.
It’s Official, Obamacare Rate Hikes Are Trump’s Fault
Obamacare premiums have been exploding higher ever since the controversial legislation took over health insurance markets. And while many would say that another year of premium increases is a logical extrapolation of a predictable, multi-year trend resulting from a failed policy, others would like for you to believe that the massive (yet consistent) premium increases being proposed for the 2018 plan year are unique because they’re Trump’s fault.
As the Wall Street Journal notes this morning, insurers across the country are once again seeking massive premium increases in 2018.
Major health insurers in some states are seeking increases as high as 30% or more for premiums on 2018 Affordable Care Act plans,according to new federal data that provide the broadest view so far of the turmoil across exchanges as companies try to anticipate Trump administration policies.
Big insurers in Idaho, West Virginia, South Carolina, Iowa and Wyoming are seeking to raise premiums by averages close to 30% or more, according to preliminary rate requests published Tuesday by the U.S. Department of Health and Human Services. Major marketplace players in New Mexico, Tennessee, North Dakota and Hawaii indicated they were looking for average increases of 20% or more.
In other cases, insurers are looking for more limited premium increases for the suites of products they offer in individual states, reflecting the variety of situations in different markets. Health Care Service Corp., a huge exchange player in five states, filed for average increases including 8.3% in Oklahoma, 23.6% in Texas, and 16% in Illinois.

Of course, as we’ve noted multiple times over the past couple of years, Obamacare premium increases are hardly a new phenomenon. In fact, data from the Department of Health and Human Services recently revealed that premiums across the country soared an average of 113% over the past 4 years, or nearly 30% per year. Ironically, that 30% is the same hike that many insurers are seeking for 2018…some folks would call that a trend.

But, other folks don’t believe in things like math and adverse selection bias that results in deteriorating risk pools and higher costs for insurers…no, they prefer simple, provocative narratives that can be exploited for political gain while masking the real underlying problems of a failed policy that is ruining healthcare for millions of hard working Americans.
So what’s the narrative? ‘It’s Trump fault’, of course.
Insurers are also concerned about whether the Trump administration will enforce the requirement for most people to have insurance coverage, which industry officials say helps hold down rates by prodding young, healthy people to sign up for plans.
In Montana, Health Care Service linked 17 percentage points of its 23% rate increase request to concerns about the cost-sharing payments and enforcement of the mandate that requires everyone to purchase insurance. Kurt Kossen, a senior vice president at Health Care Service, said the company’s rate requests are driven by causes including growing health costs and “uncertainty and the associated risks that exist within this marketplace, including uncertainty around issues like the continued funding of [cost-sharing payments] and mechanisms that encourage broad and continuous coverage.”
The impact of potentially losing the cost-sharing payments was also clear in the rates requested by Blue Cross of Idaho, which average 28%. That would probably be in the lower teens if the payments were guaranteed, said Dave Jeppesen, a senior vice president. “It’s a big swing,” he said. “There’s a lot of risk associated with the uncertainty in Congress right now, and we are pricing appropriately for that risk.”
So, this obviously begs the question, if Trump decided to leave Obamacare completely unchanged for 2018 would all of these insurers promptly lower their rate proposals? Somehow we suspect not…
end
Bill Holter’s Commentary
This adds some credibility to the claim.
Bill H
end
Craig Roberts gives a terrific interview with Greg Hunter. Yo do not want to miss this
(courtesy Craig Roberts/Greg Hunter)
Conspiracy to Remove Trump at All Costs – Paul Craig Roberts
By Greg Hunter On August 2, 2017 In Political Analysis

Dr. Paul Craig Roberts agrees that Democrats, RINO Republicans, military complex and the Deep State want Donald Trump removed from the White House at any and all costs. Dr. Roberts explains, “That’s correct and, again, it’s several different interests. The Democrats want him out because they want to be vindicated that he stole the election from them through some form of collusion with the Russians. The military security complex want him out because they see him as a threat to their budget. Trump normalizing relations with Russia—they don’t want that. They need an enemy. The talk of pulling out of Syria also annoyed them. They don’t want to give up these wars that keep people worried and willing to support the military. . . . The media is mad because Trump disproved all the smart people’s predictions of Hillary being a shoe-in. Plus, Trump is elected by Americans considered to be deplorable. The deplorables are white heterosexual males. They are racist. They are sexist. They are homophobes. They are gun nuts, and these are illegitimate people. These illegitimate people elected Trump when all of the good people wanted to elect Hillary. So, you have that kind of left wing crazed ideological element, as well. So, all of these things conspire against Donald Trump. What is going on is essentially what Attorney General Robert Jackson warned all U.S. Attorneys about in 1940. He said it is impermissible to pick a person and then go look for some crime he may have committed. . . . And, yet, that’s what the Special Prosecutor is doing in the case of Trump. We have no evidence of any crime. Even if there was some kind of Russian collusion, it’s not illegal. It’s normal for incoming governments to have open discussions with foreign governments. It happens in every administration. It’s part of the transition team. . . In the case of Trump, there is no crime, but now there is a wide ranging investigation that has gone far beyond any sort of Russian contacts.”
Who is conspiring to push Trump out? Dr. Roberts says, “I do know about campaign contributions, and they do come from the military security complex, and they come from energy companies. These are two massive campaign contributors. So, that’s why the Russian sanctions bill passed. Of the 535 members of the House and Senate, 530 voted for the sanctions. . . . It’s not the people who put Senators and Congressmen in office, it’s the interest groups that finance their election campaigns. So, the members of the House and Senate are not responsible to their constituents or voters. They are responsible to their constituency of their campaign contributors. In this case, the Congress is perfectly loyal to the energy companies and to the military security complex, and they never are loyal to ‘We the People.’”
Dr. Roberts thinks sanctions and provocations with Russia and China are “acts of war” by the U.S. Roberts contends the U.S. does not want war. If there is war, Dr. Roberts says it will have nothing to do with a failing economy. Roberts contends, “The notion that the government is somehow worried about the economy and, therefore, we will go to war, that’s not likely. In fact, I think the military security complex doesn’t really want a war. They want an enemy like they had with the Soviet Union for all those decades of the ‘Cold War.’ They want a renewed Cold War. They want an ever present threat because that keeps the budget funded. It keeps it growing, and it keeps their power in place. So, this is what they want, but these things can backfire. These are the kinds of things that will produce a war. It won’t be some conscious decision. . . . If you are talking war with Russia, nothing will be left standing.”
On the economy, Dr. Roberts, who was an Assistant Treasury Secretary in the Reagan Administration and holds a PhD in economics, says, “There is no economy there. The markets are rigged. The Fed has a huge trading desk, and they can trade anything.”
Join Greg Hunter as he goes One-on-One with former Assistant Treasury Secretary Dr. Paul Craig Roberts.
Video Link
http://usawatchdog.com/conspiracy-to-remove-trump-at-all- costs-paul-craig-roberts/
-END-
WELL THAT ABOUT DOES IT FOR TONIGHT
We will see you THURSDAY night
IN AUGUST, I MAY MISS A FEW DAYS COMMENTARY
I WILL DO THIS FRIDAY’S COMMENTARY ON SATURDAY
Harvey.


[…] READ MORE […]
LikeLike