
GOLD: $1312.10 UP $ 7.05 (COMEX TO COMEX CLOSINGS)
Silver: $16.43 UP 7 CENTS (COMEX TO COMEX CLOSINGS)
Closing access prices:
Gold $1312.35
silver: $16.43
For comex gold:
MAY/
NUMBER OF NOTICES FILED TODAY FOR MAY CONTRACT:0 NOTICE(S) FOR nil OZ.
TOTAL NOTICES SO FAR 14 FOR 1400 OZ (0.0435 tonnes)
For silver:
MAY
482 NOTICE(S) FILED TODAY FOR
2,410,000 OZ/
Total number of notices filed so far this month: 3451 for 17,255,000 oz
XXXXXXXXXXXXXXXXXXXXXXXXXXXXXX
Bitcoin: BID $9164/OFFER $9264: DOWN $17(morning)
Bitcoin: BID/ $9543/offer $9642: UP $362 (CLOSING/5 PM)
end
First Shanghai gold fix comes at 10 pm est
The second Shanghai gold fix: 2:15 pm
First Shanghai gold fix gold: 10 pm est: 1316.49
NY price at the same time: 1309.50
PREMIUM TO NY SPOT: $6.99
ss
Second gold fix early this morning: 1317.75
USA gold at the exact same time: 1308.50
PREMIUM TO NY SPOT: $9.25
AGAIN, SHANGHAI REJECTS NEW YORK PRICING.
WE WILL NOT PROVIDE LONDON FIXES AS THEY ARE NOT ACCURATE AS TO WHAT IS GOING ON AT THE SAME TIME FRAME.
Let us have a look at the data for today
xxxxxxxxxxxxxxxxxxxxxxxxxxxxxxxxxxxxxxxxxxxxxxxxxxxxxxxxxxxxxxxxxxxxxxxxxx
In silver, the total OPEN INTEREST FELL BY A CONSIDERABLE 1290 CONTRACTS FROM 194,965 FALLING TO 193,395 DESPITE YESTERDAY’S 24 CENT GAIN IN SILVER PRICING. WE ARE NOW WITNESSING OUR USUAL AND CUSTOMARY COMEX LONG LIQUIDATION AS WE ENTERED INTO THE ACTIVE DELIVERY MONTH OF MAY AS LONGS PACK THEIR BAGS AND MIGRATE OVER TO LONDON. WE WERE NOTIFIED THAT WE HAD A GOOD SIZED NUMBER OF COMEX LONGS TRANSFERRING THEIR CONTRACTS TO LONDON THROUGH THE EFP : , 2148 EFP’S FOR JULY AND ZERO FOR ALL OTHER MONTHS AND THEREFORE TOTAL ISSUANCE OF 2148 CONTRACTS. WITH THE TRANSFER OF 2148 CONTRACTS, WHAT THE CME IS STATING IS THAT THERE IS NO SILVER (OR GOLD) TO BE DELIVERED UPON AT THE COMEX AS THEY MUST EXPORT THEIR OBLIGATION TO LONDON. ALSO KEEP IN MIND THAT THERE CAN BE A DELAY OF 24-48 HRS IN THE ISSUING OF EFP’S. THE 2148 EFP CONTRACTS TRANSLATES INTO 10.74 MILLION OZ ACCOMPANYING:
1.THE RISE IN SILVER PRICE (24 CENTS) AT THE COMEX AND
2. THE STRONG AMOUNT OF SILVER OUNCES STANDING FOR MAY COMEX DELIVERY. (26.7 MILLION OZ)
ACCUMULATION FOR EFP’S/SILVER/J.P.MORGAN’S HOUSE OF BRIBES, / STARTING FROM FIRST DAY NOTICE/FOR MONTH OF APRIL: (FINAL)
8882 CONTRACTS (FOR 3 TRADING DAYS TOTAL 8882 CONTRACTS) OR 44.41 MILLION OZ: AVERAGE PER DAY: 2960 CONTRACTS OR 14.803 MILLION OZ/DAY
TO GIVE YOU AN IDEA AS TO THE HUGE SUPPLY THIS MONTH IN SILVER: SO FAR THIS MONTH: 44.41 MILLION PAPER OZ HAVE MORPHED OVER TO LONDON. THIS REPRESENTS AROUND 6.34% OF ANNUAL GLOBAL PRODUCTION (EX CHINA EX RUSSIA)
ACCUMULATION IN YEAR 2018 TO DATE SILVER EFP’S: 1,189.9 MILLION OZ.
ACCUMULATION FOR JAN 2018: 236.879 MILLION OZ
ACCUMULATION FOR FEB 2018: 244.95 MILLION OZ
ACCUMULATION FOR MARCH 2018: 236.67 MILLION OZ
ACCUMULATION FOR APRIL 2018: 385.75 MILLION OZ
RESULT: WE HAD A CONSIDERABLE SIZED FALL IN COMEX OI SILVER COMEX OF 1290 DESPITE THE 24 CENT GAIN IN SILVER PRICE. WE HAVE NOW ENTERED THE NEW ACTIVE MONTH OF MAY. THE CME NOTIFIED US THAT IN FACT WE HAD AN STRONG SIZED EFP ISSUANCE OF 2148 CONTRACTS WHICH EXITED OUT OF THE SILVER COMEX AND TRANSFERRED THEIR OI TO LONDON AS FORWARDS. SPECULATORS CONTINUED THEIR INTEREST IN ATTACKING THE SILVER COMEX FOR PHYSICAL SILVER (SEE COMEX DATA) . FROM THE CME DATA: 2148 EFP CONTRACTS FOR JULY, AND ZERO FOR ALL OVER MONTHS FOR A DELIVERABLE FORWARD CONTRACT OVER IN LONDON WITH A FIAT BONUS (TOTAL: 2148). TODAY WE GAINED 974 TOTAL OI CONTRACTS ON THE TWO EXCHANGES: i.e. 2148 OPEN INTEREST CONTRACTS HEADED FOR LONDON (EFP’s) TOGETHER WITH AN DECREASE OF 1290 OI COMEX CONTRACTS. AND ALL OF THIS HAPPENED WITH THE RISE IN PRICE OF SILVER OF 24 CENTS AND A CLOSING PRICE OF $16.36 WITH RESPECT TO YESTERDAY’S TRADING. YET WE STILL HAVE A STRONG AMOUNT OF SILVER STANDING AT THE COMEX FOR DELIVERY IN THIS ACTIVE MAY DELIVERY MONTH. IT SURE SEEMS THAT WE MUST HAVE HAD SOME BANKER SHORT COVERING ON BOTH EXCHANGES.
In ounces AT THE COMEX, the OI is still represented by UNDER 1 BILLION oz i.e. .967 MILLION OZ TO BE EXACT or 138% of annual global silver production (ex Russia & ex China).
FOR THE NEW FRONT MAY MONTH/ THEY FILED AT THE COMEX: 482 NOTICE(S) FOR 2,410,000 OZ OF SILVER
IN SILVER, WE HAVE NOW SET THE NEW RECORD OF OPEN INTEREST AT 243,411 AND AGAIN THIS HAS BEEN SET WITH A LOW PRICE OF $16.51 ON APRIL 9.2018.
ON THE DEMAND SIDE WE HAVE THE FOLLOWING:
- HUGE AMOUNTS OF SILVER STANDING FOR DELIVERY (MARCH: 27 MILLION OZ , APRIL: 2.485 MILLION OZ AND MAY: 26.7 MILLION OZ )
- HUGE RECORD OPEN INTEREST IN SILVER 243,411 CONTRACTS (OR 1.217 BILLION OZ/ SET APRIL 9/2018
- HUGE ANNUAL EFP’S ISSUANCE EQUAL TO 2.9 BILLION OZ OR 400% OF SILVER ANNUAL PRODUCTION/2017
- RECORD SETTING EFP ISSUANCE FOR ANY MONTH IN SILVER; APRIL/2018/ 385.75 MILLION OZ/ (FINAL)
AND YET, WITH THE EXTREMELY HIGH EFP ISSUANCE, WE HAVE A CONTINUAL LOW PRICE OF SILVER DESPITE THE ABOVE HUGE DEMAND. TO ME THE ONLY ANSWER IS THAT WE HAVE SOVEREIGN (CHINA) WHO IS ENDEAVOURING TO GOBBLE UP ALL AVAILABLE PHYSICAL SILVER NO MATTER WHERE, EXACTLY WHAT J.P.MORGAN IS DOING. AND IT IS MY BELIEF THAT J.P.MORGAN IS HOLDING ITS SILVER FOR ITS BENEFICIAL OWNER..THE USA GOVERNMENT WHO IN TURN IS HOLDING THAT SILVER FOR CHINA.(FOR A SILVER LOAN REPAYMENT). IT ALSO LOOKS LIKE BANKER CAPITULATION IN SILVER AS THEY STRUGGLE TO REMOVE SOME OF THEIR HUGE OBLIGATIONS.
In gold, the open interest FELL BY A STRONG 6691 CONTRACTS DOWN TO 501,065 WITH THE FALL IN THE GOLD PRICE/YESTERDAY’S TRADING (LOSS OF $1.15). WE ARE NOW IN THE NON ACTIVE DELIVERY MONTH OF MAY. THE CME RELEASED THE DATA FOR EFP ISSUANCE AND IT TOTALED AN ATMOSPHERIC SIZED 17,479 CONTRACTS : JUNE SAW THE ISSUANCE OF 17,479 CONTRACTS , MAY SAW THE ISSUANCE OF 0 CONTRACTS AND AUGUST SAW THE ISSUANCE OF: 0 CONTRACTS WITH ALL OTHER MONTHS ZERO. The new OI for the gold complex rests at 501,065. ALSO REMEMBER THAT THERE WILL BE A DELAY IN THE ISSUANCE OF EFP’S. THE BANKERS REMOVE LONG POSITIONS OF COMEX GOLD IMMEDIATELY. THEN THEY ORCHESTRATE THEIR PRIVATE EFP DEAL WITH THE LONGS AND THAT COULD TAKE AN ADDITIONAL 48 HRS SO WE GENERALLY DO NOT GET A MATCH WITH RESPECT TO DEPARTING COMEX LONGS AND NEW EFP LONG TRANSFERS. . EVEN THOUGH THE BANKERS ISSUED THESE MONSTROUS EFPS, THE OBLIGATION STILL RESTS WITH THE BANKERS TO SUPPLY METAL BUT IT TRANSFERS THE RISK TO A LONDON BANKER OBLIGATION AND NOT A NEW YORK COMEX OBLIGATION. LONGS RECEIVE A FIAT BONUS TOGETHER WITH A LONG LONDON FORWARD. THUS, BY THESE ACTIONS, THE BANKERS AT THE COMEX HAVE JUST STATED THAT THEY HAVE NO APPRECIABLE METAL!! THIS IS A MASSIVE FRAUD: THEY CANNOT SUPPLY ANY METAL TO OUR COMEX LONGS BUT THEY ARE QUITE WILLING TO SUPPLY MASSIVE NON BACKED GOLD (AND SILVER) PAPER KNOWING THAT THEY HAVE NO METAL TO SATISFY OUR LONGS. LONDON IS NOW SEVERELY BACKWARD IN BOTH GOLD AND SILVER AND WE ARE WITNESSING DELAYS IN ACTUAL DELIVERIES.
IN ESSENCE WE HAVE A HUMONGOUS SIZED OI GAIN IN CONTRACTS ON THE TWO EXCHANGES: 6691 OI CONTRACTS DECREASED AT THE COMEX AND AN ATMOSPHERIC SIZED 17,4797 EFP OI CONTRACTS WHICH NAVIGATED OVER TO LONDON.THUS TOTAL OI GAIN: 10,788 CONTRACTS OR 1,078,800 OZ = 33.56 TONNES. AND ALL OF THIS OCCURRED WITH A LOSS OF $1.15 DURING YESTERDAY’S CONTINUAL BOMBARDMENT???
YESTERDAY, WE HAD 13,207 EFP’S ISSUED.
ACCUMULATION OF EFP’S GOLD AT J.P. MORGAN’S HOUSE OF BRIBES: (EXCHANGE FOR PHYSICAL) FOR THE MONTH OF MAY : 36,433 CONTRACTS OR 3643,300 OZ OR 113.32 TONNES (3 TRADING DAYS AND THUS AVERAGING: 12,144 EFP CONTRACTS PER TRADING DAY OR 1,214,400 OZ/ TRADING DAY),
TO GIVE YOU AN IDEA AS TO THE HUGE SIZE OF THESE EFP TRANSFERS : THIS MONTH IN 3 TRADING DAYS IN TONNES: 113.32 TONNES
TOTAL ANNUAL GOLD PRODUCTION, 2017, THROUGHOUT THE WORLD EX CHINA EX RUSSIA: 2555 TONNES
THUS EFP TRANSFERS REPRESENTS 113.32/2550 x 100% TONNES = 2.31% OF GLOBAL ANNUAL PRODUCTION SO FAR IN APRIL ALONE.*** THE ACCUMULATION OF EFP CONTRACTS IS RISING PER MONTH.
ACCUMULATION OF GOLD EFP’S YEAR 2018 TO DATE: 2,871.27* TONNES *SURPASSED ANNUAL PROD’N
ACCUMULATION OF GOLD EFP’S FOR JANUARY 2018: 653.22 TONNES
ACCUMULATION OF GOLD EFP’S FOR FEBRUARY 2018: 649.45 TONNES
ACCUMULATION OF GOLD EFP’S FOR MARCH 2018: 741.89 TONNES (22 TRADING DAYS)
ACCUMULATION OF GOLD EFP’S FOR APRIL 2018: 713.84 TONNES (21 TRADING DAYS)
WHAT IS ALARMING TO ME, ACCORDING TO OUR LONDON EXPERT ANDREW MAGUIRE IS THAT THESE EFP’S ARE BEING TRANSFERRED TO WHAT ARE CALLED SERIAL FORWARD CONTRACT OBLIGATIONS AND THESE CONTRACTS ARE LESS THAN 14 DAYS. ANYTHING GREATER THAN 14 DAYS, THESE MUST BE RECORDED AND SENT TO THE COMPTROLLER, GREAT BRITAIN TO MONITOR RISK TO THE BANKING SYSTEM. IF THIS IS INDEED TRUE, THEN THIS IS A MASSIVE CONSPIRACY TO DEFRAUD AS WE NOW WITNESS A MONSTROUS TOTAL EFP’S ISSUANCE AS IT HEADS INTO THE STRATOSPHERE.
Result: A GOOD DECREASE IN OI AT THE COMEX OF 6691 DESPITE THE TINY FALL IN PRICE // GOLD TRADING YESTERDAY ($1.15 LOSS). HOWEVER WE ALSO HAD A HUMONGOUS SIZED NUMBER OF COMEX LONG TRANSFERRING TO LONDON THROUGH THE EFP ROUTE: 17,479 CONTRACTS AS THESE HAVE ALREADY BEEN NEGOTIATED AND CONFIRMED. THERE OBVIOUSLY DOES NOT SEEM TO BE MUCH PHYSICAL GOLD AT THE COMEX. I GUESS IT EXPLAINS THE HUGE ISSUANCE OF EFP’S…THERE IS HARDLY ANY GOLD PRESENT AT THE GOLD COMEX FOR DELIVERY PURPOSES. IF YOU TAKE INTO ACCOUNT THE 17,479 EFP CONTRACTS ISSUED, WE HAD A STRONG SIZED NET GAIN OF 10,788 CONTRACTS IN TOTAL OPEN INTEREST ON THE TWO EXCHANGES:
6691 CONTRACTS MOVE TO LONDON AND 17,479 CONTRACTS INCREASED AT THE COMEX. (in tonnes, the GAIN in total oi equates to 33.56 TONNES).
we had: 0 notice(s) filed upon for NIL oz of gold at the comex.
xxxxxxxxxxxxxxxxxxxxxxxxxxxxxxxxxxxxxxxxxxxxxxxxxxxxxxxxxxx
With respect to our two criminal funds, the GLD and the SLV:
GLD…
WITH GOLD UP $7.05 /NO CHANGES IN GOLD INVENTORY AT THE GLD
Inventory rests tonight: 866.77 tonnes.
SLV/
WITH SILVER UP 7 CENTS TODAY: NO CHANGES IN SILVER INVENTORY AT THE SLV/
/INVENTORY RESTS AT 322.981 MILLION OZ/
end
First, here is an outline of what will be discussed tonight:
1. Today, we had the open interest in SILVER FELL BY A CONSIDERABLE 1290 CONTRACTS from 194,685 DOWN TO 193,395 (AND FURTHER FROM THE NEW COMEX RECORD SET /APRIL 9/2017 AT 243,411/SILVER PRICE AT THAT DAY: $16.53). THE PREVIOUS RECORD OTHER THAN WAS ESTABLISHED AT: 234,787, SET ON APRIL 21.2017 OVER ONE YEAR AGO. THE PRICE OF SILVER ON THAT DAY: $17.89. OUR CUSTOMARY MIGRATION OF COMEX LONGS MORPH INTO LONDON FORWARDS CONTINUES AS OUR BANKERS USED THEIR EMERGENCY PROCEDURE TO ISSUE: 0 EFP CONTRACTS FOR APRIL, 0 EFP CONTRACTS FOR MAY (WE DO NOT GET A LOOK AT THESE CONTRACTS AS IT IS PRIVATE BUT THE CFTC DOES AUDIT THEM), AND 2148 EFP’S FOR JULY AND ALL OTHER MONTHS ZERO. TOTAL EFP ISSUANCE: 2148 CONTRACTS. EFP’S GIVE OUR COMEX LONGS A FIAT BONUS PLUS A DELIVERABLE PRODUCT OVER IN LONDON. IF WE TAKE THE OI LOSS AT THE COMEX OF 1290 CONTRACTS TO THE 2148 OI TRANSFERRED TO LONDON THROUGH EFP’S, WE OBTAIN A GAIN OF 858 OPEN INTEREST CONTRACTS. THUS IN OUNCES, THE GAIN ON THE TWO EXCHANGES: 4.29 MILLION OZ!!! AND THIS OCCURRED DESPITE THE RISE IN PRICE OF 24 CENTS. THE BANKERS ORCHESTRATED THEIR RAID THROUGHOUT LAST WEEK DESPERATELY TRYING TO PARE THEIR GIGANTIC OPEN INTEREST SHORT ON BOTH EXCHANGES BUT TO NO AVAIL. JUDGING BY THE RECORD NUMBER OF EFP ISSUANCE DURING LAST MONTH OF APRIL AT 385.75 MILLION OZ AND THE TOTAL OI GAIN ON THE TWO EXCHANGES, I DO NOT THINK THAT OUR BANKERS HAVE BEEN TOO SUCCESSFUL. THE CONSTANT RAIDS ARE NOW BEING CALLED UPON BY OUR BANKER FRIENDS ARE DONE IN AN ATTEMPT TO SHAKE AS MANY SILVER LEAVES FROM THE SILVER TREE AS POSSIBLE.
RESULT: A STRONG SIZED DECREASE IN SILVER OI AT THE COMEX DESPITE THE RISE IN SILVER PRICING / YESTERDAY (24 CENTS/) . BUT WE ALSO HAD ANOTHER GOOD SIZED 2148 EFP’S ISSUED TRANSFERRING COMEX LONGS OVER TO LONDON. TOGETHER WITH THE STRONG SIZED AMOUNT OF SILVER OUNCES STANDING FOR APRIL, DEMAND FOR PHYSICAL SILVER CONTINUES TO INTENSIFY AS WE WITNESS SEVERE BACKWARDATION IN SILVER IN LONDON.
(report Harvey)
.
2.a) The Shanghai and London gold fix report
(Harvey)
2 b) Gold/silver trading overnight Europe, Goldcore
(Mark O’Byrne/zerohedge
and in NY: Bloomberg
3. ASIAN AFFAIRS
i)THURSDAY MORNING/WEDNESDAY NIGHT: Shanghai closed UP 19.68 points or .64% /Hang Sang CLOSED down 410.51 points or 1.34% / The Nikkei closed HOLIDAY /Australia’s all ordinaires CLOSED UP .82% /Chinese yuan (ONSHORE) closed UP at 6.3482/Oil DOWN to 67.91 dollars per barrel for WTI and 72.95 for Brent. Stocks in Europe OPENED DEEPLY IN THE RED. ONSHORE YUAN CLOSED UP AT 6.3482 AGAINST THE DOLLAR. OFFSHORE YUAN CLOSED UP ON THE DOLLAR AT 6.3514/ONSHORE YUAN TRADING WEAKER AGAINST OFFSHORE YUAN/ONSHORE YUAN TRADING STRONGER AGAINST USA DOLLAR/OFFSHORE YUAN TRADING STRONGER AGAINST THE DOLLAR /CHINA RETALIATES WITH TARIFFS/ TRUMP RESPONDS TO NEW TARIFFS AND IT NOW LOOKS LIKE A FULL TRADE WAR IS BEGINNING/
/NORTH KOREA/SOUTH KOREA
i)North Korea/South Korea/USA
North Korea releases 3 USA prisoners
( zerohedge)
b) REPORT ON JAPAN
3 c CHINA
4. EUROPEAN AFFAIRS
5. RUSSIAN AND MIDDLE EASTERN AFFAIRS
( Tom Luongo)
6 .GLOBAL ISSUES
The Argentinian Peso continues to collapse despite a 2nd 300 basis rate hike this week. It is the worst currency of them all and there is a high risk that this nation goes into hyperinflation shortly
( zerohedge)
ii)CANADA
Funny story: you do not know whether to cry or laugh but Trudeau now blames our illegal immigration problem on the uSA
(courtesy Mac Slavo./SHFTPlan.com)
7. OIL ISSUES
8. EMERGING MARKET
i)Venezuela
9. PHYSICAL MARKETS
10. USA stories which will influence the price of gold/silver
i)Trading this morning:
iii)SWAMP STORIES
a)Seems that we have a very angry Obama official who tried to influence McCabe and the Clinton Foundation investigation
b)Two big stories last night: First Giuliani states that Trump reimbursed Cohen for the Stormy Daniels hush money;
( zerohedge)
c)NBC reports that Michael Cohen’s phone lines were tapped and at least one phone call to the White House was recorded. I guess they will leak what was said in that wiretapped conversation( zerohedge)
Trading Volumes on the COMEX
PRELIMINARY COMEX VOLUME FOR TODAY: 405,242 contracts
CONFIRMED COMEX VOL. FOR YESTERDAY: 300,675 contracts
xxxxxxxxxxxxxxxxxxxxxxxxxxxxxxxxxxxxxxxxxxxxxxxxxxxxxxxxxxxxxxxxxxxx
And now for the wild silver comex results.
Total silver OI FELL BY A CONSIDERABLE 1290 CONTRACTS FROM 194,685 DOWN TO 193,395 (AND FURTHER FROM THE NEW RECORD OI FOR SILVER SET APRIL 9.2018/ 243,411 CONTRACTS) DESPITE THE 24 CENT GAIN IN SILVER PRICING. SINCE WE ARE NOW INTO THE ACTIVE DELIVERY MONTH OF MAY. WE WERE INFORMED THAT WE HAD A GOOD SIZED 2148 EFP CONTRACT ISSUANCE FOR JULY AND ZERO FOR ALL OTHER MONTHS. THESE EFPS WERE ISSUED TO COMEX LONGS WHO RECEIVED A FIAT BONUS PLUS A DELIVERABLE PRODUCT OVER IN LONDON. THE TOTAL EFP’S ISSUED: 2148. ON A NET BASIS WE GAINED 858 SILVER OPEN INTEREST CONTRACTS AS WE OBTAINED A 1290 CONTRACT LOSS AT THE COMEX COMBINING WITH THE ADDITION OF 2148 OI CONTRACTS NAVIGATING OVER TO LONDON. DUE TO THE FACT THAT THE BOYS WERE VERY BUSY NEGOTIATING LONG COMEX CONTRACTS EMIGRATING TO LONDON,(AND WAITING FOR THEIR PASSPORTS)
NET GAIN ON THE TWO EXCHANGES: 858 CONTRACTS
AMOUNT STANDING FOR SILVER AT THE COMEX
We are now in the active delivery month of MAY and here the front month LOST 754 contracts FALLING TO 1128 contracts. We had 814 notices filed upon yesterday so we SURPRISINGLY AGAIN GAINED 60 contracts or 300,000 additional ounces will stand for delivery in this active delivery month of May AS SOMEBODY WAS DESPERATE FOR PHYSICAL SILVER..
June saw a LOSS of 249 contracts to stand at 790. The next big delivery month for silver is July and here the OI FELL by 1346 contracts DOWN to 141,535. The next active delivery month after July for silver is September and here the OI ROSE by 477 contracts UP to 20,160
We had 482 notice(s) filed for 2,410,000 OZ for the MAY 2018 contract for silver
INITIAL standings for MAY/GOLD
MAY 2/2018.
| Gold | Ounces |
| Withdrawals from Dealers Inventory in oz | nil oz |
| Withdrawals from Customer Inventory in oz |
NIL OZ
|
| Deposits to the Dealer Inventory in oz | NIL oz |
| Deposits to the Customer Inventory, in oz | nil OZ |
| No of oz served (contracts) today |
0 notice(s)
NIL OZ
|
| No of oz to be served (notices) |
367 contracts
(36700 oz)
|
| Total monthly oz gold served (contracts) so far this month |
14 notices
1400 OZ
0.0435 TONNES
|
| Total accumulative withdrawals of gold from the Dealers inventory this month | NIL oz |
| Total accumulative withdrawal of gold from the Customer inventory this month | xxx oz |
For MAY:
Today, 0 notice(s) were issued from JPMorgan dealer account and 0 notices were issued from their client or customer account. The total of all issuance by all participants equates to 0 contract(s) of which 0 notices were stopped (received) by j.P. Morgan dealer and 0 notice(s) was (were) stopped/ Received) by j.P.Morgan customer account.
xxxxxxxxxxxxxxxxxxxxxxxxxxxxxxxxxxxxxxxxxxxxxxxxxxxxxxxxxxxxxxxxxxxxxxxxxx
To calculate the INITIAL total number of gold ounces standing for the MAY. contract month, we take the total number of notices filed so far for the month (14) x 100 oz or 1400 oz, to which we add the difference between the open interest for the front month of MAY. (371 contracts) minus the number of notices served upon today (0 x 100 oz per contract) equals 38,100 oz, the number of ounces standing in this active month of APRIL (1.1850 tonnes)
Thus the INITIAL standings for gold for the MAY contract month:
No of notices served (14 x 100 oz or ounces + {(371)OI for the front month minus the number of notices served upon today (0 x 100 oz )which equals 38,100 oz standing in this active delivery month of MAY . THERE IS 10.382 TONNES OF REGISTERED GOLD AVAILABLE FOR DELIVERY SO FAR.
WE LOST 0 OZ OF GOLD THAT WILL STAND AT THE COMEX
IN THE LAST 18 MONTHS 73 NET TONNES HAS LEFT THE COMEX.
end
And now for silver
AND NOW THE APRIL DELIVERY MONTH
MAY INITIAL standings/SILVER
| Silver | Ounces |
| Withdrawals from Dealers Inventory | nil oz |
| Withdrawals from Customer Inventory |
NIL oz
|
| Deposits to the Dealer Inventory |
1,202,536.440
oz
CNT
|
| Deposits to the Customer Inventory |
NIL oz
|
| No of oz served today (contracts) |
482
CONTRACT(S)
(2,410,000 OZ)
|
| No of oz to be served (notices) |
646 contracts
(3,230,000 oz)
|
| Total monthly oz silver served (contracts) | 4747 contracts
(23,735,000 oz) |
| Total accumulative withdrawal of silver from the Dealers inventory this month | NIL oz |
| Total accumulative withdrawal of silver from the Customer inventory this month |
we had 1 inventory movement at the dealer side of things
i) Into dealer: CNT: 1,202,536.440 oz
total dealer deposits: 1,202,536.440 oz
we had 0 deposits into the customer account
i) Into JPMorgan: nil oz
*** JPMorgan for most of 2017 and in 2018 has adding to its inventory almost every single day.
JPMorgan now has 140 million oz of total silver inventory or 53.4% of all official comex silver. (140 million/263 million)
JPMorgan did not deposit into its warehouses (official) today.
ii) EVERYBODY ELSE: ZERO OZ
total deposits today: nil oz
we had 0 withdrawals from the customer account;
total withdrawals; nil oz
we had 0 adjustment
.
total dealer silver: 66.568 million
total dealer + customer silver: 266.799 million oz
The total number of notices filed today for the MAY. contract month is represented by 482 contract(s) FOR 2,410,000 oz. To calculate the number of silver ounces that will stand for delivery in MAY., we take the total number of notices filed for the month so far at 4265 x 5,000 oz = 21,325,000 oz to which we add the difference between the open interest for the front month of MAY. (1128) and the number of notices served upon today (482 x 5000 oz) equals the number of ounces standing.
.
Thus the INITIAL standings for silver for the MAY contract month: 4265(notices served so far)x 5000 oz + OI for front month of MAY(1128) -number of notices served upon today (482)x 5000 oz equals 26,965,000 oz of silver standing for the MAY contract month
WE GAINED 60 CONTRACTS OR AN ADDITIONAL 300,000 OZ WILL STAND AT THE COMEX AND THESE GUYS DID NOT MORPH INTO LONDON BASED FORWARDS BUT ARE STANDING FOR PHYSICAL METAL AT THE COMEX.
xxxxxxxxxxxxxxxxxxxxxxxxxxxxxxxxxxxxxxxxxxxxxxxxxxxxxxxxxxx
ESTIMATED VOLUME FOR TODAY: 107,566 CONTRACTS
CONFIRMED VOLUME FOR YESTERDAY: 88,875 CONTRACTS (my goodness)
YESTERDAY’S CONFIRMED VOLUME OF 88,875 CONTRACTS EQUATES TO 444 MILLION OZ OR 63.4% OF ANNUAL GLOBAL PRODUCTION OF SILVER
COMMODITY LAW SUGGESTS THAT OPEN INTEREST SHOULD NOT BE MORE THAN 3% OF ANNUAL GLOBAL PRODUCTION. THE CROOKS ARE SUPPLYING MASSIVE PAPER TRYING TO KEEP SILVER IN CHECK.
The record level of silver open interest is 234,787 contracts set on April 21./2017 with the price at that day at $18.42
The previous record was 224,540 contracts with the price at that time of $20.44
end
NPV for Sprott
1. Sprott silver fund (PSLV): NAV FALLS TO -1.24% (MAY2/2018)
2. Sprott gold fund (PHYS): premium to NAV FALLS TO -0.51% to NAV (MAY 2/2018 )
Note: Sprott silver trust back into NEGATIVE territory at -1.24%-/Sprott physical gold trust is back into NEGATIVE/ territory at -0.51%/Central fund of Canada’s is still in jail but being rescued by Sprott.
Sprott WINS hostile 3.1 billion bid to take over Central Fund of Canada
(courtesy Sprott/GATA)
3.SPROTT CEF.A FUND (FORMERLY CENTRAL FUND OF CANADA): NAV FALLS TO -2.35`%: NAV 13.56/TRADING 13.25//DISCOUNT 2.035
END
And now the Gold inventory at the GLD/
MAY 3/WITH GOLD UP $7.05/NO CHANGES IN GOLD INVENTORY AT THE GLD/INVENTORY RESTS AT 866.77 TONNES
MAY 2/WITH GOLD DOWN $1.15/ A HUGE WITHDRAWAL OF 4.43 TONNES FROM THE GLD/INVENTORY RESTS AT 866.77 TONNES
MAY 1/WITH GOLD DOWN $12.15/NO CHANGE IN GOLD INVENTORY AT THE GLD/INVENTORY RESTS AT 871.20 TONNES
APRIL 30/WITH GOLD DOWN $4.05/NO CHANGE IN GOLD INVENTORY AT THE GLD/INVENTORY RESTS AT 871.20 TONNES.
APRIL 27./WITH GOLD UP $5.90/NO CHANGE IN GOLD INVENTORY AT THE GLD/INVENTORY RESTS AT 871.20 TONNES/
APRIL 26/WITH GOLD DOWN $4.90/NO CHANGE IN GOLD INVENTORY AT THE GLD/INVENTORY RESTS AT 871.20 TONNES
APRIL 25/AFTER 9 CONSECUTIVE DAYS OF NO MOVEMENT OF GOLD INTO OUT OF THE GLD, WE HAD A HUGE DEPOSIT OF 5.31 TONNES OF GOLD INTO THE GLD/INVENTORY RESTS AT 871.20 TONNES.
APRIL 24./WITH GOLD UP $9.90, WE HAD NO CHANGES IN GOLD INVENTORY AT THE GLD/INVENTORY RESTS AT 865.89 TONNES/
APRIL 23.2018/WITH GOLD DOWN $14.00/NO CHANGE IN GOLD INVENTORY AT THE GLD/INVENTORY RESTS AT 865.89 TONNES.
APRIL 20/WITH GOLD DOWN $10.20: NO CHANGES IN GOLD INVENTORY AT THE GLD/INVENTORY RESTS AT 865.89 TONNES
APRIL 19/WITH GOLD DOWN $4.25: NO CHANGES IN GOLD INVENTORY AT THE GLD/INVENTORY RESTS AT 865.89 TONNES/
APRIL 18/WITH GOLD UP $3.65: NO CHANGES IN GOLD INVENTORY AT THE GLD/INVENTORY RESTS AT 865.89 TONNES
APRIL 17/WITH GOLD DOWN $1.00 NO CHANGES IN GOLD INVENTORY AT THE GLD/INVENTORY RESTS AT 865.89 TONNES/
April 16/WITH GOLD UP$2.80/NO CHANGES IN GOLD INVENTORY AT THE GLD/INVENTORY RESTS AT 865.89 TONNES/
April 13/WITH GOLD UP $6.15, A HUGE DEPOSIT OF 5.90 TONNES INTO THE GLD INVENTORY/INVENTORY RESTS AT 865.89 TONNES
April 12/WITH GOLD DOWN $17.40/NO CHANGES IN GOLD INVENTORY AT THE GLD/INVENTORY RESTS AT 859.99 TONNES
April 11/WITH GOLD UP $13.85/NO CHANGES IN GOLD INVENTORY AT THE GLD/INVENTORY RESTS AT 859,99 TONNES
APRIL 10/WITH GOLD UP $5.25/NO CHANGES IN GOLD INVENTORY AT THE GLD/INVENTORY RESTS AT 859.99 TONNES
APRIL 9/WITH GOLD UP$4.50/NO CHANGES IN GOLD INVENTORY AT THE GLD/INVENTORY RESTS AT 859.99 TONNES
APRIL 6/WITH GOLD UP $7.50 ,A HUGE CHANGE IN INVENTORY AT THE GLD/ A DEPOSIT OF 5.90 TONNES/INVENTORY RESTS AT 859.99 TONNES
APRIL 5/WITH GOLD DOWN $8.20 WE HAD TWO ENTRIES: 1) TINY WITHDRAWAL OF .28 TONNES TO PAY FOR FEES AND 2) A DEPOSIT OF 2.06 TONNES//INVENTORY RESTS AT 854.09 TONNES
April 4/WITH GOLD UP $2.90 WE HAD NO CHANGES IN GOLD INVENTORY AT THE GLD/INVENTORY RESTS AT 852.31 TONNES
APRIL 3./WITH GOLD DOWN $9.30 WE HAD NO CHANGES IN GOLD INVENTORY AT THE GLD/INVENTORY RESTS AT 852.31 TONNES
APRIL 2/WITH GOLD UP $19.50, WE HAD A BIG CHANGES IN GOLD INVENTORY AT THE GLD A DEPOSIT OF 6.19 TONNES/INVENTORY RESTS AT 852.31 TONNES
MARCH 29/WITH GOLD DOWN $3.20 AND OPTIONS EXPIRY FINISHED, WE HAD NO CHANGE IN GOLD INVENTORY AT THE GLD/INVENTORY RESTS A 846.12 TONNES
March 28/WITH GOLD DOWN $16.70, ANOTHER RAID ORCHESTRATED, AGAIN NO SURPRISES AS WE WITNESS ANOTHER 1.18 TONNES OF GOLD REMOVED/INVENTORY RESTS AT 846.12 TONNES
xxxxxxxxxxxxxxxxxxxxxxxxxxxxxxxxxx
MAY 3/2018/ Inventory rests tonight at 866.77 tonnes
*IN LAST 375 TRADING DAYS: 74,27 NET TONNES HAVE BEEN REMOVED FROM THE GLD
*LAST 325 TRADING DAYS: A NET 82.03 TONNES HAVE NOW BEEN ADDED INTO GLD INVENTORY.
end
Now the SLV Inventory/
MAY 2/WITH SILVER UP 24 CENTS/A HUGE CHANGE IN SILVER INVENTORY AT THE SLV// A DEPOSIT OF 6.082 MILLION OZ INTO THE SLV/INVENTORY RESTS AT 322.981 MILLION OZ/
MAY 1/WITH SILVER DOWN 24 CENTS/NO CHANGE IN SILVER INVENTORY AT THE SLV/INVENTORY RESTS AT 316.899 MILLION OZ/
APRIL 30/WITH SILVER DOWN 11 CENTS/NO CHANGES IN SILVER INVENTORY AT THE SLV/INVENTORY RESTS AT 316.899 MILLION OZ/
APRIL 27/WITH SILVER DOWN 5 CENTS/NO CHANGES IN SILVER INVENTORY AT THE SLV/INVENTORY RESTS AT 316.899 MILLION OZ/
APRIL 26/WITH SILVER DOWN 2 CENT/NO CHANGES IN SILVER INVENTORY AT THE SLV/INVENTORY RESTS AT 316,899 MILLION OZ/
APRIL 25./WITH SILVER DOWN 18 CENTS/NO CHANGES IN SILVER INVENTORY AT THE SLV/INVENTORY RESTS AT 316.899 MILLION OZ/
APRIL 24./WITH SILVER UP 8 CENTS/SOMETHING SPOOKED OUR CROOKS TO ADD SOME PAPER SILVER: A DEPOSIT OF 1.601 MILLION OZ/INVENTORY RESTS AT 316.899 MILLION OZ/
APRIL 23.2018/WITH SILVER DOWN 50 CENTS, ANOTHER HUGE WITHDRAWAL FROM THE SLV INVENTORY: A WITHDRAWAL OF 1.413 MILLION OZ/INVENTORY RESTS AT 315.298 MILLION OZ.
APRIL 20/WITH SILVER DOWN 11 CENTS: ANOTHER HUGE CHANGE IN SILVER INVENTORY: A WITHDRAWAL OF 1.13 MILLION OZ//SLV RESTS TONIGHT AT 316.711 MILLION OZ/
APRIL 19/WITH SILVER UP 3 CENTS TODAY: WE HAD A BIG CHANGE IN SILVER INVENTORY AT THE SLV: A WITHDRAWAL OF 2.355 MILLION OZ/ MAKES ABSOLUTELY NO SENSE!!/INVENTORY RESTS AT 317.841 MILLION OZ
APRIL 18/WITH SILVER UP 44 CENTS TODAY: NO CHANGES IN SILVER INVENTORY AT THE SLV/INVENTORY RESTS AT 320.196 MILLION OZ
APRIL 17/WITH SILVER UP 10 CENTS TODAY/NO CHANGES IN SILVER INVENTORY AT THE SLV/INVENTORY RESTS AT 320.196 MILLION OZ
April 16/WITH SILVER UP 7 CENTS TODAY: NO CHANGES IN SILVER INVENTORY AT THE SLV/INVENTORY RESTS AT 320.196 MILLION OZ/
April 13/WITH SILVER UP 17 CENTS TODAY: NO CHANGES IN SILVER INVENTORY AT THE SLV/INVENTORY RESTS AT 320.196 MILLION OZ.
April 12/WITH SILVER DOWN 27 CENTS/NO CHANGES IN SILVER INVENTORY AT THE SLV/INVENTORY RESTS AT 320.196 MILLION OZ/
April 11/2018/WITH SILVER UP 16 CENTS: NO CHANGES IN SILVER INVENTORY AT THE SLV/INVENTORY RESTS AT 320.196 MILLION OZ/
APRIL 10/WITH GOLD UP 8 CENTS/NO CHANGES IN SILVER INVENTORY AT THE SLV/INVENTORY RESTS AT 320.196 MILLION OZ/
APRIL 9/WITH SILVER UP 12 CENTS/WE HAD NO CHANGES IN SILVER INVENTORY/INVENTORY RESTS AT 320.196 MILLION OZ/
APRIL 6/WITH SILVER UP 4 CENTS, WE HAD A HUGE DEPOSIT OF 1.319 MILLION OZ INTO THE SLV INVENTORY/INVENTORY RESTS AT 320.196 MILLION OZ
APRIL 5/WITH SILVER UP 6 CENTS/NO CHANGES IN INVENTORY AT THE SLV/INVENTORY RESTS AT 318.877 MILLION OZ/
April 4/WITH SILVER DOWN 11 CENTS/A SMALL CHANGE IN SILVER INVENTORY AT THE SLV/ A WITHRAWAL OF 135,000 OZ AND THIS IS PROBABLY TO PAY FOR FEES/INVENTORY RESTS AT 318.877 MILLION OZ/
APRIL 3./WITH SILVER DOWN 16 CENTS/NO CHANGE IN SILVER INVENTORY AT THE SLV/INVENTORY RESTS AT 319.012 MILLION OZ/
APRIL 2/WITH SILVER UP 34 CENTS/NO CHANGES IN SILVER INVENTORY AT THE SLV/INVENTORY RESTS AT 319.012 MILLION OZ/
MARCH 29/WITH SILVER UP 6 CENTS, THE CROOKS DECIDED THAT THEY HAD BETTER ADD SOME 943,000 PAPER OZ TO THEIR INVENTORY/INVENTORY RESTS AT 319.012 MILLION OZ
March 28/WITH SILVER DOWN 27 CENTS/AGAIN NO CHANGE IN SILVER INVENTORY AT THE SLV/INVENTORY RESTS AT 318.069 MILLION OZ
MAY 2/2018: A HUGE CHANGE IN SILVER INVENTORY: A DEPOSIT OF 6.082 MILLION OZ
Inventory 322.981 million oz
end
6 Month MM GOFO 2.02/ and libor 6 month duration 2.51
Indicative gold forward offer rate for a 6 month duration/calculation:
G0FO+ 2.02%
libor 2.51 FOR 6 MONTHS/
GOLD LENDING RATE: .49%
XXXXXXXX
12 Month MM GOFO
+ 2.78%
LIBOR FOR 12 MONTH DURATION: 2.50
GOFO = LIBOR – GOLD LENDING RATE
GOLD LENDING RATE = +.28
end
Major gold/silver trading /commentaries for WEDNESDAY
GOLDCORE/BLOG/MARK O’BYRNE.
GOLD/SILVER
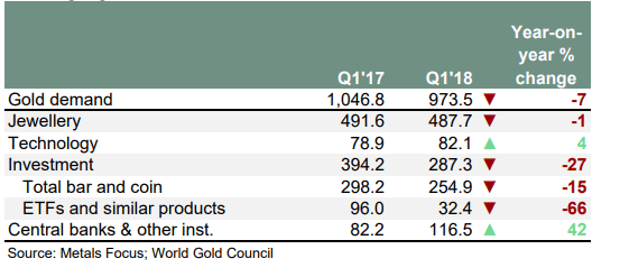
Gold Demand Falls In Q1 Despite Robust Central Bank and Investment Demand and Surging Demand In Turkey and Iran
– Gold demand globally -7% in Q1, 2018 – Gold Demand Trends (WGC)
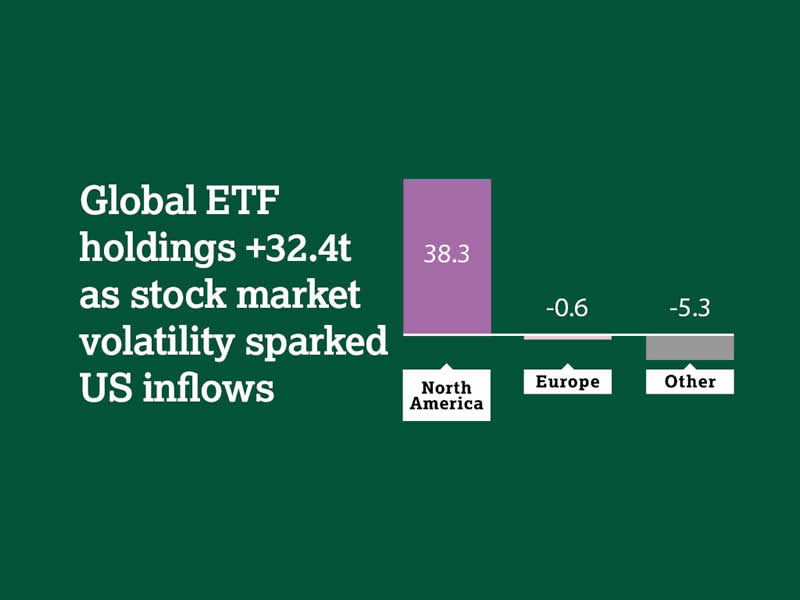
– Gold ETF demand fell sharply year on year from very high levels but had 5th consecutive quarter of inflows
– Investment demand was strong in the US where ETF holdings rose another 32.4 tonnes as “stock market volatility sparked US inflows”
– Store of value bullion coin and bar demand fell 15% as reported Chinese, German and American demand fell
– Gold demand in Turkey (FT) and Iran surges (BBG) due to Trump concerns, inflation on currency debasement and devaluation
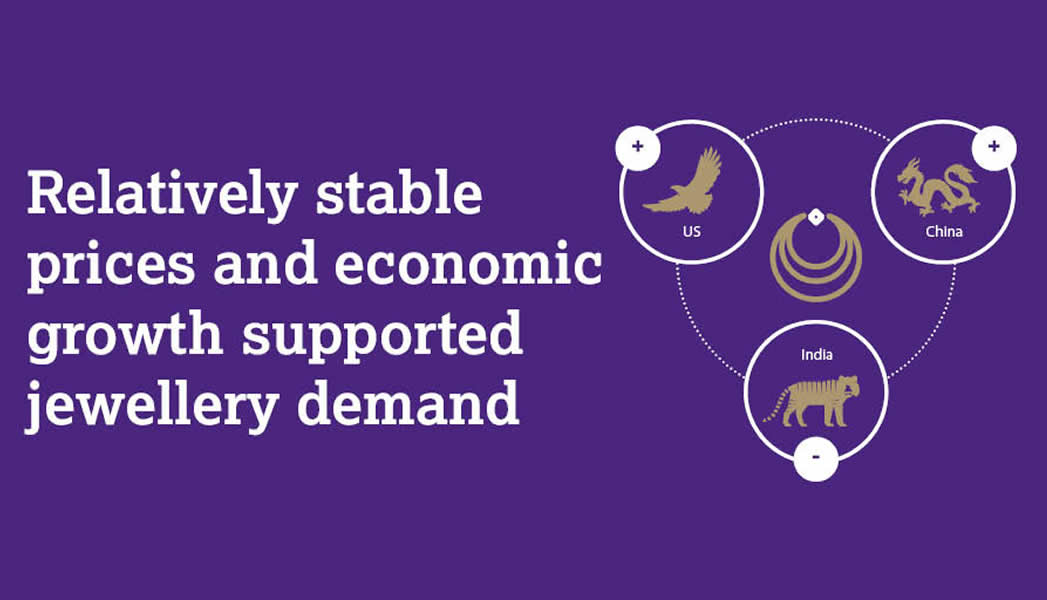
– Global jewellery demand was roughly flat at 487.7t
– Technology demand had sixth consecutive quarter of growth
– Central bank demand remains robust at 116.5 tonnes

‘Gold Demand Trends’ is the World Gold Council’s leading industry publication on gold demand trends, analysed by both sector and geography. Read the full report here
News and Commentary
Gold Edges Up Ahead of U.S.-Sino Trade Talks (Reuters.com)
Gold extends gains as dollar weakens after dovish Fed remarks (Reuters.com)
Gold ends at 2-month low, then climbs after Fed statement (MarketWatch.com)
Fed holds rates steady but points to higher inflation (CNBC.com)
American Eagle gold coin sales are weakest April sales level since 2007 (MarketWatch.com)
Gold Eagle Sales Still Faltering While Mining Output Collapses – Perfect Storm (GoldSeek.com)
Gold demand at weakest in first quarter since 2008 financial crisis (TheGuardian.com)
Trump Ire Stokes Gold Trade in Iran as Rial Hits Record Low (Bloomberg.com)
Turkey’s booming inflation and sinking currency boost gold demand (FT.com)
Listen on SoundCloud , Blubrry & iTunes. Watch on YouTube below

Gold Prices (LBMA AM)
01 May: USD 1,309.20, GBP 956.37 & EUR 1,087.68 per ounce
30 Apr: USD 1,316.25, GBP 958.62 & EUR 1,087.62 per ounce
27 Apr: USD 1,317.70, GBP 954.41 & EUR 1,090.79 per ounce
26 Apr: USD 1,321.90, GBP 949.52 & EUR 1,085.94 per ounce
25 Apr: USD 1,325.70, GBP 949.47 & EUR 1,085.48 per ounce
24 Apr: USD 1,327.35, GBP 951.84 & EUR 1,087.76 per ounce
23 Apr: USD 1,328.00, GBP 950.45 & EUR 1,085.64 per ounce
Silver Prices (LBMA)
01 May: USD 16.25, GBP 11.87 & EUR 13.51 per ounce
30 Apr: USD 16.38, GBP 11.93 & EUR 13.54 per ounce
27 Apr: USD 16.53, GBP 12.01 & EUR 13.68 per ounce
26 Apr: USD 16.58, GBP 11.87 & EUR 13.61 per ounce
25 Apr: USD 16.57, GBP 11.87 & EUR 13.57 per ounce
24 Apr: USD 16.60, GBP 11.90 & EUR 13.59 per ounce
23 Apr: USD 16.94, GBP 12.14 & EUR 13.85 per ounce
Recent Market Updates
– “Blood In The Streets” Of U.S. Gold Bullion Market As Sale Of Gold Coins Collapse
– Most Important Chart Of The Century For Investors?
– Gold Mining Shares Are Speculative Making Gold Bullion A Better Investment
– Gold Price Increasingly Influenced By Declining Dollar Rather Than Interest Rates
– Cash “Vanishes” From Bank Accounts In Ireland
– Russia Buys 300,000 Ounces Of Gold In March – Nears 2,000 Tons In Gold Reserves
– Family Offices and HNWs Invest In Gold Again
– New All Time Record Highs For Gold In 2019
– Palladium Bullion Surges 17% In 9 Days On Russian Supply Concerns
– Silver Bullion Remains Good Value On Positive Supply And Demand Factors
– London House Prices See Fastest Quarterly Fall Since 2009 Crisis
– Global Debt Bubble Hits New All Time High – One Quadrillion Reasons To Buy Gold
– Oil Surges Over 8%, Gold and Silver Marginally Higher, Stocks Gain In Volatile Week

Andrew Maguire’s Kinesis money which is a “bitcoin” but backed 100% by allocated gold and silver is set to go.
it think it would be a great idea to look at this!
please read at: https://kinesis.money/#/
(Andrew Maguire)
|
2:57 PM (1 hour ago) | ||
|
|||
Harvey
Here It is my friend! https://kinesis.money/#/ Please let everyone know.
Let catch up on Monday if you have time. We have billions in the hopper ready to be allocated on the 1st day of trading. The paper market days are over.
Warm regards
Andy
Mike Kosares: The case for gold in the era of financial virtual reality
Submitted by cpowell on Wed, 2018-05-02 20:26. Section: Daily Dispatches
4:28p ET Wednesday, May 2, 2018
Dear Friend of GATA and Gold:
Markets these days seems to be taking their cues from “virtual reality,” USAGold’s Mike Kosares writes today, but he discerns seven signs suggesting that reality might reassert itself and suspects that if that ever happens, nothing will be as real as gold. Kosares’ analysis is headlined “The Case for Gold in the Era of Financial Virtual Reality” and it’s posted at USAGold here:
http://usagold.com/publications/NewsViewsMAY2018Sum.html
CHRIS POWELL, Secretary/Treasurer
Gold Anti-Trust Action Committee Inc.
CPowell@GATA.org
END
Trump’s anger at Iran as caused its citizens to pile into gold while the Rial hits its record lows
(courtesy Claudia Carpenter/Bloomberg/GATA)
Trump Ire Stokes Gold Trade in Iran as Rial Hits Record Low
By Claudia Carpenter
Bloomberg
May 3, 2018, 12:00 AM EDT Updated on May 3, 2018, 2:46 AM EDT
Gold coin, bar demand more than tripled in first quarter: WGC
Value-added tax hits U.A.E. and Iran gold jewelry consumption
Iranians placed a lot more bets on gold in the first quarter after the local currency weakened to a record and fears grew that the U.S. would pull out of the nuclear deal, signaling a return to sanctions…
Trump Ire Stokes Gold Trade in Iran as Rial Hits Record Low
-END-
Another great commentary from Bill Holter
(courtesy Bill Holter/Holter-Sinclair Collaboration)

I have tried to explain this concept many times before but never had a chart to do it with. Please note the start date of the chart is 1971, this is not by any coincidence as that was the year the U.S. dollar became fully fiat and backed by nothing but “faith”. Before getting started, it is important to understand what August 15, 1971 really meant and why Nixon took us off the gold standard. The obvious is because with France and other nations demanding conversion of dollars into our gold, it would have only been a few short years before our stockpile was completely depleted.
The other, less obvious (so far) reason to come off the gold standard was because it allowed the U.S. to operate without the “restrictions” on monetary (and fiscal) policy that a gold standard imposes. In other words, once gold’s restrictions were lifted, literally unlimited amounts of dollars could be printed by the Fed along with unlimited amounts of fiscal borrowings by the Treasury …to a point. The chart above actually shows you exactly where that point in time was, please let me explain “why”.
Looking at the chart you will notice from 1971 to 2008, the line was for the most part an upward trajectory. Beginning 2008, you will also notice the line has basically crashed below all years prior to 2008 and is now “negative”. For perspective we need to know what “the line” actually represents. Basically it shows net growth of GDP for any given year with the amount of Treasury issued debt subtracted from GDP. For instance, if GDP were to grow by $500 billion over the previous year and the Treasury borrowed a net $250 billion then that year would register a positive $250 billion. Conversely, if GDP grew by $500 billion but the Treasury issued a net $1 trillion, the number registered would be negative $500 billion. Also note this chart is “cumulative” which means the current year is added or subtracted from all the previous years combined.
So GDP growth net of Treasury debt issued was positive until 2008 and has collapsed since then. Why and what does it mean? First, because the line is cumulative it only makes mathematical sense that it is now below “zero” because we have accumulated more debt than we produce in total GDP, $21 trillion versus $19 trillion. (I would remind readers that back in the day, 1970’s-80’s, a number greater than 100% debt to GDP ratio would qualify you for Banana Republic status!)
Another way to view the chart is to see it as a map of whether issuing new debt adds to GDP or whether it is a drag. Clearly prior to 2008, the issuance of new debt generally added to GDP, since then, new debt has been an hindrance. This only confirms in chart form what we already knew, each dollar of new debt is creating well less than a dollar of new GDP.
So what happened in 2008 for the relationship to change from new debt helping …since it always had in the past, to new debt not helping so much or even hurting? SIMPLE! As I wrote in 2007-2008, and maybe a dozen or so times since, we reached DEBT SATURATION! We first saw this in the real estate markets as rental income from properties no longer covered debt service. This sector could not take on more debt because borrowers/buyers either did not want to nor could afford to take on more debt.
As I have said before, at that point (2009), treasuries and central banks were the only entities left that had room on their balance sheets to lever up further …which they have in spades! At the time we called them the “white knights” who rode in with their balance sheets and saved the system by reflating. But levering up came at a high cost. Yes it did buy another 10 years or so time but now the bulk of sovereign treasuries and central banks have reached their respective credit limits! In essence, the world has now as a whole reached credit saturation levels …otherwise known as banana republicland!
As we have said for the last several years, in no mathematical way can the current build up in debt and future promises ever be repaid in current currency terms. Only one of two things can happen, either the debt does not get repaid in which we will see massive and total default, or, the currencies must be devalued to levels where the debt can be repaid. Option number three and the one we have been told all these years is now discredited …remember how we have been constantly told we would “grow our way out from under the debt”? This chart is your proof positive that it ain’t so!!! Switching gears to finish, we have another chart to look at.

This is a chart of commodities priced in terms of the S+P 500. More or less “stocks versus commodities. It would look fairly similar if it was shown as commodities priced in 10 yr. US Treasuries. Basically this can be viewed as real stuff priced in “confidence”. In other words, commodities will be cheap in terms of paper assets when confidence is high and vice versa. Confidence currently is quite high but it is showing signs of waning.
The important thing to understand when we put both charts together is that confidence stands to take a huge hit once the concept of “debt saturation” becomes understood and prevalent. Many ask why can’t the game of printing money, borrowing and suppressing real assets go on forever? Again, the mathematical concept of debt saturation precludes this. It is the addition of more and new debt that becomes ever more destructive. To the point of additional debt actually tipping (credit) markets over and into panic/default. Debt is a funny animal and especially in today’s word where credit default swaps are used as weapons. Think 2008 when individual firms were attacked by purchasing large swaths of CDS. Though similar to buying homeowners insurance on your next door neighbor’s house and then torching it which is illegal, there is nothing illegal about running CDS rates so far up the flagpole …in order to cause a run in a company’s debt. This will certainly be seen again!
To finish, chart number one illustrates how close we are to a panic in the credit markets because it is clear there is no way to reflate again. In other words, new debt is now showing itself to not only no longer help, it is actually destructive. Chart number two shows you what should benefit once confidence does break …real stuff! We have lived through a credit induced holographic standard of living considered to be “normal”. Never throughout all of history has a genuine lifestyle been funded continuously on credit. Each attempt always failed miserably. The only difference today is that more of the world is involved along with more credit used than ever before. The only logical conclusion is this latest credit experiment to fund lifestyle will fail on a far grander scale than ever before!
This was an article written for and originally posted for http://www.JSMineset.com subscribers.
Standing watch,
Bill Holter
Holter-Sinclair collaboration
Your early THURSDAY morning currency, Asian stock market results, important USA/Asian currency crosses, gold/silver pricing overnight along with the price of oil Major stories overnight/9 AM EST
i) Chinese yuan vs USA dollar/CLOSED UP 6.3482 /shanghai bourse CLOSED UP 19.68 POINTS OR .64% / HANG SANG CLOSED DOWN 410.51 POINTS OR 1.34%
2. Nikkei closed / /USA: YEN FALLS TO 109.43/
3. Europe stocks OPENED RED /USA dollar index FALLS TO 92.48/Euro RISES TO 1.1978
3b Japan 10 year bond yield: FALLS TO . +.04/ !!!!(Japan buying 100% of bond issuance)/Japanese yen vs usa cross now at 109.43/ THIS IS TROUBLESOME AS BANK OF JAPAN IS RUNNING OUT OF BONDS TO BUY./JAPAN 10 YR YIELD FINALLY IN THE POSITIVE/BANK OF JAPAN LOSING CONTROL OF THEIR YIELD CURVE AS THEY PURCHASE ALL BONDS TO GET TO ZERO RATE!!
3c Nikkei now JUST BELOW 17,000
3d USA/Yen rate now well below the important 120 barrier this morning
3e WTI:: 67.91 and Brent: 72.95
3f Gold UP/Yen UP
3g Japan is to buy the equivalent of 108 billion uSA dollars worth of bond per month or $1.3 trillion. Japan’s GDP equals 5 trillion usa./“HELICOPTER MONEY” OFF THE TABLE FOR NOW /REVERSE OPERATION TWIST ON THE BONDS: PURCHASE OF LONG BONDS AND SELLING THE SHORT END
Japan to buy 100% of all new Japanese debt and by 2018 they will have 25% of all Japanese debt. Fifty percent of Japanese budget financed with debt.
3h Oil DOWN for WTI and DOWN FOR Brent this morning
3i European bond buying continues to push yields lower on all fronts in the EMU. German 10yr bund FALLS TO +.55%/Italian 10 yr bond yield DOWN to 1.76% /SPAIN 10 YR BOND YIELD DOWN TO 1.27%
3j Greek 10 year bond yield RISES TO : 3.98?????????????????
3k Gold at $1312.35 silver at:16.49 7 am est) SILVER NEXT RESISTANCE LEVEL AT $18.50
3l USA vs Russian rouble; (Russian rouble UP 63/100 in roubles/dollar) 63.42
3m oil into the 67 dollar handle for WTI and 72 handle for Brent/
3n Higher foreign deposits out of China sees huge risk of outflows and a currency depreciation. This can spell financial disaster for the rest of the world/
JAPAN ON JAN 29.2016 INITIATES NIRP. THIS MORNING THEY SIGNAL THEY MAY END NIRP. TODAY THE USA/YEN TRADES TO 109.43 DESTROYING JAPANESE CITIZENS WITH HIGHER FOOD INFLATION
30 SNB (Swiss National Bank) still intervening again in the markets driving down the SF. It is not working: USA/SF this morning 0.9983 as the Swiss Franc is still rising against most currencies. Euro vs SF is 1.1958 well above the floor set by the Swiss Finance Minister. Thomas Jordan, chief of the Swiss National Bank continues to purchase euros trying to lower value of the Swiss Franc.
3p BRITAIN VOTES AFFIRMATIVE BREXIT/LOWER PARLIAMENT APPROVES BREXIT COMMENCEMENT/ARTICLE 50 COMMENCES MARCH 29/2017
3r the 10 Year German bund now POSITIVE territory with the 10 year FALLING to +0.58%
The bank withdrawals were causing massive hardship to the Greek bank. the Greek referendum voted overwhelming “NO”. Next step for Greece will be the recapitalization of the banks and that will be difficult.
4. USA 10 year treasury bond at 2.94% early this morning (THIS IS DEADLY TO ALL MARKETS). Thirty year rate at 3.12%
5. Details Ransquawk, Bloomberg, Deutsche bank/Jim Reid.
(courtesy Jim Reid/Bloomberg/Deutsche bank/zero hedge)
Global Stocks, Dollar Slide As Nervous Traders Eye US-China Trade Talks
It has been a confusing 24 hours, with US futures slumping after yesterday’s unexpectedly hawkish-yet-dovish FOMC, which first slammed the dollar, then sent the USD surging, and sparking an equity selloff even as rates remained relatively unchanged. Today’s this confusion spilled over into international markets, with both Asian and European shares retreating, as traders are on edge ahead of the US-China trade talks taking place today and tomorrow.
The weakness continued this morning, when another disappointing euro-zone core CPI number (1.1%, Exp. 1.2%, last 1.3%) led to sharp rally across EGBs, dragging Treasurys higher in response, and bull-flattening the curve as 10Y yields slumped.

And while U.S. equity futures are slowly trying to grind higher from overnight lows, the response among US equities to what has so far been an impressive earnings season has left most of the bulls very disappointed, and judging by recent analyst commentary, 2018 is clearly not going according to plan (to echo what Citi said last month):
“A slightly disappointing growth reaction thus far to the late 2017 tax cuts, no sign of a meaningful pick-up in inflation pressures and uncertainty generated by the potential for a trade war were always likely to commit the Fed to a steady as she goes message,” said Lee Ferridge of State Street Global Markets. “There might also be a little concern over recent market moves, with stocks flat so far in 2018 while US Treasury yields have moved meaningfully higher, doing some of the Fed’s tightening work for it.”
European equities opened on the backfoot (Eurostoxx 50 -0.2%), perhaps anxious as US-China trade talks start in Beijing. Major bourses are lower on the day whilst Switzerland’s SMI 20 outperforms its peers. Most sectors are in the red with the exception of energy and IT. Logitech (+7.0%) shares soared following earnings, buoying the IT sector along with it. Financials underperform after euro-zone inflation data.
Asian equity markets traded mostly negative following the late US slump on Wednesday, with the Fed seen to remain firmly on track for a June hike. Nonetheless, ASX 200 (+0.9%) was the regional outperformer and gained across all sectors with miners underpinned amid upside in metals, while NAB was among the laggards after a decline in H1 cash profit. Elsewhere, Shanghai Comp. (-0.2%) and Hang Seng (-1.7%) declined after a daily net liquidity drain by the PBoC and amid trade concerns ahead of talks between US and China, with tech and telecoms related stocks pressured after reports the US is considering equipment sales restrictions on Chinese telecom firms over national security concerns. As a reminder, Japan is shut for the remainder of the week.
Of note, the Hang Seng China gauge dropped as much as 2.2% ahead of trade talks between U.S. and China which begin later on Thursday, and dragged the MSCI Asia Pacific lower by 0.2%.
“When you think about the things that have been weighing on the market — the potential for trade war with China, Nafta breaking up, rising rates and of course the potential rolling over in growth — I think the one that is really weighing the most heavily is trade and that’s why the market tends to swing the most violently on every new piece of news,” RiverFront Investment Group Chairman Michael Jones told Bloomberg TV.
Meanwhile, as TSY yields slumped overnight, the USD predictably weakened across the board, undoing some of yesterday’s post-FOMC spike: the Bloomberg dollar index fell for first time in four sessions.

Elsewhere, in FX, the pound erased an earlier advance after U.K. services data undershot forecasts, before fading the move to claw back a 0.2% gain; while the euro pared gains after the euro-area CPI estimate for April came in below the median forecast, it was still higher for the first time in four days; The TRY spiked to a new record low against the USD after both core and headline CPI surprised to the upside with the backdrop of Erdogan’s increasing pressure against higher rates. NOK stronger as Norges Bank does not hint at any dovish changes to rate path. The AUD was the best performing G-10 currency after a larger-than-expected trade surplus.
Notably, the onshore yuan extended its biggest decline in two months as the abovementioned trade talks between China and U.S. begin. Consensus expectations are low for any breakthrough, however, with China unlikely to make more concessions.
Treasuries edged higher while emerging-market currencies rebounded from a four-month low; European government bonds all rose following poor Eurozone inflation data, while Australia’s 10-year yield steady at 2.80%.

In commodities, oil prices recovered from yesterday’s post-DoE sell off with prices continuing to factor in the risks surrounding Iranian-US relations with the latest source reports suggesting that US President Trump is reportedly all but decided to end the nuclear agreement with Iran. In other energy newsflow, China’s Sinopec is planning to cut Saudi crude oil loadings by 40% in June for a 2nd month on high prices; according to a UNIPEC official. In the metals scope, spot gold is sitting in modest positive territory following yesterday’s FOMC release and a slightly softer USD. Elsewhere, aluminium prices have risen for the second consecutive session, as attention turns to developments on US-China trade talks being conducted today. Copper was flat overnight with trade contained amid opposing forces of rising metal prices in China during early trade and a broad risk averse tone.
In geopolitical news, Reuters reported that Trump has all but decided to end nuclear agreement with Iran, according to sources which added it is unclear how he will withdraw from the agreement. Meanwhile, the WSJ added that the US is said to be considering equipment sales restrictions on Chinese telecom firms over national security concerns. In related news, a Chinese trade official commented that China will not accept pre-conditions in trade discussions and that China is more prepared than the US to cope with a trade war.
In central bank news, Norges Bank Interest Rate Decision 0.50% vs. Exp. 0.50% (Prev. 0.50%). Comments stated that outlook and balance of risks have not changed substantially, inflation is below target, as such policy rate will be raised after summer 2018. Krone is weaker than expected as measured by the import weighted exchange rate. There was little new information about growth in the Norwegian economy. Riksbank’s Jansson said that there is a limit for how expansionary policy can be, but haven’t reached there yet, hopes next step will be tightening of policy; Riksbank’s Skingsley not at the point where rate hikes can begin; Riksbank Governor Ingves says the rate path is a forecast, not a promise.
Today’s busy calendar includes data on jobless claims, trade balance and factory orders. DowDuPont, Bombardier, Cigna and Ferrari are among companies reporting earnings
Bulletin Headline Summary from RanSquawk:
- Norges Bank maintains post-summer hike guidance, Riksbank sticks to end of year
- UK Services PMI and Eurozone CPI miss expectations
- Looking ahead, highlights include US trade, weekly jobs, ISM non-mfg, factory orders, a slew of speakers and earnings
Market Wrap
- S&P 500 futures up 0.2% to 2,633.50
- STOXX Europe 600 down 0.2% to 386.55
- MSCI Asia Pacific down 0.2% to 172.83
- MSCI Asia Pacific ex Japan down 0.5% to 563.89
- Nikkei down 0.2% to 22,472.78
- Topix down 0.2% to 1,771.52
- Hang Seng Index down 1.3% to 30,313.37
- Shanghai Composite up 0.6% to 3,100.86
- Sensex down 0.05% to 35,159.39
- Australia S&P/ASX 200 up 0.8% to 6,098.28
- Kospi down 0.7% to 2,487.25
- German 10Y yield rose 0.2 bps to 0.583%
- Euro up 0.4% to $1.2002
- Italian 10Y yield rose 0.5 bps to 1.535%
- Spanish 10Y yield fell 0.9 bps to 1.302%
- Brent futures up 0.2% to $73.52/bbl
- Gold spot up 0.6% to $1,313.06
- U.S. Dollar Index down 0.1% to 92.40
Top Overnight News from Bloomberg
- The dollar fell after the Federal Reserve seemed less hawkish than some had positioned for; the Bloomberg Dollar Spot Index slipped for the first time in four days; 10-year Treasuries rose for the first time in three days
- The greenback weakened against all its G-10 peers; Norway’s krone saw the biggest advance Thursday after the Norges Bank reiterated that it could lift interest rates after the summer
- The pound erased an earlier advance after U.K. services data undershot forecasts, before fading the move to claw back a 0.2% gain; while the euro pared gains after the euro-area CPI estimate for April came in below the median forecast, it was still higher for the first time in four days
- Stocks in Europe followed Asian peers lower as investors began to switch their attention away from the Fed and back to earnings and the outlook for global trade ahead of talks between Chinese and U.S. officials
- China won’t succumb to “threats” from the U.S., a senior government official said, hours before talks are to begin Thursday with a delegation of the Trump administration’s top trade policy officials
- Federal Reserve officials made doubly sure to convey a relaxed attitude toward inflation rising above 2%, mentioning the “symmetric” nature of their target twice in a statement Wednesday that signaled no intention to accelerate a gradual tightening of monetary policy
- The U.S. Treasury announced it will lift long-term debt sales by $73b this quarter
- If billionaire bond investor Bill Gross is right, most of this year’s excitement in the Treasury market is done and yields won’t see a substantial move from here
- Theresa May is facing a crisis after pro-Brexit ministers paired up with Conservative hardliners to demand a clean break from the European Union’s customs system
- Eurozone Apr. CPI Estimate y/y: 1.2% vs 1.3% est; Core CPI 0.7% vs 0.9% est; Services CPI 1.0% vs 1.5% prev.
- U.K. Apr. Services PMI: 52.8 vs 53.5 est; Markit note the underlying performance of the economy has continued to deteriorate
- Norges Bank holds rates at 0.50% as expected; says upturn in the economy appears to be continuing broadly in line with the March policy report
- Turkey Apr. CPI y/y: 10.9% vs 10.5% est; Core CPI 12.2% vs11.5% est
European equities opened on the backfoot (Eurostoxx 50 -0.2%) as US-Sino trade talks start in Beijing. Major bourses are lower on the day whilst Switzerland’s SMI 20 outperforms its peers. Most sectors are in the red with the exception of energy and IT. Logitech (+7.0%) shares soared following earnings, buoying the IT sector along with it. Glencore (+1.1%) is at the top of the FTSE following pleasing production numbers. Other individual movers post-earnings include: Veolia (+2.5%), Gerberit (+3.1%), Infineon (+0.9%), Vonovia (-1.4%) and Smith & Nephew (-6.0%).
Top European News
- U.K. Services Disappoint as Economy Stays Stuck in Slow Lane
- Norway Sticks to Tightening Plan as Rate Held at Record Low
- Danske Bank Is Slammed by Regulator in Money Laundering Probe
- Starwood Capital Sells $1.1 Billion Portfolio of U.K. Hotels
Asian equity markets traded mostly negative following the weakness on Wall St post-FOMC, with the Fed seen to remain firmly on track for a June hike. Nonetheless, ASX 200 (+0.9%) was the regional outperformer and gained across all sectors with miners underpinned amid upside in metals, while NAB was among the laggards after a decline in H1 cash profit. Elsewhere, Shanghai Comp. (-0.2%) and Hang Seng (-1.7%) declined after a daily net liquidity drain by the PBoC and amid trade concerns ahead of talks between US and China, with tech and telecoms related stocks pressured after reports the US is considering equipment sales restrictions on Chinese telecom firms over national security concerns. As a reminder, Japan is shut for the remainder of the week. US is said to be considering equipment sales restrictions on Chinese telecom firms over national security concerns. In related news, a Chinese trade official commented that China will not accept pre-conditions in trade discussions and that China is more
prepared than the US to cope with a trade war.
Top Asian News
- Mahathir Probed Under Malaysia Fake News Law for Sabotage Claim
- Fed Adds to List of Reasons Why Asia Stock Investors Are Jittery
- Little Known China Biotech Firm Lures Top Global Stock Fund
- Turkish Investors Get Reality Check After Inflation Accelerates
In FX, it has been very choppy trade for the DXY in the FOMC aftermath, but ultimately the index has pulled back from fresh 2018 highs around 92.830 made in the run-up to circa 92.500. To recap, the Fed’s latest assessment acknowledged inflation rising to within a whisker of its target rate, but was less upbeat on the pace of economic activity and unexpectedly added a degree of flexibility around the 2% price mandate, which has been perceived dovishly. CAD: Another beneficiary of the broad Greenback downturn amidst rebounding oil prices and looking ahead to Canadian trade data that is expected to reveal a narrower deficit. Usd/Cad is back down in the low 1.2800 area and eyeing residual bids from 1.2820-00 that were not quite filled recently. EUR/GBP: Both movers on independent factors, as Eur/Usd revisited sub-1.1950 lows on the back of weaker than consensus Eurozone CPI and Cable retreated from 1.3600+ again in wake of the UK services PMI miss that has dragged BoE hike expectations for next week down to single digits from almost odd-on this time last month. Tech supports eyed in Eur/Usd still the major 1.1936 Fib and for Cable 1.3550. NOK/SEK: Contrasting fortunes for the 2 Scandi Crowns as the Nok is underpinned by the Norges Bank reaffirming intentions to hike ‘after Summer’ this year, but the Riksbank reiterates no tightening until the end of 2018. However, Eur/Nok and Eur/Sek are both softer on a weaker single currency
In commodities, oil prices have recovered from yesterday’s post-DoE sell off with prices continuing to factor in the risks surrounding Iranian-US relations with the latest source reports suggesting that US President Trump is reportedly all but decided to end the nuclear agreement with Iran. In other energy newsflow, China’s Sinopec is planning to cut Saudi crude oil loadings by 40% in June for a 2nd month on high prices; according to a UNIPEC official. In the metals scope, spot gold is sitting in modest positive territory following yesterday’s FOMC release and a slightly softer USD. Elsewhere, aluminium prices have risen for the second consecutive session, as attention turns to developments on US-China trade talks being conducted today. Copper was flat overnight with trade contained amid opposing forces of rising metal prices in China during early trade and a broad risk averse tone.
Looking at the day ahead, the April CPI report and March PPI for the Euro area will be out while the latest European Commission forecast updates will be released. For core CPI, consensus expects a +0.9% yoy print after holding at +1.0% yoy for the last 3 months (headline CPI 1.3% yoy expected). The final April services and composite PMIs in the UK will also be out in the morning. In the US preliminary Q1 nonfarm productivity and unit labour costs data are due, along with the March trade balance print, April ISM non-manufacturing, weekly initial jobless claims, March factory orders and the final March durable and capital goods orders data. Away from the data, the ECB’s Villeroy, Praet, Constancio and Coeure are due to speak.
US Event Calendar
- 7:30am: Challenger Job Cuts YoY, prior 39.4%
- 8:30am: Nonfarm Productivity, est. 0.9%, prior 0.0%; Unit Labor Costs, est. 3.0%, prior 2.5%
- 8:30am: Initial Jobless Claims, est. 225,000, prior 209,000; Continuing Claims, est. 1.84m, prior 1.84m
- 8:30am: Trade Balance, est. $50.0b deficit, prior $57.6b deficit
- 9:45am: Bloomberg Consumer Comfort, prior 57.5
- 9:45am: Markit US Services PMI, est. 54.5, prior 54.4; Markit US Composite PMI, prior 54.8
- 10am: ISM Non-Manf. Composite, est. 58, prior 58.8
- 10am: Durable Goods Orders, prior 2.6%; Durables Ex Transportation, prior 0.0%
- 10am: Cap Goods Orders Nondef Ex Air, prior -0.1%; Cap Goods Ship Nondef Ex Air, prior -0.7%
- 10am: Factory Orders, est. 1.4%, prior 1.2%; Factory Orders Ex Trans, prior 0.1%
DB’s Jim Reid concludes the overnight wrap
After the football last night Jim is too emotionally drained to contribute today as Liverpool did their best to avoid making the final of the Champions League. However they just about got there and I think he’ll be busy dusting off his rolodex for clients in Kiev later today.
Unlike the football, it wasn’t quite so easy to get excited about last night’s Fed meeting but there were still one or two interesting statement changes to highlight. Our US economists believe that the statement moved incrementally in a more hawkish direction and also towards brevity. In their view, it recognized that inflation has moved close to and is expected to continue to run near the Committee’s 2% objective. As expected, it also emphasized that the 2% objective is a “symmetric” one, allowing for some overshoot as well as undershoot of inflation – a modestly dovish modification in their view. They also note that having just about reached the inflation objective, they dropped the need to continue monitoring inflation developments closely – a hawkish innovation.
Meanwhile, with inflation about on target and with risks to the Fed’s labour market objective running to the upside with the unemployment rate seen as low and the labour market expected to “remain strong”, one interesting point that our economists made in their note (link) yesterday was that they believe a change in the balance of risks language is coming, possibly as soon as June when the Chair will have an opportunity to explain things. In a nutshell our colleagues expect to learn from the minutes to this meeting, as well as upcoming Fedspeak, that should point to a more hawkish stance of policy at the June meeting, absent any unexpected events before then.
For markets, while moves were fairly modest, they did seem to interpret the statement as overall leaning very slightly more dovish. Perhaps that reflected the removal of the sentence “the economic outlook has strengthened in recent months” however we tend to agree with our economists in that this line was just removed simply as an acknowledgment of soft Q1 growth, which was widely anticipated. In any case, Treasury yields closed off their intraday highs with 2y yields finishing at 2.489% after trading as high as 2.517% while 10y yields ended broadly unchanged at 2.967% after being at 2.994%. The 2s10s curve finished at 48bps and nearly 2bps steeper on the day. It’s worth noting that June is 97% priced in for a hike now – which is little changed compared to the day prior.
The big mover in markets yesterday was the Greenback however. The Dollar index was initially strong leading into the Fed, however proceeded to fall -0.47% after the statement was released, but then rallied +0.66% off the lows into the close. EM currencies appeared to be on the receiving end of that with the Colombian Peso, Brazilian Real, Russian Ruble, Turkish Lira and Argentine Peso down between 1% and 3%. Some headlines about the US potentially increasing sanctions on Russia didn’t seem to help the Ruble weakness in particular. In any case the rally for the US Dollar did appear to weight on US equity markets with the S&P 500 and Dow both closing -0.72% despite Apple doing its best to lead markets higher post results.
This morning in Asia, market are broadly lower with the Hang Seng in particular down -1.66%, weighted down by tech and financials stocks, while the Nikkei (-0.16%), Kospi (-0.38%) and Shanghai Comp (-0.16%) have also trended lower. Ahead of today’s China/US trade talks today, Bloomberg cited unnamed Chinese government officials indicating that Beijing will not agree to preconditions that include abandoning its advanced manufacturing program and cut the trade gap by a fixed amount.
Moving on. While monetary policy came under review, there was also some focus on the fiscal side of things yesterday too with the US Treasury quarterly refunding announcement, however there were no great surprises with a $1bn increase to all maturities which was roughly in line with expectations, representing an additional $27bn of new issuance for the upcoming quarter.
Away from the Fed, earlier in the day the focus was on some of the data in Europe. Particularly in the spotlight was a first look at the Q1 GDP print for the Euro area however there were no real surprises with the +0.4% qoq/+2.5% yoy print coming in bang in line with expectations. The Q4 2017 reading was also revised up a tenth to +0.7% qoq. While Q1 was the slowest QoQ rate of growth in the Euro area since Q3 2016, it’s interesting to note that this is the first time ever that Europe has outpaced the UK for 5 consecutive quarters. Keep in mind that the UK outpaced Europe, with the exception of one flat quarter, for 15 quarters in a row between Q2 2011 and Q4 2014.
Meanwhile, just before that we had the final April manufacturing PMIs in Europe. The final Euro area reading was revised up 0.2pts from the flash estimate to 56.2. While that represents the fourth consecutive monthly decline, the rate of decline in April at just 0.4pts is a lot more moderate than the 1-2pt declines in the first 3 months of this year. The upward revision for April appeared to be due to a combination of a slightly stronger picture in France (+0.4pts to 53.8) and the noncore countries performing marginally better than implied. One exception was Italy which fell 1.6pts and more than expected to 53.5 (vs. 54.5 expected), marking a 15-month low. We should note that the new orders series for the Euro area fell 1pt albeit to a still solid 54.5 – but the lowest since November 2016. Italy’s new order series fell a more significant 3.2pts to 52.2 and is now down 9.1pts from the January high. So the fragility still appears to lie with Italy. European equity markets returned from Monday’s holiday in a positive mood with the Stoxx 600 finishing +0.63% and DAX closing at a fresh three-month high (+1.51%), albeit helped by a weaker Euro.
In other news, as far as the daily Brexit update is concerned, much of the focus was on the headlines from the night prior concerning the ‘rebellion’ being staged by Brexiteers in the cabinet over the customs union. Some reports suggested that Davis and Fox were willing to resign over May’s option preference for the union. Staying with the UK, it’s worth noting that there was rare good news to come from the construction PMI data which rose 5.5pts to 52.5 in April, with a big rise in housing activity the main driver. Sterling pared early gains by the close (-0.28%) as a result of broad Dollar strength however 10y Gilt yields were 5.2bps higher at 1.455%.
In terms of the remaining data, ahead of payrolls on Friday in the US the ADP moderated mom, but was above expectations at 204k (vs. 198k expected) and so remains solid at a three-month annualised rate of 224k. The Eurozone’s March unemployment rate was steady and in-line at 8.5% while Italy was slightly higher than expected at 11.0% (vs. 10.9% expected).
Looking at the day ahead, the April CPI report and March PPI for the Euro area will be out while the latest European Commission forecast updates will be released. For core CPI, consensus expects a +0.9% yoy print after holding at +1.0% yoy for the last 3 months (headline CPI 1.3% yoy expected). The final April services and composite PMIs in the UK will also be out in the morning. In the US preliminary Q1 nonfarm productivity and unit labour costs data are due, along with the March trade balance print, April ISM non-manufacturing, weekly initial jobless claims, March factory orders and the final March durable and capital goods orders data. Away from the data, the ECB’s Villeroy, Praet, Constancio and Coeure are due to speak.
3. ASIAN AFFAIRS
i)THURSDAY MORNING/WEDNESDAY NIGHT: Shanghai closed UP 19.68 points or .64% /Hang Sang CLOSED down 410.51 points or 1.34% / The Nikkei closed HOLIDAY /Australia’s all ordinaires CLOSED UP .82% /Chinese yuan (ONSHORE) closed UP at 6.3482/Oil DOWN to 67.91 dollars per barrel for WTI and 72.95 for Brent. Stocks in Europe OPENED DEEPLY IN THE RED. ONSHORE YUAN CLOSED UP AT 6.3482 AGAINST THE DOLLAR. OFFSHORE YUAN CLOSED UP ON THE DOLLAR AT 6.3514/ONSHORE YUAN TRADING WEAKER AGAINST OFFSHORE YUAN/ONSHORE YUAN TRADING STRONGER AGAINST USA DOLLAR/OFFSHORE YUAN TRADING STRONGER AGAINST THE DOLLAR /CHINA RETALIATES WITH TARIFFS/ TRUMP RESPONDS TO NEW TARIFFS AND IT NOW LOOKS LIKE A FULL TRADE WAR IS BEGINNING/
3 a NORTH KOREA/USA
North Korea/South Korea/usa
North Korea releases 3 USA prisoners
(courtesy zerohedge)
North Korea Releases US Prisoners Ahead Of Historic Trump Summit
North Korea has released three U.S. citizens from years-long detentions in a suspected labor camp, giving them medical treatment and “ideological education” at a hotel near Pyongyang, says human rights advocate Choi Sung-ryong, as reported by the Financial Times.
Choi Sung-ryong, a representative of the families of the prisoners, told South Korean news outlet Naver: “We talked with a source in North Korea today. North Korean authorities released Kim Dong-cheol, Kim Sang-deok and Kim Hak-seong, who were in jail at the labor correction center in early April, and they are currently in a ‘course’ where they are treated and educated at a hotel outside Pyongyang.” –IB Times
“We heard it through our sources in North Korea late last month. We believe that Mr Trump can take them back on the day of the US-North Korea summit or he can send an envoy to take them back to the US before the summit,” said Mr Choi.
Among the three detainees, Kim Dong-cheol, a South Korean-born American pastor, was arrested by North Korea in 2015 on charges of spying and sentenced in 2016 to 10 years of hard labour. Kim Hak-seong and Kim Sang-deok, both working for Pyongyang University of Science and Technology, were detained last year on suspicion of “hostile acts”. –FT
Newly minted National Security Advisor John R. Bolton told Fox News on Sunday “If North Korea releases the detained Americans before the North-US summit, it will be an opportunity to demonstrate their authenticity.”
Secretary of State Mike Pompeo is believed to have discussed the release of the three Americans during his clandestine meeting in Pyongyang with the North Korean leader over Easter Weekend – while President Trump confirmed last week that the two countries had been negotiating for their release.

Those watching North Korea say Pyongyang has been very careful to monitor the American detainees’ health following the mysterious death of US university student Otto Warmbier – who died six days after he was released by North Korea last June.
“Otto was taken hostage, kept as a prisoner for political purposes, used as a pawn and singled out for exceptionally harsh and brutal treatment by Kim Jong Un,” his father said in a press conference held one day before North and South Korea held their historic summit.

The Warmbier family is currently suing North Korea over the death of Otto, who “suffered extensive brain damage following interrupted blood flow and a lack of oxygen,” according to the coroner who examined his body.
North Korean officials said Mr. Warmbier’s condition was caused by sleeping pills and botulism, a diagnosis that medical experts doubted. He died six days later at the University of Cincinnati Medical Center.
M.R.I. scans were done at the medical center after he arrived, which also performed a whole-body CT scan after Mr. Warmbier’s death.
The images clearly showed that his brain had been starved of oxygen and that large tracts of cells had died, Dr. Sammarco said. The medical diagnosis is anoxic-ischemic encephalopathy.
His parents requested that a full autopsy not be performed. On Tuesday, during an appearance on the television show “Fox & Friends,” Fred Warmbier said that his son had been “tortured” and described North Korean officials as “terrorists.” –New York Times
The two Koreas reaffirmed an agreement to denuclearize the peninsula, pledging to declare an official end to the Korean war. FT reports that South Korea’s presidential advisor, Moon Chung-in said on Monday that it would be “difficult to justify the presence of 28,500 US troops in South Korea, if a peace treaty was signed,” however President Moon Jae-in dismissed Chung-in’s views the next day.
“US troops stationed in South Korea are an issue regarding the alliance between South Korea and the US. It has nothing to do with signing a peace treaty,” his spokesman Kim Eui-keyom quoted the president as saying. (FT)
3 b JAPAN AFFAIRS
end
c) REPORT ON CHINA/HONG KONG
China Accused Of Using High-Powered Lasers To Harass US Fighter Jets Over Djibouti
Less than a year after China deployed troops to its first overseas base in Djibouti, near the Horn of Africa, located next to the key oil transit chokepoint, the Bab el-Mandeb strait, the US military has warned fighter jet pilots to beware of laser attacks near China’s military base amid what the SCMP said were “increasing signs of friction between the two armed forces in the Horn of Africa.”
According to the WSJ, the Pentagon issued a Notice to Airmen, later reproduced on the US Federal Aviation Administration’s website, that there had been multiple events “involving a high-power laser” just 750 metres (2,400ft) from China’s base in Djibouti.

“Use extreme caution when transiting near this area,” the notice cautioned.
Quoted by the WSJ, Maj. Sheryll Klinkel, a Pentagon spokeswoman, said “the U.S. has notified airmen to exercise caution when flying in certain areas in Djibouti” adding “this notice was issued due to lasers being directed at U.S. aircraft on a small number of separate occasions over the last few weeks.”
“Lasers pointed at aircraft have the potential to cause serious harm to the aircrew and the surrounding area,” she said.
According to a report in Jane’s Defence Weekly last month, multiple intelligence sources reported the Chinese garrison in Djibouti is suspected of operating a high-power laser weapon to temporarily blind pilots at the base or on a ship offshore.
However, according to SCMP, Chinese military observers said the lasers might have been used to scare off birds near the airfield or disrupt possible spy drones, rather than targeting foreign US pilots. They also pointed out that China is a signatory to the Protocol on Blinding Laser Weapons, which bans the use of lasers that cause permanent blindness.
Which, of course, would never stop China from attempting precisely that.
“The Chinese and US bases in Djibouti are really close, so one could disturb the other if the two sides don’t have a proper communication mechanism,” said Zhou Chenming, a Beijing-based military analyst was quoted by the Hong Kong publication. Zhou noted that China has already publicly demonstrated its use of laser weapons against drones at air exhibitions.

Some experts said the use of the laser amounted to the kind of aggression the Chinese have displayed on other occasions.
In 2014 over the South China Sea, a Chinese jet fighter pilot, conducted so-called barrel rolls around an American P-8 surveillance jet. That incident led the U.S. to lodge a formal diplomatic complaint with Chinese officials and the pilot was ultimately removed from the unit, according to American officials at the time. China’s Defense Ministry publicly dismissed the U.S. complaint as groundless at the time.
* * *
As we reported last year, the Chinese military base in Djibouti is just a few miles northwest of Camp Lemonnier, the only permanent US military base in Africa and home to 4,000 US military personnel.
Camp Lemonnier was established after the 9/11 attacks, and is mainly used as a counterterrorism hub in the region. A 2013 Washington Post report said the Djibouti government had forced it to stop drone flights – which numbered up to 16 a day – from the base due to safety fears and relocate its unmanned spy aircraft to a more remote location.
With the US increasingly viewing China as a strategic superpower rival, the peculiar proximity of the two bases in Djibouti means the two sides will be involved in a “quiet contest” to gather information about each other, according to Ni Lexiong, a Shanghai-based military expert, although neither side “would announce this openly”.
Work began on the 36-hectare Chinese base in 2016, which was to be used a logistics hub to resupply vessels taking part in peacekeeping and humanitarian missions off the coasts of Yemen and Somalia. Weeks after the base opened at the start of August 1 the troops based there started live-fire drills.
Djibouti sits in a vital strategic location, right off the Bab el-Mandeb and close to the Suez Canal, one of the world’s busiest shipping routes, and offers troops stationed there easy access to trouble spots such as Sudan, Somalia and Yemen and could provide a base for aerial missions over Iraq and Syria.

The government has been happy to provide facilities for other countries’ armed forces, and France, Spain and Japan all have opened facilities there.
In 2016 Japan announced that it would increase the size of its base following the announcement that Chinese was planning to open its own facility there.
That year a Japanese warship was reported by Chinese state media to have dispatched frogmen to collect information on Chinese vessels that had docked nearby before they were driven away by “strong lights” and verbal warnings. The Japanese side denied the claims, saying the divers were checking their own ships.
4. EUROPEAN AFFAIRS
5. RUSSIAN AND MIDDLE EASTERN AFFAIRS
A super commentary from Tom Luongo on how Russia will prevail despite everything thrown at them including the kitchen sink
(courtesy Tom Luongo)
Are Russian Bonds Toxic Waste Or Golden Eggs?
One man’s toxic waste is another man’s golden goose. A new round of economic sanctions imposed on Russia last month by the U.S. is creating havoc in investment circles.A recent article by Ben Aris at Russia Insider describes Russian debt assets as ‘toxic waste again.’
That doesn’t mean these Russian debt assets actually are bad investments, just that those who currently hold them have to get rid of them because the rules have changed.
And they are no longer legally allowed to own them.
Because of that what were one minute the darling of the investment world instantly turned into garbage, selling if anyone can find a buyer at discounts even Crazy Eddie would blanche at.
All the previous sanctions imposed on Russian companies had only affected new securities – listings of new shares or bonds. Existing securities were unaffected.
Not now. The Specially Designated Nationals And Blocked Persons List (SDN List) released on April 6 not only sanctions those listed, it bans any investor with US exposure (European banks with US branches count) from doing any business with the sanctioned names. Investors were supposed sell all their stocks, bonds and debt within 30 days – i.e. before May 7.
This has sent the market for Russian securities into the floor.
Criminal Idiocracy
Politicians are a stupid and cowardly lot. Batman had it right, because they are, in fact, criminals.
For their own purposes they pass laws which force losses onto those who did nothing wrong, in this case those who purchased Russian corporate and sovereign debt in European markets over the past few years.
It’s theft, pure and simple. Those having to sell these securities to get into compliance will face horrific losses, 70 to 80 cents on the dollar, in some cases.
Overnight, a healthy and prosperous market became a desert of the real all because John McCain’s nose was out of joint over being outmaneuvered in Crimea a few years ago?
And Donald Trump is too cowardly to say no to this insanity?
If I was a truly cynical man I would venture that ex-Goldmanite Steve Mnuchin engineered this so his buddies could play Johnny Bench at their bond desks in Hong Kong picking these things up for pennies. That would be crude wouldn’t it?
Crude but certainly plausible.
Russia is harmed by this. Coupon payments have to be made in the currency of the debt. The push here thanks to these sanctions is to limit Russian companies’ access to euros, in the same way that crashing the ruble and oil markets in 2014 was designed to starve Russia of dollars, forcing the bonds to be settled as they mature versus being rolled over because the companies had lost access to U.S. dollar funding.
Since that time the Russians have switched to euros, Chinese yuan and rubles. But, with the bank of Russia keeping interest rates too high, there is little appetite for issuing ruble-denominated debt, when the euro markets offer far better rates.
This is the same thinking that trapped Russian corporates in 2014. Blame can be laid at the feet of both parties, the companies looking for the lowest cost of capital and the central bank slow-playing the recovery of the Russian economy through overly-high interest rates.
It is a situation like this that fuels the notions that the Bank of Russia still works for the West rather than Russia herself. Personally, I’ve been screaming at BoR President Elvira Nabullina to lower borrowing rates faster for more than a year now.
While both consumer and business lending are growing finally, the BoR is still encouraging Russian companies to seek out loans denominated in anything other than Rubles at a time when the avowed policy of the Russian government is to de-dollarize as much as possible.
In other words, the high interest rate policy is encouraging the very behavior the BoR says it is trying to fight, by inviting foreign capital into Russia only to see it fly out in the event of a new attack by the U.S. on its banking system.
Foreign ownership of Russian bonds is now 30% versus just 5% at the start of the year, thanks to high interest rate arbitrage.
Such that now there is more than $176 billion dollars in euro-denominated debt which has to be serviced.
These bonds have to be sold to new investors, harming them, which Mnuchin, Trump and the rest of the bozos in Washington could care less about.
Next Stop: City of London
Then the next step will be to cut Russian companies out of the European banking system. The Gypsum Lady, U.K. Prime Minister Theresa May, has all but made that threat in the wake of Skripal-Gate, but it has not been revisited.
It’s likely because she knows she can’t do that until the markets for Russian securities are clear and London bond traders have figured things out. Even Mnuchin, as Mr. Aris, pointed out, had to back off to allow the market time to get in compliance.
In March, the ECB seized Latvian Bank ABLV to remove an avenue in which Russian businesses can bank within the EU. Again, so much of this is about getting Russia and Gazprom to stop building the Nordstream 2 pipeline as well as repudiate its relationship with Iran.
But, it simply won’t work.
Russian President Vladimir Putin and his chief economic advisor Sergei Glazyev have been pounding their shoes on the table to get the ‘oligarchs’ to repatriate their funds and bring their core business practices back to Russia.
The West cannot be trusted. Glazyev, in particular, has been adamant about this to stop the capital flight out of Russia through the banking system.
So, in effect, the U.S. is doing exactly what Putin wants done, bring the capital home. He’ll give them tax breaks, similar to what Trump did for U.S. corporates in his tax bill.
Between making ownership of the bonds illegal it also puts upward pressure on the ruble in forex markets as companies now have to scramble to raise euros to service the debt.
It’s a mess. But, it’s a mess that can be handled because Russia isn’t alone in the world anymore. Today, unlike late 2014, it has a much better and deeper relationship with China to get the right currency into the right hands at the right time.

It was the opening up of ruble/yuan swap lines in December 2014 that stabilized the Russian equity markets and ensured that the worst of the ruble crisis was over. Today, with a similar market dislocation attempt by the U.S. the ruble has pushed up a few points, but nothing potentially catastrophic.
The Rush to Nowhere
The urgency with which all of these false flags, hybrid and physical war actions, etc. that the U.S., the U.K., Israel and Saudi Arabia are occurring tells me that time is running out to stick this landing and get the desired result – regime change in Iran and Russian submission to U.S. hegemony.
The problem with tactics like this is simply that if they don’t work, if the target doesn’t collapse then you’ve got nothing left to him them with. And, like Ali versus George Foreman, the counter-attack will be a knockout.
The bottom line is that because Russia is in such a good financial position — low Debt to GDP, growing albeit slowly economy, buoyant oil and natural gas prices, more than ample foreign exchange reserves — investors are lined up deep to get access to their markets and their assets.
In markets, it’s a verity that a big actor can manipulate price in the short term, think stock buybacks for example, but they cannot overwhelm the primary trend. A decade of QE can’t raise the price of worthless mortgage-backed securities.
If you believe that’s possible then you don’t believe in the power of markets, the power of people acting in the aggregate over the actions of the very few acting in concert.
The demand for Russian assets was there in 2017. Despite the best laid plans of Washington and Downing St. that demand is still there and it will ensure that Russia will not be locked out of capital markets in the future.
Dollar and euro markets are gone. They will figure something out with China. People are clever. Russians especially so. They will always find a way to get around the diktats of a would-be Emperor.
N.B. – Thanks to Trauma2000 at the Russia Insider forums for spurring me to answer Mr.Aris’ article.
* * *
To support work like this as well as find out ways to crisis-proof your portfolio in times of geopolitical unrest, join my Patreon and subscribe to the Gold Goats ‘n Guns Investment Newsletter for just $12/month.
6 .GLOBAL ISSUES
Argentina
The Argentinian Peso continues to collapse despite a 2nd 300 basis rate hike this week. It is the worst currency of them all and there is a high risk that this nation goes into hyperinflation shortly
(courtesy zerohedge)
Argentine Peso Continues To Collapse Despite 2nd 300bps Rate-Hike In A Week
For the second time in a week, Argentina’s Central Bank has hiked its key rate 300bps today (300bps on 4/27) to 33.25% for 7-Day repo in an attempt to stall the currency’s freefall… for now it’s not working!

Today’s actions follows yesterday’s collapse, as we detailed here, as Morgan Stanley analysts led by Fernando Sedano wrote in note:
“Both domestic and external factors are likely to test Argentine assets again, keeping volatility and risk premia high,”
“Because Argentina has used almost two-thirds of the FX reserves acquired this year, we think any eventual FX volatility may have to dealt with via further hikes”
Additionaly, Nomura said in a note yesterday that:
“traders will need further signs from the Macri administration and from the central bank that there’s commitment to lowering inflation and narrowing the deficit…
it’s important officials aren’t tempted with pro-growth policies like in December/January. “
And, despite the rate-hike today – seemingly reaffirming this commitment to battle a plunge into hyperinflation, as Bloomberg reports today, Argentina’s central bank (BCRA) seems cornered between a rush for dollars and a fragile economy, as spot sales and surprise rate hikes fail to arrest the peso’s depreciation and may lead officials to eye a different angle.
“Eventually, the central bank might decide to intervene in the onshore NDF (Rofex) as well,” said Daniel Chodos, a strategist at Credit Suisse in Buenos Aires.
Critically, Chodos says that such a move would undermine credibility, given that a free market was one of the main planks of Macri’s government.
“The BCRA can combine all its instruments to stabilize the exchange rate market, but it is appropriate that it does not lean too much against external volatility,” Mauro Roca, managing director for emerging markets sovereign research at TCW Group in Los Angeles, said yesterday.
The problem, as Bloomberg notes, is that BCRA no longer fighting against global trend.
The Argentine Peso is the worst EMFX currency today by a significant distance.

end
CANADA
Funny story: you do not know whether to cry or laugh but Trudeau now blames our illegal immigration problem on the uSA
(courtesy Mac Slavo./SHFTPlan.com)
Canada Blames Their Illegal Immigration Problem On The US

Canadian Prime Minister Justin Trudeau has hilariously blamed the United States for Canada’s illegal immigration of asylum seekers. The announcement that the US was to blame provoked a lot of questions for Trudeau in his country’s Parliament yesterday.
Trudeau thinks the US is to blame because Nigerians are requesting and obtaining visitor visas to come to the United States. Once in the US, they are promptly heading to an obscure, unofficial border crossing on the northern end of New York state. Once there, they cross into Canada illegally and request refugee status.
More than 26,000 asylum seekers have crossed illegally into Canada from the United States to file refugee claims in the past 15 months, walking over ditches and on empty roads along the world’s longest undefended border.
According to Hot Air, up until now, the Canadians have claimed it as a point of pride to quickly accept and resettle the new arrivals while bashing President Donald Trump for his “immigrant unfriendly” policies. But now Canada is running out of room and resources to take them all in and the Prime Minister would like the US to do a better job of screening them.
Of course, once Trudeau announced that he was blaming the US and their visitor visas for his problems, it provoked a lot of questions for Trudeau in his country’s Parliament yesterday. People were demanding answers as to how the situation has gotten so far out of hand and what Trudeau planned to do about it. All he seemed to have for an answer is that it’s the fault of the United States. There’s currently no plan to solve the problem Trudeau is complaining about.
Trudeau wants the legal authority to turn back thousands of asylum seekers crossing the border illegally. According to Reuters, Canada wants to amend a bilateral agreement to allow it to block border-crossing refugee claimants however, they say that the United States is not cooperating.
Under the Safe Third Country Agreement or STCA, asylum seekers who arrive at a formal Canada-U.S. border crossing going in either direction are turned back and told to apply for asylum in the first country they arrived in. Now Canada wants that agreement rewritten so that it would apply to the entire border, and not just formal border crossings.
The U.S. Department of Homeland Security has said it is reviewing Canada’s proposal but has not made a decision.
Author: Mac Slavo
Views: Read by 594 people
Date: May 3rd, 2018
Website: www.SHTFplan.com
END
7. OIL ISSUES
Saudi Arabia Needs $88 Oil
Authored by Nick Cunningham via OilPrice.com,
Higher oil prices have provided a boost to the economies of oil-exporting nations such as Saudi Arabia. But the economic risks going forward are “skewed to the downside,” the International Monetary Fund said in a new report, in which it urged Saudi Arabia and other oil exporters to press on with reforms.
Oil price volatility, trade tensions, geopolitical risk and a “sharp tightening of global financial conditions” are just a few of the potential pitfalls that lie ahead.

But the IMF paid extra attention to the debt levels of some oil producers. “The tightening of global financial conditions, if interest rates will continue to go up and liquidity will be less available, this will affect countries with a high level of debt — mainly oil importing countries where the average debt exceeds 80 percent (of gross domestic product),” Jihad Azour, director of the Middle East and Central Asia Department at the International Monetary Fund, told CNBC on Monday.
“Last but not least, some countries have succeeded in implementing reforms but what is important is to keep the momentum there and to address some of the structural issues,” Azour said.
He believes that the “region needs to create at least 25 million jobs for the young generation in the next five years”.
The IMF said that Saudi Arabia needs to continue “structural reforms,” largely referring to the Vision 2030 plan spearheaded by crown prince Mohammed bin Salman. New taxes, deficit reduction, labor market reforms and investments in non-oil sectors of the economy are crucial.
While the economies of oil exporters have improved as oil prices have jumped to a three-year high, economic growth “is projected to remain well below its pre-2014 oil shock levels,” the IMF said. High levels of debt will act as a drag on the economy, limiting the extent to which governments can spend to improve short-term demand.
And for Saudi Arabia, oil prices are still too low to fully balance the books. The IMF claims that the Kingdom needs about $88 per barrel to balance its budget, up sharply from $70 per barrel last year. The sudden jump in the fiscal breakeven price is the result of an increase in spending expectations.
Saudi Arabia’s GDP growth rate is expected to rise to 1.7 percent this year, after shrinking by 0.5 percent in 2017. But, as the IMF warns, the improved outlook is largely due to the uptick in government spending. “This expected acceleration in growth is not a free lunch – the government is picking up the bill,” said Ziad Daoud, chief Middle East economist for Bloomberg Economics. “The old model of an economy driven by government spending and financed by oil hasn’t really changed.”
Still, some are unmoved by the IMF’s warnings. Ellen R. Wald, an expert on the Saudi oil sector, wrote in Forbes last year – after a previous warning from the IMF – that the concerns are overblown. Saudi Arabia has plenty of cash reserves, Saudi Aramco has low production costs and the budget deficit has shrunk dramatically, she argued. And in any event, taking on debt is a normal thing that modern countries do.
Moody’s reaffirmed Saudi Arabia’s “A1” credit rating on Wednesday, noting that the economic outlook was “stable.”
While some dismiss the short-term concerns related to the Saudi budget deficit, the IMF’s concerns about diversifying away from oil over the long-term are legitimate.
Saudi officials shrugged off the warnings from the IMF. Saudi Arabia responded to the advice from the IMF by saying that the rise in oil prices won’t change the course that it has charted towards economic diversification. “Higher oil prices will only help reduce the deficit and build reserves, we will continue our reform,” Saudi finance minister Mohammed bin Abdullah Al-Jadaan told CNBC on Wednesday. “I assure you that there is a lot of excitement about reform and when you see results you get more energy to do more because you can see that it’s working and helping the economy,”.
end
8. EMERGING MARKET
Venezuela
end
Your early morning currency/gold and silver pricing/Asian and European bourse movements/ and interest rate settings THURSDAY morning 7:00 am
Euro/USA 1.1978 UP .0028/ REACTING TO MERKEL’S FAILED COALITION/ SPAIN VS CATALONIA/REACTING TO +GERMAN ELECTION WHERE ALT RIGHT PARTY ENTERS THE BUNDESTAG/ huge Deutsche bank problems + USA election:/TRUMP HEALTH CARE DEFEAT//ITALIAN REFERENDUM DEFEAT/AND NOW ECB TAPERING BOND PURCHASES/JAPAN TAPERING BOND PURCHASES /USA FALLING INTEREST RATES AGAIN/HOUSTON FLOODING/EUROPE BOURSES DEEPLY IN THE RED
USA/JAPAN YEN 109.43 DOWN 0.413(Abe’s new negative interest rate (NIRP), a total DISASTER/SIGNALS U TURN WITH INCREASED NEGATIVITY IN NIRP/JAPAN OUT OF WEAPONS TO FIGHT ECONOMIC DISASTER/
GBP/USA 1.3587 UP .0016 (Brexit March 29/ 2017/ARTICLE 50 SIGNED/BREXIT FEES WILL BE CAPPED
USA/CAN 1.2838 DOWN .0046 (CANADA WORRIED ABOUT TRADE WITH THE USA WITH TRUMP ELECTION/ITALIAN EXIT AND GREXIT FROM EU/(TRUMP INITIATES LUMBER TARIFFS ON CANADA/CANADA HAS A HUGE HOUSEHOLD DEBT/GDP PROBLEM)
Early THIS THURSDAY morning in Europe, the Euro ROSE by 28 basis points, trading now ABOVE the important 1.08 level RISING to 1.1978; / Last night Shanghai composite CLOSED UP 19.68 POINTS OR .64% / Hang Sang CLOSED DOWN 410.51 POINTS OR 1.34% /AUSTRALIA CLOSED UP .82% / EUROPEAN BOURSES OPENED RED
The NIKKEI: this THURSDAY morning CLOSED HOLIDAY
Trading from Europe and Asia
1/EUROPE OPENED DEEPLY IN THE RED
2/ CHINESE BOURSES / : Hang Sang CLOSED DOWN 410.51 POINTS OR 1.34% / SHANGHAI CLOSED UP 19.68 POINTS OR .64% /
Australia BOURSE CLOSED UP .82%
Nikkei (Japan) CLOSED HOLIDAY
INDIA’S SENSEX IN THE RED
Gold very early morning trading: 1311.60
silver:$16.47
Early THURSDAY morning USA 10 year bond yield: 2.94% !!! DOWN 3 IN POINTS from WEDNESDAY night in basis points and it is trading WELL ABOVE resistance at 2.27-2.32%. (POLICY FED ERROR)/
The 30 yr bond yield 3.12 DOWN 3 IN BASIS POINTS from WEDNESDAY night. (POLICY FED ERROR)/
USA dollar index early THURSDAY morning: 92.48 DOWN 3 CENT(S) from WEDNESDAY’s close.
This ends early morning numbers THURSDAY MORNING
xxxxxxxxxxxxxxxxxxxxxxxxxxxxxxxxxxxxxxxxxxxxxxxxxxxxxxxxxxxxxxxxxxxxxxxxxxxxxxxxxxxxxxxxxxxxxxxxxxxxxxxxxxxxxxx
And now your closing THURSDAY NUMBERS \1: 00 PM
Portuguese 10 year bond yield: 1.647% DOWN 5 in basis point(s) yield from WEDNESDAY/
JAPANESE BOND YIELD: +.0.045% UP 0 in basis points yield from WEDNESDAY/JAPAN losing control of its yield curve/
SPANISH 10 YR BOND YIELD: 1.254% DOWN 6 IN basis point yield from WEDNESDAY/
ITALIAN 10 YR BOND YIELD: 1.7390 DOWN 6 POINTS in basis point yield from WEDNESDAY/
the Italian 10 yr bond yield is trading 49 points HIGHER than Spain.
GERMAN 10 YR BOND YIELD:FALLS TO +.532% IN BASIS POINTS ON THE DAY
END
xxxxxxxxxxxxxxxxxxxxxxxxxxxxxxxxxxxxxxxxxxxxxxxxxxxxxxxxxxxxxxxxxxxxxxxxxxxxxxxxxxxxxxxxxxxxxxxxxxxxxxxxxxxxxxxxxxxxxxxxxxxxxxxxxxxxx
IMPORTANT CURRENCY CLOSES FOR THURSDAY
Closing currency crosses for THURSDAY night/USA DOLLAR INDEX/USA 10 YR BOND YIELD/1:00 PM
Euro/USA 1.1970 UP .0020(Euro UP 20 Basis points/ represents to DRAGHI A COMPLETE POLICY FAILURE/
USA/Japan: 109.09 DOWN 0.734 Yen UP 73 basis points/
Great Britain/USA 1.3566 DOWN .0005( POUND DOWN 5 BASIS POINTS)
USA/Canada 1.2878 DOWN .0005 Canadian dollar UP 5 Basis points AS OIL ROSE TO $67.73
xxxxxxxxxxxxxxxxxxxxxxxxxxxxxxxxxxxxxxxxxxxxxxxxxxxxxxxxxxxxxxxxxxxxxxxxxxxxxxxx
This afternoon, the Euro was UP 20 to trade at 1.1970
The Yen ROSE to 109.09 for a GAIN of 74 Basis points as NIRP is STILL a big failure for the Japanese central bank/HELICOPTER MONEY IS NOW DELAYED/BANK OF JAPAN NOW WORRIED AS AS THEY ARE RUNNING OUT OF BONDS TO BUY AS BOND YIELDS RISE
The POUND FELL BY 5 basis points, trading at 1.3566/
The Canadian dollar ROSE by 5 basis points to 1.2878/ WITH WTI OIL RISING TO : $67.73
The USA/Yuan closed AT 6.3537
the 10 yr Japanese bond yield closed at +.045% UP 0 IN BASIS POINTS / yield/
Your closing 10 yr USA bond yield DOWN 3 IN basis points from WEDNESDAY at 2.938% //trading well ABOVE the resistance level of 2.27-2.32%) very problematic USA 30 yr bond yield: 3.115 DOWN 2 in basis points on the day /
THE RISE IN BOTH THE 10 YR AND THE 30 YR ARE VERY PROBLEMATIC FOR VALUATIONS
Your closing USA dollar index, 92.57 UP 6 CENT(S) ON THE DAY/1.00 PM/
Your closing bourses for Europe and the Dow along with the USA dollar index closing and interest rates for THURSDAY: 1:00 PM EST
London: CLOSED DOWN 40.51 POINTS OR 0.54%
German Dax :CLOSED DOWN 112.10 POINTS OR .88%
Paris Cac CLOSED DOWN 27.56 POINTS OR .50%
Spain IBEX CLOSED DOWN 50.10 POINTS OR 0.50%
Italian MIB: CLOSED DOWN 201.15 POINTS OR 0.83%
The Dow closed UP 5.17 POINTS OR 0.02%
NASDAQ closed DOWN 12.74 Points OR 0.19% 4.00 PM EST
WTI Oil price; 67.73 1:00 pm;
Brent Oil: 73.30 1:00 EST
USA /RUSSIAN ROUBLE CROSS: 63.44 DOWN 61/100 ROUBLES/DOLLAR (ROUBLE HIGHER BY 61 BASIS PTS)
TODAY THE GERMAN YIELD RISES TO +.532% FOR THE 10 YR BOND 1.00 PM EST EST
END
This ends the stock indices, oil price, currency crosses and interest rate closes for today 4:30 PM
Closing Price for Oil, 4:30 pm/and 10 year USA interest rate:
WTI CRUDE OIL PRICE 4:30 PM:$68.47
BRENT: $73.69
USA 10 YR BOND YIELD: 2.95% THIS RAPID RISE IN YIELD IS ALSO VERY DANGEROUS/RECESSION COMING/DERIVATIVES FRY!!
USA 30 YR BOND YIELD: 3.12%/DEADLY
EURO/USA DOLLAR CROSS: 1.1990 DOWN .0052 (DOWN 40 BASIS POINTS)
USA/JAPANESE YEN:109.18 DOWN 0.654/ YEN UP 65 BASIS POINTS/ .
USA DOLLAR INDEX: 92.42 DOWN 9 cent(s)/dangerous as the lower the dollar the higher the inflation.
The British pound at 5 pm: Great Britain Pound/USA: 1.3575: UP 0.0002 (FROM YESTERDAY NIGHT UP 2 POINTS)
Canadian dollar: 1.2849 UP 35 BASIS pts
German 10 yr bond yield at 5 pm: +0.532%
VOLATILITY INDEX: 15.90 CLOSED DOWN 7 ??
LIBOR 3 MONTH DURATION: 2.363% .
And now your more important USA stories which will influence the price of gold/silver
TRADING IN GRAPH FORM FOR THE DAY
END
Two big stories last night: First Giuliani states that Trump reimbursed Cohen for the Stormy Daniels hush money;
(courtesy zerohedge)
Giuliani Says Trump Reimbursed Cohen For Stormy Daniels Hush Payment
In a Wednesday statement which promises to keep White House Press Secretary Sarah Sanders busy for the next few news cycles, former New York City Mayor and recent addition to Trump’s legal team, Rudy Giuliani, told Fox’s Sean Hannity that President Trump reimbursed his personal attorney, Michael Cohen, $130,000 which Cohen paid to adult film star Stormy Daniels.

Giuliani, paradoxically in his new capacity as Trump’s lawyer, says that the payment was “perfectly legal” and that it was “not campaign money,” meaning that the payment did not violate campaign finance law.
“Funneled through a law firm, and the president repaid it,” Giuliani said, adding “He didn’t know about the specifics of it but he did know about the general arrangement, that Michael would take care of things like this.”
Jon Passantino✔@passantino
Giuliani says Trump repaid Cohen the $130,000 used as hush money for Stormy Daniels
Where it gets complicated for Trump is that Cohen told the New York Times in February that he paid $130,000 to Daniels out of his own pocket, and that neither the Trump Organization or the Trump Campaign had anything to do with the 2016 transaction.

“Neither the Trump Organization nor the Trump campaign was a party to the transaction with Ms. Clifford, and neither reimbursed me for the payment, either directly or indirectly,” Cohen told The New York Times. “The payment to Ms. Clifford was lawful, and was not a campaign contribution or a campaign expenditure by anyone.”
Following the report, nonprofit watchdog group Common Cause filed a complaint with the DOJ and the Federal Election Commission claiming that the payment to Clifford violated campaign finance laws because it was an “unreported in-kind contribution to the president’s 2016 campaign.”
So with Cohen paying Daniels, and Trump paying Cohen, viola – no problems! Right?
Well no: here’s the rub…

Scott Stedman@ScottMStedmanApril 5, 2018:
“Mr. President, did you know about the $130,000 payment to Stormy Daniels?”
President Trump: “No”https://www.youtube.com/watch?v=tE2XHYxkJgw …

Yashar Ali✔@yashar
And now, thanks to Giuliani, Trump will have no choice but to give yet another “explanation” for why the official narrative has just broken down which means more angry tweets and out bursts, and who knows, maybe more chemical false flag attacks by Assad to justify another airstrike or two on Syria.
END
Trump defends the hush payment saying that it did not come from campaign funds. Giuliani last night was trying to do two things:
1. shield Cohen from perjury
2.prevent Trump from violating election spending violations
(courtesy zero hedge)
Trump Defends “Hush” Payment After Giuliani Revelation, Stormy Daniels’ Lawyer “Speechless”
Late last night, Rudy Giuliani shocked viewerswhen he revealed during an interview with Sean Hannity that President Trump had, in fact, reimbursed his personal attorney Michael Cohen for a $130,000 “hush money” payment to porn star Stormy Daniels, saying the president “didn’t know about the specifics” but that he was aware “of the general arrangement.”
For a moment, the entire Washington political establishment held its breath. After all, it sounded as if Giuliani had just contradicted a statement that Cohen had made both during an interview with the New York Times and during court testimony – and could leave him exposed to a perjury charge. After flying into damage control mode, Giuliani later suggested that while Trump had repaid the $130,000, Cohen had made the payment to Daniels without Trump’s knowledge at the time.
The statement could also rebound on the president: Trump himself had also repeatedly denied having any knowledge of it, meaning that, in addition to possibly putting Cohen in legal jeopardy, Giuliani – Trump’s brand new lawyer – had seemingly risked ensnaring his boss in the controversy as well.
So this morning, President Trump himself weighed in to clarify Giuliani’s statement, providing some of his most detailed comments yet about the lawsuit brought against him and Cohen by Daniels.
Mark Knoller✔@markknollerTrump/Giuliani.
On April 5:
Q Mr. President, did you know about the $130,000 payment to Stormy Daniels? THE PRESIDENT: No. No. What else?
May 2:
Giuliani: “He didn’t know about the specifics of it, as far as I know. But he did know about the general arrangement,..”
As Trump explained in a series of tweets, Cohen was paid through a private retainer agreement, and the money to pay Daniels was presumably taken from these payments, not from payments made by Trump’s campaign.
“Mr. Cohen, an attorney, received a monthly retainer, not from the campaign and having nothing to do with the campaign, from which he entered into, through reimbursement, a private contract between two parties, known as a non-disclosure agreement, or NDA. These agreements are very common among celebrities and people of wealth,” Trump tweeted.
Donald J. Trump✔@realDonaldTrumpMr. Cohen, an attorney, received a monthly retainer, not from the campaign and having nothing to do with the campaign, from which he entered into, through reimbursement, a private contract between two parties, known as a non-disclosure agreement, or NDA. These agreements are…..
Trump added that these types of agreements are “very common” among rich people and that Daniels’ violation of the NDA was clear-cut and that she would eventually be forced to pay up in arbitration.
“In this case it is in full force and effect and will be used in Arbitration for damages against Ms. Clifford (Daniels). The agreement was used to stop the false and extortionist accusations made by her about an affair, despite already having signed a detailed letter admitting that there was no affair. Prior to its violation by Ms. Clifford and her attorney, this was a private agreement. Money from the campaign, or campaign contributions, played no roll in this transaction.”
Donald J. Trump✔@realDonaldTrump…very common among celebrities and people of wealth. In this case it is in full force and effect and will be used in Arbitration for damages against Ms. Clifford (Daniels). The agreement was used to stop the false and extortionist accusations made by her about an affair,……
Finally, Trump again insists that money from the campaign “had nothing to do” with Daniels or the payment made to her – and he also reminded the world that Daniels had previously signed a detailed letter denying the affair.
Donald J. Trump✔@realDonaldTrump…despite already having signed a detailed letter admitting that there was no affair. Prior to its violation by Ms. Clifford and her attorney, this was a private agreement. Money from the campaign, or campaign contributions, played no roll in this transaction.
As Bloomberg White House reporter Jennifer Jacobs pointed out, Trump is making the argument that Giuliani had been trying to make last night.

Jennifer Jacobs✔@JenniferJJacobsSo this “celebrities and people of wealth” argument is what Rudy Giuliani was *trying* to do on Fox News in that wild interview last night: Shield Michael Cohen from campaign finance violation, and shield Trump from affair with Stormy Daniels.
That said, Jacobs also made the point that Trump’s story now also appears to have changed, even if he still denies having had an affair: “President Donald Trump changed his story regarding $130,000 in hush money paid to adult film actress Stormy Daniels during the 2016 campaign, saying Thursday he reimbursed lawyer Michael Cohen and denying the arrangement was improper.”
Giuliani’s statement indicates that Trump was aware of the payment and reimbursed Cohen for it. It is unclear when or how the reimbursement took place. The White House did not immediately respond to a request for comment.
“When I heard Cohen’s retainer of $35,000, when he was doing no work for the president, I said ‘That’s how he’s repaying, with a little profit and a little margin for paying taxes for Michael,’’’ Giuliani said.
Asked last month whether he knew about the payment to Daniels, Trump said “No.’’
Asked if he knew where Cohen got the money for the payment, the president said he didn’t.
“No, I don’t know,’’ Trump told reporters.
Daniels is suing Trump and Cohen to void her NDA and has also offered to return the money that Cohen paid her. And just days ago, she slapped Trump with a lawsuit – this time filed in a New York court – claiming that he had defamed her in a series of tweets mocking a sketch of the man she said had threatened her about the purported affair.
Still, even as Trump walked back Giuliani’s misstatement for him, the president’s enemies pounced on the opportunity to call him a liar. Michael Avenatti, Stormy Daniels’ preening, television-obsessed attorney, told MSNBC late Wednesday that Giuliani’s comments had left him “speechless.”
“I have to tell you, I am rarely, as your viewers know, rendered speechless,” Daniels’s lawyer, Michael Avenatti, told MSNBC’s Lawrence O’Donnell. “But I am absolutely speechless at this revelation and this admission.”
Avenatti said on MSNBC that that contradiction exposed an outright lie by the president – adding that it should “outrage” Americans.
“I don’t care whether you’re on the left or on the right or in the center. I don’t care what your party affiliation is,” he said. “You deserve to be told the truth by your president and the people that stand at the podium at the White House briefing station or podium at the White House briefing conference, press conference, and answer questions.”
One wonders if this morning’s tweetstorm will elicit another lawsuit from Daniels?
end
NBC reports that Michael Cohen’s phone lines were tapped and at least one phone call to the White House was recorded. I guess they will leak what was said in that wiretapped conversation. I guess attorney client privilege is out the window.
(courtesy zerohedge)
FBI Wiretapped Michael Cohen, Intercepted “At Least One” Call With White House
Tell us again, James Comey, how the Deep State doesn’t exist.
In the latest bombshell about the FBI’s investigation into President Trump’s personal attorney Michael Cohen, NBC News reported Thursday afternoon that the FBI had been wiretapping phone lines used by Cohen during the weeks before the raid on his home, office and hotel room, as well as for an unknown amount of time before.
And what’s more, NBC says prosecutors recorded at least one call between Cohen and somebody at the White House. We can almost guess who that “somebody” is…
Federal investigators have wiretapped the phone lines of Michael Cohen, the longtime personal lawyer for President Donald Trump who is under investigation for a payment he made to an adult film star who alleged she had an affair with Trump, according to two people with knowledge of the legal proceedings involving Cohen.
It is not clear how long the wiretap has been authorized, but NBC News has learned it was in place in the weeks leading up to the raids on Cohen’s offices, hotel room, and home in early April, according to one person with direct knowledge.
At least one phone call between a phone line associated with Cohen and the White House was intercepted, the person said.
Previously, federal prosecutors in New York have said in court filings that they have conducted covert searches on multiple e-mail accounts maintained by Cohen.
After the raid on Cohen’s office, members of Trump’s legal team reportedly advised him to speak with Cohen. But later, when Rudy Giuliani learned about the call, he advised Trump not to speak with Cohen on the phone again for fear prosecutors might be listening. Giuliani has also reportedly advised Trump that Cohen is likely to flip on him.
It is unclear what incriminating information Cohen could give prosecutors on Trump, if he chose to cooperate. He represented Trump and the Trump Organization in its business dealings for nearly two decades before Trump became president. Special counsel Robert Mueller is interested in any information that federal investigators in New York may pick up that would be relevant to his investigation into possible collusion between the Trump campaign and Russia.
Cohen has previously said publicly that he would invoke his Fifth Amendment rights if subpoenaed to avoid incriminating himself before a grand jury and there is no indication from public filings that Cohen is cooperating in the probe.
Given the volume of Trump legal drama scoops that have dropped this week, we expect to see more reports fleshing out what exactly the FBI learned from eavesdropping on conversations between Cohen and – presumably – his No. 1 client. Then again, none of this should come as a surprise: after all, thanks to the FISA warrant obtained as a result of the Hillary Clinton-funded dossier, both the FBI and the NSA already knew everything that Trump was saying long before he became president.
I will see you FRIDAY night
HARVEY


Not a single “Elon Musk FRAUD” story?!?
LikeLiked by 1 person