
GOLD: $1210.35 UP $0.75 (COMEX TO COMEX CLOSINGS)
Silver: $15.37 UP 3 CENTS (COMEX TO COMEX CLOSINGS)
Closing access prices:
Gold $1211.00
silver: $15.39
For comex gold:
AUGUST/
NUMBER OF NOTICES FILED TODAY FOR AUGUST CONTRACT: 61 NOTICE(S) FOR 6100 oz
TOTAL NOTICES SO FAR 1323 FOR 132300 OZ (4.115 tonnes)
For silver:
AUGUST
1 NOTICE(S) FILED TODAY FOR
5,000 OZ/
Total number of notices filed so far this month: 622 for 3,110,000 oz
XXXXXXXXXXXXXXXXXXXXXXXXXXXXXX
XXXXXXXXXXXXXXXXXXXXXXXXXXXXXX
Bitcoin: BID $7061/OFFER $7147: UP $224(morning)
Bitcoin: BID/ $6834/offer $6919: DOWN $4 (CLOSING/5 PM)
end
First Shanghai gold fix comes at 10 pm est
The second Shanghai gold fix: 2:15 pm
First Shanghai gold fix gold: 10 pm est: $1215.10
NY price at the same time:1209,40
PREMIUM TO NY SPOT: $5.90
XX
Second gold fix early this morning: $1215.10
USA gold at the exact same time:$1211.60
PREMIUM TO NY SPOT: $3.50
China is controlling the gold market
WE WILL NOT PROVIDE LONDON FIXES AS THEY ARE NOT ACCURATE AS TO WHAT IS GOING ON AT THE SAME TIME FRAME.
Let us have a look at the data for today
xxxxxxxxxxxxxxxxxxxxxxxxxxxxxxxxxxxxxxxxxxxxxxxxxxxxxxxxxxxxxxxxxxxxxxxxxx
In silver, the total OPEN INTEREST ROSE BY A CONSIDERABLE SIZED 2659 CONTRACTS FROM 230,226 UP TO 232,885 DESPITE YESTERDAY’S 11 CENT FALL IN SILVER PRICING AT THE COMEX. WE HAVE NOW WITNESSED A SLOW COMEX ACCUMULATION THESE PAST SEVERAL DAYS. ON TOP OF THIS WE HAVE ALSO WITNESSED A LARGE AMOUNT OF PHYSICAL METAL STAND FOR COMEX DELIVERY(WELL OVER 30 MILLION OZ AT THE COMEX FOR JULY AND OVER 4 MILLION OZ FOR AUGUST) AS WELL AS CONSIDERABLE LONGS PACKING THEIR BAGS AND MIGRATING OVER TO LONDON IN GREATER NUMBERS IN THE FORM OF EFP’S. WE WERE NOTIFIED THAT WE HAD A SMALL SIZED NUMBER OF COMEX LONGS TRANSFERRING THEIR CONTRACTS TO LONDON THROUGH THE EFP: 0 EFP’S FOR AUGUST, 177 EFP’S FOR SEPT. , 0 EFP’S FOR DECEMBER AND ZERO FOR ALL OTHER MONTHS AND THEREFORE TOTAL ISSUANCE: OF 177 CONTRACTS. WITH THE TRANSFER OF 177 CONTRACTS, WHAT THE CME IS STATING IS THAT THERE IS NO SILVER (OR GOLD) TO BE DELIVERED UPON AT THE COMEX AS THEY MUST EXPORT THEIR OBLIGATION TO LONDON. ALSO KEEP IN MIND THAT THERE CAN BE A DELAY OF 24-48 HRS IN THE ISSUING OF EFP’S. THE 177 EFP CONTRACTS TRANSLATES INTO 0.885 MILLION OZ AND ACCOMPANYING:
1.THE 11 CENT FALL IN SILVER PRICE AT THE COMEX AND
2. THE STRONG AMOUNT OF SILVER OUNCES WHICH STOOD FOR THE JUNE/2018 COMEX DELIVERY MONTH. (5.420 MILLION OZ) 30.370 MILLION OZ FINALLY STANDING FOR DELIVERY IN JULY, AND NOW 4.415 MILLION OZ FOR AUGUST.
ACCUMULATION FOR EFP’S/SILVER/J.P.MORGAN’S HOUSE OF BRIBES, / STARTING FROM FIRST DAY NOTICE/FOR MONTH OF JULY:
3761 CONTRACTS (FOR 5 TRADING DAYS TOTAL 3761 CONTRACTS) OR 18.805 MILLION OZ: (AVERAGE PER DAY: 752 CONTRACTS OR 3.761 MILLION OZ/DAY)
TO GIVE YOU AN IDEA AS TO THE HUGE SUPPLY THIS MONTH IN SILVER: SO FAR THIS MONTH OF JULY: 18.805 MILLION PAPER OZ HAVE MORPHED OVER TO LONDON. THIS REPRESENTS AROUND 2.68% OF ANNUAL GLOBAL PRODUCTION (EX CHINA EX RUSSIA)* JUNE’S 345.43 MILLION OZ IS THE SECOND HIGHEST RECORDED ISSUANCE OF EFP’S AND IT FOLLOWED THE RECORD SET IN APRIL 2018 OF 385.75 MILLION OZ.
ACCUMULATION IN YEAR 2018 TO DATE SILVER EFP’S: 1,851.38 MILLION OZ.
ACCUMULATION FOR JAN 2018: 236.879 MILLION OZ
ACCUMULATION FOR FEB 2018: 244.95 MILLION OZ
ACCUMULATION FOR MARCH 2018: 236.67 MILLION OZ
ACCUMULATION FOR APRIL 2018: 385.75 MILLION OZ
ACCUMULATION FOR MAY 2018: 210.05 MILLION OZ
ACCUMULATION FOR JUNE 2018: 345.43 MILLION OZ
ACCUMULATION FOR JULY 2018: 172.84 MILLION OZ
RESULT: WE HAD A CONSIDERABLE SIZED INCREASE IN COMEX OI SILVER COMEX CONTRACTS OF 2659 DESPITE THE 11 CENT FALL IN SILVER PRICING AT THE COMEX YESTERDAY. THE CME NOTIFIED US THAT WE HAD A SMALL SIZED EFP ISSUANCE OF 177 CONTRACTS WHICH EXITED OUT OF THE SILVER COMEX AND TRANSFERRED THEIR OI TO LONDON AS FORWARDS. SPECULATORS CONTINUED THEIR INTEREST IN ATTACKING THE SILVER COMEX FOR PHYSICAL SILVER (SEE COMEX DATA) .
TODAY WE GAINED A FAIR SIZED: 2836 TOTAL OI CONTRACTS ON THE TWO EXCHANGES:
i.e 177 OPEN INTEREST CONTRACTS HEADED FOR LONDON (EFP’s) TOGETHER WITH A INCREASE OF 2659 OI COMEX CONTRACTS. AND ALL OF THIS DEMAND HAPPENED WITH A 11 CENT FALL IN PRICE OF SILVER AND A CLOSING PRICE OF $15.34 WITH RESPECT TO YESTERDAY’S TRADING. YET WE HAD A GIGANTIC AMOUNT OF SILVER STANDING AT THE COMEX FOR DELIVERY IN THE BIG JULY DELIVERY MONTH OF SLIGHTLY OVER 30 MILLION OZ AND NOW IN AUGUST ANOTHER BIG 4.415 MILLION OZ IN A NON ACTIVE MONTH. IT SURE LOOKS LIKE ANOTHER FAILED BANKER SHORT COVERING EXERCISE AS BANKERS ARE SCRAMBLING TO COVER THEIR HUGE SHORTFALL IN SILVER.
In ounces AT THE COMEX, the OI is still represented by OVER 1 BILLION oz i.e. 1.164 MILLION OZ TO BE EXACT or 166% of annual global silver production (ex Russia & ex China).
FOR THE NEW FRONT AUGUST MONTH/ THEY FILED AT THE COMEX: 1 NOTICE(S) FOR 5,000 OZ OF SILVER
IN SILVER, WE SET THE NEW RECORD OF OPEN INTEREST AT 243,411 CONTRACTS ON APRIL 9.2018. AND AGAIN THIS HAS BEEN SET WITH A LOW PRICE OF $16.51
ON THE DEMAND SIDE WE HAVE THE FOLLOWING:
- HUGE AMOUNTS OF SILVER STANDING FOR DELIVERY (MARCH/2018: 27 MILLION OZ , APRIL/2018 : 2.485 MILLION OZ MAY: 36.285 MILLION OZ ; JUNE/2018 (5.420 MILLION OZ) AND JULY 2018 AMOUNT FINALLY STANDING: 30.370 MILLION OZ ) AND NOW FOR AUGUST 4.415 MILLION OZ.
- HUGE RECORD OPEN INTEREST IN SILVER 243,411 CONTRACTS (OR 1.217 BILLION OZ/ SET APRIL 9/2018
- HUGE ANNUAL EFP’S ISSUANCE EQUAL TO 2.9 BILLION OZ OR 400% OF SILVER ANNUAL PRODUCTION/2017
- RECORD SETTING EFP ISSUANCE FOR ANY MONTH IN SILVER; APRIL/2018/ 385.75 MILLION OZ/ AND THE SECOND HIGHEST RECORDED EFP ISSUANCE JUNE 2018 345.43 MILLION OZ
AND YET, WITH THE EXTREMELY HIGH EFP ISSUANCE, WE HAVE A CONTINUAL LOW PRICE OF SILVER DESPITE THE ABOVE HUGE DEMAND. TO ME THE ONLY ANSWER IS THAT WE HAVE SOVEREIGN (CHINA) WHO IS ENDEAVOURING TO GOBBLE UP ALL AVAILABLE PHYSICAL SILVER NO MATTER WHERE, EXACTLY WHAT J.P.MORGAN IS DOING. AND IT IS MY BELIEF THAT J.P.MORGAN IS HOLDING ITS SILVER FOR ITS BENEFICIAL OWNER..THE USA GOVERNMENT WHO IN TURN IS HOLDING THAT SILVER FOR CHINA.(FOR A SILVER LOAN REPAYMENT).
IN GOLD, THE OPEN INTEREST FELL BY A TINY SIZED 577 CONTRACTS DOWN TO 459,393 DESPITE THE FALL IN THE COMEX GOLD PRICE/YESTERDAY’S TRADING (A LOSS IN PRICE OF $5.30). THE CME RELEASED THE DATA FOR EFP ISSUANCE AND IT TOTALED A STRONG SIZED 9814 CONTRACTS:
AUGUST HAD AN ISSUANCE OF 0 CONTRACTS, OCTOBER HAD 0 EFP’S ISSUED AND, DECEMBER HAD AN ISSUANCE OF 9814 CONTACTS AND ALL OTHER MONTHS ZERO. The NEW COMEX OI for the gold complex rests at 459,393. ALSO REMEMBER THAT THERE WILL BE A DELAY IN THE ISSUANCE OF EFP’S. THE BANKERS REMOVE LONG POSITIONS OF COMEX GOLD IMMEDIATELY. THEN THEY ORCHESTRATE THEIR PRIVATE EFP DEAL WITH THE LONGS AND THAT COULD TAKE AN ADDITIONAL 48 HRS SO WE GENERALLY DO NOT GET A MATCH WITH RESPECT TO DEPARTING COMEX LONGS AND NEW EFP LONG TRANSFERS. . EVEN THOUGH THE BANKERS ISSUED THESE MONSTROUS EFPS, THE OBLIGATION STILL RESTS WITH THE BANKERS TO SUPPLY METAL BUT IT TRANSFERS THE RISK TO A LONDON BANKER OBLIGATION AND NOT A NEW YORK COMEX OBLIGATION. LONGS RECEIVE A FIAT BONUS TOGETHER WITH A LONG LONDON FORWARD. THUS, BY THESE ACTIONS, THE BANKERS AT THE COMEX HAVE JUST STATED THAT THEY HAVE NO APPRECIABLE METAL!! THIS IS A MASSIVE FRAUD: THEY CANNOT SUPPLY ANY METAL TO OUR COMEX LONGS BUT THEY ARE QUITE WILLING TO SUPPLY MASSIVE NON BACKED GOLD (AND SILVER) PAPER KNOWING THAT THEY HAVE NO METAL TO SATISFY OUR LONGS. LONDON IS NOW SEVERELY BACKWARD IN BOTH GOLD AND SILVER AND WE ARE WITNESSING DELAYS IN ACTUAL DELIVERIES.
IN ESSENCE WE HAVE A STRONG OI GAIN IN TOTAL CONTRACTS ON THE TWO EXCHANGES OF 9237 CONTRACTS: 577 OI CONTRACTS DECREASED AT THE COMEX AND 9814 EFP OI CONTRACTS WHICH NAVIGATED OVER TO LONDON. THUS TOTAL OI GAIN: 9237 CONTRACTS OR 923,700 OZ = 28,73 TONNES. AND ALL OF THIS STRONG DEMAND OCCURRED WITH THE FALL IN THE PRICE OF GOLD/ YESTERDAY TO THE TUNE OF $5.30.
YESTERDAY, WE HAD 6561 EFP’S ISSUED.
ACCUMULATION OF EFP’S GOLD AT J.P. MORGAN’S HOUSE OF BRIBES: (EXCHANGE FOR PHYSICAL) FOR THE MONTH OF JUNE : 39,152 CONTRACTS OR 3,915,200 OZ OR 121,78 TONNES (5 TRADING DAYS AND THUS AVERAGING: 7830 EFP CONTRACTS PER TRADING DAY OR 678,300 OZ/ TRADING DAY),,
TO GIVE YOU AN IDEA AS TO THE HUGE SIZE OF THESE EFP TRANSFERS : THIS MONTH IN 5 TRADING DAYS IN TONNES: 121.78 TONNES
TOTAL ANNUAL GOLD PRODUCTION, 2017, THROUGHOUT THE WORLD EX CHINA EX RUSSIA: 2555 TONNES
THUS EFP TRANSFERS REPRESENTS 121.78/2550 x 100% TONNES = 4.77% OF GLOBAL ANNUAL PRODUCTION SO FAR IN JULY ALONE.***
ACCUMULATION OF GOLD EFP’S YEAR 2018 TO DATE: 4,831.82* TONNES *SURPASSED ANNUAL PROD’N
ACCUMULATION OF GOLD EFP’S FOR JANUARY 2018: 653.22 TONNES (21 TRADING DAYS)
ACCUMULATION OF GOLD EFP’S FOR FEBRUARY 2018: 649.45 TONNES (20 TRADING DAYS)
ACCUMULATION OF GOLD EFP’S FOR MARCH 2018: 741.89 TONNES (22 TRADING DAYS)
ACCUMULATION OF GOLD EFP’S FOR APRIL 2018: 713.84 TONNES (21 TRADING DAYS)
ACCUMULATION OF GOLD EFP’S FOR MAY 2018: 693.80 TONNES ( 22 TRADING DAYS)
ACCUMULATION OF GOLD EFP FOR JUNE 2018 650.71 TONNES (21 TRADING DAYS)
ACCUMULATION OF GOLD EFP FOR JULY 2018 605.5 TONNES (21 TRADING DAYS)
WHAT IS ALARMING TO ME, ACCORDING TO OUR LONDON EXPERT ANDREW MAGUIRE IS THAT THESE EFP’S ARE BEING TRANSFERRED TO WHAT ARE CALLED SERIAL FORWARD CONTRACT OBLIGATIONS AND THESE CONTRACTS ARE LESS THAN 14 DAYS. ANYTHING GREATER THAN 14 DAYS, THESE MUST BE RECORDED AND SENT TO THE COMPTROLLER, GREAT BRITAIN TO MONITOR RISK TO THE BANKING SYSTEM. IF THIS IS INDEED TRUE, THEN THIS IS A MASSIVE CONSPIRACY TO DEFRAUD AS WE NOW WITNESS A MONSTROUS TOTAL EFP’S ISSUANCE AS IT HEADS INTO THE STRATOSPHERE.
Result: A TINY SIZED DECREASE IN OI AT THE COMEX OF 577 DESPITE THE LOSS IN PRICING ($5.30 THAT GOLD UNDERTOOK YESTERDAY) // . WE ALSO HAD A STRONG SIZED NUMBER OF COMEX LONG TRANSFERRING TO LONDON THROUGH THE EFP ROUTE: 9814 CONTRACTS AS THESE HAVE ALREADY BEEN NEGOTIATED AND CONFIRMED. THERE OBVIOUSLY DOES NOT SEEM TO BE MUCH PHYSICAL GOLD AT THE COMEX. I GUESS IT EXPLAINS THE HUGE ISSUANCE OF EFP’S…THERE IS HARDLY ANY GOLD PRESENT AT THE GOLD COMEX FOR DELIVERY PURPOSES. IF YOU TAKE INTO ACCOUNT THE 9814 EFP CONTRACTS ISSUED, WE HAD A STRONG NET GAIN OF 9,237 CONTRACTS IN TOTAL OPEN INTEREST ON THE TWO EXCHANGES:
9814 CONTRACTS MOVE TO LONDON AND 577 CONTRACTS DECREASED AT THE COMEX. (in tonnes, the GAIN in total oi equates to 28.73 TONNES). ..AND THIS STRONG DEMAND OCCURRED DESPITE THE LOSS OF $5.30 IN YESTERDAY’S TRADING AT THE COMEX!!!.
we had: 61 notice(s) filed upon for 6100 oz of gold at the comex.
xxxxxxxxxxxxxxxxxxxxxxxxxxxxxxxxxxxxxxxxxxxxxxxxxxxxxxxxxxx
With respect to our two criminal funds, the GLD and the SLV:
GLD...
WITH GOLD UP $0.75 TODAY: /
HUGE CHANGES IN GOLD INVENTORY AT THE GLD/A WITHDRAWAL OF 6.21 TONNES AND THE CROOKS TRIED TO USE THIS GOLD TODAY IN THE SUPPRESSION OF THE METAL PRICE AND FAILED.
.
/GLD INVENTORY 788.71 TONNES
Inventory rests tonight: 788.71 tonnes.
TO ALL INVESTORS THINKING OF BUYING GOLD THROUGH THE GLD ROUTE: YOU ARE MAKING A TERRIBLE MISTAKE AS THE CROOKS ARE USING WHATEVER GOLD COMES IN TO ATTACK BY SELLING THAT GOLD. IT SURE SEEMS TO ME THAT THE GOLD OBLIGATIONS AT THE GLD EXCEED THEIR INVENTORY
SLV/
WITH SILVER UP 3 CENTS TODAY :
the crooks finally raided the silver cookie jar to the tune of 1.78 million oz/
thus a withdrawal of 1.78 million oz
the raid on gold was much worse than on silver.
/INVENTORY RESTS AT 328.445 MILLION OZ/
NOTE THE DIFFERENCE BETWEEN THE GLD AND SLV: THE CROOKS CAN RAID GOLD BECAUSE THEY DO HAVE SOME PHYSICAL. THEY DO NOT RAID SILVER PROBABLY BECAUSE THERE IS NO REAL SILVER INVENTORIES BEHIND THEM
end
First, here is an outline of what will be discussed tonight:
1. Today, we had the open interest in SILVER ROSE BY A CONSIDERABLE SIZED 2659 CONTRACTS from 230,225 UP TO 232,885 (AND MUCH CLOSER TO THE NEW COMEX RECORD SET /APRIL 9/2018 AT 243,411/SILVER PRICE AT THAT DAY: $16.53). THE PREVIOUS RECORD OTHER THAN WAS ESTABLISHED AT: 234,787, SET ON APRIL 21.2017 OVER 1 1/4 YEARS AGO. THE PRICE OF SILVER ON THAT DAY: $17.89. AS YOU CAN SEE, THE RECORD HIGH OPEN INTEREST IN SILVER IS ACCOMPANIED BY A LOWER PRICE..VERY STRANGE INDEED. OUR CUSTOMARY MIGRATION OF COMEX LONGS MORPH INTO LONDON FORWARDS CONTINUES AS OUR BANKERS USED THEIR EMERGENCY PROCEDURE TO ISSUE:
177 EFP CONTRACTS FOR SEPT., 0 EFP CONTRACTS FOR DECEMBER AND ALL OTHER MONTHS: ZERO. TOTAL EFP ISSUANCE: 177 CONTRACTS . EFP’S GIVE OUR COMEX LONGS A FIAT BONUS PLUS A DELIVERABLE PRODUCT OVER IN LONDON. IF WE TAKE THE OI GAIN AT THE COMEX OF 2659 CONTRACTS TO THE 177 OI TRANSFERRED TO LONDON THROUGH EFP’S, WE OBTAIN A NET GAIN OF 2836 OPEN INTEREST CONTRACTS. THUS IN OUNCES, THE GAIN ON THE TWO EXCHANGES: 1.4180 MILLION OZ!!! AND YET WE ALSO HAVE A STRONG DEMAND FOR PHYSICAL AS WE WITNESSED A FINAL STANDING OF GREATER THAN 30 MILLION OZ FOR JULY AND NOW ANOTHER STRONG 4.415 MILLION OZ FOR AUGUST... AND YET ALL OF THIS HUGE DEMAND OCCURRED DESPITE THE 11 CENT PRICING FALL AT THE SILVER COMEX.
RESULT: A CONSIDERABLE SIZED INCREASE IN SILVER OI AT THE COMEX DESPITE THE 11 CENT PRICING LOSS THAT SILVER UNDERTOOK IN PRICING YESTERDAY. BUT WE ALSO HAD A FAIR SIZED 177 EFP’S ISSUED TRANSFERRING COMEX LONGS OVER TO LONDON. TOGETHER WITH THE STRONG SIZED AMOUNT OF SILVER OUNCES STANDING FOR AUGUST, DEMAND FOR PHYSICAL SILVER CONTINUES TO INTENSIFY AS WE WITNESS SEVERE BACKWARDATION IN SILVER IN LONDON.
(report Harvey)
.
2.a) The Shanghai and London gold fix report
(Harvey)
2 b) Gold/silver trading overnight Europe, Goldcore
(Mark O’Byrne/zerohedge
and in NY: Bloomberg
3. ASIAN AFFAIRS
i)TUESDAY MORNING/MONDAY NIGHT: Shanghai closed UP 74.22 POINTS OR 2.74% /Hang Sang CLOSED UP 429.32 POINTS OR 1.54%/ / The Nikkei closed UP 155.42 POINTS OR 0.69%/Australia’s all ordinaires CLOSED DOWN 0.29% /Chinese yuan (ONSHORE) closed UP at 6.8260 AS POBC STOPS ITS HUGE DEVALUATION /Oil UP to 69.68 dollars per barrel for WTI and 74.72 for Brent. Stocks in Europe OPENED DEEPLY IN THE GREEN //. ONSHORE YUAN CLOSED WELL UP AT 6.8260 AGAINST THE DOLLAR. OFFSHORE YUAN CLOSED UP ON THE DOLLAR AT 6.8324: HUGE DEVALUATION/PAST SEVERAL DAYS STOPS : /ONSHORE YUAN TRADING STRONGER AGAINST OFFSHORE YUAN/ONSHORE YUAN TRADING STRONGER AGAINST USA DOLLAR/OFFSHORE YUAN TRADING STRONGER AGAINST THE DOLLAR /CHINA RETALIATES WITH TARIFFS/ TRUMP RESPONDS TO NEW TARIFFS AND IT NOW A FULL TRADE WAR COMMENCED
/NORTH KOREA/SOUTH KOREA
i)North Korea/South Korea/USA/Russia
b) REPORT ON JAPAN
Finally Japan is witnessing a spike in wage earnings, the largest in 21 years. However they are not spending their new wealth as the slump continues
( zerohedge)
3 c CHINA
i)Is China panicking? They now are using moral suasion to convince banks to avoid the herd behaviour to sell the yuan
( zerohedge)
ii)Meet China’s new problem: Millennials have discovered the credit card and this amount of credit is now exceeding corporation debt.
(courtesy zerohedge)
iii)China escalates the verbal war with Trump: China states that the drop in Chinese stocks does not mean that the USA is winning:
( zerohedge)
4. EUROPEAN AFFAIRS
i)ECB
The debate on target 2 imbalances continues…a must read.
( Mish Shedlock/Mishtalk)
ii)Germany
5. RUSSIAN AND MIDDLE EASTERN AFFAIRS
6 .GLOBAL ISSUES
CANADA/SAUDI ARABIA
The diplomatic feud deteriorates as Saudi stop buying Cdn wheat and barley. They do not buy much from Canada due to the high costs in shipping. However the Cdn dollar plummeted on the news
( zerohedge)
7. OIL ISSUES
PETRO YUAN /SHANGHAI CHINA
China can bypass sanctions by buying oil in yuan. The question is whether the seller would take their yuan and convert to gold
(courtesy zerohedge)
8. EMERGING MARKET
9. PHYSICAL MARKETS
i)The truth behind the true intentions of the LBMA
( zerohedge)
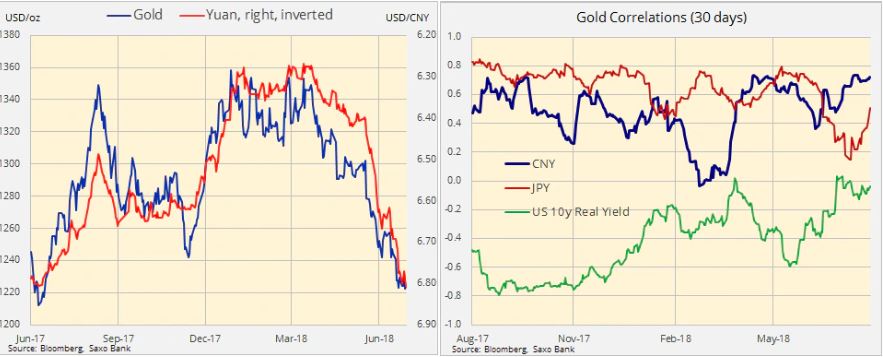
ii)Kevin Muir is correct on his latest commentary with respect to the perfect correlation between the price of gold and the value of the yuan. The higher the yuan , the higher the price of gold and visa versa. But the Chinese are not sellers of gold. They are only buyers. So when gold is whacked, it is the uSA bankers that are selling paper gold in dollars and it is the Chinese that are the buyers of gold at a relatively stable yuan price.
(courtesy Kevin Muir/Macro Tourist blog)
10. USA stories which will influence the price of gold/silver)
i)Market trading /GOLD/MARKET MOVERS:
i)Janet Yellen’s favourite metric: the JOLTS figure.
Job openings have increased and they now exceed unemployed workers. Also hires are increasing as well as quits (those that quit on their own as they say you can “shove” this job!
(zerohedge)
ii)this is two days in a row that the uSA has experienced an ugly auction. The big 10 yr auction is tomorrow..is this a harbinger of things to come, as the USA has a boatload of bonds to issue to finance its burgeoning debt
iii)Revolving credit takes a little siesta but not student loans and auto loans. Both are now at record levels. The total of all 3 consumer credit balances: 3.91 trillion dollars
iv)SWAMP STORIES
Rick Gates testifies that he committed mega crimes while working for Manafort. The problem is that he is also a liar especially when initially talking to the FBI. The big question is how are they going to handle this.
( zerohedge)
ii)First, it was Paul Manafort for tax evasion. Now it it Michael Cohen under investigation for tax fraud
( zerohedge)
Let us head over to the comex:
Trading Volumes on the COMEX
PRELIMINARY COMEX VOLUME FOR TODAY: 197,106 contracts
CONFIRMED COMEX VOL. FOR YESTERDAY: 206,622 contracts
xxxxxxxxxxxxxxxxxxxxxxxxxxxxxxxxxxxxxxxxxxxxxxxxxxxxxxxxxxxxxxxxxxxx
And now for the wild silver comex results.
Total silver OI ROSE BY A CONSIDERABLE SIZED 2659 CONTRACTS FROM 230,226 UP TO 232,885 (AND A MUCH CLOSER TO THE THE NEW RECORD OI FOR SILVER SET APRIL 9.2018/ 243,411 CONTRACTS) WITH THE 11 CENT LOSS IN PRICING THAT SILVER UNDERTOOK YESTERDAY.SINCE WE ARE NOW INTO THE NON – ACTIVE DELIVERY MONTH OF AUGUST, WE WERE INFORMED THAT WE HAD A FAIR SIZED 177 EFP CONTRACTS:
FOR SEPT: 177 EFP CONTRACTS AND FOR DECEMBER: 0 CONTRACTS AND ZERO FOR ALL OTHER MONTHS. THESE EFPS WERE ISSUED TO COMEX LONGS WHO RECEIVED A FIAT BONUS PLUS A DELIVERABLE PRODUCT OVER IN LONDON. THE TOTAL EFP’S ISSUED: 177. ON A NET BASIS WE GAINED 2832 SILVER OPEN INTEREST CONTRACTS AS WE OBTAINED 2659 CONTRACT GAIN AT THE COMEX COMBINING WITH THE ADDITION OF 177 OI CONTRACTS NAVIGATING OVER TO LONDON.
NET GAIN ON THE TWO EXCHANGES: 2836 CONTRACTS
FOR THE FRONT MONTH OF AUGUST WE HAD A NET LOSS OF 2 CONTRACTS. WE HAD 3 NOTICES FILED YESTERDAY SO WE CONTINUE WHERE WE LEFT OFF LAST MONTH IN THAT WE GAINED 1 CONTRACT STANDING OR AN ADDITIONAL 5,000 OZ WILL STAND AT THE COMEX AS THESE GUYS REFUSED TO MORPH INTO LONDON BASED FORWARDS AND RECEIVE A FIAT BONUS. QUEUE JUMPING AT THE SILVER COMEX IS THE NORM AS THERE IS CONSIDERABLE AMOUNT OF PHYSICAL LOCATED HERE. THERE IS NO QUEUE JUMPING AT THE GOLD COMEX FOR THE SIMPLE REASON THAT THERE IS NO GOLD THERE.
The next active delivery month after August for silver is September and here the OI ROSE by 22 contracts UP to 155,819. October received another 15 contracts to stand at 72
After October, the next big delivery month is December and here the OI rose by 2574 contracts up to 64,626 contracts.
We had 1 notice(s) filed for 5,000 OZ for the AUGUST 2018 COMEX contract for silver
AND NOW COMPARISON VS AUGUST LAST YR:
ON FIRST DAY NOTICE JULY 31/2017: 1,965,000 OZ STOOD FOR DELIVERY
THE FINAL AMOUNT OF SILVER STANDING: AUGUST 30.2017: 6,245,000 OZ AS WE HAD CONSIDERABLE QUEUE JUMPING.
INITIAL standings for AUGUST/GOLD
AUGUST 7/2018.
| Gold | Ounces |
| Withdrawals from Dealers Inventory in oz | nil oz |
| Withdrawals from Customer Inventory in oz |
nil oz
|
| Deposits to the Dealer Inventory in oz | NIL oz |
| Deposits to the Customer Inventory, in oz |
nil oz
|
| No of oz served (contracts) today |
61 notice(s)
610000 OZ
|
| No of oz to be served (notices) |
1357 contracts
(135,700 oz)
|
| Total monthly oz gold served (contracts) so far this month |
1323 notices
132300 OZ
4,115 TONNES
|
| Total accumulative withdrawals of gold from the Dealers inventory this month | NIL oz |
| Total accumulative withdrawal of gold from the Customer inventory this month | xxx oz |
we have a no pulse today, AND zero gold enters the comex
For AUGUST:
Today, 1154 notice(s) were issued from JPMorgan dealer account and 0 notices were issued from their client or customer account. The total of all issuance by all participants equates to 61 contract(s) of which 0 notices were stopped (received) by j.P. Morgan dealer and 49 notice(s) was (were) stopped/ Received) by j.P.Morgan customer account.
xxxxxxxxxxxxxxxxxxxxxxxxxxxxxxxxxxxxxxxxxxxxxxxxxxxxxxxxxxxxxxxxxxxxxxxxxx
To calculate the INITIAL total number of gold ounces standing for the AUGUST. contract month, we take the total number of notices filed so far for the month (1323) x 100 oz or 132300 oz, to which we add the difference between the open interest for the front month of AUGUST. (1418 contracts) minus the number of notices served upon today (61 x 100 oz per contract) equals 268,000 OZ OR 8.335 TONNES) the number of ounces standing in this non active month of AUGUST
Thus the INITIAL standings for gold for the AUGUST contract month:
No of notices served (1323 x 100 oz) + {(1418)OI for the front month minus the number of notices served upon today (61 x 100 oz )which equals 268,000 oz standing OR 8.335 TONNES in this active delivery month of AUGUST.
WE LOST 109 COMEX CONTRACTS OR AN ADDITIONAL 10900 OZ WILL NOT STAND AND THESE GUYS MORPHED INTO LONDON BASED FORWARDS. THERE WAS NO REASON TO HANG AROUND THE COMEX AS THERE IS NO GOLD THERE TO SETTLE UPON.
i) out of CNT 24,814.747 oz
ii) Out of HSBC: 269,663.070 oz
total withdrawals: 293,877.817 oz
we had 0 adjustments/
total dealer silver: 80.661 million
total dealer + customer silver: 286.105 million oz
The total number of notices filed today for the AUGUST. contract month is represented by 1 contract(s) FOR 5,000 oz. To calculate the number of silver ounces that will stand for delivery in AUGUST., we take the total number of notices filed for the month so far at 622 x 5,000 oz = 3,110,000 oz to which we add the difference between the open interest for the front month of AUGUST. (262) and the number of notices served upon today (1 x 5000 oz) equals the number of ounces standing.
.
Thus the INITIAL standings for silver for the AUGUST/2018 contract month: 622(notices served so far)x 5000 oz + OI for front month of AUGUST(262) -number of notices served upon today (1)x 5000 oz equals 4,415,000 oz of silver standing for the AUGUST contract month
WE GAINED 1 CONTRACT OR AN ADDITIONAL 5,000 OZ WILL STAND FOR DELIVERY AT THE COMEX AND THESE GUYS REFUSED TO MORPH INTO A LONDON BASED FORWARDS AND THUS THEY WILL NOT TAKE THE FIAT BONUS.
xxxxxxxxxxxxxxxxxxxxxxxxxxxxxxxxxxxxxxxxxxxxxxxxxxxxxxxxxxx
ESTIMATED VOLUME FOR TODAY:66953 CONTRACTS
CONFIRMED VOLUME FOR YESTERDAY: 61,632 CONTRACTS absolutely criminal
YESTERDAY’S CONFIRMED VOLUME OF 61,632 CONTRACTS EQUATES TO 308 million OZ OR 44.0% OF ANNUAL GLOBAL PRODUCTION OF SILVER
COMMODITY LAW SUGGESTS THAT OPEN INTEREST SHOULD NOT BE MORE THAN 3% OF ANNUAL GLOBAL PRODUCTION. THE CROOKS ARE SUPPLYING MASSIVE PAPER TRYING TO KEEP SILVER IN CHECK.
The record level of silver open interest is 234,787 contracts set on April 21./2017 with the price at that day at $18.42
The previous record was 224,540 contracts with the price at that time of $20.44
end
NPV for Sprott
1. Sprott silver fund (PSLV): NAV RISES TO -3.48% (AUGUST 7/2018)
2. Sprott gold fund (PHYS): premium to NAV FALLS TO -1.29% to NAV (AUGUST 7/2018 )
Note: Sprott silver trust back into NEGATIVE territory at -3.48%-/Sprott physical gold trust is back into NEGATIVE/
(courtesy Sprott/GATA)
3.SPROTT CEF.A FUND (FORMERLY CENTRAL FUND OF CANADA):
NAV 12.56/TRADING 12.08//DISCOUNT 3.75.
END
And now the Gold inventory at the GLD/
AUGUST 7/WITH GOLD UP 0.75 TODAY/ANOTHER GIGANTIC WITHDRAWAL OF 6.04 TONNES AND THIS GOLD WAS TO BE USED IN AN ATTEMPTED RAID TODAY AND FAILED/INVENTORY RESTS AT 788.71 TONNES
AUGUST 6/WITH GOLD DOWN $5.30 TODAY: ANOTHER WITHDRAWAL OF 2.06 TONNES AND THIS GOLD WAS USED IN THE RAID TODAY/GLD INVENTORY RESTS TODAY AT 794.90 TONNES
AUGUST 3/WITH GOLD UP $3.10/NO CHANGES IN GOLD INVENTORY AT THE GLD/INVENTORY RESTS AT 796.96 TONNES
AUGUST 2/WITH GOLD DOWN $7.20/A HUGE WITHDRAWAL OF 3.24 TONNES FROM THE GLD WHICH NO DOUBT WAS USED IN THE RAID TODAY/INVENTORY RESTS AT 796.96 TONNES
AUGUST 1/WITH GOLD DOWN $4.65/NO CHANGE IN GOLD INVENTORY AT THE GLD.INVENTORY RESTS AT 800.20 TONNES
JULY 31/WITH GOLD UP $2.05/NO CHANGE IN GOLD INVENTORY AT THE GLD/INVENTORY RESTS AT 800.20
JULY 30/WITH GOLD DOWN $0.95/NO CHANGE IN GOLD INVENTORY AT THE GLD/INVENTORY RESTS AT 800.20 TONNES
july 27/WITH GOLD DOWN $2.85 TODAY, NO CHANGE IN GOLD INVENTORY AT THE GLD/INVENTORY RESTS AT 800.20 TONNES
JULY 26./WITH GOLD DOWN $5.65: A WITHDRAWAL OF 2.35 TONNES OF GOLD FROM THE GLD/INVENTORY RESTS AT 800.20 TONNES
JULY 25/WITH GOLD UP $6.45; NO CHANGE IN GOLD INVENTORY AT THE GLD/INVENTORY RESTS AT 802.55 TONNES
JULY 24/ WITH GOLD DOWN 10 CENTS: A HUGE DEPOSIT OF 4.42 TONNES INTO THE GLD/INVENTORY RESTS AT 802.55 TONNES
JULY 23/WITH GOLD DOWN $5.55: NO CHANGES IN GOLD INVENTORY AT THE GLD/INVENTORY RESTS AT 798.13 TONNES
JULY 20/WITH GOLD UP $4.15 A HUGE DEPOSIT OF 4.12 TONNES OF GOLD INTO THE GLD.INVENTORY RESTS AT 798.13 TONNES
JULY 19./WITH GOLD DOWN $1.00: NO CHANGES IN GOLD INVENTORY AT THE GLD/INVENTORY RESTS AT 794.01 TONNES
JULY 18/WITH GOLD UP 0.40: NO CHANGES IN GOLD INVENTORY AT THE GLD/INVENTORY RESTS AT 794.01 TONNES
JULY 17/WITH GOLD DOWN $12.40, WE HAD A BIG WITHDRAWAL OF 1.18 TONNES FROM THE GLD/INVENTORY RESTS AT 794.01 TONNES
JULY 16/WITH GOLD DOWN $1.55/NO CHANGE IN GOLD INVENTORY AT THE GLD/INVENTORY RESTS AT 795.19 TONNES
JULY 13/WITH GOLD DOWN $5.35 THE CROOKS RAID THE COOKIE JAR AGAIN TO THE TUNE OF 3.83 TONNES/INVENTORY RESTS AT 795.19 TONNES
JULY 12/WITH GOLD UP $2.30: NO CHANGE IN GOLD INVENTORY AT THE GLD/INVENTORY RESTS AT 799.02 TONNES
JULY 11/WITH GOLD DOWN $10.75 THE CROOKS RAIDED THE COOKIE JAR AGAIN TO THE TUNE OF 1.75 TONNES/INVENTORY RESTS AT 799.02 TONNES
JULY 10/WITH GOLD DOWN $3.85: NO CHANGES IN GOLD INVENTORY AT THE GLD/INVENTORY RESTS AT 800.77 TONNES
july 9/WITH GOLD UP $4.00/ANOTHER RAID ON THE GOLD COOKIE JAR: TWO WITHDRAWALS OF 1.18 TONNES THIS MORNING AND 1.47 TONNES THIS AFTERNOON/INVENTORY RESTS AT 800.77 TONNES
JULY 6/WITH GOLD DOWN $2.45: NO CHANGE IN GOLD INVENTORY AT THE GLD/INVENTORY RESTS AT 803.42 TONNES
JULY 5/WITH GOLD UP ANOTHER $5.15, THE CROOKS RAIDED THE COOKIE JAR AGAIN TO THE TUNE OF 5.89 TONNES/INVENTORY RESTS AT 803.42 TONNES IN THE LAST 10 TRADING DAYS GLD HAS LOST A HUGE 25.34 TONNES WITH A LOSS OF ONLY $15.25 IN PRICE
July 3/WITH GOLD UP $11.15/THE CROOKS RAIDED THE GLD INVENTORY AGAIN TO THE TUNE OF 9.73 TONNES/INVENTORY RESTS AT 809.31 TONNES
xxxxxxxxxxxxxxxxxxxxxxxxxxxxxxxxxx
AUGUST 7/2018/ Inventory rests tonight at 788.71 tonnes
*IN LAST 426 TRADING DAYS: 142.24 NET TONNES HAVE BEEN REMOVED FROM THE GLD
*LAST 376 TRADING DAYS: A NET 14.30 TONNES HAVE NOW BEEN ADDED INTO GLD INVENTORY.
end
Now the SLV Inventory/
AUGUST 7/WITH SILVER UP 3 CENTS, A RAID OF 1.78 MILLION OZ (A WITHDRAWAL) AT THE SLV.INVENTORY RESTS AT 329.445 MILLION OZ/
AUGUST 6/WITH SILVER DOWN 11 CENTS TODAY: A BIG CHANGE IN SILVER INVENTORY AT THE SLV: A DEPOSIT OF 1.034 MILLION OZ INTO THE SLV INVENTORY/INVENTORY RESTS AT 330.326 MILLION OZ/
AUGUST 3/WITH SILVER UP 7 CENTS TODAY/NO CHANGES IN SILVER INVENTORY AT THE SLV/INVENTORY RESTS AT 329.292 MILLION OZ/.
AUGUST 2 WITH SILVER DOWN 6 CENTS TODAY/A SMALL CHANGE IN SILVER INVENTORY AT THE SLV/ A WITHDRAWAL OF 141,000 OZ FOR THEIR MONTHLY STORAGE AND INSURANCE FEES:INVENTORY RESTS AT 329.292 MILLION OZ/
AUGUST 1/WITH SILVER DOWN 12 CENTS TODAY, NO CHANGE IN SILVER INVENTORY AT THE SLV/INVENTORY RESTS AT 329.433 MILLION OZ/
JULY 31/WITH SILVER UP 5 CENTS/NO CHANGE IN SILVER INVENTORY AT THE SLV/INVENTORY RESTS AT 329.433 MILLION OZ/
JULY 30/WITH SILVER UP 3 CENTS TODAY; NO CHANGE IN SILVER INVENTORY AT THE SLV/INVENTORY RESTS AT 329.433 MILLION OZ.
JULY 27/WITH SILVER FLAT TODAY, NO CHANGE IN SILVER INVENTORY AT THE SLV/INVENTORY RESTS AT 329.433 MILLION OZ/
JULY 26/WITH SILVER DOWN 10 CENTS: STRANGE: A BIG CHANGES IN SILVER INVENTORY AT THE SLV: A DEPOSIT OF 1.046 MILLION OZ OF SILVER/INVENTORY RESTS AT 329.433 MILLION OZ
JULY 25: WITH SILVER UP 8 CENTS TODAY: A SMALL CHANGE IN SILVER INVENTORY AT THE SLV/ A WITHDRAWAL OF 658,000 INVENTORY RESTS AT 328.304 MILLION OZ/
JULY 24/WITH SILVER UP 8 CENTS TODAY: NO CHANGE IN SILVER INVENTORY AT THE SLV/INVENTORY RESTS AT 328.962 MILLION OZ/
JULY 23/WITH SILVER DOWN 11 CENTS/NO CHANGES IN SILVER INVENTORY INTO THE SLV/INVENTORY RESTS AT 328.962 MILLION OZ/
JULY 20/WITH SILVER UP 10 CENTS TODAY: A HUGE CHANGE IN SILVER INVENTORY AT THE SLV: A DEPOSIT OF 1.411 MILLION OZ INTO THE SLV INVENTORY
INVENTORY RESTS AT 328.962 MILLION OZ
JULY 19/WITH SILVER DOWN 17 CENTS TODAY; A HUGE CHANGE IN SILVER INVENTORY AT THE SLV: A DEPOSIT OF 752,000 OZ INTO THE SLV INVENTORY/INVENTORY RESTS AT 327.551 MILLION OZ/
JULY 18/WITH SILVER DOWN 3 CENTS TODAY: NO CHANGES IN SILVER INVENTORY AT THE SLV/INVENTORY RESTS AT 326.799 MILLION OZ/
JULY 17/WITH SILVER DOWN 20 CENTS TODAY: A CHANGE IN SILVER INVENTORY A WITHDRAWAL OF 1.001 MILLION OZ FROM THE SLV: INVENTORY RESTS AT 326.799 MILLION OZ/
JULY 16/WITH SILVER FLAT TODAY, A HUGE CHANGE IN SILVER INVENTORY AT THE SLV: A DEPOSIT OF 1.128 MILLION OZ//INVENTORY RESTS AT 327.880 MILLION OZ
JULY 13/WITH SILVER DOWN 16 CENTS TODAY/NO CHANGE IN SILVER INVENTORY AT THE SLV/INVENTORY RESTS AT 326.752 MILLION OZ.
JULY 12/WITH SILVER UP 12 CENTS TODAY: ANOTHER BIG CHANGE IN SILVER INVENTORY AT THE SLV: A DEPOSIT OF 1.035 MILLION OZ/INVENTORY RESTS AT 326.752 MILLION OZ/
JULY 11/WITH SILVER DOWN 22 CENTS TODAY: ANOTHER HUGE CHANGES IN SILVER INVENTORY AT THE SLV: A DEPOSIT OF 565,000/INVENTORY RESTS AT 325.717 MILLION OZ
JULY 10/WITH SILVER DOWN 3 CENTS TODAY: NO CHANGES IN SILVER INVENTORY AT THE SLV/INVENTORY RESTS AT 325.151 MILLION OZ
july 9/WITH SILVER UP 5 CENTS: ANOTHER BIG CHANGE IN SILVER INVENTORY AT THE SLV: A DEPOSIT OF 847,000 OZ ADDED TO INVENTORY/INVENTORY RESTS AT 825.151 MILLION OZ/
JULY 6/WITH SILVER DOWN 2 CENTS/NO CHANGE IN SILVER INVENTORY AT THE SLV/INVENTORY RESTS AT 324.305 MILLION OZ/
JULY 5/WITH SILVER UP 6 CENTS, A GOOD CHANGE IN SILVER INVENTORY AT THE SLV: A DEPOSIT OF 470,000 OZ/INVENTORY RESTS AT 324.305 MILLION OZ/ FOR THE PAST 10 TRADING DAYS, SILVER INVENTORY HAS ADVANCED BY 4.945 MILLION OZ WITH A LOSS OF 33 CENTS/PLEASE COMPARE THIS WITH THE GLD.
JULY 3/WITH SILVER UP 17 CENTS, A HUGE DEPOSIT OF 1.37 MILLION OZ ADDED TO THE SLV/INVENTORY RESTS AT 323.835 MILLION OZ.
JULY 2/WITH SILVER DOWN 31 CENTS/A HUGE 2.070 MILLION OZ DEPOSIT AT THE SLV/INVENTORY RESTS AT 322.465 MILLION OZ/
AUGUST 7/2018:
Inventory 328.445 MILLION OZ
6 Month MM GOFO 1.92/ and libor 6 month duration 2.52
Indicative gold forward offer rate for a 6 month duration/calculation:
G0FO+ 1.92%
libor 2.52 FOR 6 MONTHS/
GOLD LENDING RATE: .60%
XXXXXXXX
12 Month MM GOFO
+ 2.83%
LIBOR FOR 12 MONTH DURATION: 2.41
GOFO = LIBOR – GOLD LENDING RATE
GOLD LENDING RATE = +.42
end
.
Major gold/silver trading /commentaries for TUESDAY
GOLDCORE/BLOG/MARK O’BYRNE.
Gold—Even at its Lowest Levels in 2018—is Behaving Just as Prescribed
By: Rachel Koning Beals – News Editor Marketwatch

Gold’s sharp decline over the past month serves as little surprise to the investors who want the asset to perform in just this fashion—that is, as an alternative to assets perceived as risky, like stocks.
They’re betting that the opposite will be true as well, that gold will resume its role as protector and diversifier, even inflation hedge, when what they see as bloated price-to-earnings ratios, heavy debt-to-GDP ratios among major economies and hints of higher inflation finally catch up to the stock market.
“Sure, the opportunity cost of holding gold given where stocks are isn’t great, but the long-term reasons to own gold are just as real as they were months ago, as a store of value with low correlation to stocks,” said Adam Strauss, CFA, with Appleseed Capital.
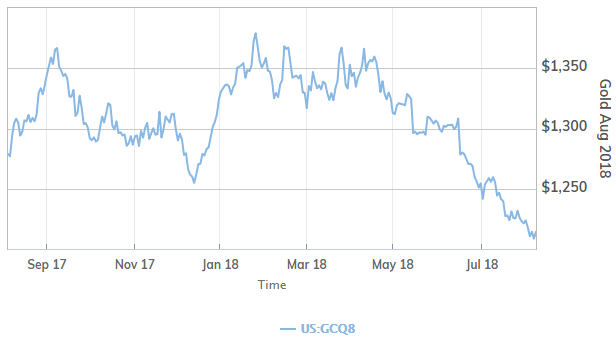
For now, gold bulls have had to watch with some anxiety as gold prices GCQ8, +0.51% GCZ8, +0.48% plunged last month to their lowest level in nearly a year—notching a settlement as low as $1,224 an ounce at one point, and even grazing a $1,210 low in intraday action, in the futures market. That settlement marked gold’s entry into correction territory, or down more than 10% from its peak on Jan. 15 at $1,362.90. Gold futures have now fallen on a weekly basis for three weeks in a row.
Neither stocks nor gold have strictly followed the presumed rules in recent weeks as the threat of a full-scale trade war took root as the U.S. threatened to enact tariffs against China and the European Union and these trading partners responded in kind. Risk-on markets barely registered alarm; the S&P 500 index SPX, +0.35% has gained 3.6% so far in July. And gold, often serving as even a short-term haven stash when geopolitical and global economic worries flare, was largely ignored for this use; it’s on track to shed 2.5% this month and is down about 6.6% in 2018 to date. True, the stock-gold inverse relationship held, just not as expected.
However, there is another inverse relationship that is played out much as expected and that too restores gold holders’ confidence that the metal’s descent isn’t all that worrying. The trade-war worries elevated the U.S. dollar to haven status among currencies, markedly against China’s yuan CNYUSD, +0.3896% (see the following chart). A stronger dollar can make commodities priced in the currency, such as gold, more expensive to investors using other monetary units, thus cutting demand for gold.
After declining by 9.8% during 2017, for the steepest annual fall since 2001, the ICE dollar index DXY, -0.26% again started the year on the back foot. But since a mid-April nadir, the DXY, as the gauge is sometimes referred, has rallied by about 6%. Gold’s near-term fate may remain tied to the dollar, but there is little shock or surprise in that.
Part of gold’s drop has been because of a tainted association to commodities in general, a relationship that will presumably mean less to investors if and when they’re spooked back toward the shelter of the yellow metal if stocks retreat.
“While gold’s commodity function (jewelry) is not central to our monetary investment thesis, the fact remains that gold is a key component of most commodity indices. In fact, gold is currently the single largest weighting in the Bloomberg Commodity Index, at 9.32%. In the very short run, therefore, gold is not immune to the magnetic pull of displacements in the commodity complex,” said Trey Reik, senior portfolio manager with Sprott Asset Management.
He points to July 11, a particularly sharp daily drop for copper prices and even steeper declines for the Bloomberg Commodity Index since 2014. Base metals broadly fell 3%-plus that day, when gold comparatively fell a little more than 1%, a gap that “serves as a testament to gold’s non-correlating profile,” he said.
“We view gold’s early summer performance as incremental evidence of bullion’s true portfolio utility,” Reik said. “Gold is not a magical elixir, but it is a fiercely reliable store of value.”
Reik is worried about the durability of what he sees as buyback-fueled stock rally of relatively narrow breadth.
“While imbalances and fragilities continue to mount in traditional asset markets, gold’s portfolio insurance value is being priced remarkably cheaply,” said Reik. “This is frequently a signal that market dynamics are about to change.”
Peter Hug, global trading director with Kitco Metals, is watching exchange-traded fund interest, including in the popular gold-tracker SPDR Gold Shares GLD, +0.66%
“Inflow into ETFs have begun to accelerate,” said Hug in a recent commentary. “This is the vehicle used primarily by fund managers, and either they believe gold is cheap at $1,225 or they are becoming increasingly concerned of a ‘tipping’ event on the near-term horizon.”
“Technically, we would like to see gold break above the $1,237 level. We’ll leave a little on the table until we get this confirmation,” he said. Conversely, downside support remains at $1,220, said Hug, and gold remains vulnerable to a test of this marker.
Saxo’s Hansen also has an eye on $1,220, which represents a 50% retracement of the significant $329-per-ounce rally logged between December 2015 and July 2016.
“For this level to hold, however, it is clear that the dollar appreciation needs to pause or reverse, especially against the yuan,” said Hansen.
Appleseed’s Strauss believes stocks and their relative value justify diversification that includes gold. The S&P 500 has an overall P/E ratio, based on the past 12 months, of 24.9, according to S&P Global Inc. The average of the trailing P/E ratio of the index going back to 1960 is 19.2.
And some of the metal’s fate, though not its longer-term durability, resides with the rate-hiking Federal Reserve and Treasury yields TMUBMUSD10Y, +0.35% Higher rates in bonds lure demand away from haven gold, although that is only when higher yields offer enough compensation for inflation.
“The common fix for out-of-control debt/GDP ratios [in major economies] is to ‘inflate’ your way out of it,” Strauss said. “Consider that and the fact that while nominal interest rates are rising, real interest rates, when higher inflation is factored in, are still largely negative. That’s an environment in which gold has historically performed well.”
Trump Trade and Currency Wars With China – Goldnomics Podcast
Gold prices crawl up on steady dollar (Reuters.com)
Gold Prices Hover Near 17-month Lows as Dollar Weighs (Investing.com)
US sanctions on Iran to target gold, carpets and more (WebFQ.com)
Credit: Reuters
Gold—even at its lowest levels in 2018—is behaving just as prescribed (MarketWatch.com)
SWOT Analysis: Is The Dollar Near Its Peak? (GoldSeek.com)
The Federal Reserve As An Engine Of Deflation (sic!) (24HGold.com)
Listen on SoundCloud , Blubrry & iTunes. Watch on YouTube below

Gold Prices (LBMA AM)
06 Aug: USD 1,212.00, GBP 934.94 & EUR 1,048.26 per ounce
03 Aug: USD 1,207.70, GBP 928.60 & EUR 1,042.97 per ounce
02 Aug: USD 1,217.60, GBP 931.22 & EUR 1,048.23 per ounce
01 Aug: USD 1,222.75, GBP 932.47 & EUR 1,046.55 per ounce
31 Jul: USD 1,219.20, GBP 926.71 & EUR 1,039.86 per ounce
30 Jul: USD 1,222.05, GBP 931.20 & EUR 1,045.95 per ounce
27 Jul: USD 1,219.15, GBP 931.06 & EUR 1,048.10 per ounce
Silver Prices (LBMA)
06 Aug: USD 15.35, GBP 11.86 & EUR 13.30 per ounce
03 Aug: USD 15.36, GBP 11.81 & EUR 13.26 per ounce
02 Aug: USD 15.45, GBP 11.78 & EUR 13.29 per ounce
01 Aug: USD 15.48, GBP 11.79 & EUR 13.24 per ounce
31 Jul: USD 15.43, GBP 11.72 & EUR 13.15 per ounce
30 Jul: USD 15.49, GBP 11.81 & EUR 13.25 per ounce
27 Jul: USD 15.36, GBP 11.72 & EUR 13.20 per ounce
Recent Market Updates
– Jim Rogers – Making China Great Again! (Video)
– This Week’s Golden Nuggets
– Gold to Enter New Bull Market – Charles Nenner
– Here’s Where the Next Crisis Starts
– House prices aren’t just slipping in the UK – this is global
– Russia Sells 80% Of Its US Treasuries
– Are China’s Gold Reserves Slowly Rising?
– Gold Outlook In H2 2018
– Gold Production In South Africa Continues To Collapse – Plummets 85% From Peak In 1970 (VIDEO)
– Physical Gold Is The “Best Defence” Against “Escalating Currency Wars”
– Trump and War With China? Goldnomics Podcast
– Weekly Digest – News, Market Updates and Videos You May Have Missed
– Financial Terrorism In The UK – Collusion between Government, Regulators & Two Bailed-Out UK Banks

Andrew Maguire’s Kinesis money which is a “bitcoin” but backed 100% by allocated gold and silver is set to go.
it think it would be a great idea to look at this!
please read at: https://kinesis.money/#/
(Andrew Maguire)
|
|
Dear Harvey Organ,
Thank you for your participation in our webinar on June 7th with our host and CEO of Kinesis, Thomas Coughlin.
The response we received has been incredible, we appreciate you taking the time to join us and hope you found it to be beneficial.
Due to such a high influx of questions we received we were unable to have them all answered. Nevertheless, if there was anything which requires more clarification, or you have a query which needs to be rectified, we invite you to join our telegram group:
We apologize for the technical issues we incurred during the webinar which resulted in it running a little over schedule, we hope that the next one we host will run seamlessly.
A video has been put together and uploaded onto our YouTube channel which can be found here:
Please share and subscribe to our YouTube channel to be notified of all the latest videos as they become available.
The rapid growth that we are currently experiencing has been incredible and with your support, is only going to get better.
We are working behind the scenes very hard to create a better experience for everyone involved! Stay tuned in as we have many more announcements to be released in the upcoming days.
Kind Regards,
 |
Kinesis Money
a:C/O ILS Fiduciaries (IOM) Limited, First Floor,Millennium House, Victoria Road, Douglas, Isle of Man IM2 4RW
   |
The following is self explanatory
(courtesy GATA/Chris Powell and Harvey Organ)
GATA asks bank regulator to check risks of gold
futures maneuver
Submitted by cpowell on Sun, 2018-06-10 16:17. Section: Daily Dispatches
12:21p ET Sunday, June 10, 2018
Dear Friend of GATA and Gold:
GATA has appealed to the U.S. comptroller of the currency, who has regulatory authority over banks, to review financial risks certain banks may have incurred through derivatives in the monetary metals markets, particularly through the recent heavy use of the “exchange for physicals” mechanism of settling gold and silver futures contracts on the New York Commodities Exchange.
The appeal was made in a letter sent May 5 to the comptroller, Joseph M. Otting, whose office is part of the U.S. Treasury Department, by your secretary/treasurer and GATA futures market consultant Harvey Organ.
“Exchange for physical” settlements of futures contracts long were considered emergency procedures when a seller was not able to deliver metal from an exchange-approved warehouse and wanted to settle with delivery elsewhere. But now such settlements appear to constitute most gold and silver futures settlements on the Comex. It is a strange development that appears to have been necessitated by the increasing difficulties of central banking’s gold and silver price suppression policy.
GATA has received no acknowledgment of the letter. Its text is below and a PDF copy of it is here:
http://www.gata.org/files/ComptrollerOfCurrencyLetter.pdf
CHRIS POWELL, Secretary/Treasurer
Gold Anti-Trust Action Committee Inc.
CPowell@GATA.org
* * *
May 5, 2018
Joseph M. Otting, Comptroller of the Currency
U.S. Treasury Department
400 7th Street, SW
Washington DC 20219
Dear Comptroller Otting:
Please let us bring to your attention financial risks to major banks involving their possibly unreported exposure to derivatives in the monetary metals markets.
In recent months gold and silver future contracts issued by U.S. banks on the New York Commodities Exchange have been moved off-exchange for delivery through a mechanism known as “exchange for physical” (EFP) contracts. Until recently use of this mechanism was considered an emergency procedure when a seller did not have access to metal for delivery through Comex warehouses. Now the mechanism seems to be in use for a large share of front-month contracts for which delivery is sought.
Here is an example that is happening at the Comex in the front active month of April for gold and the inactive delivery month of April for silver.
In gold, there were 229,436 EFP contracts for 713.64 tonnes, an average of 10,925 contracts and 1,092,500 ounces per trading day.
In silver, there were 77,150 EFP contracts for 385,750,000 ounces, an average of 3,673 contracts and 18,369,000 ounces per trading day.
London Bullion Market Association rules suggest that these contracts may not be reported to regulators. The LBMA’s bylaws say:
“Figures above exclude any contracts not subject to risk-based capital requirements, such as FX contracts with an original maturity of 14 days or less, futures contracts, written options, and basis swaps. Therefore, the total notional amount of derivatives by maturity will not add to the total derivatives figure in this table.”
We are told that these EFP contracts are transferred from the Comex to London as what are called “serial forwards” and their duration is always less than 14 days, which exempts them from being reported.
It is our understanding that in each quarter your office prepares a report detailing risk undertaken by the banks under the comptroller’s supervision.
These risks include derivatives undertaken by U.S. banks and other obligations that may cause a bank to fail. Our concern is that your office may not be aware of large unreported derivative exposure by banks.
Could you review this matter and let us know your conclusions?
Sincerely,
CHRIS POWELL
Secretary/Treasurer
HARVEY ORGAN
Consultant
Gold Anti-Trust Action Committee Inc.
7 Villa Louisa Road
Manchester, Connecticut 06043-7541
end
The truth behind the true intentions of the LBMA
(courtesy zerohedge)
Ronan Manly: Videos conceal LBMA’s true purpose, controlling gold for central banks
Submitted by cpowell on Mon, 2018-08-06 22:07. Section: Daily Dispatches
6:08p ET Monday, August 6, 2018
Dear Friend of GATA and Gold:
Bullion Star gold researcher Ronan Manly today demolishes a series of informational videos created by the London Bullion Market Association purporting to explain the organization’s role in the world gold market but actually concealing that the organization is the creation and tool of the Bank of England and the cover for central banking’s suppression of the price of the monetary metal.
Manly writes: “Nowhere in the ‘Who we Are’ video does it mention that the LBMA system trades vast quantities of unallocated, fractionally-backed, synthetic gold positions, that the LBMA publishes no reporting of any trades in the London market, that the LBMA gold and silver auctions are dominated by its powerful bullion bank members, that the LBMA oversees the secretive London Precious Metals Clearing Limited cartel for paper gold and silver, and that there is a hidden gold lending and gold swapping market in London between central banks and bullion banks, facilitated by the Bank of England.”
…
The videos make “no reference to the secretive gold lending market between central banks and bullion banks, a market where outstanding ‘gold deposits’ owned by central banks are constantly passed around between the LBMA bullion banks and never closed.”
That is, the primary function of the LBMA — assisting central banks with defeating a competitive and independent international reserve currency — is concealed.
Manly’s expose of the LBMA’s disinformation campaign is headlined “LBMA at the Movies: Golden Turkeys” and it’s posted at Bullion Star here:
https://www.bullionstar.com/blogs/ronan-manly/lbma-movies-golden-turkeys…
CHRIS POWELL, Secretary/Treasurer
Gold Anti-Trust Action Committee Inc.
CPowell@GATA.org
Kevin Muir is correct on his latest commentary with respect to the perfect correlation between the price of gold and the value of the yuan. The higher the yuan , the higher the price of gold and visa versa. But the Chinese are not sellers of gold. They are only buyers. So when gold is whacked, it is the uSA bankers that are selling paper gold in dollars and it is the Chinese that are the buyers of gold at a relatively stable yuan price.
(courtesy Kevin Muir/Macro Tourist blog)
Gold: Have The Chinese Changed The Way They Look
At It?
Authored by Kevin Muir via The Macro Tourist blog,
At the risk of alienating all my readers who view gold as a barbarous relic, I am chancing one more post to expand on my ideas regarding the correlation between gold and the Chinese currency.

Although some readers got a chuckle out of my article Gold: Come’on – Admit it – You want to own it, there was also a bunch of pushback on the idea that the Chinese were pegging the price of gold in CNY.
“Why would they do that?”
“To what end?”
And I guess I purposely left out the details, instead I choose to focus on the correlations and leave it to readers to draw their own conclusions.
And before I give you my theories as to the reasons behind the relationship, let’s have a look at how the correlation has fared since I wrote about it last.

Still trading on top of one another. In fact, it’s almost tick for tick.
Speaking of tick for tick, the great twitter account of @TickByTick_Team created a terrific chart that demonstrated the collapse in the volatility of gold priced in CNY. I have recreated using the 90-day historical volatility, but it doesn’t matter which time frame you use – the end result is that gold priced in CNY has become a lot less volatile.

I am sympathetic to the idea that China would never bother to peg the price of gold. Pegging implies that you would be willing to both buy and sell it to keep it at a certain level. I don’t believe that China has any interest in selling even the tiniest little bit of their gold reserves to keep it at a certain price.
But I do believe the Chinese are managing the price of gold priced in CNY. They have in essence provided a floor at which they are willing to accumulate gold. They don’t bother selling it when it rises above that level, but when the gold price descends into their buy zone, they are there with stacks of blues.
So why is the price of gold going down recently? Well, if we assume that China is one of the biggest buyers of gold, when their currency depreciates, their bid for gold priced in US dollars falls.
The price of gold has not been pegged in CNY, it is merely being bought in that currency. The Chinese have fundamentally changed the way they look at gold. Instead of pricing it in US dollars, they are pricing it in CNY. And they are bid. For size.
end
Best news of the day: Gartman exited his gold investments.
He always gets it wrong
Dennis Gartman..
end
Your early TUESDAY morning currency, Asian stock market results, important USA/Asian currency crosses, gold/silver pricing overnight along with the price of oil Major stories overnight/9 AM EST
i) Chinese yuan vs USA dollar/CLOSED UP TO 6.8260/HUGE DEVALUATION FOR THE PAST TWO WEEKS STOPS //OFFSHORE YUAN: 6.8324 /shanghai bourse CLOSED UP 74.22 POINTS OR 2.74% /HANG SANG CLOSED UP 143.28 POINTS OR 0.52%
2. Nikkei closed UP 155.42 POINTS OR 0.69%/USA: YEN FALLS TO 111.14/
3. Europe stocks OPENED DEEP INTO THE GREEN //USA dollar index FALLS TO 95.08/Euro RISES TO 1.1597
3b Japan 10 year bond yield: RISES TO . +.12/ !!!!(Japan buying 100% of bond issuance)/Japanese yen vs usa cross now at 111.14/ THIS IS TROUBLESOME AS BANK OF JAPAN IS RUNNING OUT OF BONDS TO BUY./JAPAN 10 YR YIELD IS NOW TARGETED AT .11%/JAPAN LOSING CONTROL OF THEIR BOND MARKET
3c Nikkei now JUST BELOW 17,000
3d USA/Yen rate now well below the important 120 barrier this morning
3e WTI:: 69.68 and Brent: 74.72
3f Gold UP/Yen UP/YUAN UP
3g Japan is to buy the equivalent of 108 billion uSA dollars worth of bond per month or $1.3 trillion. Japan’s GDP equals 5 trillion usa./“HELICOPTER MONEY” OFF THE TABLE FOR NOW /REVERSE OPERATION TWIST ON THE BONDS: PURCHASE OF LONG BONDS AND SELLING THE SHORT END
Japan to buy 100% of all new Japanese debt and by 2018 they will have 25% of all Japanese debt. Fifty percent of Japanese budget financed with debt.
3h Oil UP for WTI and UP FOR Brent this morning
3i European bond buying continues to push yields lower on all fronts in the EMU. German 10yr bund FALLS TO +.400%/Italian 10 yr bond yield DOWN to 2.88% /SPAIN 10 YR BOND YIELD DOWN TO 1.39%
3j Greek 10 year bond yield FALLS TO : 4.00
3k Gold at $1214.25 silver at:15.45 7 am est) SILVER NEXT RESISTANCE LEVEL AT $18.50
3l USA vs Russian rouble; (Russian rouble UP 27/100 in roubles/dollar) 63.49
3m oil into the 69 dollar handle for WTI and 74 handle for Brent/
3n Higher foreign deposits out of China sees huge risk of outflows and a currency depreciation. This can spell financial disaster for the rest of the world/
JAPAN ON JAN 29.2016 INITIATES NIRP. THIS MORNING THEY SIGNAL THEY MAY END NIRP. TODAY THE USA/YEN TRADES TO 111.14 DESTROYING JAPANESE CITIZENS WITH HIGHER FOOD INFLATION
30 SNB (Swiss National Bank) still intervening again in the markets driving down the SF. It is not working: USA/SF this morning 0.9945 as the Swiss Franc is still rising against most currencies. Euro vs SF is 1.1504 well above the floor set by the Swiss Finance Minister. Thomas Jordan, chief of the Swiss National Bank continues to purchase euros trying to lower value of the Swiss Franc.
3p BRITAIN VOTES AFFIRMATIVE BREXIT/LOWER PARLIAMENT APPROVES BREXIT COMMENCEMENT/ARTICLE 50 COMMENCES MARCH 29/2017
3r the 10 Year German bund now POSITIVE territory with the 10 year FALLING to +0.40%
The bank withdrawals were causing massive hardship to the Greek bank. the Greek referendum voted overwhelming “NO”. Next step for Greece will be the recapitalization of the banks and that will be difficult.
4. USA 10 year treasury bond at 2.95% early this morning (THIS IS DEADLY TO ALL MARKETS). Thirty year rate at 3.10%
5. Details Ransquawk, Bloomberg, Deutsche bank/Jim Reid.
(courtesy Jim Reid/Bloomberg/Deutsche bank/zero hedge)
S&P On Verge Of All Time High As China Stocks
Soar Most In 2 Years
Perhaps due to a lack of further trade war escalation, it is a sea of green in risk assets as overnight global stocks pushed toward a six-month high following the biggest jump in Chinese stocks in over two years and an upbeat start for Europe followed Wall Street’s best close since January, with the S&P now just 22 points points away from breaching its all time high of 2,873 reached on January 26, as the dollar slipped against most currencies, Treasuries dipped and the Turkish Lira resumed its record drop.

After dropping near 2018 lows at the close on Monday, on Tuesday China’s Shanghai Composite led Asian markets higher, soared in today’s session, posting its biggest gain in two years on hopes for more policy support for investment and extending gains in late afternoon trading as investors snapped up stocks amid speculation that liquidity would be added to markets after reported approval of some retirement fund products. Rumors that Beijing would approve retirement fund products to invest funds served as an immediate upside catalyst as it brought the prospect of new funds entering the market, said Zhongtai Securities. The sharply upbeat mood lifted overnight as Chinese stocks rebounded 2.7% following a four-day selloff that had knocked them down about 6% .

Chinese sentiment was also boosted by an unexpected increase in Chinese FX reserves, which increased from $3.112TN in June to $3.118TN in July, defying expectations of a modest drop to $3.1TN. The rise in reserves helped squash speculation that the recent plunge in the Yuan had resulted in capital outflow (whether or not the data is accurate or credible is a different matter entirely), and as a result the Yuan jumped, with the USDCNH sliding 300 pips from 6.865 to 6.835, further boosting Asia’s risk-on mood.

China’s FX Regulator says cross-border capital flows and FX reserve levels will remain stable overall adding that financial assets price fluctuations and changes in non-dollar currencies led to the rise in FX reserves in July, while noting that the fluctuation of the Yuan has increased significantly.
Asian optimism spilled over into European trade, where miners were among the big gainers in the Stoxx Europe 600 Index as commodities climbed. London, Paris and Frankfurt followed by rising 0.6 to 0.9% as Europe’s investors cheered results from Italy’s biggest bank UniCredit and oil firms gained on the rise in crude prices.
Meanwhile, in the US, the S&P 500 closed at its highest level since Jan. 29 overnight, less than 1 percent from its record high hit earlier that month. The VIX closed at its lowest since Jan. 26, the VIXtermination event of February 5 largely forgotten. A surge in U.S. corporate earnings, accompanied by a record number of companies beating estimates driven by tax cuts has prompted the likes of Citi to upgrade their end-2018 and 2019 earnings forecasts.
SocGen’s FX strategist Kit Juckes summarized the mood simply as follows: “The Chinese have stabilized the yuan, the lira hasn’t been annihilated this morning so once the sharp FX moves have calmed down and as long as the (company) earnings are good, you have a more risk friendly environment.”
And speaking of currency markets, the big story was the decline in the dollar as investors unwound longs amid thin volumes in the majors, typical of summer trading conditions according to Bloomberg. The euro bounced to $1.1593 from a near six-week low despite a second day of disappointing German economic data, while Britain’s pound made back some ground after Brexit worries had pushed it to an 11-month low.
Turkey’s lira initially recovered 1.7% from Monday’s losses of more than 5% after a report by CNN Turk that Turkish officials would go to Washington to discuss the strained relations helped the rise; however gains were quickly reversed and the Lira has since resumed its unprecedented collapse, approaching record low levels, and which many speculate will eventually end in capital controls. Already struggling with inflation at 14-year highs near 16% and political pressure from the president on the central bank not to raise interest rates, the lira’s year-to-date losses are nearing 30 percent as jitters about foreign currency debt payments rise.

“Currently the impact of the lira’s slide is mostly contained within the country. But fears of a default will begin to increase if the currency keeps depreciating,” said Kota Hirayama, senior emerging markets economist at SMBC Nikko Securities. “Such a development could affect some European financial institutions,” he added.
On the Brexit front, overnight news reports suggested that PM May is losing support due to her Chequers plan and some see her departure as essential to salvaging the Brexit. UK PM May has been blamed for the disorganised preparations for a no-deal Brexit as businesses need to be advised on how to get ready for the possibility. Civil servants have been ordered to compile 70 “technical notices” by month-end to explain to businesses how to prepare for no-deal scenario. Meanwhile, the UK is said to see Brexit deal deadline pushing back to November as UK PM May resists the EU’s timetable for Brexit talks while she believes US President Trump may help her
In rates, treasuries held steady with a slightly flatter curve. Euro-area bonds traded mixed. RBA boosted Aussie longs after projecting higher inflation levels in the next two years. Curiously, rates on German bunds were pinned near their lowest levels in almost two weeks as concerns about global trade and turbulence in Italy continued to support demand for the least risky assets; and yet none of these concerns have spilled over to other risk assets.
Overnight, the RBA kept its Cash Rate Target unchanged at record low 1.50% as expected and reiterated that it judged steady policy was consistent with growth and inflation targets, while it repeated that low rates are supporting the economy. RBA also stated that wage growth remains subdued which is likely to continue for a while and that it sees headline CPI to be lower than expected this year.


Anthony Barton@AntBarton89RBA Statement Changes
In commodities, oil extended the previous day’s rally after the imposition of U.S. sanctions against major crude exporter Iran took effect on Tuesday. Brent crude oil futures shook off earlier weakness and were 0.33 percent higher at $73.99 a barrel. They had gained 0.75 percent on Monday after OPEC sources said Saudi production had unexpectedly fallen in July. The drop in the dollar helped metals, with copper rising 0.5% at $6,161.50 a tonne after retreating more than 1% the previous day. Gold, which is stuck near a one-year low, crawled 0.2% higher to $1,208.06 an ounce
Looking at today’s calendar, data include consumer credit. US earnings to look out for today include Emerson Electric (06:30 EDT), PPL Corp (07:40 EDT) and Walt Disney (16:05 EDT)
Market Snapshot
- S&P 500 futures up 0.3% to 2,857.00
- STOXX Europe 600 up 0.6% to 390.91
- MXAP up 0.8% to 166.36
- MXAPJ up 0.8% to 538.19
- Nikkei up 0.7% to 22,662.74
- Topix up 0.8% to 1,746.05
- Hang Seng Index up 1.5% to 28,248.88
- Shanghai Composite up 2.7% to 2,779.37
- Sensex up 0.07% to 37,719.71
- Australia S&P/ASX 200 down 0.3% to 6,253.94
- Kospi up 0.6% to 2,300.16
- German 10Y yield rose 1.3 bps to 0.402%
- Euro up 0.2% to $1.1578
- Italian 10Y yield fell 2.2 bps to 2.635%
- Spanish 10Y yield fell 0.3 bps to 1.395%
- Brent futures up 0.5% to $74.09/bbl
- Gold spot up 0.4% to $1,212.20
- U.S. Dollar Index down 0.2% to 95.20
Asian equity markets traded mostly higher following the positive performance in their US counterparts where the Nasdaq led the advances and the S&P 500 notched a 3rd consecutive gain to move to within 22 points from all-time highs. Nikkei 225 (+0.6%) was higher as focus remained on earnings with SoftBank and Rakuten among the top gainers in the index after both reported solid profit growth, while ASX 200 (-0.3%) lagged its regional peers with the index dragged by weakness in telecoms and miners. Elsewhere, Hang Seng (+1.5%) and Shanghai Comp. (+2.7%) were positive with property developers underpinned by strong guidance including Country Garden and Evergrande Real Estate, although price action was far from smooth with a bout of intraday volatility in Chinese bourses after the PBoC continued to withhold from liquidity operations and amid lingering trade uncertainty. Finally, 10yr JGBs were little changed with only minimal losses seen amid gains in stocks and as the Japanese 10yr yield remained above 0.11%, while participants the 10yr inflation-indexed bond auction also failed to spur demand as b/c and lowest accepted price declined from prior. China is to soon adopt policies to boost credit and investment, according to Chinese press reports.
Top Asian News
- BOJ Considered Raising Rates Before Tweaks, Reuters Says
- China Is Said to Push for Arbitrage Cap on London Stock Link
- China Stocks to Get Even Cheaper as Money Ball Favors Bonds
- China Foreign Exchange Reserves Rise Despite Weaker Yuan
- China Tower Giant IPO Leaves Hong Kong Retail Investors Cold
European equities trade firmly in the green (Eurostoxx 50 +0.8%), mimicking the performance seen on Wall St. and the AsiaPac session. Broad-based gains are seen across all sectors while the energy sector outperforms on oil price action. In terms of notable European earnings, Commerzbank (-2.0%) shares are lower post-results as the bank slightly adjusted their outlook due to “intense competition”, while Denmark’s Pandora (-16.5%) rests at the bottom of the Stoxx 600 following a guidance cut.
Top European News
- U.K. House Prices Rose to Record High in July, Halifax Says
- Salvini Slaps at Spain for Immigration That’s Run Out of Control
- Arsenal Owner Kroenke to Buy Usmanov’s Stake in Soccer Club
- Ex-Comedian Expects to Get Mandate to Form Slovenian Government
In FX, AUD was the clear G10 front-runner on several supportive factors, as Aud/Usd regains a firmer foothold above 0.7400 to print a marginal new August high (0.7437) having held in above chart support in the interim, and the Aud/Nzd cross trades above 1.1000 to expose 1.1025 resistance again. No lasting drag on the Aud from the latest RBA policy meeting and statement that was essentially a repeat of the previous version and several before that, with the ongoing mantra that rates are appropriate at current levels and are likely to remain apt for some time to come given the slow evolution of inflation and wage growth. CAD/EUR – The Loonie is next best major performer vs the Usd, albeit only just eclipsing the single currency and Kiwi as the Greenback loses some momentum across the board (DXY around 95.200 vs 95.500+ yesterday) EMs also off recent lows). Usd/Cad is back below 1.3000 and eyeing strong support at 1.2961 (100 DMA) before 1.2950, while Eur/Usd has bounced a bit further from Monday’s 1.1530 multi-week base towards 1.1600, but not quite testing the big figure, yet. EM – As noted, some respite for regional currencies after a dip in the Cny mid-point fixing and more efforts by Turkey to arrest the Lira’s slide alongside reports that mediation with the US has been successful to a degree. Usd/Try around 5.2400 vs 5.4250 at the new/latest all time low).
In commodities, WTI and Brent are showing mild gains as the futures hold onto the USD 69.00/bbl and USD 74.00/bbl handles respectively. US reimposed the first round of sanctions against Iran which will cover the auto sector, gold and key metals, while crude sanctions are not expected until November. Oil traders will be looking out for the latest API Inventory numbers released later today. In the metals complex, spot gold is prints fresh highs for the day, moving in-step with USD action, while London copper edged higher amid ongoing concerns revolving around Chile’s Escondida mine, the world’s largest copper mine. In the latest developments, BHP is said to seek a 5-day mediation by Chile’s government in contract discussions to avoid a strike at the copper mine, while there were also reports the union at the copper mine was preparing a strike contingency plan as it awaited the final response from the company. Of note: on Monday, Escondida copper workers union said half of members have voted in which around 80% voted to reject the final contract offer. Kuwait stopped operations at Shuwaikh and Shuaiba ports while also stopping navigation at the Doha port due to bad weather
Looking at the day ahead, in Europe we’ll get the June trade balance, current account balance and industrial production data for Germany (3.0% yoy expected) along with the June trade balance and current account balance data for France. House price data for the UK for July will also be out. In the US the June JOLTS job openings and consumer credit data are due out. China’s July foreign reserves data is also scheduled to be released at some stage. Walt Disney will also release earnings.
US Event Calendar
- 10am: JOLTS Job Openings, est. 6,625, prior 6,638
- 3pm: Consumer Credit, est. $15.0b, prior $24.6b
DB’s Jim Reid concludes the overnight wrap
It hasn’t really been a 24 hours where there was much need to try to manipulate the weather as there wasn’t really a lot going on to encourage much activity. Having said that the S&P 500 (+0.35%) closed higher for the third day and is now at the highest level since Jan. 26th and only 22.5 points (or 0.8%) off the all-time highs. In fact it’s only closed higher on two days in history – both in January this year. Meanwhile the VIX returned to the lowest level since late Jan. at 11.27. For the US market it’s almost as if the last 6 months hasn’t happened and we’ve been transported back to the hours just before everything changed after the rogue AHE print in the payroll report on February 2nd. As an aside the Stoxx 600 is down -1.23% from the day prior to that payroll print 6 months ago (S&P 500 +1.01%) and China’s Shanghai Comp. index is down -21.52% over the same period.
This morning in Asia, equities are nudging higher with the Nikkei (+0.61%), Kospi (+0.24%) and Hang Seng (+0.96%) all up while the Shanghai Comp. (+1.43%) is leading the gains. There has been some talk that the gap between the index’s earnings yields and 5y AAA rated corporate bond yields are the highest since March 2016. As for data, Japanese workers’ June real wages rose at the fastest pace in 21 years as it jumped +2.8% yoy (vs. 0.9% expected). Our Japanese economists noted there were large positive contributions from overtime pay and bonuses, but regular wages are also holding steady at relatively high levels of 1.3% while real wages are also rising. Meanwhile Reuters cited unnamed sources which noted that the BoJ had considered hiking rates twice this year before market volatility in Jan/Feb and weaker inflation data derailed the plan, which in part suggests that BoJ policy can be fluid and data dependent. Further the article noted the policy tweaks introduced in the July meeting was partly aimed at appeasing the two sides who were concerned about prolonged stimulus efforts and others who were opposed to a quick exit.
Elsewhere there has not been much tangible developments on trade, but Reuters noted that the official Chinese Daily newspaper wrote this morning that the US’s belief that a fall in Chinese equities was a sign of the US winning the trade war was in fact “wishful thinking”. Elsewhere yesterday the ECB’s Nowotny told the Der Standard that he supports a “faster” normalisation of monetary policy and added that “a slow increase” in rates would not harm the EU economy. Now turning to other market performance from yesterday. In Europe, equities were broadly weaker on light volumes with the Stoxx 600 (-0.13%) weighed down by materials and financials stocks, as the latter was impacted by a softer than expected results from HSBC (-1.01%). Across the region, the DAX (-0.14%) and CAC (-0.03%) dipped while the FTSE edged up +0.06%. Over in the US, the S&P reversed earlier declines to close +0.35% while the Nasdaq rose for the fifth straight day (+0.61%). The stronger overall performance was partly due to gains in energy stocks and Berkshire Hathaway’s above market results (+2.34%), while Facebook also climbed +4.45% following a WSJ report which suggested the company is seeking deeper relationships with banks as part of an overall effort to offer new services to its users.
Meanwhile core government bonds were firmer across the board with 10y yields on Bunds (-1.8bp), Gilts (-2.6bp) and OATs (-2.4bp) all down. Treasuries nudged -1bp lower to the lowest since July 20th while the 2s10s also flattened -1.3bp to 29.3bp. Following on with the yield curve theme, our US economists believes the spot yield curve is inadequate for identifying future recession risks.
They’ve used a principal component analysis (PCA) and show that the yield curve is currently signalling low recession odds over the next year, at around 10%. Overall, their analysis reinforces their view that a more complete signal from asset prices suggests that recession risks are low over the coming year, supporting a continuation of the Fed’s gradual rate hikes. However, recession risks do rise more appreciably two and three years ahead. Refer to their note for details.
Turning to currencies, the US dollar index firmed +0.21% while Sterling fell -0.44% to a fresh 11-month low, in part reflecting Trade Secretary Fox’s weekend forecast that there was a 60% chance of the UK not reaching a Brexit deal with the EU. Notably yesterday a spokesman for PM May (James Slack) reiterated that “we continue to believe that the most likely outcome is reaching a good deal (with the EU)…” Elsewhere the Turkish Lira dropped -4.89% to a fresh record low despite the central bank’s move to tweak reserve requirements lower and inject liquidity into the banking sector yesterday. This morning, the Lira is rebounding c1% but is still down around -39% versus the Dollar on a calendar YTD basis.
Over in commodities, WTI oil rose +0.76% following Bloomberg reports of Saudi Arabia production cuts and labour strikes resuming in the North sea, which have likely added to concerns of tightening oil supply.
Before we take a look at today’s calendar, we wrap up with other data releases from yesterday. In the US, the latest Fed’s quarterly Senior Loan Officer survey indicated that banks have kept lending standards on commercial real estate (CRE) and auto loans broadly unchanged while standards on commercial and industrial (C&I) loans and mortgages were eased. Notably a “moderate” share of banks tightened standards on credit card loans. In terms of lending demand, banks reported stronger demand for C&I loans by small firms, but total demand was weaker for CRE loans and mortgages.
Over in Germany, the June factory orders fell more than expected at -4% mom (vs. -0.5%) and were down -0.8% yoy (vs. 3.4% expected) – the first annual decline since July 2016. DB’s Stefan Schneider noted it was an across the board decline with foreign demand weaker than domestic demand. Notably more concerning was the 4.7% drop in capital goods, which he believes should be seen as evidence that the uncertainty related to the current tariffs dispute is hitting investment spending. Meanwhile the Euro area’s August Sentix investor confidence index rose 2.6pt from July to an above market print of 14.7 (vs. 13.4 expected).
Looking at the day ahead, in Europe we’ll get the June trade balance, current account balance and industrial production data for Germany (3.0% yoy expected) along with the June trade balance and current account balance data for France. House price data for the UK for July will also be out. In the US the June JOLTS job openings and consumer credit data are due out. China’s July foreign reserves data is also scheduled to be released at some stage. Walt Disney will also release earnings.
3. ASIAN AFFAIRS
i)TUESDAY MORNING/MONDAY NIGHT: Shanghai closed UP 74.22 POINTS OR 2.74% /Hang Sang CLOSED UP 429.32 POINTS OR 1.54%/ / The Nikkei closed UP 155.42 POINTS OR 0.69%/Australia’s all ordinaires CLOSED DOWN 0.29% /Chinese yuan (ONSHORE) closed UP at 6.8260 AS POBC STOPS ITS HUGE DEVALUATION /Oil UP to 69.68 dollars per barrel for WTI and 74.72 for Brent. Stocks in Europe OPENED DEEPLY IN THE GREEN //. ONSHORE YUAN CLOSED WELL UP AT 6.8260 AGAINST THE DOLLAR. OFFSHORE YUAN CLOSED UP ON THE DOLLAR AT 6.8324: HUGE DEVALUATION/PAST SEVERAL DAYS STOPS : /ONSHORE YUAN TRADING STRONGER AGAINST OFFSHORE YUAN/ONSHORE YUAN TRADING STRONGER AGAINST USA DOLLAR/OFFSHORE YUAN TRADING STRONGER AGAINST THE DOLLAR /CHINA RETALIATES WITH TARIFFS/ TRUMP RESPONDS TO NEW TARIFFS AND IT NOW A FULL TRADE WAR COMMENCED
3 a NORTH KOREA/USA
North Korea/South Korea/USA/China
3 b JAPAN AFFAIRS
Finally Japan is witnessing a spike in wage earnings, the largest in 21 years. However they are not spending their new wealth as the slump continues
(courtesy zerohedge)
Japanese Cash Earnings Spike Most In 21 Years (But Spending Slump Continues)
In the best example of how Japan’s balance-sheet-recession has crushed the animal spirits within it is the dueling headlines tonight as cash earnings surge 3.6% YoY (most since 1997) but household spending contracted YoY for the 5th month in a row.
Japan’s labor cash earnings exploded in June (rising 3.6% YoY – the most since 1997) , more than double the +1.7% YoY expectations…

But, household spending continued to contract, dropping 1.2% YoY in June – the fifth month in a row of annual contractions…

As Goldman notes, special wages and bonuses rose 3.8% yoy (1.15 pp contribution to income), and spousal income increased 22.3% (+2.40 pp contribution). Real disposable income rose sharply by 4.8% yoy (May: +0.2%).
The consumption data comprise many categories that add noise to spending statistics such as monetary gifts, remittances (as income transfers are not a form of consumption), and automobile purchases (which cause significant sample bias due to the large amounts involved), and thus it is important to also consider core consumption, which excludes these factors. Core consumption data for June was -1.9% yoy, an improvement from -3.9% in May, but remained negative yoy.

Debt reduction or saving is the preferred allocation of excess in the land of the setting sun. As Richard Koo writes so clearly,
The key difference between an ordinary recession and one that can produce a lost decade is that in the latter, a large portion of the private sector is actually minimizing debt instead of maximizing profits following the bursting of a nation-wide asset price bubble.
Coming to America, soon.
So now what does the BoJ do?
Well get a clue from Reuters, who reports that The Bank of Japan had considered raising rates later this year before market turbulence in January and weak inflation data scuttled the plan, citing unidentified people familiar with the BOJ thinking.
“Everyone at the BOJ knows what they’re doing now is quite radical and needs amending at some point,” another source said.

end
c) REPORT ON CHINA/HONG KONG
Is China panicking? They now are using moral suasion to convince banks to avoid the herd behaviour to sell the yuan
(courtesy zerohedge)
Yuan Rebounds As PBOC Pressures Banks To
“Avoid Herd Behavior”
Is China starting to panic?
Having seen their initial attempt at stabilization of the offshore yuan fail, it appears PBOC has resorted to direct influence, reportedly telling some banks on Monday that they should make efforts to prevent ‘herd behavior’ and momentum-chasing moves when trading the yuan.
After raising FX forward reserve requirements late last week (sparking a brief vertical ramp in yuan), the selling pressure returned, apparently forcing PBOC’s hand to ‘intervene’ again by pressuring banks to avoid betting on further yuan weakness.

Bloomberg reports that, according to people familiar with the matter, PBOC official made the comments in a meeting on Monday morning with the 14 banks that provide quotations of the yuan’s daily reference rates to the central bank:
- The central bank was confident and has plenty of tools to stabilize the market.
- China will keep the yuan flexible and allow the currency to move both ways.
- Any pressures on the yuan will need to be released in a timely manner and China will not work against market forces.
- Cross-border capital flows are balanced overall, and China’s fundamentals will provide support for a stable yuan.
This move by the PBOC was followed by comments from Guan Tao, a former senior official at the State Administration of Foreign Exchange, who said that the yuan’s depreciation has been the result of market factors instead of deliberate government interventions, and there is no sign that the Chinese government is working on a currency war.
“The current weakening of the yuan is a reflection of a change in market sentiment following the change in economic fundamentals,” Guan told the Global Times on Monday.
“A short-selling sentiment is behind the relatively fast weakening rate in yuan depreciation,”Guan said.
Additionally, offshore yuan was supported overnight after China reported its foreign currency holdings increased last month despite a weakening currency and worsening outlook for exports growth. Reserves rose $5.82 billion to $3.118 trillion in July, the People’s Bank of China said Tuesday. That was higher than all estimates in Bloomberg’s survey of economists, where the median forecast was $3.107 trillion. $1.2 billion of the increase was due to valuation effects, according to Bloomberg Economics.

As Goldman notes, based on SAFE data, FX outflows were still modest in June, compared with the levels in late 2015/2016. July reserve data also suggest broadly balanced FX flows, but the subsequently released PBOC and SAFE flow data will give important information on this front.
The shift seems to suggest no attempt by Chinese officials to intervene directly to support the Yuan’s freefall (positively spun as a sign that there is no capital flight… yet)…
“The PBOC so far has not directly intervened in the FX market by burning reserves,” said Zhou Hao, senior emerging market economist at Commerzbank AG in Singapore. “So far we have not seen significant capital outflow pressures, but if the yuan drops to 7 per dollar we’ll probably see a fresh round of pressure.”
So China has now intervened (with actions and words) and blame for the yuan weakness is being placed on short speculators – now where have we heard that message before? Next stop, capital controls?
end
Meet China’s new problem: Millennials have discovered the credit card and this amount of credit is now exceeding corporation debt.
(courtesy zerohedge)
“It’s Been Crazy”: Meet The Source Of China’s Next Debt Crisis: Millennials With Credit Cards
Last October, when looking at the breathtaking growth in Chinese new debt, we pointed out the one segment where the danger was most acute: household debt, which in mid 2017 had surged by a whopping 43% in one year even as the growth across other debt categories was relatively stable.

In fact, as the next chart shows, Chinese households are on the verge of surpassing the nation’s corporations as the biggest source of credit demand.

But what was behind the surge in household loan demand? As it turns out, it was merely the reality of China’s surging prices coupled with stagnant incomes, forcing countless, mostly young Chinese residents to do what Americans have been doing for decades: charge it.
In a report on China’s brand new infatuation with consumer credit, the FT highlights the case of Tom Wang, a graduate from a middle-ranked Chinese university, who struggling to find well-paid work after arriving in Shanghai turned to the only possible source to fund his spending: credit cards.
“Using credit cards did not feel like spending money, and the debt grew and grew,” said the 26-year-old, whose starting salary of Rmb3,000 ($470) a month could not cover rent and the consumption habits he called “irrational”, such as buying the latest smartphone.
To cover repayments and keep spending, Wang took on more debt, borrowing Rmb60,000 over four credit cards , before turning to online lenders for a further Rmb70,000. The problem is that interest payments quickly “snowballed” to an untenable Rmb1,500 a month, eating up half of his entire pretax income.
Rejecting the thrifty habits of their elders, Wang is part of a generation of young Chinese consumers who – very much like their American peers – have become used to spending with borrowed money. As a result, as shown in the chart above, outstanding consumer loans – used for vehicle purchases, holidays, household renovations and buying expensive household goods – grew nearly 40% last year to reach Rmb6.8trilion.
Combined with a rapid growth in mortgage lending, which makes up most of China’s household debt, consumer loans pushed household borrowing to Rmb33tn by the end of 2017, equivalent of 40% of GDP. And, as the FT calculates, the ratio has more than doubled since 2011.

Seeing shades of US history repeating itself, some economists fear that the build up of household debt will hurt long-run consumption growth as consumers divert an increasing portion of their incomes to repayments. Large-scale defaults by consumers would put pressure on the solvency of lenders, potentially triggering a financial crisis.
While borrowing restrictions make widespread mortgage defaults unlikely, high-interest consumer loans are more risky. “It’s a Pandora’s box . . . the consumer loans industry has been booming so fast,” said Lu Weiting, chief executive of consumer debt collection company Cuimi Technology. “Over the past five years it has been crazy. The barrier to entry [for new lenders] has been low if not zero.”
While hardly rocket science, the BIS recently warned that household debt can have “negative long-run effects on consumption”, which intensify when borrowing exceeds 60% of GDP. The good news: China’s ratio of 40%, while higher than most developing country peers, is still below EU and US levels of 60 and 80% of GDP respectively. The bad news: the differential “could narrow quickly if left unchecked,” according to rating agency Fitch.
And in China, which recently ended its second brief infatuation with deleveraging as a result of the Trump trade war, debt growth is most certainly unchecked at this point, and at the current rate, consumer debt will hit 60% in about 2-3 years.
For Beijing this loan-fueled spending spreed has been good news, if only for the time being: the surge in purchasing power – all on borrowed money – helped Beijing achieve its aim of making consumption the main driver of economic growth. And, as noted above, as Beijing pushed the corporate sector to deleverage, households became the largest recipients of new credit in China’s banking system for the first time last year.
“It became harder to depend on the corporate sector to maintain growth. So the government thought it could use household leverage,” said Kaiji Chen, an economist at Emory University in the US.
It’s not just the local banks that are behind this tremendous debt tsunami: consumer loan growth has been accelerated by the emergence of hundreds of online peer-to-peer lenders who collect money from retail investors and dispense small loans to consumers, often without collateral. Banks have been reluctant to issue such loans due to the difficulties assessing the creditworthiness of individuals.
Here a problem has emerged: as the FT reports, outstanding loans on P2P platforms rose 50% just last year to total Rmb1.2 trilion, according to industry monitoring service Diyiwangdai; due to their lack of collateral, interest rates often are as high as 37%, with additional charges for late payment.
As for the core consumer, it’s the usual suspects: it is all young men and women, in their twenties: “They feel peer pressure and the importance of investing in themselves . . . It could be English classes, vocational training, weddings, travel, or buying the latest iPhone,” said Benny Li, chief executive of platform Huaxia Finance.
Meanwhile, China’s peer-to-peer lending channel is not only getting clogged up, but is in reverse. In a recent article, the WSJ reported that a string of Chinese internet lenders have already shut their doors in recent weeks, stranding investors as the economy slows and regulators tighten controls over an unruly side of the fintech sector.
Across China, more than 200 internet-based fund managers since late June have either shut down, closed parts of their operations or are reeling from cash crunches, missing executives and other problems, according to industry tracker Wangdaizhijia.
The tide began to turn against the sector as an end-of-June deadline for new stringent registration regulations approached. With a slowing economy making it difficult for some companies to pay back loans, some lenders decided to shut down,. Investors, already souring on the sector, began pulling out funds, further pinching the lending platforms.

The cascade of shutdowns caught Ji Zheng by surprise. The 31-year-old acupuncturist lost the 50,000 yuan ($7,438) he invested in Tourongjia.com when the peer-to-peer lender closed without notice earlier this month. This week, Yindou, a lender with whom he placed 77,000 yuan, shut too.
“Everyone was trying to get out. It was too late,” he said Wednesday at a Beijing police station where he and other investors went to file complaints.
The bigger problem is that aside from occasional anecdotes, nobody really knows how bad the potential P2P hole could be: The FT notes that aside from a central bank database that provides limited information, China lacks credit data on consumers. While the average US consumers’ credit history dates back 14 years, in China “you are lucky to have a few months — this is our challenge”, said Huaxia’s Benny Li.
“Where we are today is probably similar to the 70s or 80s in the US when Sears and JCPenny were issuing credit cards,” he added.
China’s first unified private personal credit information service, Baihang, launched in February and has signed up 15 platforms, but most still perform their own checks. Huaxia relies on telephone records and calls to applicants’ relatives, said Mr Li. Other companies claim to use AI systems to scour customer’s social media contacts to detect their creditworthiness.
Even with incomplete data, it is estimates that non-performing loans among China’s P2P platforms are about 8% on average — four times the official figure for the banking sector; the real number, of course, could be substantially higher. In fact, According to Lu Weiting, CEO of consumer debt collection company Cuimi Technology, the NPL ratio for the P2P sector could be as high as 15%, according to Mr Lu.
And the real punchline: the proportion of overdue loans is even higher, at a staggering 50%, often due to fraud.
This means that up to half of China’s massive P2P-issued debt could be in default in the very near future, crushing personal consumption in the process.
It gets worse.
Emory University’s Chen estimated that China’s household debt burden was equal to about 80% of total disposable income, “meaning consumption would collapse if households tried to repay all their debt at once.” it also means that at the current rate of debt growth, if one throws in a little more rate increases, all of China’s disposable income at the household level will merely go to pay interest on existing debt!
While a wave of mass defaults will likely not be permitted by the government, a more realistic worry according to analysts is that with average mortgage maturity around 16 years, mortgage repayments will crimp consumption. Chinese households use nearly 17 per cent of their monthly income to repay debt, according to the China Household Finance Survey, up from 11 per cent in 2013. For low-income households, the percentage rises to 47%.
For China, which only recently transformed into a consumer-driven economy, the result would be disastrous.
That burden could “constrain other forms of consumer discretionary spending and enfeeble authorities’ efforts to pivot the economy towards consumption-led growth”, according to Fitch. There are signs this already happening: retail sales growth slowed to 8 per cent this year, down from 12 per cent in 2013.
Still, annual income growth in recent years has averaged around 7%, meaning many households will double their incomes over the next decade, assuming of course they don’t see their debt burdens growth at a faster pace. The good news is that total household leverage is low, relative to bank deposits and other liquid assets, which amount to around Rmb147tn or 180% of GDP, according to CICC. The bad news, is that the bulk of these deposits would flee if China removed its capital controls – as we saw in 2015 – suggesting that the current equilibrium is highly unstable.
Meanwhile, China’s P2P lenders have on final hope: namely that their young borrowers — who are less burdened by mortgage debt but also have less savings to dip into — can avoid default by earning higher wages.
For some, such as the abovementioned Wang, this is indeed the case: he recently found an IT job that pays in excess of Rmb12,000 a month. He owes just Rmb80,000 — which he expects to pay off soon. “If there are no other problems, I will reach the shore next year,” he said. However, if the track record of China’s Millennial peers in the US is any indication, the vast majority of them will not be lucky enough to “grow into” higher wages, especially if the Chinese economic slowdown accelerates. Should that happen, those looking at China’s corporations for the source of the country’s next debt crisis would be surprised: the real ground zero of the next “pandora’s box” will be China’s 20-somethings armed with one, or likely many more, credit cards.
end
China escalates the verbal war with Trump: China states that the drop in Chinese stocks does not mean that the USA is winning:
(courtesy zerohedge)
China Escalates Media Attack On Trump: “Drop In Chinese Stocks Doesn’t Mean US Is Winning”
For the second consecutive day, after holdings it fire for months and stoically resisting a response to Trump’s relentless twitter assaults, China escalated its media war on Trump and one day after China’s top newspaper unleashed a coordinated attack on the US president, whom the state-run People’s Daily called “arrogant” and “deceitful”, and warned that China is “prepared to fight to the end”, on Tuesday the official China Daily described as “wishful thinking” Trump’s belief that a fall in Chinese stocks was a sign of his winning the trade war.
The China Daily was referring to Saturday tweets by Trump which claimed that “Tariffs are working far better than anyone ever anticipated. China market has dropped 27 percent in last 4 months…,” adding that the US market is “stronger than ever.”

China took offense as this indication of relative trade war strength, and said that the Chinese stock market was performing poorly long before the U.S. administration imposed tariffs, claiming that the downturn was partly due to Beijing’s attempts to cut corporate debt… although it did not explain why the market failed to rebound after Beijing resumed its re-leveraging campaign as well as promoted several other monetary and fiscal easing measures.
Chen Fengying, an expert at the China Institutes of Contemporary International Relations, said such a correlation is flawed: “President Donald Trump thought the US had won. In fact, the trade war has just begun. It is too early to tell how the trade row will evolve and affect the US and the Chinese economies, thus it is too early for the US president to reach such a conclusion,” Chen told the Global Times.
“While the performance of the Chinese stock markets has indeed been affected by the heightened trade tensions between China and the US, it cannot be concluded that a Chinese stock market slump will cause China to lose the trade war with the US.”
The Chinese yuan has been affected, in part by the trade row and its uncertain consequences, the Economic Observer reported on Monday. But the report cited Sheng Songcheng, an official at the People’s Bank of China, the central bank, as saying the yuan will not depreciate further than $1 against 7 yuan, as this is a psychologically important benchmark.
Guan Tao, a former senior official at the State Administration of Foreign Exchange, said that as of now, the yuan’s depreciation has been the result of market factors instead of deliberate government interventions, and there is no sign that the Chinese government is working on a currency war.
“The current weakening of the yuan is a reflection of a change in market sentiment following the change in economic fundamentals,” Guan told the Global Times on Monday. “A short-selling sentiment is behind the relatively fast weakening rate in yuan depreciation,” Guan said.
“There are varying views on the trade row’s impact, but personally, I believe a trade row impact will be limited to the Chinese economy. China is a major economic power, and for an economy with such a status the economic performance is determined more by internal factors than external factors,” said Guan, who is currently a senior research fellow at China Finance 40 Forum.
“Data will decide whose guess is correct. We cannot scare ourselves with some extreme stories as separate cases are by no means a reflection on the whole picture,” Guan said.
Meanwhile, lobbing its own claim for trade war superiority, the paper said Trump’s claim that “tariffs are working big time” was undermined by data showing the U.S. trade deficit climbed $3 billion to $46.3 billion in June, the first increase in four months.
The editorial in the official China Daily has underscored the increasingly aggressive stance adopted by Chinese state media against Trump, a shift from their previous approach of tempering any direct criticism against the U.S. president when one month ago, Beijing ordered China’s state media “not to use aggressive language” for Trump. Instead, China is now not only retaliating tit-for-tat to Trump’s trade war, but also responding to Trump’s tweeted offenses.
On Monday, the overseas edition of the Communist Party’s People’s Daily newspaper singled out Trump, saying he was starring in his own “street fighter-style deceitful drama of extortion and intimidation”.
As Reuters notes, Chinese state media has also been promoting the message that the country’s economy is strong enough to ride out the trade war. In a separate People’s Daily commentary, a researcher at the Commerce Ministry reiterated this stance, saying China was strong and resilient enough to weather the trade dispute.
“We absolutely have reason to believe that during this complex trade friction, and relying on the domestic market, China can continue to enhance its leading position in the global economic and industrial system,” researcher Mei Xinyu wrote.
That said, even ignoring the market and focusing just on the economy, the cracks that are forming will provide further ammo to Trump’s claim that China is feeling the damage from the extended trade war. Recent data has shown that Chinese growth has already started to cool. The government has responded by releasing more liquidity into the banking system, encouraging lending and promising a more “active” fiscal policy.
China Threatens Apple With “Anger And Nationalist Sentiment” If It Doesn’t Share The Wealth
With China having effectively exhausted the amount of US imports on which it can impose tariffs following the $50BN in tariffs slapped in June, and announcing last Friday that it is considering an additional $60BN in retaliation to Trump’s $200BN in incremental Chinese tariffs, the focus has shifted to how else China can hurt the US, aside from simply cranking up the tariff rate.
Of course, China has previously hinted at what it could do, first in March…
zerohedge@zerohedgeA Chinese Communist Party newspaper on Saturday listed U.S. companies that’d be “most damaged” if a trade war began — including Apple Inc., Intel Corp. and Boeing Co.
… and then again in April.
zerohedge@zerohedgeAPPLE, BOEING MAY GET HURT BY ACCIDENT IN TRADE WAR: XINHUA
However until now, a Chinese retaliation against the world’s most valuable company was merely floated in big picture terms and these were simply veiled threats, with China refusing to stray too far from the hypothetical.
That changed today, when an article in the state-run People’s Daily set its sights squarely on Apple, which it said has benefited from cheap labor and a strong supply chain in China and needs to share more of its profit with the Chinese people or face “anger and nationalist sentiment” amid the ongoing trade war.
The article notes that Apple recently reported that in the quarter ended June 30, sales to the greater China region rose by 19% to $9.6 billion and summarizes that “amid escalating trade friction, the company’s better-than-expected quarterly result in China was a major reason for the surge in its shares.”

However, in a tongue-in-cheek rhetorical question that is really a hint to the public, the Daily said that “the eye-catching success achieved in the Chinese market may provoke nationalist sentiment if US President Donald Trump’s recently adopted protectionist measures hit Chinese companies hard.”
As a result, should the trade war between the U.S. and China continue, it would leave Apple and other U.S. firms with substantial Chinese revenues vulnerable as “bargaining chips” for Beijing.
Th Daily then doubled down on its worst-case “hint”, warning once again that China is by far the most important overseas market for the US-based Apple, “leaving it exposed if Chinese people make it a target of anger and nationalist sentiment” and while it claims that China doesn’t want to close its doors to Apple despite the trade conflict, “but if the US company wants to earn good money in China, its needs to share its development dividends with the Chinese people.”
The suggestion is that Apple will have to either hike domestic wages, invest more in China, or – best of all – share its technology with Beijing. If it refuses, China’s population has a green light to “make it a target of anger and nationalist sentiment.”
While Apple has so far escaped unscathed by the escalating trade war, and contrary to our expectations, nationalist sentiment has not emerged pushing the local consumers again purchases of US goods, today’s Op-Ed may be a turning point, because for the first time China hints it is time to spread the wealth. Specifically the People’s Daily author writes, the “in an increasingly interconnected world, Apple is a particularly good example of global manufacturing.” And the role of China is critical “as it serves as a key production and processing base for Apple.”
Many Chinese companies have been included in Apple’s production chain to provide parts and components or assembly work. This has allowed Apple to benefit from China’s ample supply of cheap labor.
And now, it’s time to give back because “in the case of the iPhone” the article claims, “Chinese processors only get 1.8 percent of the total profits created by the device.”
Hint: it’s time for Apple to give more if it doesn’t want something unfortunate to happen to its record profits.
Apple’s contribution to job creation in China is notable, but the company enjoys most of the profits created from its Chinese business. It is impractical and unreasonable to kick the company out of China, but if Apple wants to continue raking in enormous profits from the Chinese markets amid trade tensions, the company needs to do more to share the economic cake with local Chinese people.
And finally, it appears that China has figured out that the best way to retaliate against Trump’s trade wars is not a tit-for-tat escalation in tariffs, but to hit America where it really hurts: the shareholders’ bottom line and the stock market.
The trade conflict initiated by Trump administration reminds China to re-examine China-US trade. It seems US companies doing business in China are the biggest winners from China-US trade. The Chinese market is vital for many top US brands, giving Beijing more leeway to play hardball in the trade conflict.
And just like that, China became a Democrat’s best friend, and an honorary foreign leader of the #Resistance.
end
true to his word: Trump initiates a 25% tariff on $16 billion worth of Chinese goods
(courtesy Niv Elis/the Hill)
Trump to hit China with $16B in tariffs on Aug. 23

4. EUROPEAN AFFAIRS
ECB
The debate on target 2 imbalances continues…a must read.
(courtesy Mish Shedlock/Mishtalk)
6 .GLOBAL ISSUES
CANADA/SAUDI ARABIA
The diplomatic feud deteriorates as Saudi stop buying Cdn wheat and barley. They do not buy much from Canada due to the high costs in shipping. However the Cdn dollar plummeted on the news
(courtesy zerohedge)
PETRO YUAN /SHANGHAI CHINA
China can bypass sanctions by buying oil in yuan. The question is whether the seller would take their yuan and convert to gold
(courtesy zerohedge)
‘PetroYuan’ Futures Surge Limit-Up To Record High As US Sanctions Hit Iran
China’s ‘petroyuan’ oil futures contract spiked tonight by 5% (their daily limit) to a new record high, coinciding with the re-imposition of US sanctions on Iran.
The first of two rounds of US sanctions kicked in at 12:01 am (0431 GMT), targeting Iran’s access to US banknotes and key industries, including cars and carpets.
This is the biggest daily move in China’s oil futures since the contract’s inception in March to a new high of CNY537.2…

Notably decoupling from Brent and WTI futures, suggesting a sudden burst of contract-specific buying demand in the ‘petroyuan’…

As Ritesh Jain notes, via Valuewalk.com, the Petroyuan… Tiny, Irrelevant, Nothing. Right? But who would have thought oil will start getting priced in yuan.

China can just bypass Iran sanctions by pricing oil traded in Chinese currency known as Petroyuan…
end
8. EMERGING MARKET
US Abandons Oil Sanctions To Avoid Owning Venezuela’s Collapse
Authored by Brian Scheid via Platts’ “The Barrel” blog,
Just more than a year ago, it was not a question of ‘if’, but ‘when.’
As Venezuela’s leftist leader Nicolas Maduro consolidated power in an election derided as a fraud by the international community, the Trump administration readied exacting sanctions on the South American nation’s oil sector.
“All options are on the table,” said a senior administration official during a July 2017 briefing with reporters, adding that sanctions could be imposed in a matter of days. “All options are being discussed and debated.”
Analysts widely expected sanctions on diluent the US was exporting to Venezuelan refineries first, followed by a prohibition, perhaps phased in over a matter of months, on imports of Venezuelan crude into the US. It was unclear if US refiners, who had long imported Venezuelan crude, would be allowed to continue under an interim “grandfathered” arrangement, but analysts mostly agreed that sanctions were coming.
At the time, the US was importing about 800,000 b/d of Venezuelan crude and the administration was mostly concerned about the impact an import embargo would have on US Gulf Coast refineries, which would need to look for new sources of heavy crude.
Oil sector sanctions from the US seemed so likely that then-US Secretary of State Rex Tillerson told reporters that the administration was looking at ways to soften the impact of the sanctions once they were imposed.
“We’re going to undertake a very quick study to see: Are there some things that the US could easily do with our rich energy endowment, with the infrastructure that we already have available – what could we do to perhaps soften any impact of that?” Tillerson, the former CEO of ExxonMobil, said.
A year later, the US is importing less crude from Venezuela (about 530,300 b/d in July, according to preliminary US Customs data), but Gulf Coast refiners, particularly Valero, continue to rely on these imports.

In fact, US refiners may be importing even more, if Venezuela’s oil sector was not seemingly in a death spiral. Roughly one if every five barrels of oil imported by US Gulf Coast refiners comes from Venezuela.
The EIA forecasts Venezuelan oil production to fall below 1 million b/d by the end of this year, down from 2.3 million b/d in January 2016 as joint ventures fall apart and PDVSA, the state-owned oil company, struggles to feed, let alone pay, its workers. PDVSA has notified international customers than it cannot fully meet crude supply commitments and the country’s active rig count has fallen below 30, according to Baker Hughes International Rig Counts.

By the end of 2019, Venezuelan crude oil output is expected to plummet to 700,000 b/d, making it likely that it will produce less than the US state of New Mexico.
“We’ve never seen an industry or a country collapse this fast and this hard,” said EIA analyst Lejla Villar in a recent interview with the S&P Global Platts Capitol Crude podcast. “We’ve never seen anything like this.”
Industry collapse
The downfall of Venezuela’s chief industry, coupled with International Monetary Fund predictions that inflation in the country will skyrocket to 1 million percent by the end of this year, have created an unusual scenario, in which Maduro may even welcome US sanctions on its oil sector. As Venezuela’s economy continues to unravel, leading to surging prices and rampant hunger, Maduro could try to pin the blame on sanctions.
“If you break it, you buy it,” said George David Banks, a former international energy and environment adviser to President Trump. “The White House doesn’t want to own this crisis.”
The US has sanctioned individuals in Venezuela, including Maduro; prohibited the purchase and sale of any Venezuelan government debt, including any bonds issued by PDVSA; and banned the use of the Venezuela-issued digital currency known as the petro. But oil sector sanctions are viewed as the most powerful penalty remaining and one the Trump administration is more hesitant than ever to use.
“There’s already a humanitarian crisis, but we don’t own that, the Maduro government owns that,” Banks said. “We don’t want to lose the people of Venezuela and you don’t want to pursue a policy that jeopardizes that.”
David Goldwyn, president of Goldwyn Global Strategies and a former special envoy and coordinator for international energy affairs at the US State Department, speculated that it would take extreme action, such as a military assault on a civilian rebellion, for the US to now impose oil sector sanctions. “The system is collapsing and this administration does not want to own the collapse,” Goldwyn said.
The path ahead for Venezuela’s oil sector has, likely, never been less certain. And it remains to be seen what a full collapse of an economy looks like. It is clear, however, that the US wants to avoid blame for accelerating that collapse and has abandoned, at least for now, consideration of oil sanctions.
When Venezuela’s oil sector hits rock bottom, the US does not want to be accused of dragging it there.
Your early morning currency/gold and silver pricing/Asian and European bourse movements/ and interest rate settings TUESDAY morning 7:00 am
Euro/USA 1.1597 UP .0039/ REACTING TO MERKEL’S FAILED COALITION/ REACTING TO +GERMAN ELECTION WHERE ALT RIGHT PARTY ENTERS THE BUNDESTAG/ huge Deutsche bank problems + USA election:///ITALIAN CHAOS /AND NOW ECB TAPERING BOND PURCHASES/JAPAN TAPERING BOND PURCHASES /USA RISING INTEREST RATES /FLOODING/EUROPE BOURSES ALL IN THE GREEN
USA/JAPAN YEN 111.14 DOWN 0.200 (Abe’s new negative interest rate (NIRP), a total DISASTER/NOW TARGETS INTEREST RATE AT .11% AS IT WILL BUY UNLIMITED BONDS TO GETS TO THAT LEVEL
GBP/USA 1.2959 UP 0.0016 (Brexit March 29/ 2017/ARTICLE 50 SIGNED/BREXIT FEES WILL BE CAPPED
USA/CAN 1.2970 DOWN .0033 (CANADA WORRIED ABOUT TRADE WITH THE USA WITH TRUMP ELECTION/ITALIAN EXIT AND GREXIT FROM EU/(TRUMP INITIATES LUMBER TARIFFS ON CANADA/CANADA HAS A HUGE HOUSEHOLD DEBT/GDP PROBLEM)
Early THIS TUESDAY morning in Europe, the Euro FELL by 33 basis points, trading now ABOVE the important 1.08 level FALLING to 1.1533; / Last night Shanghai composite CLOSED UP 74.22 POINTS OR 2.74% /Hang Sang CLOSED UP 429.32 POINTS OR 1.54% /AUSTRALIA CLOSED DOWN 0.29% / EUROPEAN BOURSES ALL GREEN
The NIKKEI: this TUESDAY morning CLOSED UP 155.42 POINTS OR 0.69%
Trading from Europe and Asia
1/EUROPE OPENED ALL GREEN
2/ CHINESE BOURSES / :Hang Sang UP 429.32 POINTS OR 1.54% /SHANGHAI CLOSED UP 74.22 POINTS OR 2.74%
Australia BOURSE CLOSED DOWN 0.29%
Nikkei (Japan) CLOSED UP 155.42 POINTS OR 0.69%
INDIA’S SENSEX IN THE GREEN
Gold very early morning trading: 1214.40
silver:$15.46
Early TUESDAY morning USA 10 year bond yield: 2.95% !!! UP 1 IN POINTS from MONDAY night in basis points and it is trading WELL ABOVE resistance at 2.27-2.32%. (POLICY FED ERROR)/
The 30 yr bond yield 3.10 UP 1 IN BASIS POINTS from MONDAY night. (POLICY FED ERROR)/
USA dollar index early TUESDAY morning: 95.08 DOWN 28 CENT(S) from MONDAY’s close.
This ends early morning numbers TUESDAY MORNING
xxxxxxxxxxxxxxxxxxxxxxxxxxxxxxxxxxxxxxxxxxxxxxxxxxxxxxxxxxxxxxxxxxxxxxxxxxxxxxxxxxxxxxxxxxxxxxxxxxxxxxxxxxxxxxx
And now your closing TUESDAY NUMBERS \1: 00 PM
Portuguese 10 year bond yield: 1.75% DOWN 0 in basis point(s) yield from MONDAY/
JAPANESE BOND YIELD: +.116% UP 6/10 BASIS POINTS from MONDAY/JAPAN losing control of its yield curve/EXTREMELY VOLATILE YESTERDAY
SPANISH 10 YR BOND YIELD: 1.395% DOWN 1/ 2 IN basis point yield from MONDAY/
ITALIAN 10 YR BOND YIELD: 2.869 DOWN 3 POINTS in basis point yield from MONDAY/
the Italian 10 yr bond yield is trading 148 points HIGHER than Spain.
GERMAN 10 YR BOND YIELD:RISES TO +.408% IN BASIS POINTS ON THE DAY
END
IMPORTANT CURRENCY CLOSES FOR TUESDAY
Closing currency crosses for FRIDAY night/USA DOLLAR INDEX/USA 10 YR BOND YIELD/1:00 PM
Euro/USA 1.1597 UP .0039(Euro UP 39 Basis points/ represents to DRAGHI A COMPLETE POLICY FAILURE/
USA/Japan: 111.17 DOWN 0.167 Yen UP 17 basis points/
Great Britain/USA 1.2959 UP .0016( POUND UP 16 BASIS POINTS)
USA/Canada 1.3017 Canadian dollar DOWN 15 Basis points AS OIL FELL TO $69.27
xxxxxxxxxxxxxxxxxxxxxxxxxxxxxxxxxxxxxxxxxxxxxxxxxxxxxxxxxxxxxxxxxxxxxxxxxxxxxxxx
This afternoon, the Euro was UP 39 to trade at 1.1597
The Yen ROSE to 111.17 for a GAIN of 17 Basis points as NIRP is STILL a big failure for the Japanese central bank/HELICOPTER MONEY IS NOW DELAYED/BANK OF JAPAN NOW WORRIED AS AS THEY ARE RUNNING OUT OF BONDS TO BUY AS BOND YIELDS RISE
The POUND GAINED 16 basis points, trading at 1.2959/
The Canadian dollar LOST 15 basis points to 1.3017./ WITH WTI OIL FALLING TO 69.27
The USA/Yuan closed AT 6.8269 ON SHORE (UP)
THE USA/YUAN OFFSHORE: 6.8310 (UP)
the 10 yr Japanese bond yield closed at +.116% UP 6/10 BASIS POINTS FROM YESTERDAY
Your closing 10 yr USA bond yield UP 2 IN basis points from MONDAY at 2.958 % //trading well ABOVE the resistance level of 2.27-2.32%) very problematic USA 30 yr bond yield: 3.103 UP 2 in basis points on the day /
THE RISE IN BOTH THE 10 YR AND THE 30 YR ARE VERY PROBLEMATIC FOR VALUATIONS
Your closing USA dollar index, 95.13 DOWN 23 CENT(S) ON THE DAY/1.00 PM/
Your closing bourses for Europe and the Dow along with the USA dollar index closing and interest rates for TUESDAY: 1:00 PM
London: CLOSED UP 54.70 POINTS OR 0.71%
German Dax :CLOSED UP 49.98 OR 0.40%
Paris Cac CLOSED UP 44.13 POINTS OR 0.91%
Spain IBEX CLOSED UP 50.10 POINTS OR 0.52%
Italian MIB: CLOSED UP 273.63 POINTS OR 1.27%
The Dow closed UP 126.73 POINTS OR 0.50%
NASDAQ closed UP 22.99 points or 0.31% 4.00 PM EST
WTI Oil price; 69.27 1:00 pm;
Brent Oil: 74.34 1:00 EST
USA /RUSSIAN ROUBLE CROSS: 63.46 LOWER 29/100 ROUBLES/DOLLAR (ROUBLE HIGHER BY 29 BASIS PTS)
TODAY THE GERMAN YIELD FALLS TO +.408% FOR THE 10 YR BOND 1.00 PM EST EST
END
This ends the stock indices, oil price, currency crosses and interest rate closes for today 4:30 PM
Closing Price for Oil, 4:00 pm/and 10 year USA interest rate:
WTI CRUDE OIL PRICE 4:30 PM:$69.06
BRENT: $74.44
USA 10 YR BOND YIELD: 2.98%
USA 30 YR BOND YIELD: 3.12%/
EURO/USA DOLLAR CROSS: 1.1599 UP .0042 ( UP 42 BASIS POINTS)
USA/JAPANESE YEN:111.39 UP 0.047 (YEN DOWN 5 BASIS POINT/ .
USA DOLLAR INDEX: 95.17 DOWN 19 cent(s)/
The British pound at 5 pm: Great Britain Pound/USA: 1.2941 DOWN 1 POINTS FROM YESTERDAY
Canadian dollar: 1.3054 DOWN 52 BASIS pts
USA/CHINESE YUAN (CNY) : 6.8301 (ONSHORE)
USA/CHINESE YUAN(CNH): 6.8201 (OFFSHORE)
German 10 yr bond yield at 5 pm: ,0.408%
VOLATILITY INDEX: 10.93 CLOSED DOWN 0.34
LIBOR 3 MONTH DURATION: 2.343% .LIBOR RATES ARE RISING
And now your more important USA stories which will influence the price of gold/silver
TRADING IN GRAPH FORM FOR THE DAY
Global Stocks Pop, Bonds Drop As PBOC Slows
Great Fall Of China
Elon Musk…
China’s verbal intervention overnight juiced yuan higher…

And sent Chinese stocks ripping…

European stocks followed through…

And US stocks opened gap higher with all eyes watching for new record highs for the S&P… (NOTE that stocks really didn’t go anywhere after the initial burst)…

As usual, futures show the panic bid at the US cash open…

S&P was unable to manage new record highs (for now)…

Of course, Elon Musk grabbed all the headlines – after news of a Saudi stake was then dwarfed by Musk’s tweet about the biggest MBO ever – TSLA share halted at 209pmET and reopened at 345pmET higher…

But was unable to reach $389.61 – the previous record high

Additionally, TSLA bonds rallied (against expectations) thanks to their CoC clause…

A weak 3Y auction did not help today as bond yields pushed higher (all around 2-3bps higher on the week)…

But 10Y Yield remains below 3.00% for now…

The Dollar ended the day lower despite another trend reversal intraday…

The Lira bounced today but it was not too compelling…

But EM did not escape as Brazilian Real tumbled…

Cryptos jumped on the day (aside from Ripple) but remain lower from Friday’s close…

Commodities edged higher but WTI leads the week

However, amid all this chaos, Gold remains relatively stable in Yuan terms…

END
MARKET TRADING
Market DATA
Janet Yellen’s favourite metric: the JOLTS figure.
Job openings have increased and they now exceed unemployed workers. Also hires are increasing as well as quits (those that quit on their own as they say you can “shove” this job!
(courtesy zerohedge)
More Job Openings Than Unemployed Workers For Third Consecutive Month
There was a surprising development back in June, when that month’s JOLTS report revealed a curious, if welcome for the US economy, inflection point: for the first time in reported BLS data, the number of US job openings surpassed the number of unemployed workers.
Fast forward two months, when as the BLS reported last Friday, the number of unemployed workers increased from 6.0 million to 6.3 million (after hitting 6.6 million in July). The question was whether this increase would also reverse this Opening-Unemployed trend. However, as the just released June JOLTS report revealed, for the third month in a row the number of job openings stayed above the total number of unemployed workers, as May’s 6.638MM job openings number was revised higher to 6.659MM, yet which rose modestly again to 6.662MM in June which was once again comfortably above the 6.280MM unemployed workers. This means that June was the third consecutive month in which the number of job openings was higher than the number of unemployed Americans.

In other words, in an economy in which there was a perfect match between worker skills and employer needs, there would be zero unemployed people at this moment (which of course is not the case.)
According to the BLS, the number of job openings increased in educational services (+20,000) but decreased in transportation, warehousing, and utilities (-84,000). The number of job openings was little changed in all four regions.
Adding to the exuberant labor picture, while job openings remained above total unemployment, the number of total hires also remained just shy of a new record, at 5.561 million in June, down slightly from 5.747 million in May, and on the verge of an all time high. The number of hires s increased in finance and insurance (+31,000).
According to the historical correlation between the number of hires and the 12 month cumulative job change (per the Establishment Survey), either the pace of hiring needs to drop, or else the number of new jobs will rise significantly in the coming months.

Meanwhile, last month’s biggest surprise, the record number of Americans quitting the job – the so-called “take this jobs and shove it” indicator which shows worker confidence that they can leave their current job and find a better paying job elsewhere – dipped modestly in June, from a record 3.480MM to 3.402MM, but still just shy of a record print, with the BLS reporting that biggest number of quits in educational services (-14,000).

Putting all this in in context
- Job openings have increased since a low in July 2009. They returned to the prerecession level in March 2014 and surpassed the prerecession peak in August 2014. There were 6.7 million open jobs on the last business day of June 2018.
- Hires have increased since a low in June 2009 and have surpassed prerecession levels. In June 2018, there were 5.7 million hires.
- Quits have increased since a low in September 2009 and have surpassed prerecession levels. In June 2018, there were 3.4 million quits.
- For most of the JOLTS history, the number of hires (measured throughout the month) has exceeded the number of job openings (measured only on the last business day of the month). Since January 2015, however, this relationship has reversed with job openings outnumbering hires in most months.
- At the end of the most recent recession in June 2009, there were 1.2 million more hires throughout the month than there were job openings on the last business day of the month. In June 2018, there were 1.0 million fewer hires than job openings.

3Y Note Yields Most Since May 2007 In Ugly, Tailing Auction As Foreign Buyers Flee
After yesterday’s two-fer shocker, when the Treasury sold 3 and 6-month bills at the lowest Bid to Cover in a decade as demand for papers suddenly pulled away, today’s 3Y coupon auction was no better, and moments ago some $34BN in 3 year paper was sold at a high yield of 2.765%, tailing the When Issued 2.763% by 0.2bps (the 5th consecutive tail in a row for this tenor), and the highest yield since May 2007.
The yield, however, was not enough to generate interest, and while the Bid to Cover rose from 2.51 last month to 2.65, but well below the 6 month average of 2.814, the internals were downright ugly, as Indirects took down just 42.7%, the lowest since December 2016, and with Directs taking 12.1%, it left Dealers taking down 45.2% of the auction, the highest share going back also to December 2016.
Overall, a very ugly auction, which better not be a harbinger of what to expect from tomorrow’s benchmark 10Y sale or else the bond market may be facing a major hanogver very soon.

US Credit Card Debt Shrinks For Only Second Time Since 2013 As Student, Auto Loans Hit All Time High
One month after a near record surge in consumer credit driven by a spike in credit card debt, the US consumer went into mini hibernation to start the summer, when total consumer credit rose by just $10.2 billion, far below the $15 billion estimate, bringing the consumer credit – both revolving and non-revolving – total to $3.908 trillion.

And while non-revolving credit, i.e. student and auto loans, maintained its monthly ascent in line with the historical trend, growing by $10.4 trillion, the surprise was the unexpected shrinkage in revolving, or credit card debt, which declined by $185 million in June; this was only the second drop in US credit card debt since 2013, with March of 2018 the only other recent decline.

And while the shrinkage in credit card debt will prompt some questions about the resilience of the US consumer as the US economy entered the summer, the recent dramatic upward revision to personal savings notwithstanding, one place where there were no surprises, was in the total amount of student and auto loans: here we got the latest quarterly update for Q2 and, as expected, both numbers hit fresh all time highs, with a record $1.532 trillion in student loans outstanding, an increase of $8 billion in the quarter, auto debt also hit a new all time high of $1.131 trillion, an increase of $18 billion in the quarter.

USA ECONOMIC /GENERAL STORIES
Mises explains why federal deficits are worse than we think. It is something that I have pointed out to you on several occasions
Mark Brandly/Mises Institute
Federal Deficits Are Worse Than You Think
Authored by Mark Brandly via The Mises Institute,
Voters tend to be rationally ignorant. Since a single vote does not matter, for most potential voters the cost of being politically well-informed is greater than the benefit of being knowledgeable about political affairs. Therefore it’s rational for most voters to be ignorant regarding political issues.

A main reason for the high cost of being well-informed is that government officials may not want the public to be well-informed. They purposefully conceal their schemes to reduce the opposition to their policies. A well-informed body politic would be a threat to the welfare and warfare state.
This obscurantism is on full display regarding the government budget.
Let’s start with the annual deficit. You may have noticed that the stated annual deficit is less than the increase in government debt. In order to explain this, consider a small scale example. Assume that you were $20,000 in debt at the beginning of 2017 and you earned $3,000 and spent $4,000 during the year. You borrowed $1,000 to cover this spending so your total debt increased to $21,000. A sensible reading of this situation would be that you had a $1,000 deficit in 2017 (multiply these numbers by a billion dollars to roughly approximate what is generally asserted to be the federal budget).
However, if you followed the federal government’s method, you would claim a deficit of, say, $600. According to the feds, the official deficit is less than the increase in total debt. How do they do this? Well, some of the borrowed money is simply not included in the deficit. For example, in fiscal year 2016, they claimed a deficit of $587 billion even though the total debt increased $1,422 billion and the debt held by the public (the total debt less the intragovernmental debt) increased $1,049 billion. They hide some of the deficit by simply declaring that some of the increased debt is not part of the deficit.
But this deception is of little consequence compared to the government’s claims about their spending habits.
According to the “Economic Report of the President,” government spending (outlays) over the twenty year period from Fiscal Year 1998 to FY 2017 more than doubled from $1,652.5 billion to $3,981.6 billion. In real terms, using the implicit price deflator as our measure of inflation, this was a 67% increase in spending.
Let’s take into account the economic growth during this period. Again, according to the Economic Report of the President, real GDP increased 54% in this twenty year period. So spending as a percentage of GDP only increased from 18.9% of GDP to 20.5% of GDP. It’s important to note that this does not include the substantial amount of spending at the state and local levels of government.
But the “Economic Report of the President” does not give us the full story of the government’s budget.
Return to the previous example. Assume that you were $20,000 in debt at the beginning of the year. But in addition to your $4,000 of other spending you were required to make $8,000 of payments on this debt in 2017. Your income was only $3,000. So you borrowed $9,000 to cover your deficit plus principle payments (again multiply these numbers by a billion dollars to approximate actual federal spending).
This example is roughly the situation for the federal government.
The Treasury Department with their Daily Treasury Statements (DTS) gives us an accounting of all deposits into and withdrawals from federal government accounts. The DTS shows that withdrawals more than tripled from $4,036 billion in FY 1998 to $12,995 billion in FY 2017. This is all outlays of federal spending, including government purchases, transfer payments, interest payments, principal payments on their debt, and all other withdrawals.
Adjusting for inflation, again using the implicit price deflator, this is a 124% increase in spending over twenty years. And DTS withdrawals as a percentage of GDP increased from 46% to 67% of GDP in this time period.
Let me say this again. If we define spending as total withdrawals from government accounts, then FY 2017 spending was $12,995 billion and government spending is 67% of GDP.
So, is federal spending, in 2017, 20.5% of GDP or 67% of GDP? What is the discrepancy between these estimates? The main issue here is the government’s debt service payments. Federal debt held by the public increased from $3.8 trillion at the start of FY 1998 to $14.7 trillion at the end of FY 2017. That’s 287% in twenty years. This has led to an increase in debt payments (called Public Debt Cash Redemptions) from $2.18 trillion to $8.43 trillion over this same time period. That’s right. The federal government paid $8.43 trillion in debt redemption payments in FY 2017. That’s ten times the Social Security Benefits paid out ($842 billion). Not counting these payments when reporting government spending is the chief reason that federal spending is reported to be 20.5% of GDP.
In order to cover the 2017 payments servicing the debt, federal government borrowing (called Public Debt Cash Issues), again this information comes from the DTS, was $8.89 trillion. This was the borrowing necessary to cover the $8.43 trillion in debt payments and the deficit resulting from the remaining parts of the budget.
Should this be a concern? On one hand, borrowing to pay for previous borrowing does not substantially change the government’s balance sheet. $8.4 trillion of liabilities is still $8.4 trillion of liabilities. In that sense, we should not be concerned about this matter. We should instead focus on changes in the total debt (the true deficit) and interest payments on the debt of $240 billion in FY 2017.
However we must recognize that debt payments are a form of government spending and the fact that the feds must finance this spending. Due to the principal payments on the debt, 77% of federal spending is financed by borrowing. As the overall debt rises, the risk of default grows and lenders will demand higher interest rates on government securities to account for this risk. Borrowing to make the interest payments will compound the size of the debt. This exponential growth of the debt increases the risk associated with lending to our government and intensifies the problem.
Federal government spending is much higher and their budget position is more precarious than is typically reported. Including the federal debt payments as reported by the Daily Treasury Statements provides us with a more accurate picture of the federal budget and a better understanding of a possible upcoming budget crisis.
END
SWAMP STORIES
Rick Gates testifies that he committed mega crimes while working for Manafort. The problem is that he is also a liar especially when initially talking to the FBI. The big question is how are they going to handle this.
(courtesy zerohedge)
WE WILL SEE YOU ON WEDNESDAY NIGHT.
HARVEY


