
Gold: $1,263.20 down $6.70 (comex closing time)
Silver 15.62 down 6 cents
In the access market 5:15 pm
Gold $1267.40
silver: 15.65
At the gold comex today, we had a fair delivery day, registering 54 notices for 5400 ounces and for silver we had 5 notices for 25,000 oz for the active March delivery month.
Several months ago the comex had 303 tonnes of total gold. Today, the total inventory rests at 212.04 tonnes for a loss of 91 tonnes over that period.
In silver, the open interest rose by 4854 contracts up to 169,655. In ounces, the OI is still represented by .848 billion oz or 121% of annual global silver production (ex Russia ex China). Generally as we go into an active delivery month the liquidation is much bigger.
In silver we had 102 notices served upon for 510,000 oz.
In gold, the total comex gold OI rose by a huge 8727 contracts to 491,655 contracts as the price of gold was up $12.50 with Friday’s trading.(at comex closing)
We had a tiny change in gold inventory at the GLD, a withdrawal of .21 tonnes and gold / thus the inventory rests tonight at 793.12 tonnes. The appetite for gold coming from China is depleting not only gold from the LBMA and GLD but also the comex is bleeding gold. Our 670 tonnes of rock bottom inventory in GLD gold has been broken. It looks to me that China has taken the last amounts of physical gold from the GLD. I guess the only place left for China to receive physical gold, after they deplete the GLD will be the FRBNY and the comex. In silver,/we again had a major change in inventory/this time another huge deposit of 2.856 million oz and thus the Inventory rests at 322.632 million oz
.
First, here is an outline of what will be discussed tonight:
1. Today, we had the open interest in silver rose by 4854 contracts up to 169,655 as the price of silver was up 55 cents with yesterday’s trading. The total OI for gold rose by 8,727 contracts to 491,665 contracts as gold was up $12.50 in price from Friday’s level.
(report Harvey)
2 a) Gold trading overnight, Goldcore
(Mark OByrne)
3. ASIAN AFFAIRS
i)Late SUNDAY night/ MONDAY morning: Shanghai closed UP BY 23.19 POINTS OR 0.50% ON A LAST HR RESCUE, / Hang Sang closed DOWN by 16.98 points or 0.08% . The Nikkei closed DOWN 103.46 or 0.41%. Australia’s all ordinaires was UP .1.04%. Chinese yuan (ONSHORE) closed DOWN at 6.5176. Oil GAINED to 36.49 dollars per barrel for WTI and 39.30 for Brent. Stocks in Europe so far IN THE RED . Offshore yuan trades 6.5187 yuan to the dollar vs 6.5176 for onshore yuan/ LAST WEDNESDAY, MOODYS DOWNGRADES CHINA’S CREDIT FROM STABLE TO NEGATIVE. At the big people’s congress where they meet to set a 5 year plan, the leaders failed to deliver a major fiscal stimulus package. However instead they made very promises:
ii) Chinese congress fails to deliver necessary stimulus
(zero hedge)
iii)China’s reserves drop by 29 billion USA in February. Also they “added” 320,000 oz to its official reserves or 9.95 tonnes.
ii)Turkey is now demanding more than just money. It wants concessions in its dealing with the migrants: namely official entry into the EU (despite dealing a blow to democracy with the seizing of the only English newspaper in Turkey)
iii) I have been documenting to you the continue degradation of Italian banks. For the first two months of the year, we have noted a huge downdraft in the value of Italian banks as the EU initiated a probe into their affairs. It seems that the NPL’s is around 20% but maybe even higher. At a 20% NPV that represents a 200 billion loss to the banks which they cannot afford. The rescue attempt is through a good bank/bad bank scenario but the bad loans must be offloaded at fair market value, something that would break the banks anyway..
GLOBAL ISSUES
Deutsche bank discovers that by looking at Japan’s NIRP, instead of increase spending, we are getting the opposite as citizens fear something is run and they increase their savings:
( zero hedge)
ii)We got a smaller than expected build at Cushing. Thus WTI spiked over 37 dollars and Brent broke the 40 dollar barrier. It will not last:
i)Unbelievable!! they just figured this out? USA Watchdog probing regulators as being too lax with bankers!!
ii)No kidding!! the BIS reports that faith in the “healing’ powers of central banks QE policies are faltering badly:( zero hedge)
iii) the shorts on iron ore got pulverized last night and this morning after Goldman Sachs laid out an extremely bearish case for the iron ore/steel industry.
Goldman is correct, but today the short squeeze is on!!
( zero hedge/Goldman Sachs/)
iv) What has caused the iron ore market to go beserk these past few days?: investors are expecting monetary easing to boost steel demand. However there will be no increase in physical orders;
v. This is shear idiocy: dry bulk carriers are up dramatically in their stocks. Eagle Bulk is up a whopping 340% in two days. And now China is planning on decreasing exports…just great for our dry bulk shippers:( zero hedge)
vi) Question and answers from Bill Holter/Jim Sinclair
vi) Tonight’s important commentary from Bill Holter in entitled:
“Everything else is credit!”
vii) And again today, the big story of the day: Blackrock’s gold ETF:
( Koos Jansen/)
ix) The ECB is starting to report unallocated gold vs allocated gold but still refuse to separate gold swaps from actual holdings. This is probably where much of the European gold holdings are compromised:
( Chris Powell/GATA)
x)Dave Kranzler reports that mining shares are ripping higher and the bankers are having a tougher time orchestrating a severe raid on gold and silver metal
( Dave Kranzler/IRD)
i)After years of being overweight stocks, JPMorgan for the first time I can recall has stated that it may be a good idea to short:
( JPMorgan/zero hedge)
ii)It certainly looks like the USA and the globe are entering depression like conditions. The GAAP expected earnings for the S and P for this yr is forecasted at 19.92. Fictional non GAAP is expected at 29.49 dollars/both down over 3%. S and P is now at 1991 and thus P./E on GAAP will be a huge: 19.92 x 4 / 1991 = 24.98. Even non GAAP earnings are expected to fall and thus its P/E will be: 16.87.
( zero hedge)
iii) A must read, especially when you want the truth behind the phony jobs report issued by the BLS once a month:
iv)This is unbelievable; the New York Fed has just been hacked and 100 million dollars has been stolen from it belonging to Bangladesh
Let us head over to the comex:
The total gold comex open interest rose to a high of 491,665 for a rather large gain of 8,727 contracts as the price of gold was up $12.50 in price with respect to Friday’s trading. For the past two years, we have strangely witnessed two interesting developments with respect to the gold open interest: 1) total gold comex collapse in OI as we enter an active delivery month or for that matter an inactive month, and 2) a continual drop in the amount of gold standing in an active month. Today, only the first scenario was in order as we actually gained in number of ounces standing for March. The front March contract month saw its OI rise by 21 contracts up to 127.We had 16 notices filed on Friday, and as such we gained 37 contracts or an additional 3700 oz will stand for delivery. After March, the active delivery month of April saw it’s OI fall by 1,522 contracts down to 313,947. The estimated volume today (which is just comex sales during regular business hours of 8:20 until 1:30 pm est) was 244,185 which is very good. The confirmed volume yesterday (which includes the volume during regular business hours + access market sales the previous day was excellent at 394,924 contracts.It seems that the bankers supplied the necessary gold paper today with reckless abandon. The comex is back in backwardation until May.
March contract month:
INITIAL standings for MARCH
March 7/2016
| Gold |
Ounces
|
| Withdrawals from Dealers Inventory in oz | nil |
| Withdrawals from Customer Inventory in oz nil | 2218.35 oz(Scotia)
39 kilobars |
| Deposits to the Dealer Inventory in oz | 2,501.73 ozBRINKS |
| Deposits to the Customer Inventory, in oz | nil |
| No of oz served (contracts) today | 54 contracts (5400 oz) |
| No of oz to be served (notices) | 73 contracts(7300 oz) |
| Total monthly oz gold served (contracts) so far this month | 575 contracts (57,500 oz) |
| Total accumulative withdrawals of gold from the Dealers inventory this month | nil |
| Total accumulative withdrawal of gold from the Customer inventory this month | 103,689.5 oz |
we had 0 adjustment
.
MARCH INITIAL standings/
March 7/2016:
| Silver |
Ounces
|
| Withdrawals from Dealers Inventory | nil |
| Withdrawals from Customer Inventory | 809,871.600 oz (DelawareScotia, JPM.CNT) |
| Deposits to the Dealer Inventory | 459,639.440 oz
BRINKS |
| Deposits to the Customer Inventory | 1,529,117.898 oz (SCOTIA) |
| No of oz served today (contracts) | 5 contracts 25,000 oz |
| No of oz to be served (notices) | 2664 contract (11,085,000 oz) |
| Total monthly oz silver served (contracts) | 325 contracts (1,625,000 oz) |
| Total accumulative withdrawal of silver from the Dealers inventory this month | nil oz |
| Total accumulative withdrawal of silver from the Customer inventory this month | 7,845,938.9 oz |
Today, we had 1 deposits into the dealer account:
i) Into Brinks: 459,639.440 oz
total dealer deposit;459,639.440 oz
we had 0 dealer withdrawals:
total dealer withdrawals: nil
we had 1 customer deposit
i) Into Scotia: 1,529,117.898 oz
:
total customer deposits: 1,529,117.898 oz
total withdrawals from customer account 809,871.600 oz
we had 1 adjustment
i) Out of CNT:
10,123.04 oz was adjusted out of the customer account and this landed into the dealer account of CNT
And now the Gold inventory at the GLD:
MARCH 7/a tiny loss of .21 tonnes of gold probably to pay for fees/inventory 793.12 tonnes
MARCH 4/another mammoth sized deposit of 7.13 tonnes of gold into GLD/Inventory rests at 793.33 tonnes. This is no doubt a “a paper addition” and not physical
MAR 3/another good sized deposit of 2.37 tonnes of gold into the GLD/Inventory rests at 788.57 tonnes
MAR 2/another mammoth paper gold addition of 8.93 tonnes of gold into the GLD/Inventory rests at 786.20 tonnes.
March 1/a mammoth 14.87 tonnes of gold deposit into the GLD/inventory rests at 770.27 tonnes
FEB 29/another deposit of 2.08 tonnes of gold into the GLD/Inventory rests at 762.40 tonnes
Feb 26./no change in gold inventory at the GLD/Inventory rests at 760.32 tonnes
Feb 25./we had a huge deposit of 7.33 tonnes of gold into the GLD/Inventory rests at 760.32 tonnes. No doubt that this is a paper gold deposit/not real as the price of gold hardly moved on that huge amount of deposit.
FEB 24/no change in gold inventory at the GLD/Inventory rests at 752.29 tonnes
FEB 23./another huge addition of 19.3 tonnes of gold into its inventory/Inventory rests at 752.29 tonnes. Again how could they accumulate this quantity of gold with backwardation in London/this vehicle is nothing but a fraud
Feb 22/A huge addition of 19.33 tonnes of gold to its inventory/Inventory rests at 732.96 tonnes/ How could this happen: a huge addition of gold coupled with a huge downfall of 20 dollars in gold.
xxxxxxxxxxxxxxxxxxxxxxxxxxxxxxxxxxxxxxxxxxxxxxxxxxxxxxxxx
March 7.2016: inventory rests at 793.12 tonnes
end
end
And now your overnight trading in gold, MONDAY MORNING and also physical stories that may interest you:
Gold ETF Suspends Issuing Shares Due To “Surge” In Demand
Gold ETF, the iShares Gold Trust, had to stop issuing new shares in its $7.7 billion on Friday as a “surge” in investment demand for gold caught out the provider of the ETF and the world’s largest money manager, BlackRock Inc.

According to a statement from the company
“Since the start of 2016, in response to global macroeconomic conditions, demand for gold and for IAU has surged among global investors,” causing the ETF to expand its assets under management by $1.4 billion this year alone.
“This surge in demand has led to the temporary exhaustion of IAU shares currently registered under [law]. We are registering new shares to accommodate future creations in the primary market by filing a Form 8-K to announce the resumption of the offering of new shares,” according to the statement. “The ability of authorized participants to redeem shares of IAU is not affected.”
Bloomberg further elaborated:
Investors had piled into the fund so fast that BlackRock didn’t register in time with the U.S. Securities and Exchange Commission to issue more shares. The suspension means that the share price of the fund may deviate from the price of its underlying assets — the physical gold — until issuance resumes, probably within two or three business days, according to a person familiar with the matter.
The misstep by New York-based BlackRock comes as providers of exchange-trade funds face mounting concern that the products may pose risks that investors aren’t always aware of. Cracks in the system were revealed on Aug. 24, when many equities didn’t open for trading, yet the ETFs that hold them did, causing confusion among investors about their value.
“One would suppose this would be something they would be monitoring more carefully,” said Ben Johnson, director of global ETF research for Morningstar Inc.…
ETFs hold a basket of assets that are rolled up into a single security that can be traded on an exchange. The ETF market has exploded in size, jumping 2 1/2 times in value since the end of 2009. Kara Stein, a U.S. Securities and Exchange Commissioner, last month expressed concern that the ETF market has become too difficult for retail investors to understand.
“I fear that the risk presented by some of these new products may not be fully understood by those who have invested in them,” Stein said at a conference in Washington, speaking generally about new ETFs. “Indeed, even plain-vanilla, equity index ETFs may present risks that are not always anticipated or fully understood, as evidenced by the events of Aug. 24.”
…
BlackRock said that, even without new share issuance, market makers have a range of tools to meet investor demand, including using existing inventory.
“This suspension does not affect the ability of retail and institutional investors to trade on stock exchanges,” BlackRock said. “Retail and institutional investors will continue to be able to buy and sell shares.”
Gold ETFs have many unappreciated risks as we outlined from their inception. Risks from these created financial instruments include valuations, annual fees and expenses, counter-party risks as well as liabilities and responsibilities of the market participants such as the auditors and custodians.
Gold bullion is unique among asset classes as it is an asset class not dependent on the performance of auditors, management, corporations, financial institutions, banks, politicians and governments. Nor is physical gold dependent on the performance of trustees, custodians and or sub custodians.
Gold ETFs are fine for those wishing to take a speculative position long or short the gold market. However, for the majority of of investors and pensions they are likely not suitable. They should not be confused with owning physical gold coins or bars in allocated and segregated accounts. ETFs are quite high risk financial products while gold bullion is a proven hedging instrument and safe haven asset.
LBMA Gold Prices
07 Mar: USD 1,267.60, EUR 1,156.96 and GBP 896.13 per ounce
04 Mar: USD 1,271.50, EUR 1,158.67 and GBP 898.93 per ounce
03 Mar: USD 1,241.95, EUR 1,141.48 and GBP 882.24 per ounce
02 Mar: USD 1,229.35, EUR 1,131.53 and GBP 881.54 per ounce
01 Mar: USD 1,240.00, EUR 1,141.70 and GBP 886.09 per ounce
Gold and Silver News and Commentary
Gold steady as upbeat U.S. jobs support Fed hike – Reuters
Gold supported by ETF demand, short-covering – Bullion Desk
China gold reserves rise to 57.5 mln fine troy ounces at end-Feb – Reuters
Canada stands alone in G7 as it empties its coffers of gold – Financial Post
Mark Cuban sparks ‘berserk’ bets on gold – CNBC
Global Housing Bubbles To Burst – Keiser Report
There’s a 100% Probability of a U.S. Recession Within a Year – Rogers – Bloomberg
Bitcoin Transactions Get Stranded as Cryptocurrency Maxes Out – Technology Review
Faith in central banks’ healing powers faltering: BIS – Reuters
BlackRock Suspends ETF Issuance Due To “Surging Demand For Gold” – Zero Hedge
Read more here

‘7 Real Risks To Your Gold Ownership’ – New Must Read Gold Guide Here

U.S. watchdog to probe Fed’s lax oversight of Wall Street
Submitted by cpowell on Sun, 2016-03-06 01:11. Section: Daily Dispatches
Jonathan Spicer
Reuters
Saturday, March 5, 2016
NEW YORK — A U.S. watchdog agency is preparing to investigate whether the Federal Reserve and other regulators are too soft on the banks they are meant to police, after a written request from Democratic lawmakers that marks the latest sign of distrust between Congress and the central bank.
Ranking representatives Maxine Waters of the House Financial Services Committee and Al Green of the Subcommittee on Oversight and Investigations asked the Government Accountability Office on Oct. 8 to launch a probe of “regulatory capture” and to focus on the New York Fed, according to a letter obtained by Reuters.
In an interview, the congressional agency said it has begun planning its approach.
The probe, which had not been previously reported or made public, is the first by an outside agency into the perception that government regulators are “captured” by and too deferential toward the bankers they supervise, so that Wall Street benefits at the public’s expense. …
… For the remainder of the report:
http://www.reuters.com/article/us-usa-fed-probe-exclusive-idUSKCN0W62C0
end
(courtesy Chris Powell/GATA criticing Bickis/CP)
Canadian Press finds ignoramuses to provide cover for gold dishoarding
Submitted by cpowell on Sat, 2016-03-05 20:47. Section: Daily Dispatches
Good grief! At the Sprott School of Business no less. Eric deserves a refund.
* * *
Canada’s Gold Reserve Selloff Makes Sense, Experts Say
By Ian Bickis
The Canadian Press
via CTV, Toronto
http://www.ctvnews.ca/business/canada-s-gold-reserve-sell-off-makes-sens…
CALGARY, Alberta — Canada may be a global outlier when it comes to its selloff of gold.
But to Ian Lee, a professor at Carleton University’s Sprott School of Business, the decision marks the end of an era that doesn’t fit into today’s financial system.
“Why did they sell the gold? To convert it into cash, which is liquid,” said Lee. “Bullion is not liquid. It sits down in the basement and collects dust.”
EDITOR’S NOTE: Except when it’s being leased, swapped, hypothecated, rehypothecated, or monetized for electronic trade through mechanisms like GoldMoney.com.
The country’s holdings in the precious metal peaked in 1965 at 1,023 tonnes or about 32.9 million ounces, according to the World Gold Council. But in recent years, gold has lost its lustre for the federal government, which on Thursday announced it was left with 77 ounces in official reserves — less than a quarter the size of a gold bar.
Lee said countries previously measured their wealth by the amount of gold they had, and currencies were fixed to the price of gold. Those days are long gone. Today the world relies on much more efficient floating exchange rates to balance the value of currencies, and wealth is measured in productivity, Lee said. “The idea that that’s the productive wealth of Canada, in the number of yellow bricks it owns, is just so preposterous.”EDITOR’S NOTE: How much less preposterous is it to measure the productive wealth of Canada in currencies whose value depends on the responsibility of foreign governments and central banks?
With the United States abandoning the gold standard in 1933 and then fully severing ties between the dollar and gold in 1971, Lee says bullion no longer holds sway on global finances.
“That was it for gold,” said Lee. “From that point on, gold became a member of an asset class, a heavily traded asset class, but it was no longer an instrument of monetary policy.”
EDITOR’S NOTE: Then why are some governments and central banks so madly shorting gold to suppress its price and support their currencies? Why are other governments and central banks steadily increasing their purchases of gold in anticipation of its formal return to the international monetary system?
But those reasons haven’t stopped governments around the world from holding vast quantities of gold, with the U.S. currently sitting on 261.5 million ounces, Germany with 108.7 million ounces, and China, Russia, and India all actively adding to their already tens of millions of ounces in holdings.
Lee said gold bugs like Rand Paul and Ted Cruz, who fear the collapse of modern monetary policy, have prevented the U.S. government from selling off their reserves. Similar resistance, as well as tradition, has kept other countries also holding onto their reserves, he added.
Peter Schiff, head of Euro Pacific Capital, is another of those gold bugs. He said he believes Canada will likely regret the selloff.
“I think it was a major mistake for the central bank to do that,” Schiff said. “We’re on the verge of a major, major meltdown of the dollar.”
Like many gold aficionados, Schiff thinks the world could soon return to a gold standard and Canada will likely be forced to buy back the metal at higher prices.
“The irony is Canada is going to have to buy its gold back,” said Schiff.
But Don Drummond, a former high-ranking bureaucrat at Finance Canada, said it hasn’t made sense for Canada to hold gold for a long time.
He said he helped start the policy for Canada to gradually sell off its gold reserves after it was decided there were better ways to store wealth.
“It was just a realization that that’s a lot of money tied up in something that was giving a terrible rate of return. And we didn’t need it,” said Drummond.
EDITOR’S NOTE: ‘Terrible rate of return’? Has this “expert” still not yet heard of negative interest rates and currency devaluations?
Drummond said that governments with foreign reserves in the trillions might find it difficult to diversify their holdings so they resort to gold at times, but Canada can easily diversify its US$81.5 billion in reserves with various foreign currencies.
EDITOR’S NOTE: Diversify into negative-yielding currencies and government bonds? Why not just flush money down the toilet? At least it won’t “collect dust” there.
A Finance Department spokesman said the sale was part of long-standing policy of diversifying its portfolio by selling physical commodities like gold in order to invest instead in assets that are more easily traded.
EDITOR’S NOTE: Last week BlackRock might have been glad to take gold off the Bank of Canada’s hands.
* * *
end
No kidding!! the BIS reports that faith in the “healing’ powers of central banks QE policies are faltering badly:
(courtesy zero hedge)
Faith in central banks’ healing powers is faltering, BIS says
Submitted by cpowell on Sun, 2016-03-06 14:42. Section: Daily Dispatches
By Marc Jones
Reuters
Sunday, March 6, 2016
LONDON — Financial markets’ shaky start to the year shows they are losing faith in the “healing powers” of central banks, the Bank for International Settlements (BIS) said today while voicing concerns over sub-zero interest rates and emerging economies.
The Swiss-based organization, which fosters cooperation between central banks in the pursuit of monetary and financial stability, said that recent worries over China’s economy, oil and commodity prices, and some European banks had come as fundamental shifts take place in the global economy.
International bank-to-bank lending is contracting for the first time in two years, and the use of dollar-denominated debt to drive growth in emerging markets has ground to a halt on a strengthening of the currency that has also served to send U.S. companies rushing to borrow in euros.
At the same time, world growth remains subdued, overall debt continues to rise, and negative interest rates in large parts of Europe and Japan suggest that some leading central banks are running low on ammunition to quell market volatility that could pose a threat to the global economy.
“The latest turbulence has hammered home the message that central banks have been overburdened for far too long post-crisis,” the head of the BIS monetary and economics department, Claudio Borio, said in its first quarterly report of the year. …
… For the remainder of the report:
http://www.reuters.com/article/us-bis-centralbanks-idUSKCN0W80E0
end
the shorts on iron ore got pulverized last night and this morning after Goldman Sachs laid out an extremely bearish case for the iron ore/steel industry.
Goldman is correct, but today the short squeeze is on!!
(courtesy zero hedge)
Shorts Pulverized: Iron Ore Soars Most On Record After Goldman Says “Bearish Case Intact”
Goldman does it again.
Just hours after the central banker-spawning investment bank issued a report in which it said the iron ore rally is likely to be short lived “in the absence of a material increase in Chinese steel demand, and steel raw materials will once again drive steel prices rather than the other way around”, overnight Iron Ore futures traded on the Singapore SGX exploded as much as 19% higher to $58.95 in one session, its biggest jump on record.
As seen in the chart below, the one day squeeze has been the most violent in years in trading. It probably goes without saying that with the market suddenly offerless, there has been virtually no actual volume as bids scramble to catch whatever asks they can find, in the process crushing whoever was short the commodity and unleashing countless margin calls.
The euphoria was also matched on China’s Dalian Commodity Exchange where Iron Ore soared limit up to $62.47/mt – the highest in six months.
On Monday, steel in China also rose by the daily limit, with steel reinforcement bar for May up 5 percent to 2,073 yuan a ton on the Shanghai Futures Exchange, and hot-rolled coil climbing the same amount to 2,256 yuan a ton.
The catalyst for the move was confusing: on one hand Chinese policy makers signaled their willingness to buttress growth in the ongoing People’s Congress, while on the other authorities reiterated pledges to cut excess industrial capacity, including in steel, and implement reforms, in what are clearly contradictory promises. It is clear on which side of the this “contradiction” the market stands, if only for now.
As Bloomberg notes, iron ore has advanced in 2016, countering expectations it would see further losses on mounting low-cost supply from Australia and Brazil and weakening demand for steel in China, which accounts for about half of global output. At the annual National People’s Congress at the weekend, authorities said they’d allow a record high deficit and higher money-supply target to support growth of 6.5 percent to 7 percent. The nation will also subsidize cuts to excess capacity in industries such as steel.
All of this means that China is back to its old, broken model which led China to the edge of the hard landing from which it is desperately trying to pull itself up from, and it will do so by unleashing all the same policies and debt-binge that put it here in the first place. That should also answer questions about just how sustainable this rally truly is, apart from the technicals where the shorts have gotten pulverized.
Meanwhile, however, stocks are loving it with miners’ shares such as Australia’s Fortescue Metals rocketing higher by 24 percent. Steelmakers’ shares rose in China on Monday, with Baoshan Iron & Steel Co. up as much as 9.7 percent in Shanghai. Angang Steel Co. gained as much as 5.2 percent in Hong Kong, while Maanshan Iron & Steel rose 6.5 percent. In Australia, Rio — which said last week it expected the global supply of seaborne ore to outpace demand growth in the near term — gained 3.5 percent to the highest since December. BHP Billiton Ltd., which has forecast the raw material will probably extend declines to find a level well below $50, was up 5 percent.
Iron ore’s upswing this year has accompanied a revival in other commodities including oil and base metals such as copper. State efforts to cushion the loss of steel capacity in China, including helping retrenched staff, may help to improve the profit margins at mills that remain by reducing competition.
* * *
So to all those who listened to Goldman which just yesterday said the “Bearish case remains intact”, and pressed their shorts: our condolences.
This is what else Goldman’s Christian Lelong and Amber Cai said overnight.
Market roundup
Iron ore rallied 9% wow to US$53.50/t, a pace that flat and long steel prices failed to match with 5% and 2% wow increases respectively. On the demand side, the Chinese government announced a gradual deceleration in the economy and a modest increase in the fiscal deficit for 2016. Meanwhile, a recent tax cut on transactions should support property sales. On the supply side, up to half a million steel workers may be reallocated to other sectors in an effort to reduce overcapacity in the steel industry. Metallurgical coal also participated in the rally, rising 3% wow to US$79/t at a time when negotiations for the next quarterly benchmark prices are due to start. In spite of this relatively modest bounce in the seaborne market, 7.8Mtpa of production capacity has been flagged for closure since the start of the year. The US$420m proposed sale of the Buchanan mine in the US would indicate that premium assets are finally being offered after four years of price declines.
* * *
Spot iron ore prices have rebounded strongly from their recent low in mid-December. The contrast between a 24% ytd price rally and the previous period of mine closures and production cuts raises the following questions:
Q1: What has been driving this rally?
Steel prices should reflect the cost of raw materials and the level of industry profitability but the causal relationship between the two commodities can sometimes be reversed. In our view, steel prices have rallied because the market was in deficit and better margins were required to increase production ahead of the peak demand season. This mean reversion in steel margins happened to coincide with an unexpected increase in Chinese total social financing (TSF) for the month of January that fueled expectations of higher construction activity for 2016.
Q2: How is this rally likely to evolve?
The profitability of steel mills is the key indicator to watch, in our view. Higher steel prices encourage idled blast furnaces to incur start-up costs and resume production, but this window of profitability is currently at risk because of rapidly rising iron ore prices and a persistent mismatch between steel-making capacity and Chinese demand.
Q3: Why are we still bearish on iron ore?
We expect the current rally to be short-lived in the absence of a material increase in Chinese steel demand, and steel raw materials will once again drive steel prices rather than the other way around. The price signal to shut down marginal supply ex-China has been turned off temporarily but seaborne demand has essentially peaked and the stream of announced production cuts is bound to resume in the months ahead.
* * *
We have no doubt that Goldman will be right… in the months ahead. In the overnight session, we can’t help but feel sorry for anyone who decided to trade on Goldman’s reco and short ahead of today’s move.
end
“The Iron Ore Market Has Gone Berserk” – What Drove Iron’s Biggest Surge Ever
‘Efficient’ markets at their very best once again. Following a 19% spike overnight, analysts and traders alike are stunned by “the departure from fundamentals” as “the iron ore and steel markets have gone berserk.” On the heels of home price surges, sent soaring after government suggestions that they will support growth, “investors are expecting further monetary easing by the Chinese government to boost steel demand,” but as Bloomberg notes there has been no “corresponding increase in physical orders.”
Seriously…

As Bloomberg reports, Monday’s surge was accompanied by a rally in producer stocks. Australia’s Fortescue Metals Group Ltd. jumped 24 percent in Sydney trading, where Rio Tinto Group and BHP Billiton Ltd. also climbed. Rio, the second-biggest mining company, rebounded from an earlier decline in London trading and was up 0.4 percent by 12:15 p.m. local time.
“There may be some short-covering in the futures markets today,” said Xu Huimin, an analyst at Huatai Great Wall Futures Co. in Shanghai, referring to investors closing bets on declines.
“The crazy surge in futures prices has surprised traders and steel mills, as they haven’t seen a corresponding increase in physical orders.”
“The recent boom of the real estate market and price has positive influence on the steel price,” Michael Zhu, president of Hong Kong-based trader Millennia Resources Ltd. and former global sales director of Vale SA, said by e-mail. The “market believes the demand for steel will be increased with the recovery of real-estate market.”
However, while at the annual National People’s Congress at the weekend, the authorities said they’d allow a record high deficit and higher money-supply target to support growth of 6.5 percent to 7 percent; they also vowed to help cut overcapacity in steel, potentially curbing demand for iron ore.
“We expect the current rally to be short-lived,” analysts Christian Lelong and Amber Cai said in a note predicting further growth in iron ore supply in the quarters ahead.
“The causality will revert sooner rather than later, and steel raw materials will one again drive steel prices rather than the other way around.”
Recent gains in iron ore probably won’t last, Goldman Sachs Group Inc. said in a report received on Monday, forecasting a drop back to $35 a ton in the final quarter. This year’s rally has been driven by rising steel prices in China, a reversal of the normal relationship seen between the raw material and the manufactured product, Goldman said.
end
This is shear idiocy: dry bulk carriers are up dramatically in their stocks. Eagle Bulk is up a whopping 340% in two days. And now China is planning on decreasing exports…just great for our dry bulk shippers:
(courtesy zero hedge)
Iron Ore ‘Frenzy’ Sends Dry Bulk Shipper Stock Up 340% In 2 Days
The “berserk” iron ore market has created a tsunami of utter idiocy and short-covering across many sectors, most egregiously – dry bulk shippers. DRYS is up 18%, DSX up 20%, and NM up 25%, but Eagle Bulk (EGLE) is the big winner as the mania underlying iron ore combined with an earlier filing said to amend forebearance as the company tries to find financing alternatives, spiked the stock up 340% in 2 days.
Up 340% in 2 days… back to unchanged on the year…

Eagle Bulk Shipping Inc. owns a fleet of dry bulk vessels and transports a range of major and minor bulk cargoes. The Company transports iron ore, coal, grain, cement, and fertilizer along worldwide shipping routes.
And the utter farce is that while Iron ore prices surge on the heels of China’s NPC, they ironically stated that they will rationalize capacity – thus implying notably less exports (and therefore less demand for dry bulk shippers)
BlackRock Can Buy Gold Again: IAU Suspension Lifted After 300 Million New Shares Registered
Something strange happened on Friday: as a result of the 20% YTD surge in the price of gold and “surging demand”, BlackRock announced it had temporarily suspended the creation of new shares of its $7.8 billion gold Exchange Traded Product IAU “until additional shares are registered with the Securities and Exchange Commission.”
Today, Blackrock explained what happened: in a nutshell, as a result of a surge of investor buying of IAU between February 19, 2016 and March 3, 2016, the “Trust issued and sold a total of 24,900,000 Shares in excess of the total Shares registered.” Effectively, IAU was in violation of SEC rules after selling 25 million shares more than it had registered for. The temporary suspension also meant the ETP could not satisfy investor demand for gold on Friday as it was prohibited from creating new share units.
Blackrock called the failure to register earlier “inadvertent.”
To promptly remedy this non-compliance, BlackRock filed an S-3 statement this morning, registering another 300 million IAU shares,which as the chart below shows boosts its total eligible shares outstanding by nearly 50%.

The increase in shares brings the new eligible total far above the total Blackrock had available as of the gold price in 2011, and also above the last peak in IAU outstanding shares which peaked around 700 million.
This also means that there are no more structural limitations preventing IAU to buy as much gold as there is demand.
The filing can be found here, and the relevant language is below:
On March 20, 2015, the Trust filed an automatic shelf registration statement registering 120,000,000 Shares (the “Prior Shelf Registration Statement”). Between February 19, 2016 and March 3, 2016, the Trust issued and sold a total of 24,900,000 Shares in excess of the total Shares registered on its Prior Shelf Registration Statement (the “Excess Shares”). The failure to file a new automatic shelf registration statement of which this prospectus is a part before the Trust sold more than the Shares registered on the Prior Shelf Registration Statement was inadvertent. On March 3, 2016, the Trust became aware of the error and immediately suspended the issuance of additional Shares pending the filing of a new automatic shelf registration statement of which this prospectus is a part. The Excess Shares were not registered at the time of their initial sale, and may not qualify for an exemption from registration, under the Securities Act of 1933, as amended (the “Securities Act”). Authorized Participants and other investors who purchased Excess Shares could have rescission rights. If rescission rights are exercised by these investors, the Trust may be required to reacquire the Excess Shares at a price equal to the price originally paid for such Excess Shares, plus interest owed to the investor on such Excess Shares. Any such investors who no longer own the Excess Shares they acquired may have the right to collect damages from the Trust in lieu of the rescission rights described above. If investors were successful in seeking rescission and/or damages, the Trust would face financial demands that could adversely affect its reputation, business and operations. Additionally, the Trust may become subject to penalties imposed by the SEC and state securities agencies. If investors seek rescission and/or damages or the Trust elects to conduct a rescission offer, the Trust may or may not have the resources and will need to sell gold potentially at unfavorable prices to fund the repurchase of the Excess Shares.
Something curious: in the filing BlackRock revealed that it may have to sell gold in the fund in order to buy back the shares that were inadvertently not registered and pay interest to investors who purchased the shares. Those investors “may have the right to collect damages” from the fund, the filing said. One almost wonders if BlackRock will be selling those 24.9 million IAU shares just as gold is undergoing its next surge.
We wonder if any other gold ETPs will do the same “inadvertent mistake” and oversell gold, just to have the freedom of selling millions of gold-backed shares at their sole discretion to cover the costs from “repurchasing the Excess Shares”?
end
(courtesy Koos Jansen/)
India’s gross bullion import reached 947 tonnes or 43% of gold production ex China ex Russia). Silver production 8504 tonnes or 273 million oz or 39% of annual silver production ex China ex Russia)
Posted on 7 Mar 2016 by Koos Jansen
Precious Metals Import India 2015 Strong, Government Hopelessly Continues To Obstruct Demand
While India’s gross gold bullion import in 2015 reached the third highest amount ever at 947 tonnes and gross silver bullion import reached the highest amount ever at 8,504 tonnes, the Indian government is perpetually trying to obstruct the populace from protecting their wealth.
Last week I was going through gold and silver trade data released by the Indian Directorate General of Commercial Intelligence and Statistics(DGCIS) and observed strong import of precious metals in 2015. At the same time I was reading the documents, news came out that stated the Indian government was to implement extra rules to hinder its people from buying gold. In my view, the situation in India is another perfect example of a government’s nonsensical fight against the economic tide. Central banks do it all time don’t they?
In an ongoing failure to understand what capitalism is about, the Indian government continues to “disagree” with its citizenry where savings should be placed. Whenever the Indian people increase gold purchases to secure their financial wellbeing, the government is keen to find new tactics to suppress this free market expression. The government aims the country’s wealth to be where it suits them – in the fiat currency they issue and control, but the populace believes fiat currency is inherently vulnerableand chooses physical gold for its long-term wealth preservation. It seems the more the Indian rulers resist private gold demand, the stronger the forces they’re fighting become. As we’ll see below, most undertakings by the government to keep its people from buying gold have been in vain…
-END-
The ECB is starting to report unallocated gold vs allocated gold but still refuse to seperate gold swaps from actual holdings. This is probably where much of the European gold holdings are compromised:
(courtesy Chris Powell/GATA)
| ECB starts reporting unallocated gold, but is it the whole story? |  |
Submitted by cpowell on 10:23AM ET Monday, March 7, 2016. Section: Daily Dispatches
1:35p ET Monday, March 7, 2016
Dear Friend of GATA and Gold:
Our friend the Dutch economist Jaco Schipper reports an increase in transparency about gold in the monthly reserve asset reports of the European Central Bank.
Since last August, Schipper notes, the ECB’s monthly report has been distinguishing the allocated from the unallocated gold in the holdings of its member central banks, with less than 2 percent of the gold now being reported unallocated. That is, almost all the gold of the members of the European Central Bank is reported as being specifically identified as owned by those banks in whatever vaults are storing it, and little of their gold has consisted of mere credits with other institutions:
https://www.ecb.europa.eu/stats/external/reserves/html /in dex.en.html
But the ECB continues to combine gold deposits and gold swaps in a single line in its reserve report and does not identify the counterparties of the swaps and the locations of the swapped gold, putting in question both the central bank’s overall gold position and the degree of its secret intervention in the gold market, direct and indirect.
Of course the ECB’s new accounting was implemented subsequent to Gautier’s statements, so the practices of the ECB and its members may have changed since Gautier spoke. Certainly the ECB’s greater transparency is an improvement. But as long as the central bank combines gold deposits and gold swaps in a line item, failing to distinguish them, any funny business is possible. And surely the ECB knows a lot more about central bank intervention in the gold market than it is telling.
After all, the interview done by Kitco News last October with Peter Mooslechner, executive director of Austria’s central bank, another ECB member bank, in which he acknowledged that Asian central banks were both acquiring gold and “using their reserves in trading in the market and intervening into the market,” confirmed that central banks know very well what each other is doing surreptitiously in the gold market and why:
That is, all major central banks are party to gold market manipulation. They’re just not telling the whole story to the rest of us, lest the world financial system start enjoying free markets and risk becoming more democratic.
CHRIS POWELL, Secretary/Treasurer
Gold Anti-Trust Action Committee Inc.
CPowell@GATA.org
end
Dave Kranzler reports that mining shares are ripping higher and the bankers are having a tougher time orchestrating a severe raid on gold and silver metal
(courtesy Dave Kranzler/IRD)
The Bulls Are Loose As The Mining Stocks Are Ripping Higher
To the surprise of most, mining stocks continued their stunning upward move that began around January 20. Toward the end of last week, financial media goons, chart readers and analysts who rely on the CFTC’s Commitment of Traders report for “insight” into market direction were all calling for a sharp pullback in the precious metals sector. Most market “oracles” were calling for a sharp retreat in the price of gold below $1100 and silver below $14.
Perhaps most amusing about the plethora of “correction time” and “overbought” commentary on the metals sector is: 1) because of the overt and continuous official intervention in the precious metals sector since 2011, it could be argued that the entire sector has been “artificially” oversold for the better part of five years; we don’t know where the true “oversold/overbought” statistical levels should be because natural price discovery in the sector has been completely suffocated; 2) the current stock market, adjusted for bona fide GAAP numbers, is the most overvalued in history; the stock market, by the same intervention/manipulative forces holding down the metals, has been artificially “overbought for at least 3-4 years now; yet, no one writes commentary on the need for a big price correction in the stock market.
Too be sure, whenever the COT report shows an extreme level in the bullion bank short position in gold and futures, offset by an extreme long position held by the hedge funds, the criminal banks implement a “COT stop-loss hedge fund long liquidation” algorithm which sets off the stop-losses set by the hedge funds and causes the now-familiar “waterfall” chart patterns that result from heavy bank manipulation of Comex trading.
So far every attempt to trigger forced liquidation of gold/silver futures has failed. That’s not to say that it won’t happen. But what makes this current rally even more interesting is the fact that it is occurring while the stock market continues to squeeze higher despite the continued deterioration in economic data.
Typically the precious metals sector will, in general, move inversely to the stock market. The fact that it has moved in correlation with the S&P 500 over the last three weeks suggests that either the precious metals “market” sees the recent move in the stock market as a “faux” rally or the smart money is selling stocks into this rally and moving capital into the precious metals sector, or both.

(click on image to enlarge) The graph to the left shows the last two years of trading in GDX. As you can see, the current move up in the mining stocks has not yet “corrected” the sell-off that occurred in early 2015. You can see that the manipulated sell-off from Jan 2015 to July 2015 was accompanied by a steady decline in volume. Over the next six months, the mining stocks formed what appears to be a very powerful base which was supported with heavy volume. THAT is the unmistakable sign of smart money accumulating highly oversold and extraordinarily cheap mining shares.
I also believe that the current move up in the miners from mid-January reflects the absurd amount of short-selling and naked short-selling that has infested the mining shares since April 2011. Naked shorting has become a big problem but we only heard about it when the S&P 500/Dow were plunging back in 2008-2009. Once the Fed had stabilized the “problem” and began pushing stocks higher with QE, suddenly the naked-short selling was no longer an issue. What happened to the Congressional inquiries and threats of legislative action?
While impossible to prove, it is 99.9% probable the naked short selling in the mining stock sector has been unimaginably immense – historically unprecedented. But once the hedge funds and bullion banks are through fixing their problematic short positions in the miners, they will follow-through with enormous buying.
I am expecting a correction to begin sometime soon. But when that correction has run its course, make sure you are ready to add or initiate positions in high quality junior mining shares, because I believe the next extended bull move in the mining shares will offer the to  potential to make a life-style changing amount of money.
Questions and answers from Bill Holter and Jim Sinclair
(courtesy Bill Holter-Sinclair collaboration)
Questions and Answers From Readers–March 6th
Posted March 6th, 2016 at 4:02 PM (CST) by Bill Holter& filed under Reader Q&A Talks.
Dear CIGAs,
Bill Holter and Jim Sinclair sat down and answered reader’s questions in their second Q+A session. Topics discussed were the ESF and monetization of debt, negative interest rates and the possibility of a cashless society, hyperinflation, derivatives, and of course gold and silver. Other topics included the state of politics in the U.S. and their upcoming premium content at Jim Sinclair’s Mineset.

courtesy David P/KWNews
:
1 Chinese yuan vs USA dollar/yuan DOWN to 6.5176 / Shanghai bourse IN THE GREEN : / HANG SANG CLOSED DOWN 16.98 POINTS OR 0.08%
2 Nikkei closed DOWN 103.46 OR 0.61%
3. Europe stocks IN THE RED /USA dollar index UP to 97.55/Euro DOWN to 1.0954
3b Japan 10 year bond yield: FALLS TO -.035% AND YES YOU READ THAT RIGHT !!!!(Japan buying 100% of bond issuance)/Japanese yen vs usa cross now at 113.52
3c Nikkei now well below 17,000
3d USA/Yen rate now well below the important 120 barrier this morning
3e WTI:: 36.49 and Brent: 39.30
3f Gold UP /Yen UP
3g Japan is to buy the equivalent of 108 billion uSA dollars worth of bond per month or $1.3 trillion. Japan’s GDP equals 5 trillion usa.
Japan to buy 100% of all new Japanese debt and by 2018 they will have 25% of all Japanese debt. Fifty percent of Japanese budget financed with debt.
3h Oil UP for WTI and UP for Brent this morning
3i European bond buying continues to push yields lower on all fronts in the EMU. German 10 yr bund RISES to 0.207% German bunds in negative yields from 8 years out
Greece sees its 2 year rate RISE to 10.49%/:
3j Greek 10 year bond yield FALL to : 9.89% (yield curve INVERTED)
3k Gold at $1269.75/silver $15.67 (7:15 am est)
3l USA vs Russian rouble; (Russian rouble UP 3/100 in roubles/dollar) 71.84
3m oil into the 36 dollar handle for WTI and 39 handle for Brent/
3n Higher foreign deposits out of China sees huge risk of outflows and a currency depreciation (already upon us). This can spell financial disaster for the rest of the world/China forced to do QE!! as it lowers its yuan value to the dollar/expect a huge devaluation imminently from POBC.
JAPAN ON JAN 29.2016 INITIATES NIRP
30 SNB (Swiss National Bank) still intervening again in the markets driving down the SF. It is not working: USA/SF this morning .9998 as the Swiss Franc is still rising against most currencies. Euro vs SF is 1.0955 well above the floor set by the Swiss Finance Minister. Thomas Jordan, chief of the Swiss National Bank continues to purchase euros trying to lower value of the Swiss Franc.
3p BRITAIN STARTS ITS CAMPAIGN AS TO WHETHER EXIT THE EU.
3r the 8 year German bund now in negative territory with the 10 year RISESto + .207%
/German 8 year rate negative%!!!
3s The Greece ELA NOW at 71.4 billion euros,
The bank withdrawals were causing massive hardship to the Greek bank. the Greek referendum voted overwhelming “NO”. Next step for Greece will be the recapitalization of the banks and that will be difficult.
4. USA 10 year treasury bond at 1.90% early this morning. Thirty year rate at 2.71% /POLICY ERROR)
5. Details Ransquawk, Bloomberg, Deutsche bank/Jim Reid.
(courtesy Jim Reid/Bloomberg/Deutsche bank/zero hedge)
Futures Lower On Lack Of China Stimulus; Oil Squeeze Continues; Gold Spikes Ahead Of ECB
In the aftermath of last week’s disappointing G-20 Shanghai summit, there was much riding on this weekend’s start of the China’s People’s Congress, and specifically what if any stimulus announcement Beijing will make; sadly for stimulus addicts China disappointed and after the unimaginative scope of growth proposals none of which it will come remotely close to hitting, it is hardly surprising that European stocks and US equity futures have taken a leg lower, even if Chinese stocks rose and certain commodities such as Iron Ore soared overnight on hopes China will either “rationalize” capacity or at least build some more roads to nowhere. Others, such copper were less lucky.
While few will admit, what is happening is that China has effectively confirmed the current reform cycle has been a failure and is going back to square one: as Nicola Marinelli, a fund manager at Pentalpha Capital In London told Bloomberg, “China is serving more of the same solution, more stimulus, but it just makes things worse later and it’s becoming apparent that it cannot sustain the official growth rate.
Elsewhere, European banks are starting to slide now that attention turns to Thursday’s ECB meeting when Mario Draghi is expected to further cut the European deposit rate by 10 to 20 bps, in the process further impairing bank profits. On this Marinelli said, “the ECB might also disappoint, GDP growth remains sub-par and we don’t know what to do about it, while a higher oil price means higher inflation soon and hence less headroom for central banks.”
Aside from equities, the oil ramp has shown some further strength overnight as “weak hand” shorts continue to be squeezed, while gold’s levitation continues on concerns how other central banks will respond in the global currency war in retaliation to the ECB’s further monetary easing this week.

WTI extends gains to 2 month highs after the U.S. rig count fell to lowest since Dec. 2009. Brent touches highest since Dec. amid speculation ECB will increase stimulus when it meets Thursday. “On the supply-side we are continuing to see a freefall in the rig count, which confirms what has been the U.S. supply outlook for some time that we’d see production stop gaining and decline this yr,” says Danske Bank senior analyst Jens Pedersen. “The rate the rig count has fallen means output may decline harder than what was expected.”
As of this moment, according to Bloomberg, European shares fell with metals, while the dollar and German bonds climbed, as investors assessed the impact of China’s growth plans and the potential for European Central Bank stimulus measures this week. Miners led declines in the Stoxx Europe 600 Index, with Glencore Plc and Anglo American Plc among the biggest losers, a turnaround from last week’s rally. Copper fell from a four-month high, while investors continued adding to gold holdings. French bonds led gains in euro-area government securities, while the euro sank on speculation the ECB will lower the deposit rate and boost bond purchases. Crude extended last week’s gains.
The Stoxx 600 was down 0.8 percent as of 11:06 a.m. London time, while copper sank 0.8 percent. The euro fell 0.5 percent to $1.0956 and yields on German 10-year bonds fell three basis points to 0.2 percent.
Where the markets stand now:
- S&P 500 futures down 0.5% to 1986
- Stoxx 600 down 0.9% to 339
- FTSE 100 down 0.9% to 6145
- DAX down 1.3% to 9695
- German 10Yr yield down 4bps to 0.2%
- Italian 10Yr yield down 2bps to 1.44%
- Spanish 10Yr yield up 2bps to 1.58%
- MSCI Asia Pacific down 0.2% to 126
- MSCI Asia Pacific down 0.2% to 126
- Nikkei 225 down 0.6% to 16911
- Hang Seng down less than 0.1% to 20160
- Shanghai Composite up 0.8% to 2897
- US 10-yr yield up 3bps to 1.9%
- Dollar Index up 0.25% to 97.59
- WTI Crude futures up 1.1% to $36.32
- Brent Futures up 1% to $39.10
- Gold spot up 0.7% to $1,268
- Silver spot up 1.2% to $15.70
Top Global News:
- Jefferies Said to Reorganize Leveraged Finance, Promoting Walsh: Unit chief Lockhart, sponsors head Sokoloff said to leave bank. Firm looks to boost coordination between unit, joint venture
- Wells Fargo Said to Seek Dealmaking Chief to Succeed Laughlin: Seeking a new head of mergers and acquisitions to succeed John Laughlin, who will serve as vice chairman of the business
- United’s Munoz Returns as CEO Next Week After Heart Transplant: Chief had undergone transplant surgery in early January. ‘I’m ready to join you,’ he tells airline workers in a video
- Apple Software Chief Warns One Phone Break-in Can Wreak Havoc: Federighi argues government order seeks to weaken security. Criminals could exploit IPhone backdoor once created
Looking at regional markets, we start in Asia where stocks traded mostly higher following last Friday’s positive close on Wall St. where firm Non-Farm Payrolls figures and a resurgence in the commodities-complex boosted sentiment. ASX 200 (+0.93%) and the Shanghai Comp (+0.65%) was led higher by commodities after WTI broke above the USD 36/bbl level and iron ore extended on gains to hit limit up in Shanghai. Elsewhere, Nikkei 225 (-0.44%) underperformed as large exporter names were pressured by JPY strength.
Chinese Premier Li announced a GDP growth target range of between 6.5%-7.0% for this year vs. about 7.0% target last year, which is the first time China has opted to target a growth range in 20 years. Premier Li also announced details of China’s 5 year plan in which it aims for minimum growth of 6.5% annually through to 2020 and will also introduce a range of tax cuts this year. (Nikkei)
Top Asian News
- CLOs Revived in Japan for First Time Since 2011 Amid Yield Hunt: Japan Finance Corp is set to sell 7.5b yen ($66m) of bonds backed by loans of regional banks
- Australia Sees Resources Price Rebound as Supply Gluts Ease: Commodity demand will rebound on Asia’s urbanization, population to spur demand, Resources and Energy Minister says
- China Said to Plan Crackdown on Loans for Home Down- Payments: Chinese regulators plan to impose new rules, as they step up scrutiny of financing risk in property markets
- China’s Growth Addiction Leaves Deleveraging in Back Seat: Baseline of 6.5% GDP growth through 2020 curbs policy scope, more fiscal, monetary support on its way, as is more debt
- Malaysia Palm Reserves Seen at 11-Month Low as Output Falls: Feb. production seen at lowest since 2011
Despite the apparent risk on sentiment observed over during the Asian trading session, partly in reaction to supportive comments by Chinese Premier Li, positioning ahead of key risk event meant that stocks traded lower since the get-to in Europe. At the same time, combination of profit taking and healthy scepticism by some IB names in relation to the recent upside in base metals, meant that material names underperformed on the sector breakdown. The cautious sentiment also translated into upside bias by Bunds, though Gilts have underperformed amid the ongoing Brexit concerns. Though peripheral bond yield spreads traded mixed, with GR/GE 10y wider by 5bps, while FR/GE 10y spread tightened by 1bps.
Top European News
- EDF Finance Chief Resigns as U.K. Hinkley Point Decision Nears: Piquemal said to be worried that final decision being rushed. Executive expressed concern over financial impact of project
- BASF Said Working With Banks to Weigh Counter-Bid for DuPont: German chemicals company said undecided whether to proceed. BASF said to have spoken to DuPont last year before Dow merger
- Old Mutual Rises Most in Three Months on Speculation of Breakup: climbed in Johannesburg trading after the company said it’s considering all options for the business as part of a strategic review. Co. also traded in London
In FX, there are few discernible themes to note today. We would have expected some adjustment lower in the EUR pairs, but the lead spot rate dropped back from 1.1000+ highs to find fresh support in the mid 1.0900’s. All eyes and ears are on the ECB meeting this week, and despite fears that policy action will not be ‘enough’ to appease the market, the disappointment factor is prompting EUR support already. Cable is suffering a little as EUR/GBP grinds higher — this despite the latest YouGov poll showing the ‘stay in’ camp maintaining a lead for 4 consecutive weeks. Pressure on USD/JPY and the respective cross rates as BoJ Kuroda continues to warn against fresh policy expectations. Spot now back in the mid 113.00’s, but no real momentum on the downside to note as yet. Oil prices holding up, but the CAD off better levels along with the AUD and NZD.
The energy complex largely shrugged off downbeat sentiment that dominated the price action over the Europe, with both WTI and Brent crude futures trading higher, as the focus remained on the better than expected US data and the ongoing reduction in US rig count. Elsewhere, copper prices declined marginally from 4-month highs on profit taking, while iron ore continued to surge alongside steel rebar gains with both hitting limit up in early Shanghai trade which in turn saw Singapore iron ore futures advance over 16% amid expectations steel mills will be ramping up production.
Iranian oil official stated that Iran’s oil and gas condensate exports are to hit 2mln bpd by month-end. (SHANA) Also of note, it was reported citing UAE minister stating that the state has not received an invitation for oil producers meeting.
Looking at today’s event calendar, the only data of note in the US this afternoon is the January consumer credit reading.
Bulletin Headline Summary
- Cautious sentiment dominated the price action as market participants position for the upcoming ECB policy meeting
- EUR/USD failed to benefit from the un-wind of carry-related flow and instead the price action was dominated by pre-positioning ahead of the eagerly awaited ECB policy meeting
- Going forward, there is little in terms of tier-1 economic releases and the price action is widely expected to remain a by-product of ECB based policy expectations
- Treasuries lower in overnight trading with global equities dropping, WTI crude oil rises above $36/barrel ahead of this week’s ECB meeting and $56b in U.S. auctions beginning tomorrow.
- ECB has unleashed stimulus at 10 of the 47 monetary-policy meetings since Draghi took the helm; for this week’s decision, economists in a Bloomberg survey are nearly unanimous in predicting action; For banks operating in the country to have endured negative interest rates longer than any other place on earth, last year was actually pretty good
- German factory orders dropped 0.1% in January from the prior month, when they slid 0.2%, in a sign that a global slowdown and weak domestic pricing power may be hurting Europe’s largest economy
- In meetings with Iranian leaders Greek Prime Minister Tsipras pressed for measures to encourage Afghan refugees currently in Iran to stay there
- Bank of Japan Governor Haruhiko Kuroda said Monday that the impact of a sales tax increase scheduled for April 2017 would be much less than the hike in 2014 — which sent Japan into a recession (Harvey: no way!!)
- China’s foreign-exchange reserves dropped by $28.6 billion to $3.2 trillion in February, its smallest decline since June, as the nation’s financial markets stabilized and policy makers took more steps toward shoring up growth
- Persistent capital outflows from China since mid-2014 were probably driven more by local companies paying down their dollar-denominated debt — in anticipation of a stronger U.S. currency — than investors ditching assets, according to the BIS
- Demand is so great for benchmark 10-year Treasuries in the $1.6 trillion market for borrowing and lending U.S. government debt, and supply so short, that the overnight repo rate on the newest 10-year note was negative 2.7% at the end of last week
- Bill Gross said Treasuries will draw support from investors seeking alternatives to near-zero yields abroad, aiding the market as the Federal Reserve raises interest rates
- $350m IG corporates priced Friday; week $59.225b, YTD $336.075b
- $475m HY priced Friday, $3.65b on the week, $16.33b YTD
- BofAML Corporate Master Index OAS 4bp lower Friday at +195, -11bp MTD, +21bp YTD; T1Y range 221/129
- BofAML High Yield Master II OAS 20bp lower Friday at +708, -27bp MTD, +13bp YTD; T1Y range 887/438
- Sovereign 10Y bond yields mostly steady; European, Asian markets lower; U.S. equity-index futures rise. WTI crude oil, gold rally, copper falls
DB’s Jim Reid concludes the overnight wrap
No doubt about what the big event of the week is…. Liverpool vs. Man U in the Europa League. As a warm up act we have the eagerly anticipated ECB meeting on the same day. I’m not sure if one is ever meant to feel sorry for central bankers, but this Thursday’s meeting is an incredibly hard one to calibrate for a variety of reasons. Firstly the market which was in panic mode 3-4 weeks ago is slowly regaining poise partly on expectations of action from the ECB and partly on higher oil and better recent US data. So expectations had been building up in weaker markets than we’re seeing now. However European data has been disappointing over this period relative to the US and inflation expectations are going lower again with lingering worries about what the recent sell-off in bank equities might mean for lending and thus growth going forward.
Like with the December meeting, expectations are high but 3 months further on the market is going to not only be sensitive to the scale of action but also the nuances. Simple standard cuts further into negative deposit rate territory could easily be seen as negative for banks and in turn the economy and markets if it’s perceived to impact their profitability and thus the transmission mechanism. As Mark Wall pointed out to me even front loading/increasing QE is a risk if it flattens curves further and erodes net interest margins. On the other hand being kind to banks might be seen as counter-productive medium-term as the ECB is keen for banks to adjust to the new world and find a more sustainable business model. So although policy aimed at increasing bank profits might be good for the economy in the short-term it’s hard to imagine the ECB sanctioning this without being in a deep crisis.
So where are DB’s expectations given all this? Mark Wall thinks we’ll see a two-tier system producing a cumulative fall in the Eonia rate of about 10bps. Note that this implies a much larger cut on the rate attached to the lowest tier. Second, his expectation is for new TLTRO auctions until the end of 2017. To further incentivise lending the ECB could decide to introduce a dedicated negative refi rate only for the TLTROs but there remains the risk that the Governing Council sees a negative refi rate as an unwarranted relief for banks. Third, the Governing Council could compromise by agreeing upon a temporary EUR 10bn acceleration in the pace of its monthly QE purchases. Mark feels his team is at the lower end of market expectations, and overall the risks are skewed towards less action. To sum up in a sentence, for the market to be happy it probably wants to see some way of prioritising credit easing over QE/simple deposit cuts.
All that to look forward to on Thursday but in the meantime the bulk of weekend’s newsflow has been focused on China and specifically the important snippets of information which have come out of the NPC. As widely expected we’ve had confirmation from the Premier Li Keqiang that the government is targeting GDP growth of between 6.5% to 7.0% this year (remember this had already been mentioned by the head of the NDRC back in January), with 6.5% also being set as the baseline rate through to 2020. In order to achieve this, the Premier is also proposing for a budgetary fiscal deficit of 3.0% of GDP this year, up from the 2.3% target last year (and 2.4% actual number). As well as this, the M2 growth target has been raised to 13% from 12% and the CPI increase is to be kept around 3%. Commenting on the announcements, DB’s Zhiwei Zhang thinks that the actual fiscal deficit and M2 growth may well exceed their targets again in 2016. Zhiwei highlights that Premier Li reiterated the government will try to avoid a massive general fiscal stimulus, but the recent policy actions seem to suggest a quite significant policy easing, including record high new loans in January, a rapid rise of bond issuance, a RRR cut and lower down payments required. This is suggesting that the overall fiscal policy stance may loosen more than the central government fiscal deficit suggests and Zhiwei is forecasting for the deficit to reach 4%, while on the monetary side he expects M2 growth to reach 14%.
Meanwhile, two announcements that have surprised Zhiwei from the work plan are the growth rates of budgetary fiscal revenue (cut to 3.0% from 5.8%) and expenditure (cut to 6.7% from 8.0%) being lower than they were in 2015, and secondly the work plan being less ambitious relative to 2015, on capital account liberalization and RMB internationalization. Zhiwei and his team maintain their growth forecast of 6.7% this year, with Q3 and Q4 in particular showing slowdown. They expect two more interest rate cuts in H2 and 3 more RRR cuts, one in each quarter beyond Q1.
Bourses in China have kick-started the week on the front foot post the weekend newsflow with the Shanghai Comp and CSI 300 up +0.78% and +0.59% respectively at the midday break, while the tech heavy Shenzhen has rallied for a +2% gain. Markets are also waiting on China’s latest FX reserves data which is due out at any stage now, while headlines this morning on Bloomberg suggesting that Chinese regulators are to stamp down on loans for house down-payments is also attracting some focus.
Elsewhere it’s a bit more mixed across the Asia region this morning. The Nikkei is down -0.47%, the Hang Seng is flat but has been volatile on the back of the news that Hong Kong residential home sales were said to have fallen 70% yoy in February, while there’s been gains for the Kospi (+0.26%) and ASX (+1.17%). Credit markets in Asia and Australia are flat to modestly tighter.
Meanwhile the US Presidential race – and specifically the Republican battle – has seen Ted Cruz pick up two victories in Kansas and Maine, with Trump taking Louisiana and Kentucky. Importantly, the victories for Cruz have seen him solidify his role as the main challenger to Trump in the Republican race in what’s looking now like a two-horse race.
Moving on. So after the whisper number had been leaning lower heading into Friday’s employment report, February nonfarm payrolls proved to be a big surprise to the upside with a robust and consensus beating +242k (vs. +195k expected) of job gains including 30k of upward revisions to prior months. In fact the number was higher than 91 of the 92 Bloomberg economist forecasts with retail and healthcare sectors leading the charge and defying that weaker ISM services employment print which had people nervous. The other good news was the U-3 unemployment rate holding steady at 4.9% as expected, the broader U-6 measure edging down two-tenths to 9.7% and the lowest since May 2008, while the labour force participation rate ticked up two-tenths to 62.9% (vs. 62.8% expected) and the highest since July 2014. It wasn’t all good news however. Notably, average hourly earnings unexpectedly declined last month by -0.1% mom (vs. +0.2% expected) which had the effect of dragging down the YoY rate by three-tenths to 2.2%. As well as this, average weekly hours worked fell from 34.6 hours to 34.4 hours. While some of the chatter blamed the softer earnings data in particular on the timing of the survey, much of the debate switched towards the slowdown in hours rather than employment being an obvious response to weak productivity.
The initial reaction in markets was for the US Dollar to rally and equities to wipe out the bulk of the day’s gains. That was until the energy markets had their daily say. WTI (+3.91%) rallied to finish up close to $36/bbl (with the latest rig count decline boosting sentiment) to cap a near 10% rally over the week, while base metals also continued their strong run on Friday with Copper (+3.55%), Nickel (+3.78%) and Iron Ore (+4.98%) all up strongly. That saw European equities bounce back into the close (Stoxx 600 +0.70%) while the S&P 500, after initially opening in the red, finished +0.33% and a whisper below the 2000 level (closed at 1999.99) for its fourth consecutive daily gain and the longest such run since October. The USD index closed -0.38% with EM currencies the big winners yet again, while 10y yields edged up 4bps to 1.874%
Meanwhile the rally in credit continued with CDX IG another 2.5bps tighter on Friday, the eight day the index has finished stronger. European credit rallied too (Main -3bps, Crossover -15bps) while in a sign of how quickly sentiment can turn, BNP Paribas issued a subordinated bond deal on Friday, the first such deal by a European financial since the volatility which swept over the sector towards the end of January. The bonds ultimately pricing at the tight end of guidance.
Away from this the only other data of note was a confirmation of a widening in the US trade deficit to $45.7bn from an upwardly revised $44.7bn in December. The Fed’s Kaplan also spoke again, saying that while he was pleased with last month’s employment report he still wants to see more evidence that the Fed will meet its inflation objective and that the Fed doesn’t have many tools left should the US fall into another recession.
Onto this week’s calendar now. Kicking off proceedings this morning in Europe is Germany where we’ll receive the January factory orders, followed closely by the latest Euro area investor confidence reading. The only data of note in the US this afternoon is the January consumer credit reading. It’s a busy morning for data in Asia tomorrow with the final revision to Q4 GDP in Japan, as well as the all important February trade numbers out of China. In Europe Germany industrial production and French trade data is due out prior to the preliminary reading for Euro area Q4 GDP (+0.3% qoq expected). It’s another quiet afternoon in the US on Tuesday with just the NFIB small business optimism print due. Wednesday is a light day for data all round with just French business sentiment and UK industrial production due in the morning, followed by the January wholesale inventories and trade sales data for the US in the afternoon. The focus of Thursday morning is in China again where we’ll get the February CPI and PPI prints, along with Japan PPI data. In Europe we’ll see German trade data and French industrial production prior to the main event of the week in the ECB monetary policy meeting in the early afternoon, with Draghi scheduled to speak after. In the US on Thursday we’ll see the latest initial jobless claims data along with February Monthly Budget Statement. We close the week on Friday in Europe with the final revision for Germany CPI in February and UK trade data. The final data of the week in the US is the February import price index.
Away from the data the only Fedspeak of note comes today when we’ll hear both Vice-Chair Fischer and Governor Brainard speak at 6pm tonight. Away from this the Euro area Finance Minister’s meeting in Brussels today may be worth keeping an eye on along with the emergency meeting between EU leaders on the refugee crisis this afternoon. We’ll also be keeping up to date with any further interesting information from the National People’s Congress in China.
Let us begin;
ASIAN AFFAIRS
Late SUNDAY night/ MONDAY morning: Shanghai closed UP BY 23.19 POINTS OR 0.50% ON A LAST HR RESCUE, / Hang Sang closed DOWN by 16.98 points or 0.08% . The Nikkei closed DOWN 103.46 or 0.41%. Australia’s all ordinaires was UP .1.04%. Chinese yuan (ONSHORE) closed DOWN at 6.5176. Oil GAINED to 36.49 dollars per barrel for WTI and 39.30 for Brent. Stocks in Europe so far IN THE RED . Offshore yuan trades 6.5187 yuan to the dollar vs 6.5176 for onshore yuan/ LAST WEDNESDAY, MOODYS DOWNGRADES CHINA’S CREDIT FROM STABLE TO NEGATIVE. At the big people’s congress where they meet to set a 5 year plan, the leaders failed to deliver a major fiscal stimulus package. However instead they made very promises:
(courtesy zero hedge)
China Fails To Deliver Major Fiscal Stimulus At People’s Congress, Makes Many Promises Instead
Back in October, the latest credit impulse in China just rolled over and died.
Ahead of the actual news, MNI said “one source familiar with the data said new loans by the Big Four state-owned commercial banks in October plunged to a level that hasn’t been seen for many years.”
Sure enough, when the numbers hit, it wasn’t a pretty picture. RMB new loans came in at just CNY514bn in October – consensus was far higher at CNY800bn. That was down 6.3% Y/Y. Total social financing fell 29% Y/Y to CNY447 billion, down sharply from September’s CNY1.3 trillion print.
So what, did China do you ask? Well, they unleashed massive fiscal stimulus:

The deluge of fiscal spending was at least the most since May 2014, and seemed to prove that between an acute over-capacity problem and jitters from the reverse-wealth-effect created by last summer’s stock market collapse, businesses and consumers had no desire to borrow, while rising NPLs meant banks were reluctant to lend. As we said at the time, it looked like Beijing was finally prepared to acquiesce to incomparable, pet-rock hating PhD economists like Citi’s Willem Buiter who said the following summer:
Fiscal policy can undoubtedly come to the rescue and prevent a recession in China. The first-best would be for the central government to issue bonds to fund this fiscal stimulus and for the PBOC to buy them and either hold them forever or cancel them, with the PBOC monetizing these Treasury bond purchases. Such a ‘helicopter money drop’ is fiscally, financially and macro-economically prudent in current circumstances, with inflation well below target and likely to fall further.
As we never tire of mentioning, that idea is absurd on its face: you’re simply printing one paper liability and buying it with a another paper liability that you also print.
In any event, fast forward to January, and credit impulse was back with a vengeance, as the Chinese created a mammoth $520 billion in credit ahead on the Chinese New Year. Or, visually:

So China created half a QE3 in the space of just a month, or, as we quipped, “Minsky wants his chart back”.
The reason for the surge was largely the result of frontloading loans mostly at smaller banks, as well as lending to government projects in the first year of 13th Five Year Plan, which helped to boost loan growth. Many economists had expected loans to slow sharply in February as lending to government projects wound down.
However, it turns out this was just the start of China’s latest policy, which is really just a return to its old policy of flooding the economy with debt: as Market News reports expectations that “January’s surprisingly strong new loan growth would prove temporary may have been premature as bank officials in a number of Chinese cities say February new loans look to be just as strong, even with a week-long holiday in the middle of the month.”
According to MNI, new loans so far in February were similar to the levels during the same days of January. The total so far in February is seen at around CNY2 trillion already (and that was weeks ago).
One month and one RRR cut (the fifth since early 2015) later, and perhaps, based on its own experience with expansionary monetary policies that have thus far failed to produce growth or perhaps by watching DM central banks plunge headlong into NIRPdom without making even so much a small dent in the disinflationary impulse, China has come to terms with that fact that perhaps a bit of fiscal stimulus may be the answer.
Well, “a bit,” turned out to be the right characterization, because on Saturday, Beijing said it will aim for an economic growth rate between 6.5-7 percent, (we already knew that) with a consumer inflation target of around 3 percent and money supply expansion of around 13 percent, according to a series of draft reports ahead of the opening of the 12-day parliament.
“Many investors had been hoping China would post an aggressive target for fiscal spending to prop growth,” Reuters notes. “But the draft goal of running a fiscal deficit equivalent to 3 percent of GDP, while up from the previous year’s target of 2.3 percent, still disappointed some who had hoped for a number closer to 4.”
As so, sorry Willem Buiter:

“That’s still the most red ink on the fiscsl account since 1979 and up markedly from last year’s 2.3%, but it’s not enough and should be increased,” a central bank advisor Yu Yongding told Reuters on the sidelines of the meeting.
And here’s an important point from Zhou Hao, economist at Commerzbank in Singapore, also quoted by Reuters: the low figure may reflect concerns that a higher number would signal tolerance for another spree of debt-fueled growth such as that Beijing embarked on in 2009.
In other words, getting too agressive here might have sent the wrong message that, having failed to make a swift transition from the smokestack, investment-led economy to a consumption and services led model, China is simply prepared to go right to back to what (used) to “work.” But that would simply plunge the coutnry back into an ultimately untenable position by exacerbating the acute overcapacity problem and thus driving up NPLs and down demand for credit (well, unless it’s credit companies are taking on to pay off old debts).
Primier Li also reiterated Beijing’s intention to address zombie companies through a combination of mergers, bankruptcies and debt deals.
As for that all important indicator of just where Chinese society is heading: 5.6 million state workers will be laid off in the next two to three years. Long torches and pitchforks.

So if China did not deliver the much desired (and needed by the market) stimulus (which was originally scheduled for last weekend’s disappointing G-20 meeting where nothing concrete emerged either due to Schauble vocal opposition to any more global monetary or fiscal stimulus) what did the first day of China’s National People’s Congress deliver? A lot of promises as the following list from Reuters shows. A whole lot of promises, none of which China will achieve.
Chinese Reserves Drop To Fresh Four Year Low After February’s $29BN Decline
After three consecutive declines in China’s Foreign Reserves in the November-January period, which averaged nearly $100 billion per month (with particular attention paid to last month’s number), consensus expectations were for a moderation in reserve outflows in February to approximately $40 billion in February; moments ago the PBOC reported, that as expected, reserve outflow “slowed down” to just $28.6 billion, bringing China’s total foreign reserves to $3.2 trillion, the lowest level since late 2011.

According to Goldman, accounting for currency valuation effects could amount to around +US$10bn, and therefore sales of FX reserves might have been about US$39bn in January (vs. estimated $89bn in January). In any case, with the February drop, Chinese total reserves are back to levels not seen in over 4 years.

One factor for the slowdown in Chinese capital outflows may be the relative stability of the Chinese currency, which after suffering a substantial devaluation at the end of 2015 and early 2016, has since stabilized to levels during the start of year fixing. As Nathan Chow, a Hong Kong-based economist at DBS Group Holdings Ltd., told Bloomberg “financial markets were more stable last month compared with January and the sentiment toward the yuan has improved. Capital outflows may slow down in the second half of this year if economic fundamentals improve.”
Policy makers have been burning through their stockpile to help stabilize the currency, a key goal for China’s leaders, who are gathered this week for their annual policy meeting in Beijing. The nation’s defense of the yuan depleted its foreign reserves by $513 billion last year, while Bloomberg Intelligence estimates that a record $1 trillion of money moved overseas in 2015.
According to one theory proposed by the BIS, “persistent capital outflows from China since mid-2014 were probably driven more by local companies paying down dollar-denominated debt — in anticipation of a stronger U.S. currency — than investors ditching assets.” Those same BIS experts have probably never had the please of bidding for an abandoned house in Vancouver for $7 million, a local housing bubble which is precisely a function of local investors taking their money offshore in a panic.
Finally, recall that just two weeks ago China stopped reporting the “position for forex purchase” a series which tracked total foreign exchange purchases by both the central bank and other financial institutions. Many – us included – saw this as a premeditated attempt to confuse market watchers and prevent the full picture of Chinese outflow data from emerging. As such one will surely take the PBOC’s reserve data with an excess capacity-producing mine of salt. This is Goldman’s take:
As we have discussed previously, however, headline FX reserve data do not necessarily give a comprehensive picture on the underlying trend of FX-RMB conversion by corporates and households. This is not necessarily related to any accuracy issues of reserve data, but is due to the fact that valuation effects are uncertain and that other non-PBOC financial institutions may also use their balance sheet to absorb underlying flow pressures. Correspondingly, the PBOC or related entities may have accumulated forward positions that do not affect reserves immediately.
In our view, a preferred gauge of the FX-RMB conversion trend amongst onshore non-banks would be based on SAFE data on banks’ FX settlements on behalf of their onshore clients. That report captures banks’ FX transactions vis-à-vis non-banks through both spot and forward transactions, and will be out on March 16 (we discussed the coverage and definitions of various official FX data sets in Asia Economics Analyst: Sizes and Sources of China’s Capital Outflows, January 26, 2016).
In other news, China reported that the value of its gold reserves jumped to $71 billion from $63.6 billion a month ago, with the actual inventory of reported gold rising from 57.18 million oz. in January to 57.5 million oz. as of last month.
China Is About To Unleash A Monster Housing Bubble (And Record Capital Outflows) In Six Easy Steps
One week ago we showed the disturbing degree to which the latest (and greatest) housing bubble among China’s Tier 1 has gripped the broader public, when we reported that local speculators are waiting in line for days to flip homes.
Visually, it looks as follows – the bubble is entirely in the Tier 1 cities; for now everyone has given up on the other regions which are suffering greatly as a result of the bursting of the commodity bubble and have seen an exodus of recently unemployed workers:

The demand for housing in Shanghai and Shenzen has gotten so “bubbly” that even the government-run news agency Xinhua on Wednesday warned of increasing leverage risks and called for further tightening measures to rein in the market. Which is ironic, because just days later the People’s Congress announced it would support the Chinese housing market, sending conflicting messages of whether it does or does not want another housing bubble.
And while we know that retail speculators are simply feeder-fish piggybacking on the latest housing craze, it is the people with far more capital – and leverage – who are ultimately pulling the strings, as an article in the local media explains in detail.
In an article written on Caijing, we get to the bottom of the rapid rise in housing prices in Shenzhen and other Tier I cities. As it notes, the property boom is ominous, and ultimately hints of even more capital outflow and currency devaluation to come.
The gist of the article (in Chinese) is that the business owners, foreign factory bosses and other powerful people are the cause of the meteoric housing price rise. Here is the link. Some of the other highlights:
The typical housing transaction in this latest housing bubble looks as follows:
- The business owner creates a fake employment contract with his maid or driver, showing an impressive income to justify a high monthly mortgage.
- The owner sells his property to his maid/driver at the highest price possible (as much as the bank will appraise for). Maid/driver doesn’t care about what the price is and accepts the asking
- The owner gives his maid the money for the down payment of 30% (lowered recently as PBOC policy), while receiving the the full or above full value of the property
- Maid/driver moves into the upscale property of the owner, which is why mainstream media is characterizing the boom as ‘upgrade buys’. And continue to live there until the actual owners decide to stop outlaying for the mortgage payment.
- The owner cashes out of the property basically with PBOC’s help (ease of credit, lowered down payment etc), promptly moves the money out of China through import/export channels, contributing to capital outflows.
- At some point in the future, the owners will stop making mortgage payment, since they’ve already cashed out of the property with a huge windfall. Bank goes to foreclose; maid/driver will go back to living where they lived before.
In Shenzhen, housing debt as percentage of total debt is 22.4%, 1.7X Shanghai and 2.25X Beijing.

But what’s more worrisome is that since this trick can be applied basically anywhere in China, it will be and the elite in Shanghai and Beijing will catch on as will tier 2-4 cities, whose governments are even more desperate to rescue the housing market.
With the elite and smart money milking the existing banking system in this way and moving money out, China’s 3.2 Trillion (and declining for 4 consecutive months) official reserves doesn’t look all that impressive.
h/t DS
end
EU Bombshell: The Balkan Route To Germany Is Closed
Late last month, Norwegian PM Erna Solberg proclaimed that if she became convinced that Sweden’s refugee crisis was set to spiral out of control or “break down” (as she called it), she may be prepared to close her country’s borders altogether in what would quite possibly amount to a contravention of Norway’s duties under the Geneva Convention and a move that would almost surely trigger a rash of human rights violations.
It underscored how desperate some Europeans had become and indeed, it was just days later when EU migration commissioner Dimitris Avramopoulos warned that the bloc has just 10 days to implement a plan that will bring about “tangible and clear results on the ground” or else “the whole system will completely collapse.”
The 10-day “countdown” is a reference to the leadup to an EU/Turkey Summit where Erdogan, as usual, stands in the way of progress.
He’s determined to extract money and political concessions from Brussels in exchange for his country’s help in stemming the flow of Asylum Seekers from neighboring Syria. A transcript from a leaked discussion between himself and European Commissioner Jean Claude Juncker and President of the European Council Donald Tusk on 16th November 2015 during the G20 Summit in Antalya suggests that Erdogan told Juncker that Turkey can simply: :put them [the migrants] on buses.” That’s a rather thinly-veiled threat to simply pass the migrants straight through to the gates (and we mean “gates” both that figuratively and literally at this juncture) of the Balkan rout north.
The Summit begins on Monday and we don’t have much in the way of hope. After all, in order to guard the bloc’s external border you need buy in from Erdogan (when he’s actually looking for buy out quite literally), and somehow poor Alexis Tsipras is expected to control the bottleneck after having been left for broke by the very same Brussels Eurocrats who now want (no, demand) his help.
As KeepTalkingGreece puts in thousands of refugees and migrants wandering from Athens to Idomeni without knowing where to sleep and what to eat, where to lay their kids and elderly to sleep. What happens when they get to Idomeni, you ask? Well they try to beat down border gates with homemade bettering rams.
If they can’t break through and make a run for it north, the end up simply stranded in Greece.
This has infuriated Athens, who last month recalled their Ambassador to Austria after the country held a series of meetings with Balkan countries without inviting the Greeks.
So don’t hold your breath for a solution (or for a harrowing raft ride across the Mediterranean) to the “safe shores” of Europe. The is one crisis that is simply going to fester until it boils over. The Barbarians (and no, not in the pejorative sense, in the classic literary sense) are the gates – and they’re coming “home” Frau Merkel, whether you like it or not.
But in any event, below is a draft document obtained by Der Standard.at (Googel translated) which suggests EU officials are now set to mark a turning point: “The Closure of The Balkan Route.”
* * *
Thomas Mayer. At the EU summit on Monday the immediate termination of the illegal flow of migrants and by Wave of Greece should be explained to Germany as a top priority of EU policy. This goes forth from one to the STANDARD present draft. Athens must immediately 50,000 places for potential asylum realize Greece gets “any help” the Union. Migrants with no chance of asylum should also be deported immediately to Turkey.
The EU summit with Turkey on Monday in Brussels and subsequent meetings of the 28 heads of state without the Turkish Premier Ahmed Davutoglu is expected to bring a dramatic change in the current policy and in dealing with refugees and migrants. This is at least the result of a yet secret declaration that Saturday evening was coordinated between the government headquarters in the capital cities. In the paper, which is pending before STANDARD, it literally means: “The irregular flow of migrants along the West Balkan route comes to an end this route is closed from now..”
Fine tuning still needed
The final declaration of the EU-28 will be voted on today in Brussels in the group of EU ambassadors still fine. At the core of the decisions will, however, change anything, according to diplomatic sources. Many of the measures that will be implemented immediately after the meeting train to train, based on agreements to be concluded with the Turkish side. Despite the excitement about the actions of the Turkish government against an opposition newspaper on Friday, the storm of the editorial by police, you go in Brussels expect that Davutoglu will appear on Monday and negotiated in recent days Agreements are then confirmed.
Repatriation agreements planned with Turkey
Nuclear case will be that Turkey immediately constructively participates in controlling the EU’s external borders in the Aegean and those migrants who can not hope to seek asylum in Europe, will resume in the course of recycling. The plan is a private repatriation EU-Turkey agreement, which should be in force from 1 June. Before that you will operate on the basis of the bilateral agreement of Greece. As reported, also the EU-Turkey action plan be promoted. The EU member states undertake the special summit to the Resettlement – to start – the direct settlement of Syrian refugees from Turkey in EU countries.
With regard to the measures in the area of ??Union, in forceful language describes the explanation of the Government a package of measures to be set in the coming weeks. To the consequences of closing the Balkan route, catch the jam thousands incoming refugees, the EU agreed to “do the maximum to assist Greece in this difficult moment.” If it were “a collective responsibility of the community, which requires fast and efficient mobilization of all available resources”, but “also the contributions of the Member States”.
A billion for refugee assistance
The Arenberg by the European Commission last week “emergency plan” for humanitarian aid is unconditional support of the government. For 700 million euros have been earmarked, 300 million in 2016. The Council of Ministers should decide the plan before the next EU summit on March 18 and take shape, according to the statement. Together with all previously agreed measures so could be invested in aid to refugees in the coming months about one billion euros from the EU.
strengthen Frontex
The second major issue is security. The EU will send over their border protection agency Frontex once more officials to Greece, which will be based on the borders with Macedonia and Albania. They should also ensure that the reception centers (hotspots) function in Greece, where the refugees are first recorded and prepared for the allocation of EU countries where they are to get proper asylum procedure. Until later than 1 April, the EU countries should make more, going beyond existing commitments officials for Frontex available. Europol is to strengthen the fight against smuggling. In March summit in ten days, the progress will be evaluated.
divide refugees in EU countries
Until then, the Government hope under its declaration to the fact that the hitherto has come in transition “Distribution Program” of refugees operates in the Member States. It is apparently planned with regard to states not in Eastern Europe, that not all countries have the same time by starting with the “relocation”. For in the secret document is also talk that some states are encouraged to voluntarily offer higher rates of refugees as provided. In any case, the burden on Greece would be alleviated if more immigrants coming into the country.
Finally, the EU summit will ensure that by the end to “a Back to Schengen” is coming. Until then, no later than intended in accordance with the recent proposals of the European Commission which checks at internal borders, as they are currently conducted in eight states, again belonging to the past. (Thomas Mayer from Brussels, 03/05/2016).
“It’s Our Damned Duty”: Merkel, Turkey Make Last Ditch Effort To Save EU At Key Summit
On Monday, officials from the EU and Turkey are gathered in Brussels to do some talking about the refugee crisis that threatens to tear Europe apart at the seams. And make no mistake, “talk” is probably all they’ll do.
Last year, Europe and Turkey agreed on a so-called “joint action plan” which essentially amounted to Turkish President Recep Tayyip Erdogan extorting €3 billion from Brussels in exchange for a promise to curb people smuggling and stem the flow of migrants into Western Europe. As The Guardian notes, “several months on, the pact remains little more than a piece of paper.”
Although the check has been cut, it’s not entirely clear where the money went (surprise) and now that the effective closure of the Balkan route has created a severe bottleneck of refugees in Greece, Athens is very near to losing its mind.
As of Sunday, as many as 14,000 men, women, and children were stranded on Macedonia’s border which has been sealed and which migrant men have at various times tried to breach with homemade battering rams.

Now, Macedonia wants to extend the 19-mile, Orban-style razor wire fence to a 200-mile barrier complete with guards armed with tasers, a plan unveiled in Brussels over the weekend detailed.

Needless to say, Alexis Tsipras is at wit’s end.
First Brussels forced Athens to accept a third sovereign bailout that carried draconian terms and all but guaranteed the country will remain a debt serf of Berlin for the next five decades. Now, Austria has effectively conspired with the Balkan countries to close the route north to Germany leaving Greece on its own to handle the influx. “Europe is in the midst of a nervous crisis, primarily for reasons of political weakness,” said he said on Sunday.

(A man looks at the Greek island of Lesbos from the Turkish coastline)
“About 13,000-14,000 people are trapped in Idomeni, while another 6,000-7,000 are being housed in refugee camps around the region,” Al Jazeera reports, citing Apostolos Tzitzikostas, governor of Central Macedonia province.
“It’s a huge humanitarian crisis. I have asked the government to declare the area in a state of emergency,” he said during a visit to Idomeni on Saturday to distribute aid to the Red Cross and other non-governmental organisations.

For her part, the Iron Chancellor claims “rumors” that the Balkan route has been closed “do not conform to the facts” (to quote China’s NBS):
Coming back to Monday’s summit, “the crucial point is to know if Turkey is a player on our side, because up to now they declare they are on our side, but they don’t do anything to prove that,” Miltiadis Kyrkos, a Greek MEP who is the vice-chair of the European parliament’s joint committee with Turkey, said.
As for Turkey, you can say what you will about Erdogan’s belligerence, but the country is not only on the frontlines of the refugee crisis, but on the frontlines of the war itself. The pressure is palpable to say the absolute least.
Take the tiny town of Kilis for instance, which has more than doubled in size from the refugee influx. Incidentally, the town (which WSJ notes was previously “best known as a place for truckers to pick up pistachio-encrusted pastries before crossing the nearby Syrian border”), is up for a Nobel Peace Prize for its efforts.

“To encourage refugees to stay, Ankara is now allowing millions of Syrians to legally work in Turkey, ending a policy in place since the start of the war. But the new regulation comes with restrictions,” WSJ goes on to document. “The restrictions, along with the often-convoluted bureaucratic challenges, make it hard for Syrian families to stay.”
In other words, some Turkish towns with big hearts are doing their part (and more), but Ankara hasn’t even begun to implement the type of measures that will stop refugees from fleeing to Western Europe and besides, Turkey isn’t that much safer than Syria these days. “Using Turkey as a ‘safe third country’ is absurd,” said Amnesty’s director for Europe and Central Asia, Gauri van Gulik. “Many refugees still live in terrible conditions; some have been deported back to Syria and security forces have even shot at Syrians trying to cross the border.” And that’s if they don’t get blown up by the very same groups blowing them up in Syria, groups that are armed and funded by Erdogan.
As The Guardian goes on to say, “resettlement was Angela Merkel’s last gambit for solving the refugee crisis. In mid-February, the German government confidently presented a plan in which a “coalition of the willing” – including Austria, Germany, Sweden and the Benelux trio – would take 300,000 refugees from Turkey a year [but] the renegade actions of Austria and the western Balkan states have forced Merkel into a rethink.”
“It’s our damned duty,” she insisted last week. “And no I don’t have a Plan B.”
Well, she had better get one, before the German electorate goes with “Plan B” for chancellor.
As for whether Erdogan will suddenly step up to the plate – don’t hold your “damned” breath. “Turkey’s diplomacy [is like] an eastern bazaar,” the aforementioned Miltiadis Kyrkos said. And it’s not just money Ankara wants. Turkish PM Ahmet Davutoglu is looking to trade concessions on migrants for fast-track membership to the EU. “I am sure these challenges will be solved through our cooperation and Turkey is ready to work with the EU,” Davutoglu said. “Turkey is ready to be a member of the EU as well. Today I hope this summit will not just focus on irregular migration but also the Turkish accession process to the EU.”
But Europeans aren’t exactly thrilled about Ankara’s latest move away from democratic norms. “Media freedom is a non-negotiable element of our European identity,” European Parliament President Martin Schulz said he had told the Turkish Premier, referring to Erdogan’s move to seize control of The Daily Zaman.
And sure enough, as FT reports, Turkey is asking for more concessions: “Ahead of crunch summit between EU leaders and the Turkish prime minister on Monday, Ankara has called for an increase on the €3bn in aid previously promised by the EU, faster access to Schengen visas for Turkish citizens and accelerated progress in its EU membership bid.” One imagines a long list of eleventh hour demands could well cause the whole thing to collapse.
Perhaps Dutch prime minister, Mark Rutte put it best: “[This] is not the summit that will change anything.”
Will Italian Banks Spark Another Financial Crisis?
Submitted by Jeffrey Moore via GlobalRiskInsights.com,
In the 14th century, the Medici family of Florence began its rise to prominence, investing profits from a thriving textile trade to fund what would become the largest banking institution in Europe. The success of the legendary banking family helped to usher in the Italian Renaissance and thus change the world. Now, Italian banks seem poised to alter the world yet again.
Shares of Italy’s largest financial institutions have plummeted in the opening months of 2016 as piles of bad debt on their balance sheets become too high to ignore. Amid all of the risksfacing EU members in 2016, the risk of contagion from Italy’s troubled banks poses the greatest threat to the world’s already burdened financial system.
At the core of the issue is the concerning level of Non-Performing Loans (NPL’s) on banks’ books, with estimates ranging from 17% to 21% of total lending. This amounts to approximately €200 billion of NPL’s, or 12% of Italy’s GDP. Moreover, in some cases, bad loans make up an alarming 30% of individual banks’ balance sheets.

The red flags initially attracted the attention of the European Central Bank (ECB), prompting an official inquiry that investors viewed as a flashing ‘sell signal.’ Shares of Italian banking companies lost more than 25% in the first several weeks of the year.
Though markets have pared losses in the last few weeks, March has brought renewed concern for the health of Italy’s financial sector. Adding more worries to fuel the fire, on Friday the ECB demanded that one such troubled Italian bank, Banca Carige SpA, provide new strategic plans and additional funding in order to bolster its balance sheet and meet supervisory requirements by the end of the month. The news sent bank shares on yet another swoon, prompting trading halts on several as the volatility triggered maximum loss ‘circuit breakers.’
A rock and a hard place
Initially, Italy proposed setting up a ‘bad bank’ solution, in which troubled institutions could off-load their NPL’s into a separate state backed entity that would manage the assets while insulating the sector at large from the damaging effects of non-performance. However, in an effort to protect taxpayers from socialized losses, new European Union rules now ban the use of state aid to bail out banks.
Instead of an overt ‘bail-out’, the most recent agreement Italy has reached with the EU constitutes a ‘bail-in’. In this agreement, banks will be allowed to cleanse their balance sheets by packaging the NPL’s and selling them to investors, along with enticing government guarantees for the least risky portions of the debt. The catch? The securities must be priced at market rates.
Mark-to-market rates for Italy’s NPL’s could be anywhere from 20%-50% below current listed value, representing steep losses for bondholders and uncomfortable write downs for the banks. This solution already resulted in such losses for bondholders in a 2015 ‘bail-in’ of four small Italian banks.
Those losses are not limited to financial institutions either. Rather, retail investors, or individual Italians, own significant portions of these debts as retirement savings. Citizens depending on these investments don’t have the luxury of financial engineering to make ends meet. Even the best ‘solution’ risks widespread financial suffering.
Italy is no Greece – it’s worse
Some have compared the risk of an escalating financial crisis in Italy to the seemingly perennial debt crisis in Greece that has ravaged European markets and tested European unity several times since 2008 as investors and EU members alike feared uncontrollable contagion. This has resulted in the multiple EU bail outs granted since then.
However, judging by the numbers it is clear that the financial risks posed by Italy are not comparable to Greece – they are far worse.
While Greece holds the top spot in the EU for the worst debt-to-GDP ratio, Italy comes in second place with a debt-to-GDP ratio greater than 132% according to Eurostat.
So what makes Italy so much worse? While Greece has more than once brought the global financial markets to the brink, it is only the 44th largest economy in the world. Italy represents the 8th largest economy in the world.
A deteriorating financial crisis in Italy could risk repercussions across the EU exponentially greater than those spurred by Greece. The ripple effects of market turmoil and the potential for dangerous precedents being set by EU authorities in panicked response to that turmoil, could ignite yet more latent financial vulnerabilities in fragile EU members such as Spain and Portugal.
Such contagion should concern investors regardless of political assurances. In 2008, then Federal Reserve Chairman Ben Bernanke infamously comforted inquiring congressmen when he stated that the crumbling subprime mortgage securities would be contained and posed no threat of contagion to markets overall. The 2008 Financial Crisis, 50% market corrections, and the Great Recession ensued.
Could Italy represent the ‘subprime spark’ of 2016? Currently, authorities assure the public that the banks are well capitalized and, though it may take some time, solutions will be realized. Italian Prime Minister Renzi attempted to allay concerns after the recently struck deal with the EU, telling reporters that, “The situation is much less serious than the market thinks.”
If recent history is any indication, observers and investors should greet such statements by politicians with considerable caution. In remarks during heightened concern over the Greek crisis in 2011, current European Commission President and then Prime Minister of Luxembourg, Jean-Claude Junker, stated“When it becomes serious, you have to lie.”
end
“Democracy Ends In Turkey”: Prominent Anti-Erdogan Newspaper Seized In Midnight Raid
Overnight both freedom of press and democracy officially died in Turkey, with time of death just before midnight, when Turkish authorities stormed the Zaman daily, a newspaper staunchly opposed to president Recep Tayyip Erdogan, and after using tear gas and water cannon they seized its headquarters in a dramatic raid that raised fresh alarm over declining media freedoms.
The police used water cannon late on Friday at a hundreds-strong crowd that had formed outside the headquarters of the Zaman daily in Istanbul following a court order issued earlier in the day.

The details: shortly before midnight, a team of police arrived with two Turkish-made TOMA water cannon trucks. They advanced military style towards the waiting supporters, firing the freezing water directly at them. Using bolt-cutters to unlock the iron gate in front of the building, dozens of police then marched into the premises to seize the headquarters and formally place it under administration, pushing aside anyone who stood in their way, Cihan images showed.
Once the building was cleared, the court-appointed administrators – lawyers Tahsin Kaplan and Metin Ilhan and writer Sezai Sengonul – were bussed inside the complex to begin their work, Anatolia said.
The clash in front of the Zaman headquarters is captured in the clip below:
The swoop caused immediate concern in Washington and Brussels amid the intensifying worries over the climate for freedom of expression in Turkey. EU enlargement commissioner Johannes Hahn said he was “extremely worried”. However, the concern is clearly not big enough to threaten Turkey with expulsion from NATO and certainly not big enough to demand those $3 billion back which was given to Turkey to “fight” the refugee crisis and instead was promptly embezzled by the ruling regime.
As AFP adds, Zaman, closely linked to Erdogan’s arch-foe, the US-based preacher Fethullah Gulen, was ordered into administration by the court on the request of Istanbul prosecutors, the state-run Anatolia news agency said. Hundreds of supporters then gathered outside its headquarters awaiting the arrival of bailiffs and security forces after the court order.
“Democracy will continue and free media will not be silent,” Zaman’s editor-in-chief Abdulhamit Bilici was quoted as saying by the Cihan news agency just before the police raid.
“I believe that free media will continue even if we have to write on the walls. I don’t think it is possible to silence media in the digital age,” he told Cihan, part of the Zaman media group.
Don’t be so sure: the Cihan news agency and the Today’s Zaman English language daily – which are also part of the Feza Publications group that owns Zaman – and are also affected by the court order.
Ironically, the raid on Zaman comes as Prime Minister Ahmet Davutoglu heads to Brussels Monday for a crucial summit meeting with EU leaders. The news of the court decision broke as Erdogan was holding talks in Istanbul with EU President Donald Tusk. We doubt that any of Europe’s “leaders” will fail to appear at the summit despite the presence of the now official Turkish despot: after all Turkey is instrumental to stemming the tsunami of refugees, something Erdogan knows very well and is milking for billions of dollars in bribers, pardon, “state aid.”
Erdogan’s crackdown against the Zaman is merely the latest act in his ongoing crusade against his nemesis who lives in the US, preacher Fethullah Gulen, and whom Erdogan has accused ot essentially creating a parallel republic. There is, of course, no such thing but Erdogan gladly uses the strawman to blame anything that goes wrong in Turkey on Gulen’s “parallel state.”
Ankara now accuses Gulen of running what it calls the Fethullahaci Terror Organisation/Parallel State Structure (FeTO/PDY) and seeking to overthrow the legitimate Turkish authorities. Anatolia said the court order was issued on the grounds that Zaman supported the activities of this “terror organisation”.
There have been numerous legal crackdowns on structures linked to the group and on Friday Turkish police arrested four executives of one of the country’s largest conglomerates, accusing them of financing Gulen. Gulen supporters decry the accusations as ridiculous, saying all he leads is a more informal group known as Hizmet (Service).
* * *
The effective seizure of the newspaper by the state added to concerns over freedom of expression in Turkey under Erdogan’s rule. The daily Cumhuriyet newspaper’s editor-in-chief Can Dundar and Ankara bureau chief Erdem Gul were released on an order from Turkey’s top court last week after three months in jail on charges of publishing state secrets. But they still face trial on March 25.
Erdogan’s crackdown on the freedom of speech is so vast, that as of this moment almost 2,000 journalists, bloggers and ordinary citizens, including high school students, have found themselves prosecuted on accusations of insulting Erdogan.
This latest overnight raid on free spech was so brazen, even the U.S. felt compelled to say something about its erstwile mid-east ally and the country which funds and supports ISIS.
US State Department spokesman John Kirby said the court order was “the latest in a series of troubling judicial and law enforcement actions taken by the Turkish government targeting media outlets and others critical of it.” He added that “we urge Turkish authorities to ensure their actions uphold the universal democratic values enshrined in their own constitution, including freedom of speech and especially freedom of the press.”
Europe also chimed in when EU enlargement commissioner Johannes Hahn said he was “extremely worried” about the move “which jeopardises progress” made by Turkey in other areas. He warned on Twitter that Turkey, which is a long-standing candidate to join the European Union, needs to “respect the freedom of the media” and rights were “not negotiable”.
Well it appears they are, especially if Turkey has the most important bargaining chip of all: the future of the European Union, because should the US or the EU antagonize Erdogan too much, he will merely unleash the spigot of Muslim refugees entering Europe leading to the inevitable implosion of the European “Union” just a few months later.
* * *
Finally, here are some additional thoughts from investigative historian Eric Zuesse who writes that…
Democracy Ends in Turkey
On Saturday March 5th, Deutsche Wirtschafts Nachrichten (German Economic News) headlined“Turkish Police Storm Newspaper Office Zaman” and reported that, “Turkish police entered the editorial offices of critical newspaper Zaman on Friday night.” Accompanying videos there showed a police-state in which ‘security’ forces stormed through a crowd of protesters (readers of the newspaper) outside, into Turkey’s leading opposition newspaper, which is also Turkey’s leading English-language newspaper, Zaman, and arrested staffers there, taking them away, to who-knows-what fates.
There’s nothing like Zaman in just about any country: for examples, the New York Times, Washington Post, London Times, and Guardian, aren’t “opposition newspapers,” though they used to cover the opposition in a moderately fair way, prior to the George W. Bush Administration, 9/11, and “regime change in Iraq.” By contrast, Zaman has constantly been very bold in exposing truths that the regime doesn’t want the public to know. But that’s all past history now — it’s at least as radical a change for Turkey as occurred in America with the Bush regime, which controlled the media as effectively as its successor-regime, Obama’s, has done, and which never needed to employ such blatantly police-state methods as Turkey now is clearly doing.
On Thursday March 4th, Tayyip Erdo?an, the Islamist President of U.S. ally and NATO member-nation Turkey, took over Zaman or Today’s Zaman, where the headline on Friday was: “Court appoints trustees to take over management of Zaman, Today’s Zaman.” Until after that report was filed, this was only a court matter, not a blatantly police-state one — using physical forms of force, including armed ‘security’ forces inside, and water-cannons against demonstrators outside.
Here was that Zaman news-report’s opening:
An ?stanbul court has appointed trustees to take over the management of the Feza Media Group, which includes Turkey’s biggest-selling newspaper, the Zaman daily, as well as the Today’s Zaman daily and the Cihan news agency, dealing a fresh blow to the already battered media freedom in Turkey.
The decision was issued by the ?stanbul 6th Criminal Court of Peace at the request of the ?stanbul Chief Public Prosecutor’s Office, which claimed that the media group acted upon orders from what it called the “Fethullahist Terrorist Organization/Parallel State Structure (FETÖ/PDY),” praising the group and helping it achieve its goals in its publications.
The prosecutor also claimed that the alleged terrorist group is cooperating with the Kurdistan Workers’ Party (PKK) terrorist organization to topple the Turkish government and that high-level officials of the two groups have had meetings abroad.
The court decision means that the entire management and the editorial board of Feza Media Group companies will be replaced by the three-member board named by the court.
Turkey’s existing conservative regime is typical of conservative governments in using ‘national security’ rationalizations as excuses for clamping down against the public, supposedly in order to ‘protect’ the public. However, the ‘democratic’ gloss over the transition of a democratic government into a dictatorial one can do nothing to maintain as being true the supposition that the nation is a democracy instead of (now) a dictatorship.
The specific ‘national security’ context behind today’s clamp-down and end of democracy in Turkey, is that the Zaman operations were owned by Erdo?an’s enemy, Fethullah Gülen, who had self-exiled to an estate in Pennsylvania after objecting to the Islamicization of Turkey’s government under Erdo?an. Gülen is no ‘secularist,’ but he came to insist upon a separation between church-and-state, so that there will be no favoritism by the government toward any clergy, and thus no favoritism by the clergy toward any government or political party. In other words: Gülen preaches a relatively progressive version of Islam.
By contrast: Erdo?an has, consistently since he first entered politics, moved Turkey more and more toward a standard Sunni dictatorship, aligned with the Saud family, who own Saudi Arabia, and who hold authority over Islam’s two holiest sites: Mecca and Medina. Their Islamic sect is called Wahhabism inside Saudi Arabia, and Salafism outside Saudi Arabia. The founder was Mohammed Ibn Wahhab in 1744, when he swore a mutual oath with the gang-lord Muhammad Ibn Saud, for Saud’s descendants to control the government, and for Wahhab’s preachers to instruct the faithful that the Sauds have God’s blessing to rule. Under this agreement, Wahhab’s preachers determine the laws, based upon the strictest-possible interpretation of the Quran, which therefore functions as Saudi Arabia’s Constitution, while the Wahhabist preachers constitute the legislative and judicial branches of the Saud-led government, who are the executive branch — the Saud-clan’s leaders.
Outside Saudi Arabia, the sect is called “Salafist,” meaning that they derive their authority from their ancestors. This feature authorizes royal rule, because royal dictators achieve their ‘right’ to rule on the basis of whom their ancestors were (i.e., their parents, going ultimately back to some founder who was a conquerer). For this reason, all of the Arabic royal families are Salafists. Inside Saudi Arabia, the Saud family are Wahhabists (the Saudi version of the Salafist sect).
The continued membership by Turkey in NATO would mean that there is a NATO that no longer has any vestige of justification for continued existence after the end, in 1991, of communism, of the USSR, and of the Warsaw Pact. Democracy no longer survives as even a vestigial excuse for its continuation.
NATO, from now on, is just a gang of nations whose aristocracies crave to conquer the world’s most resource-rich nation: Russia. (It’s done by picking off, one-by-one, Russia’s former allied nations and bringing them into the NATO gang.) The U.S. and Saud family, and Erdo?an family, as well as the other Arabic royal families, and the controlling investors in U.S. and allied weapons-manufacturers, etc., constitute the chief beneficiaries of continuing NATO, but the conquest of Russia is not at all the primary goal of the residents in NATO-member nations. In fact, it’s not a goal that’s even talked about in their ‘elections.’ If those nations were democracies, they’d abandon NATO, as being representative of dictatorship over them all, not of democracy, in any nation.
But we’re all dictatorships now.
end
GLOBAL ISSUES
Deutsche bank discovers that by looking at Japan’s NIRP, instead of increase spending, we are getting the opposite as citizens fear something is run and they increase their savings:
(courtesy zero hedge)
Deutsche Bank Discovers Kuroda’s NIRP Paradox
Last October, BofA looked at Europe’s €2.6 trillion in negative-yielding debt and discovered something“stunning”: Savings rates were going up not down.
Don’t believe us, just have a look at these three charts:

But how could that be? By all accounts – or, should we say, by all conventional Keynesian/ textbook accounts – negative rates should force people out of savings and into higher yielding vehicles or else into goods and services which “rational” actors will assume they should buy now before they get more expensive in the future as inflation rises or at least before the money they’re sitting on now yields less than it currently is.
Well inflation never rose for a variety of reasons (not the least of which was that QE and ZIRP actually contributed to the global disinflationary impulse) and nothing will incentivize savers to keep their money in the bank like the expectation of deflation.
Well, almost nothing. There’s also this (again, from BofA): “Ultra-low rates may perversely be driving a greater propensity for consumers to save as retirement income becomes more uncertain.”
Why that’s “perverse,” we’re not entirely sure. Fixed income yields nothing, and rates on savings accounts are nothing. Which means if you’re worried about your nest egg and aren’t keen on chasing the stock bubble higher or buying bonds in hopes that capital appreciation will make up for rock-bottom coupons (i.e. chasing the bond bubble), then as Gene Wilder would say, “you get nothing.” And that makes you nervous if you’re thinking about retirement. And nervous people don’t spend. Nervous people save.
Deutsche Bank has figured out this very same dynamic. In a note out Friday, the bank remarks that declining rates have generally managed to bring consumption forward.
The impact of interest rates (nominal or real) on consumption is generally derived from a two-period consumption model. Under a given budget constraint, declining interest rates front-load consumption in the current period at the expense of the second-period consumption (inter-temporal substitution effect). Japan’s household saving rate has been constantly falling since the early 1990s.

But, there’s a limit.
Essentially, the bank argues that NIRP may be the shocker that wakes the public up to the fact that if negative rates exert a negative (no pun intended) effect on long-term household balance sheets, they will stop spending. To wit:
Even if inter-temporal consumption substitution occurs from now on, if the introduction of negative interest rates reminds households of a slower pace of their future accumulation of financial assets, namely suggesting a worsening of lifetime household budget constraints, households would be forced to cut back on consumption in both the current and next periods.
So there it is again. More evidence that Europe’s (and soon to be Japan’s) adventures in NIRP are destined to fail. Surprise, surprise.

But double-, triple-, and quadruple- down they most certainly will (starting this week with Draghi) until either one of two things happens: 1) they eliminate physical cash and take rates so punitively low that saving money in a bank will wipe out your nest egg in the space of a year, or 2) they drop money from the sky in a desperate attempt to inflate away all of this debt, a move which will be swiftly followed by the ultimate Keynesian endgame or, as one might call it, “a triumphant return to Weimar.”
Your early morning currency/gold and silver pricing/Asian and European bourse movements/ and interest rate settings/MONDAY morning 7:00 am
Euro/USA 1.0954 down .0047
USA/JAPAN YEN 113.52 DOWN .151 (Abe’s new negative interest rate (NIRP)a total bust
GBP/USA 1.4163 DOWN .0058 (threat of Brexit)
USA/CAN 1.3357 UP.0045
Early THIS MONDAY morning in Europe, the Euro FELL by 47 basis points, trading now JUST above the important 1.08 level falling to 1.0883; Europe is still reacting to deflation, announcements of massive stimulation (QE), a proxy middle east war, and the ramifications of a default at the Austrian Hypo bank, an imminent default of Greece, Glencore, Nysmark and the Ukraine, along with rising peripheral bond yield further stimulation as the EU is moving more into NIRP, and the threat of continuing USA tightening by raising their interest rate / Last night the Chinese yuan was DOWN in value (onshore) The USA/CNY UP in rate at closing last night: 6.5176 / (yuan DOWN but will still undergo massive devaluation/ which will cause deflation to spread throughout the globe)
In Japan Abe went BESERK with NEW ARROWS FOR HIS Abenomics WITH THIS TIME INITIATING NIRP . The yen now trades in a NORTHBOUND trajectory RAMP as IT settled UP in Japan by 15 basis points and trading now well BELOW that all important 120 level to 113.04 yen to the dollar. NIRP POLICY IS A COMPLETE FAILURE AND ALL OF OUR YEN CARRY TRADERS HAVE BEEN BLOWN UP (TODAY TRADERS RAMPED USA/YEN AND THUS ALL BOURSES RISE!!)
The pound was DOWN this morning by 58 basis points as it now trades WELL ABOVE the 1.40 level at 1.4151.
The Canadian dollar is now trading DOWN 45 in basis points to 1.3357 to the dollar.
Last night, Chinese bourses were MAINLY DOWN/Japan NIKKEI CLOSED DOWN 103.46 POINTS OR 0.6%, HANG SANG DOWN 16.98 OR 0.08% SHANGHAI UP 23.19 OR 0.81% ON LAST HOUR RESCUE / AUSTRALIA IS HIGHER / ALL EUROPEAN BOURSES ARE IN THE RED, WITH A FAILURE ON USA/YEN RAMP as they start their morning.
We are seeing that the 3 major global carry trades are being unwound. The BIGGY is the first one;
1. the total dollar global short is 9 trillion USA and as such we are now witnessing a sea of red blood on the streets as derivatives blow up with the massive rise in the rise in the dollar against all paper currencies and especially with the fall of the yuan carry trade. The emerging market which house close to 50% of the 9 trillion dollar short is feeling the massive pain as their debt is quite unmanageable.
2, the Nikkei average vs gold carry trade (blowing up and the yen carry trade HAS BLOWN up/and now NIRP)
3. Short Swiss franc/long assets blew up ( Eastern European housing/Nikkei etc.
These massive carry trades are terribly offside as they are being unwound. It is causing global deflation ( we are at debt saturation already) as the world reacts to lack of demand and a scarcity of debt collateral. Bourses around the globe are reacting in kind to these events as well as the potential for a GREXIT>
The NIKKEI: this MONDAY morning: closed DOWN 103.46 OR 0,61%
Trading from Europe and Asia:
1. Europe stocks IN THE RED
2/ CHINESE BOURSES MOSTLY IN THE RED/ : Hang Sang CLOSED DOWN POINTS ,Shanghai IN THE GREEN Australia BOURSE IN THE GREEN: /Nikkei (Japan)RED/India’s Sensex in the GREEN /
Gold very early morning trading: $1270.15
silver:$15.66
Early MONDAY morning USA 10 year bond yield: 1.90% !!! IP 1 in basis points from last night in basis points from FRIDAY night and it is trading WELL BELOW resistance at 2.27-2.32%. The 30 yr bond yield falls to 2.71 PAR in basis points from FRIDAY night.
USA dollar index early MONDAY morning: 97.55 UP 15 cents from FRIDAY’s close.(Now below resistance at a DXY of 100)
This ends early morning numbers MONDAY MORNING
Portuguese 10 year bond yield: 3.14% UP 4 in basis points from FRIDAY
Will Russia End Up Controlling 73% of Global Oil Supply?
Submitted by Rakesh Upadhyay via OilPrice.com,
Russia has played a master stroke in the current oil crisis by taking the lead in forming a new cartel,but it’s a move that could spell geopolitical disaster.
The meeting between Russia, Qatar, Saudi Arabia and Venezuela on 16 February 2016 was the first step. During the next meeting in mid-March, which is with a larger group of participants, if Russia manages to build a consensus—however small—it will further strengthen its leadership position.
Until the current oil crisis, Saudi Arabia called the crude oil price shots; however, its clout has been weakening in the aftermath of the massive price drop with the emergence of US shale. The smaller OPEC nations have been calling for a production cut to support prices, but the last OPEC meeting in December 2015 ended without any agreement.
Now, with Russia stepping in to negotiate with OPEC nations, a new picture is emerging. With its military might, Russia can assume de facto leadership of the oil-producing nations in the name of stabilizing oil prices.
Saudi Arabia has been a long-time U.S. ally, but that, too, is changing. Charles W. Freeman Jr., a former U.S. ambassador to Riyadh, recently noted that “We’ve seen a long deterioration in the U.S.-Saudi relationship, and it started well before the Obama Administration.”
U.S.-Saudi relations further soured due to the Iran nuclear deal that ended in January with the U.S. lifting sanctions—a move the Saudis vehemently opposed. The Saudis had to look for a new ally to safeguard their interests in the Gulf, considering the threats they face from the Islamic State (ISIS) and Iran.Though both Russia and Saudi Arabia are on opposing ends in Syria, with Russia supporting Syrian leader Bashar al-Assad and the Saudis supporting the Sunni rebels, the large drop in prices seems to have opened a window of opportunity for Russia to ally with Saudi Arabia.
This is not the first time that Russia and Saudi Arabia have sought a close partnership. Even in 2013, The Telegraph had reported an attempt to form a secret deal, which did not go through. Iran has been a trusted ally of Russia for a long time, and if Russia can broker a deal between Iran and Saudi Arabia, it can also push through some sort of secret OPEC deal.
The production freeze to January levels that was bandied about last month carries no significance in concrete terms because Russia, Saudi Arabia and most other nations on board are pumping close to their record highs. Barclays’ commodity research chief Kevin Norrish said it was “vital to note” that there was not much incremental production expected from Russia, Qatar or Venezuela this year anyway. It was the Saudi’s that really mattered, as reported by Forbes.
Though Iran hasn’t committed to a production freeze, since it wants to ramp up production to pre-sanction levels, Russian Energy Minister Aleksander Novak has noted that “Iran has a special situation as the country is at its lowest levels of production. So I think, it might be approached individually, with a separate solution.”
With all the major Gulf nations agreeing, Iraq, which is without a credible political leadership, will also likely follow suit if Russia assures them of stronger support against ISIS.
If the above scenario plays out, Russia will emerge as the de facto leader of the major oil producing nations of the world, accounting for almost 73 percent of the global oil supply.
Along with this, Russia has been in the forefront of plans to move away from Petrodollars, and Moscow has formed pacts with various nations to trade oil in local currencies. With this new cartel of ROPEC (Russia and OPEC nations), a move away from petrodollars will become a reality sooner rather than later.
Russia is smart. Vladimir Putin is genius. Moscow senses the opportunity that is almost tangibly floating about in the low crude price environment and appears to be ready to capitalize on it in a way that would reshape the geopolitical landscape exponentially.
Though a solution in Syria is welcome, a large cartel of major oil producing nations of the world with Russia as the head would be a major upset to the current balance of power. With this potential in mind, the mid-march meeting should be very interesting for the global oil patch—well beyond talk of production cuts and supply gluts.
WTI Crude Spikes To $37, Brent Over $40 After Genscape Signals Cushing Draw
Stocks are up thanks to another mindless spike in WTI Crude this morning after Genscape reported a smaller than expected build at Cushing. WTI spiked over $37 and Brent back above $40 on the news as Futures and ETF shorts cover.

Finally we are worried for Dennis Gartman’s health as he has just $7 until potentially bad things happen:
As he said on CNBC“we won’t see crude above $44 again in my lifetime.”

S&P Panic-Bid Above 2,000 As Short-Squeeze Rip Trumps Fed’s Fischer Dip
Just when you thoughjt it was safe to chase the biggest short squeeze in history Fed vice-chair Fischer f##ked it all up…
The US equity market has only been more overbought 3 days in history…

Amid the Biggest short squeeze…ever!

It’s not the fundamentals; it’s oil stupid!!

As WTI (front-month continuous based on BBG data) has the biggest 3-week gain since August 1990…

And SPY (S&P 500 ETF) saw its lowest volume of the year…

US equities went straight up out of the gate but Fischer took the sting out of it all at 1300ET – *FISCHER: WE MAY BE SEEING `FIRST STIRRINGS’ OF HIGHER INFLATION – plunging stocks into the red, before yet another late-day buying panic ensued on PIMCO risk-on headlines…

Energy was the yuuge winner, tech the biggest loser and financials unch…

After closing at 1999.99 on Friday. S&P desperately tried to hold 2,000 today… Look at the sheer panic of the market in the last seconds of the day to get S&P above 2000…

Every time the S&P dropped below 2,000 – VIX was banged lower… and the close was a total joke…

As JPMorgan warned – “The market is trapped” – trapped by USD: it can’t rally to new highs without USD (momentum sectors, FANGs, etc.), and at the same time the strong USD is capping any significant upside due to its negative impact on EPS (via value segments such as multinationals and energy).
Which explains why energy is outperforming Tech…

And Value stocks have greatly outperformed Growth in the last week, almost back to unchanged on the year (and back to the extremes of early feb in terms of divergence)…

US financial stocks are completely decoupled from credit in the last few days…

VIX and stocks decoupled…

One quick question – if everything is so awesome again, why is the most-levered part of the US corporate bond capital structure landscape underperforming so strongly…

The USD Index was monkey-hammered early as commodity currencies soared but recovered very modestly after Fischer’s comments…

Treasury yields ended the day higher but 30Y outperformed (with the entire complex sliding after Fischer’s comments) – note the last 30 minutes saw bond yield rise once again – driven by PIMCO comments on rotation from Treasuries to riskier debt

Obviously crude stood out in today’s berserk market…

And we note that Gold was dumped after Europe closed as chatter went around of margin calls in crude sparking covering in everything…

Gold was thumped lower twice since Friday’s close – both saw significant bounces….

Crude is just a swarm of short-covering squeezes – now back at $38 – the lows of 12/31/15…

And finally – leaving the best for last, this happened…

Charts: Bloomberg
After years of being overweight stocks, JPMorgan for the first time I can recall has stated that it may be a good idea to short:
(courtesy JPMorgan/zero hedge)
JPMorgan: “We Think That One Should Start To Re-Enter The Shorts”
On Thursday, after 7 years of having an overweight or at least neutral stance on equities, JPM “for the first time this cycle” went underweight stocks. This is what JPM’s Jan Loeys said:
Equities, credit and commodities have all rallied in the last three weeks, as some of the immediate threats to the world economy have faded from attention, possibly only because the bad earnings season has wound up. But, to us, the fundamentals of growth, earnings and recession risk have not improved, and if anything have worsened. We remain wary of the near-empty ammo box of policy makers.
Our 12-month-out US recession odds have risen to 1/3, while equity-implied odds have instead fallen to near 1/5. But even with no recession this year or next, we see US earnings rising only slowly by low single digits and see little to boost multiples. The eventual recession should bring US stocks down some 30%, creating a strong downward risk skew to returns over the next few years.
It added the following:
- We go Underweight Equities for the first time in this cycle.
- Equity bearish forces include poor macro valuation vs. our recession risk for this year; negative fundamental momentum; and limited profit and return upside relative to the downside we see from the eventual recession.
- The limited upside we see on stocks under our no-recession modal forecast is driven by still dismal productivity growth and the inability/unwillingness of monetary and fiscal policy makers to stimulate growth.
And just in case it is unclear what “Underweight” means, overnight JPM’s Chief US equity strategist, Mislav Matejka explained: “We have on 15th Feb called for a tradeable market rebound. Now, following the 13% SX5E and 10% SPX upmove, we think that one should start to re-enter the shorts.”
Here are the reasons why JPM is now selling:
Technicals are now closer to overbought than to oversold territory. VIX is at ytd lows – a degree of complacency might be creeping in again. Global P/E is up on the year. PMIs remain under pressure everywhere, with services converging with manufacturing. The Chinese labour component of PMI is the lowest since Jan ’09. Q1 results are likely to be weak again. DXY is not falling, Fed is back in the picture, politics could be very messy – German regional elections on March 13th are important to watch. Finally, we are soon entering poor seasonals, where April-May and onwards saw an increased volatility in the past few years. We take advantage of the bounce to reduce equity weight to an outright UW, in a balanced portfolio. This is the first time since ’07 that we are UW stocks, and follows our 30th Nov cut to our structural equity OW stance. We note that US median ND/E ratio is at 20-year highs, as are Buybacks/EBIT ratios. Eurozone is at an earlier stage of the cycle, but it is unlikely to decouple. UK stays the top regional pick globally, despite Brexit risk. Utilities and Telecoms remain the top global sector OWs. Stay with Defensives and FCF basket”
It goes without saying that if this recommendation If this was Goldman or Gartman, we would of course recommend mortgaging one’s mother and buying deep OTM calls on the S&P.
However, with JPM’s equity team which boasts such actually correct forecasters are Marko Kolanovic, we would be far more careful to fade anything coming out of the Park Avenue bank; in fact, JPM just may be right, especially after Kolanovic’s revelations last night about what the fate of the short squeeze may be, to wit:
What is the fate of this market rally? In terms of technical flows, more inflows would come if 3M and 12M momentum turn positive, which would happen at ~2025 and ~2075, respectively (the precise level depends on the timing of potential moves). If volatility stays subdued, volatility-managed strategies could also increase equity exposure. However, equity momentum is also vulnerable to the downside and a move lower could be accelerated by 6M and 1M momentum unraveling at ~1950 and ~1900, respectively.From the perspective of systematic strategies, downside and upside risks are balanced. However, equity fundamentals remain a headwind. In our recent strategy note, we showed that historically, periods of consecutive quarterly EPS contractions are often followed by (or coincide with) economic recessions (~80% of the time over the past ~120 years). EPS recoveries that follow 2 consecutive EPS contractions (~20% of times) were typically triggered by some form of stimulus (fiscal, monetary or exogenous). We expect market volatility to stay elevated and investors to remain focused on macro developments such as the Fed’s rates path, developments in China, and releases of US Macro data. Elevated volatility and EPS downside revisions will provide a headwind for the S&P 500 to move significantly higher (via multiple expansion). While investors need to have equity exposure, we think there are better opportunities in Value stocks, International and EM equities (as compared to broad S&P 500 exposure)
Now if only Goldman would also go “long” the S&P500, then the confusion about what is really going on would be eliminated instantly.
end
It certainly looks like the USA and the globe are entering depression like conditions. The GAAP expected earnings for the S and P for this yr is forecasted at 19.92. Fictional non GAAP is expected at 29.49 dollars/both down over 3%. S and P is now at 1991 and thus P./E on GAAP will be a huge: 19.92 x 4 / 1991 = 24.98. Even non GAAP earnings are expected to fall and thus its P/E will be: 16.87.
(courtesy zero hedge)
Non-GAAP Earnings Are About To Plunge The Most Since 2009; As For GAAP Don’ Even Ask…
Now that Q4 EPS is almost in the history books with 494 S&P500 companies reporting, we can look at the numbers: blended 4Q EPS is $29.49 (-2.9% y/y) with GAAP EPS of $19.92. As DB admits, a 67% GAAP-to-non GAAP ratio is well below the normal ~90% ex. recessions, exacerbated by asset impairments and restructuring costs especially at Energy.
This is how DB shows this almost unprecedented divergence between GAAP and non-GAAP:

This is merely a recreation of charts we first showed one week ago, when we commented on the widest spread between GAAP and non-GAAP since the financial crisis:


The chart below shows where the GAAP to non-GAAP divergence is most acute.

Ok, we get it: on a GAAP basis it is not a recession any more, it is a depression, just as that Houston CEO letter explained.
But what if we only look at adjusted, gimmicky non-GAAP? Even when looked at purely “pro forma”, things are bad. Recall that in the middle of 2015 when the full severity of the oil collapse was finally becoming apparent, the sellside was absolutely certain that the clouds would blow away by 2016, and as a result as recently as December 31, consensus expected Q1 EPS to post a modest 0.3% rise. That is not going to happen. Instead, as aof this moment, Q1 EPS is expected to collapse by a near record 8.0%, which would be the biggest annual decline since Q3 2009.
To all those saying “it’s all just energy”, we would say “yes… and 6 other sectors” as shown in the chart below. In fact, as of this moment, the only industries which are expected to post an EPS increase in Q1 are Telecom, Consumer Discretionary and Healthcare.

As Factset summarizes:
The estimated earnings decline for Q1 2016 is -8.0%. If this is the final earnings decline for the quarter, it will mark
the first time the index has seen four consecutive quarters of year-over-year declines in earnings since Q4 2008
through Q3 2009. It will also mark the largest year-over-year decline in earnings since Q3 2009 (-15.7%). Three
sectors are projected to report year-over-year growth in earnings, led by the Telecom Services and Consumer
Discretionary sectors. Seven sectors are projected to report a year-over-year decline in earnings, led by the Energy,
Materials, and Industrials sectors.
So four consecutive quarters of declining earnings, or two earnings recessions back to back: recall whatJPM said last night: “periods of consecutive EPS contractions are often followed by
(or coincide with) economic recessions (~80% of the time over the past
~120 years).” What about periods of two consecutive earnings recessions?
Don’t answer that, because it gets worse:
During the first two months of Q1 2016, analysts lowered earnings estimates for companies in the S&P 500 for the
quarter. The Q1 bottom-up EPS estimate (which is an aggregation of the estimates for all the companies in the index)
dropped by 8.4% (to $26.69 from $29.13) during this period. How significant is an 8.4% decline in the bottom-up EPS
estimate during the first two months of a quarter?During the past ten years, (40 quarters), the average decline
in the bottom-up EPS estimate during the first two months of a quarter has been 3.6%. Thus, the decline in the
bottom-up EPS estimate recorded during the first two months of the first quarter was larger than the 1-year, 5-year,
and 10-year averages.In fact, this was the largest percentage decline in the bottom-up EPS estimate over the first two months of a quarter
since Q1 2009 (-24.0%).
As the WSJ summarizes it “Wall Street’s earnings estimates for S&P 500 companies are falling at the fastest pace since the height of the financial crisis.”
As for the guidance, it is is just as abysmal:
Guidance: Negative EPS Guidance (79%) for Q1 above Average
At this point in time, 115 companies in the index have issued EPS guidance for Q1 2016. Of these 115 companies,
91 have issued negative EPS guidance and 24 have issued positive EPS guidance. Thus, the percentage of
companies issuing negative EPS guidance to date for the first quarter is 79% (91 out of 115). This percentage is
above the 5-year average of 72%.
In other words, we are about to have our 4th consecutive annual decline in S&P earnings. And here we make a bold prediction: while Wall Street traditionally expects a sharp hockeystick into outer quarters, which explains why consensus expects a 1.8% increase in ful year earnings (down from 4.3% at the start of the year), we on the other hand are clling Q2, Q3 and Q4: the next three quarters are all about to post EPS declines, leading to an unprecedented 8 consecutive quarters in declining S&P500 EPS. Actuallyprecedented: the last time it happened was during the Great Depression.
Only this time it’s not even a recession, because when you “exclude energy”, add a near record number of non-GAAP addbacks, and hockeystick the result, everything is quite ok.
A Modest Proposal: Gift The BLS To The Democratic National Committee Or Sell It To CNBC
by David Stockman • March 5, 2016
Yes, the BLS is now producing such a steaming pile of waste matter that it might as well be made an arm of the DNC. Or in the alternative, some of the billions that US taxpayers have wasted on it over the years might be recouped from a sale to CNBC. After all, bubblevision’s monthly cheerleading session couldn’t do without it.
In any event, once again this month the labor department bureaucrats did not go out and actually count 242,000 new jobs or even extrapolate them from a valid, scientific sample survey of the Gallup variety.
Folks, they never left their cushy offices; they plucked these numbers from a computer model!
Even before the Census Bureau turned over to the BLS its ragged February data sheets from calling households which do not have phones and surveying businesses which may or may not exist, they more or less knew this month’s numbers.
How? Why they are just fitting a projection line to the trend of the last several years, and then gussying up the resulting hockey sticks with even flakier seasonal maladjustments, re-estimates, birth/death factors and a lot more statistical shenanigans.
So why waste $600 million per year on the BLS when a couple of staffers and a lap top computer at the Democratic National Committee could produce the same propaganda? So could an intern or two at bubblevision headquarters in Englewood Cliffs, New Jersey.
Either way Steve Liesman of CNBC and Barrack Obama of the White House would still be out crowing about how awesome things are on main street. On that score, our clueless lame duck President left nothing to the imagination with respect to this morning’s fiction,
“America’s pretty darn great right now,” Obama told reporters Friday as he celebrated a strong jobs report that he said proved Republicans’ “doomsday rhetoric” is little more than “fantasy.”
Let’s see. It would appear that a few pages fell out of Barry’s briefing folder before he rushed to the press room. That is, just about anything that measures what is actually happening in America is not “pretty darn good” at all:

We will dig deeper into the BLS’ trunk of junk below, but just try this one for a smell test. Is it really possible to believe that private “educational services” jobs——which encompasses everything from swank private days schools to boiler room driven for-profit tuition mills——-have been growing at the exact pace of 62,000 jobs per year since 2006?
In fact, the February 2016 number for this BLS establishment survey category was 3.51 million jobs. That was 64k higher than February 2015; and that, in turn, was 62k higher than February 2014, which was, yes, 63khigher than February 2013.
Then if we go back to February 2006 we get a level of 2.90 million jobs. So subtract that from the 2016 number, divide by 10 years, and, presto, the result is 62k new private education jobs per year for the last decade running.
C’mon. There are more cross-currents out there in the blooming, buzzing world of private education than Carter has liver pills. This huge jobs category covers literally hundreds of thousands of institutions from Podunk Iowa Day School through Harvard Law School. The odds that employment grew by almost exactly 62k for the last three years lies somewhere between zero and none .
In fact, this number is not measured; it’s modeled.

Likewise, try jobs in the BLS category called “outpatient care centers”. Here the magic 10-year trend is 29k per year and that compares to 31k jobs gained in February 2016 over prior year; and a gain of 33k and 29k in the two years before that, respectively.
Right. It puts you in mind of the lesser lights in your high school class who stole the answers to the final exam, and weren’t smart enough to get one or two answers wrong in order to cover their tracks.

Let’s say, for example, that outpatient centers have been steadily shifting labor from direct payroll to temp agencies and other outsourced contractors. Accordingly, the actual labor used in outpatient care would migrate to another BLS category, and the job count would not rise by exactly 29k per year and could actually fall if the outsourcing shift were extensive enough.
Shhh! Don’t tell the modelers. As I said, either the DNC or CNBC is welcome to have the entire BLS—– kit, caboodle and all.

And then there is the hideous stupidity of the seasonal adjustment factors—or something called ARIMA, which stands for “auto-regressed integrated moving average”.
Stated in plain English, they created an adjustment factor for February which purportedly embodies average seasonal variations going back five years and projected forward five years. Then they repeat the same ten-year smoothing process for each remaining month of the year.
As it turns out, however, the market-moving and CNBC-fooling head line “jobs” print for any given month is a complete creature of the ARIMA seasonal adjustment razzmatazz. For one thing, the seasonal adjustment factor is often 5X to 12X larger than the headline delta or job gain for the month. The adjustment swamps the adjustee.
Thus, the ARIMA seasonal for February was +1.555 million jobs—-a figure 6.4X the headline print of +242k. During January the headline seasonally adjusted (SA) print was +172k or just 8% of the massive ARIMA adjustment of +2.163 million jobs.
Obviously, just alter the seasonal adjustment factor by a hairline fraction of the underlying NSA jobs total for any given month, and you get an altogether different answer. That is, the CNBC jobs panel would go gumming off in a wholly different direction about the head line prints meaning for the state of the economy and for the putative state of mind in the Eccles Building based on nothing to do with the real world, but merely the statistical machinations of some GS-16 at the BLS. Or the DNC, as the case may be.
And this is no far-fetched theoretical point. The smoothed 10-year ARIMA adjustment number for February 2016 was +1.555 million, representing 1.095% of the 142.005 million NSA jobs modeled for the month. For February last year the SA adjustment factor was 1.545 million jobs or 1.109% and the year before that it was 1.512 million 1.110%. Now how do you like that for scientific precession?
For one thing, weather variations in each February are far greater than implied by these tightly clustered ARIMA factors; and for another, seasonals could easily change over the course of the business cycle, with bigger seasonal effects early in the recovery bounceback and smaller ones from a more normalized level of operations late in the cycle.
Likewise, seasonals could also shift owing to secular changes in economic function, such as the shift of retail sales from brick and mortar stores to on-line e-commerce venues. IN the latter, a lot of the economic function gets captured in BLS warehousing and package transportation categories, as opposed to retailing.
Needless to say, job counts, average weekly employee hours and load smoothing business operations are totally different between Sears and UPS, for example. Yet the ARIMA factor for way back in February 2006 was1.523 million jobs——a number that is virtually identical to the 1.555 million used in Friday’s report. There is, however, not a snowballs chance that the US economy’s seasonal structure has remained absolutely unchanged for the past decade.
In any event, if this February was a seasonally warm month than normal and the evident secular shift toward reduced seasonality has proceeded apace, the proper ARIMA factor for this February might have been, say, 1.001% versus 1.095%. In that event, the head line print would have been +109k, not +242k. And even though the difference is all statistical noise, Friday morning’s all is awesome chatter would have had a far different tone.
That is, the Jobs Friday revilers are cackling about shadows. The emphasis everywhere and always should be on the fact that the head line “print” or delta for the month is meaningless noise because at the end of the day it is a double derivative. To wit, the delta in the ARIMA factor for February was -608k jobs reflecting a drop in the seasonal adjustment from 2.163 million jobs in January to 1.555 million jobs in February.
On the other hand, the model generated NSA number for February was142.005 million jobs, representing a +850k gain from the 141.115jobs modeled for January. So just subtract the arbitrary big minus (-608k) on the month-over month ARIMA factor change from the big plus (+850k) on the NSA month over month comparison and you get the magic +242,000!
As I said, you get statistical noise. And you need look no further than the55k gain in retail jobs reported for February or nearly one-quarter of the entire “upside surprise”. Except……except the modeled NSA number for February was a loss of 142k jobs!
But don’t sweat the small stuff. The ARIMA seasonal adjustment factor for February was +295k jobs, thereby helping mightily to get the February headline into the awesome category.
No, you don’t have to be a philistine to make this point, and you can even agree that perhaps February is a more “seasonal” month for retail than is January, where the ARIMA adjustment was only +98k jobs or just one-third of the boost to February.
But here’s the thing. What is the likelihood that true seasonality in February 2016 was identical to the 295k ARIMA adjustment for February 2014 and nearly identical to the 301k adjustment way back in February 2006?
There has been a veritable retailing revolution since then. Just ask Eddie Lampert or Jeff Bezos, as the case may be.
In short, the monthly head line jobs number is the most useless data point imaginable. It reflects the capricious result of adding a statistical artificer called ARIMA to a modeled NSA trend that most definitely does not capture the real world jobs market, and most especially not the inflection points when the business cycle is shifting.
The point is, the only thing that really matters on the jobs front is the trend of jobs growth, the mix of employment opportunities and the metric for what is actually sold in today’s labor market. To wit, hours and gigs, not standard 40 hour work weeks punched into a time clock.
As to the mix issue, you need look no further than the February numbers themselves. On the one hand, there were 86k new jobs in education and health, 48k in hospitality and leisure and the aforementioned 55k in retail. These categories alone add up to 190k or nearly 80% of the putative gain—even though for the most part they represent part-time work and bottom of the scale pay levels.
By contrast, there was a loss of 19k jobs in energy and mining, a drop of 16k in manufacturing and only hairline gains in the other principal full-time, full pay categories. Thus, there are a total of 8.2 million jobs in FIRE (finance and real estate), but the gain was a miniscule 6k. And there are 6.6 million jobs in construction, where the gain was just 19k, and all of that and then some was due to the seasonal adjustment factor. And in the huge business and professional services category (20 million jobs), the gain was a scant 23k.
In fact, notwithstanding the noise-ridden nature of the monthly numbers, the February report makes it plainly evident that there is nothing awesome about the US labor market at all. We have focused consistently on what we call “breadwinner jobs”, which on average pay about $50,000 on an annualized basis. Yet once again the February level is still one million jobs short of where it was way back in December 2007 on the eve of the financial crisis.
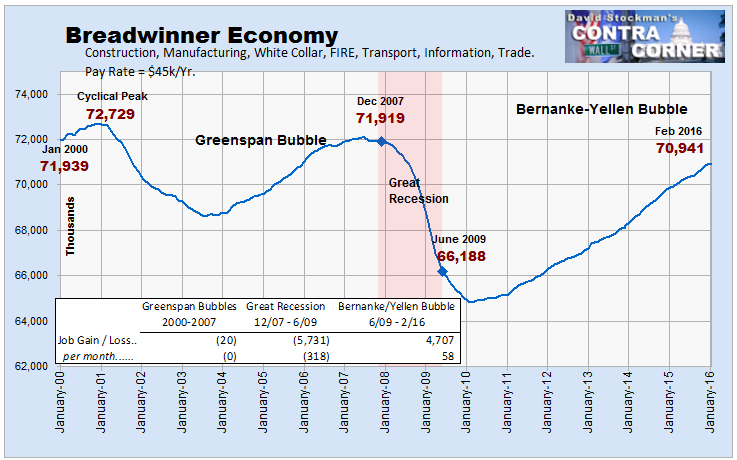
The point here is that the business cycle expansion is not going to last forever, and at 81 months it is already extremely long in the tooth compared to the 61-month post war average.
In fact, at the 58k rate of breadwinner jobs gain recorded in February it would take another 31 months just to get back to the level achieved in early 2001! The odds that we will not have another recession during that span are not compelling, to say the least.
So Washington and Wall Street can celebrate the Jobs Friday report all they wish, but it doesn’t change the fact that massive money printing and unspeakable growth in public debt since the turn of the century has produced what amounts to a bread and circuses jobs market. Compared to the shrinkage in breadwinner jobs, here is the picture for barhops, bellboys, wait staff and hot dog vendors.
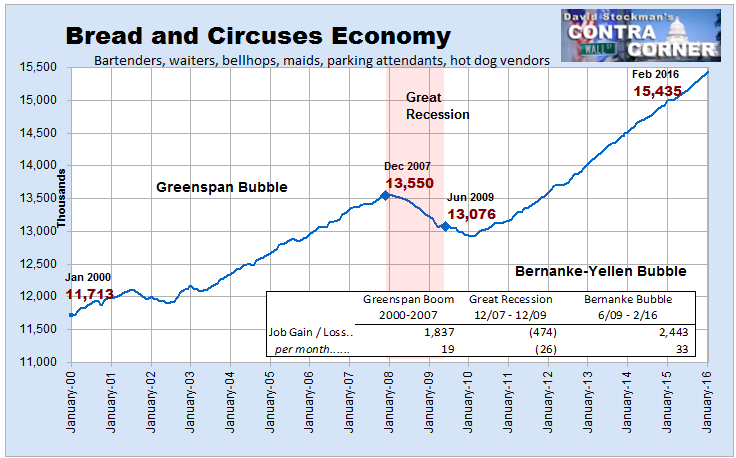
Indeed, since last February, the US has added 360K waiters; in the same time, a paltry 12k manufacturing workers have been added as shown in the chart below.

As to the longer term trend since the start of the Great Recession in December 2007, there has been added 1.6 million waiter/bartender jobs. Manufacturing jobs not so much, and in fact, reflect there are now 1.4 million fewer such jobs.
Even that understates the reality, however. The manufacturing jobs lost represent about $80 billion annually in reduced wages. The waiter/bartender jobs gained, by contrast, represent only $30 billion in annual wages.
Now, it is true that Barry went to Harvard Law School where there is not much emphasis on math skills. It’s hard to say what Steve Liesman’s excuse might be——except flogging the Wall Street narrative that it’s always time to buy stocks would seem to be the essence of it.

Chinese Hackers Break Into NY Fed, Steal $100 Million From Bangladesh Central Bank
Reports indicate that some of the stolen funds were traced to the Philippines, but given what we know about the “Cyber Axis of Evil,” we can only suspect it was Iranians, Chinese, or the criminal/military mastermind Kim Jong-Un who was behind the scam, but whatever the case, someone, somewhere, hacked into Bangladesh’s central bank on February 5.
According to Reuters, “some of the funds” have been recovered, but the bank didn’t initially say how much or how much was initially stolen. We suppose that theoretically it could have been a rather large sum, as the country has around $26 billion in FX reserves on hand:

But just moments ago we learned from the AFP that the amount lost was around $100 million. “Some of the money was then illegally transferred online to the Philippines and Sri Lanka, a central bank official told AFP on condition of anonymity.”
“The bank reported that the USD 100 million was leaked into the Philippine banking system, sold to a black market foreign exchange broker and then transferred to at least three local casinos,” AFP continues, adding that “the amount was later sold back to the money broker and moved out to overseas accounts within days.”
And here’s the punchline: According to AFP, Chinese hackers have been blamed and the money was stolen from accounts held at the New York Fed…

(“They stole about this much, I’d say”)


[…] MARCH 7 C/NO CHANGE IN GLD BUT SLV ADDS 2.856 MILLION OZ/BIG STORY OF THE DAY: BLACKROCK’S IAU… […]
LikeLike