
Huge Update!!!
My website is now ready You can find my site at the following url:
http://www.harveyorganblog.com or www .harveyorgan.wordpress.com
I will continue to send the comex data down to my good friends at the Doctorsilvers website on a continual basis.
They provide the comex data. I also provide other pertinent data that may interest you. So if you wish you can view that part on my website.
Gold: $1190. down $17.50
Silver: $16.29 down $0.23
In the access market 5:15 pm
Gold $1190
silver $16.29
The gold comex today had a poor delivery day, registering 0 notices served for 800 oz. Silver comex registered 13 notices for 185,000 oz.
A few months ago the comex had 303 tonnes of total gold. Today the total inventory rests at 240.36 tonnes for a loss of 63 tonnes over that period.
In silver, the open interest fell by a small 1507 contracts with Wednesday’s rise in price of $0.16. Looks like some of the shorts are vacating the arena. For the past year, we have been witnessing massive liquidation of contracts despite the fact that it cost nothing to roll. This makes no sense and it smacks of cash settlements which are totally illegal. Since I have been following comex data, I have never witnessed such a massive liquidation in both gold and silver. The total silver OI still remains relatively high with today’s reading at 146,915 contracts. The big December silver OI contract lowered by 38 contracts down to 573 contracts.
In gold we had a loss in OI with the fall in price of gold yesterday to the tune of $1.00. The total comex gold OI rests tonight at 368,913 for a loss of 1,999 contracts. The December gold OI rests tonight at 1975 contracts losing 130 contracts.
TRADING OF GOLD AND SILVER TODAY
GOLD
Gold started out pretty good during the Asian time zone and by 3 am (first London fix) gold hit $1206.39.
Then the boys proceeded their usual whack job and by comex opening it retreated to $1200.00 only to rebound again to hit its zenith again at $1206.40 just before the jobs report. Then it went straight down and stayed there for the rest of the day.
Silver
Silver traded in the exact same fashion as gold
By 3 am silver hit its zenith at $16.50 and by comex opening time 8:20 it again it his zenith at $16.52 only to be bombed by the crooks with the jobs report down to $16.24 and it rebounded a bit to $16.29 and it stayed there for the rest of the day.
Today, we had no change in tonnage of gold Inventory at the GLD / inventory rests tonight at 720.02 tonnes.
In silver, we had no change in silver inventory
SLV’s inventory rests tonight at 345.223 million oz
.
We have a few important stories to bring to your attention today…
Let’s head immediately to see the major data points for today.
First: GOFO rates:
all rates moved closer to the positive and out of backwardation!!
Now, all the months of GOFO rates( one, two, three six and 12 month GOFO moved positive and moved closer to the positive needle. They must have found a few bars to lease. On the 22nd of September the LBMA stated that they will not publish GOFO rates. However today we still received today’s GOFO rates. It looks to me like these rates even though negative are still fully manipulated. London good delivery bars are still quite scarce.
The backwardation in gold is incompatible with the raid on gold. It does not make any economic sense.
Dec 5 2014
1 Month Rate: 2 Month Rate 3 Month Rate 6 month rate 1 yr rate
+.035.% + .0300 -% -+0450 -% +. 06 .% +. 11%
Dec 4 2014:
-0.170% -.1200% -.0750 % -.01% +.085%
end
Let us now head over to the comex and assess trading over there today,
Here are today’s comex results:
The total gold comex open interest fell today by 1999 contracts from 370,912 all the way down to 368,913 with gold down by $1.00 yesterday (at the comex close). We are now into the big December contract month where the number of OI standing for the gold metal registers 1975 contracts for a loss of 130 contracts. We had 0 delivery notices yesterday so we lost 130 contracts or 13,000 oz of gold standing for the December contract month. The non active January contract month fell by 140 contracts down to 536. The next big delivery month is February and here the OI fell to 233,468 contracts for a loss of 2,281 contracts. The estimated volume today was awful at 107,347. The confirmed volume yesterday was also bad at 123,117 even with the help of high frequency traders. The comex now has no credibility and many investors have vanished from this crooked casino. Today we had 0 notices filed for nil oz .
And now for the wild silver comex results. Silver OI fell by another 590 contracts from 147,505 down to 146,915 as silver was up by $0.16 yesterday. I do believe we lost a few more bankers. The big December active contract month saw it’s OI fall by 38 contracts down to 573 contracts. We had 57 notices served upon for Thurs. delivery. Thus we gained 19 contracts or an additional 95,000 oz will stand. The estimated volume today was quite weak registering a tiny 24,578. The confirmed volume yesterday was fair at 35,979. We had 13 notices filed for 65,000 oz today
December initial standings
Dec 5.2014
| Gold |
Ounces |
| Withdrawals from Dealers Inventory in oz | 150,109.154 (Brinks,Scotia) |
| Withdrawals from Customer Inventory in oz | 3290.98 oz (Scotia,HSBC) |
| Deposits to the Dealer Inventory in oz | nil oz |
| Deposits to the Customer Inventory, in oz | 19,901.568 (Scotia) oz |
| No of oz served (contracts) today | 0 contracts(nil oz) |
| No of oz to be served (notices) | 1975 contracts (197500 oz) |
| Total monthly oz gold served (contracts) so far this month | 1849 contracts(184900 oz) |
| Total accumulative withdrawals of gold from the Dealers inventory this month | 150,109.154 oz |
|
Total accumulative withdrawal of gold from the Customer inventory this month |
135,420.8 oz |
Today, we had 2 dealer transactions
On the dealer withdrawal side:
i) Out of Brinks: 62,259.74 oz
ii) Out o Scotia: 87,849.414 oz
total dealer withdrawal: 150,109.154 oz
we had 0 dealer deposits:
total dealer deposit: nil oz
we had 2 customer withdrawals
i) Out of HSBC: 192.910 oz
ii) Out Scotia: 3098.07 oz
total customer withdrawal: 3290.98 oz
we had 1 customer deposits:
i) Into Scotia; 19,901.568 oz
total customer deposits :19,901.568 oz
We had 0 adjustments:
Total dealer inventory: 721,123.608 oz or 22.429 tonnes
Total gold inventory (dealer and customer) = 7.727 million oz. (240.36) tonnes)
Several weeks ago we had total gold inventory of 303 tonnes, so during this short time period 63 tonnes have been net transferred out. We will be watching this closely!
Today, 0 notices was issued from JPMorgan dealer account and 0 notices were issued from their client or customer account. The total of all issuance by all participants equates to 0 contracts of which 0 notices were stopped (received) by JPMorgan dealer and 0 notices were stopped (received) by JPMorgan customer account.
To calculate the total number of gold ounces standing for the December contract month, we take the total number of notices filed for the month (1849) x 100 oz to which we add the difference between the OI for the front month of December (1975) minus the # gold notices filed today (0) x 100 oz = the amount of gold oz standing for the December contract month.
Thus the initial standings:
1849 (notices filed for the month x 100 oz + (1975) the number of OI notices for the front month of December served upon – (0) notices served today equals 382,400 oz or 11.89 tonnes
we lost 130 contracts or 130,000 oz that will not stand.
This initiates the month of December for gold.
And now for silver
Dec 5/2014:
December silver: initial standings
| Silver |
Ounces |
| Withdrawals from Dealers Inventory | nil |
| Withdrawals from Customer Inventory | 832,807.600 oz (CNT,Brinks, Scotia) |
| Deposits to the Dealer Inventory | nil |
| Deposits to the Customer Inventory | 1,243,579.14 oz (Scotia,Brinks) |
| No of oz served (contracts) | 13 contracts (655,000 oz) |
| No of oz to be served (notices) | 560 contracts (2,880,000 oz) |
| Total monthly oz silver served (contracts) | 2485 contracts (12,425,000 oz) |
| Total accumulative withdrawal of silver from the Dealers inventory this month | 1,163,562.6 oz |
| Total accumulative withdrawal of silver from the Customer inventory this month | 2,137,783.1 oz |
Today, we had 0 deposits into the dealer account:
total dealer deposit: nil oz
we had 0 dealer withdrawal:
total dealer withdrawal: nil oz
We had 3 customer withdrawal:
i) Out of CNT: 89,879.300 oz (one decimal)
ii) Out of Brinks: 50,936.56 oz
iii) Out of Scotia: 690,991.740 oz
total customer withdrawal 821,807.600 oz
We had 2 customer deposits:
i) Into Scotia: 612.489.06 oz
ii) Into Brinks; 631,090.08 oz
total customer deposits: 1,243,579.14 oz
we had 1 adjustment
from the Delaware vault:
35,756.757 oz was adjusted out of the dealer and this landed into the customer account of Delaware
Total dealer inventory: 64.579 million oz
Total of all silver inventory (dealer and customer) 177.773 million oz.
The total number of notices filed today is represented by 13 contracts or 65,000 oz. To calculate the number of silver ounces that will stand for delivery in December, we take the total number of notices filed for the month (2485) x 5,000 oz to which we add the difference between the total OI for the front month of December (573) minus (the number of notices filed today (13) x 5,000 oz = the total number of silver oz standing so far in November.
Thus: 2485 contracts x 5000 oz + (573) OI for the November contract month – 13 (the number of notices filed today) =15,225,000 oz of silver that will stand for delivery in December.
we gained 95,000 oz standing.
for those wishing to see the rest of data today see:
end
The two ETF’s that I follow are the GLD and SLV. You must be very careful in trading these vehicles as these funds do not have any beneficial gold or silver behind them. They probably have only paper claims and when the dust settles, on a collapse, there will be countless class action lawsuits trying to recover your lost investment.
There is now evidence that the GLD and SLV are paper settling on the comex.
***I do not think that the GLD will head to zero as we still have some GLD shareholders who think that gold is the right vehicle to be in even though they do not understand the difference between paper gold and physical gold. I can visualize demand coming to the buyers side:
i) demand from paper gold shareholders
ii) demand from the bankers who then redeem for gold to send this gold onto China
vs no sellers of GLD paper.
And now the Gold inventory at the GLD:
Dec 5.2014: no change in tonnage/720.02 tonnes
Dec 4 no change in tonnage/720.02 tonnes
Dec 3 no change in tonnage/720.02 tonnes/
December 2/2014; wow!! we had a huge addition of 2.39 tonnes of gold /Inventory 720.02 tonnes
December 1.2014: no change in gold inventory at GLD
Nov 28.2014: a loss in inventory of 1.19 tonnes/tonnage 717.63 tonnes
Nov 26.2014: we lost 2.09 tonnes of gold heading to India and or China/inventory at 718.82 tonnes
Nov 25.2014/no change in tonnage of gold inventory at the GLD/inventory at 720.91 tonnes
Nov 24.2015: no change in tonnage of gold inventory at the GLD/inventory at 720.91 tonnes
Nov 21.2014: no change in tonnage of gold inventory at the GLD/inventory 720.91 tonnes
Today, December 5 no change in inventory at GLD.
inventory: 720.03 tonnes.
The registered vaults at the GLD will eventually become a crime scene as real physical gold departs for eastern shores leaving behind paper obligations to the remaining shareholders. There is no doubt in my mind that GLD has nowhere near the gold that say they have and this will eventually lead to the default at the LBMA and then onto the comex in a heartbeat (same banks).
GLD : 720.03 tonnes.
end
And now for silver:
Dec 5/2014: no change in inventory/345.223 million oz
Dec 4/we lost another 2.204 million oz of silver/inventory 345.223 million oz
dec 3. we lost 2.73 million oz of silver/inventory 347.427 million oz and back where we were on Dec 1.2014.
dec 2 wow@!!@ a huge addition of 2.20 million oz of silver/inventory 350.158 million oz.
December 1: no change in inventory/347.954 million oz
Nov 28.2014: no change in inventory/347.954 million oz
Nov 26.2014; no change in inventory/347.954 million oz
Nov 25.14 we had a loss of 1.342 million oz from the SLV/inventory 347.954 million oz
Nov 24.2014: no change in silver inventory at the SLV/Inventory 349.296 million oz
Nov 21.2014: no change in silver inventory at the SLV
Inventory: 349.296 million oz
Nov 20.2014; no change/inventory 349.296 million oz
Nov 19.2014: a huge addition of silver inventory to the tune of 2.396 million oz/inventory 349.296 million oz
December 5/2014/ we had no change in silver/inventory 345.223 million oz
end
And now for our premiums to NAV for the funds I follow:
Note: Sprott silver fund now deeply into the positive to NAV
Sprott and Central Fund of Canada.
(both of these funds have 100% physical metal behind them and unencumbered and I can vouch for that)
1. Central Fund of Canada: traded at Negative 10.6% percent to NAV in usa funds and Negative 10.6% to NAV for Cdn funds!!!!!!!
Percentage of fund in gold 61.4%
Percentage of fund in silver:38.10%
cash .5%
( December 5/2014)
2. Sprott silver fund (PSLV): Premium to NAV falls to positive 1.10% NAV (Dec 5/2014)
3. Sprott gold fund (PHYS): premium to NAV falls to negative -0.44% to NAV(Dec 5/2014)
Note: Sprott silver trust back hugely into positive territory at 1.10%.
Sprott physical gold trust is back in negative territory at -0.44%
Central fund of Canada’s is still in jail.
end
At 3:30 pm we received the COT.
Let us now head over and see the Gold COT:
| Gold COT Report – Futures | ||||||
| Large Speculators | Commercial | Total | ||||
| Long | Short | Spreading | Long | Short | Long | Short |
| 170,635 | 81,305 | 27,571 | 135,777 | 225,185 | 333,983 | 334,061 |
| Change from Prior Reporting Period | ||||||
| 3,241 | -9,882 | -3,990 | -20,557 | 366 | -21,306 | -13,506 |
| Traders | ||||||
| 113 | 90 | 74 | 47 | 54 | 197 | 190 |
| Small Speculators | ||||||
| Long | Short | Open Interest | ||||
| 34,138 | 34,060 | 368,121 | ||||
| 1,282 | -6,518 | -20,024 | ||||
| non reportable positions | Change from the previous reporting period | |||||
| COT Gold Report – Positions as of | Tuesday, December 02, 2014 | |||||
Our large speculators:
Those large specs that have been long in gold added 3241 contracts to their long side
Those large specs that have been short in gold covered a rather large 9882 contracts from their short side.
Our commercials:
Those commercials who have been long in gold pitched 3990 contracts from their long side.
Those commercials who have been short in gold covered a monstrous 20,557 contracts from their short side
and they attack again today???
Our small specs;
Those small specs that have been long in gold added 1282 contracts to their long side
Those small specs that have been short in gold covered a huge 6518 contracts from their short side.
Silver:
| Silver COT Report: Futures | |||||
| Large Speculators | Commercial | ||||
| Long | Short | Spreading | Long | Short | |
| 50,686 | 29,095 | 14,626 | 62,023 | 88,609 | |
| -2,197 | -8,332 | -1,726 | -3,245 | 1,298 | |
| Traders | |||||
| 68 | 60 | 44 | 39 | 47 | |
| Small Speculators | Open Interest | Total | |||
| Long | Short | 148,422 | Long | Short | |
| 21,087 | 16,092 | 127,335 | 132,330 | ||
| -1,394 | 198 | -8,562 | -7,168 | -8,760 | |
| non reportable positions | Positions as of: | 129 | 130 | ||
| Tuesday, December 02, 2014 | © SilverSeek.co | ||||
Our large specs:
Those large specs that have been long in silver pitched 2197 contracts from their long side
Those large specs that have been short in silver covered 8332 contracts from their short side.
Our commercials;
Those commercials that have been long in silver pitched 3245 contracts from their long side
Those commercials that have been short in silver added a tiny 1298 contracts to their short side.
Our small specs;
Those small specs that have been long in silver pitched 1394 contracts to their long side
Those small specs that have been short in silver added 198 contracts to their short side.
end
And now for your most important physical stories on gold and silver today:
Early gold trading from Europe early Friday morning:
wow!! take a look at the huge import of gold into Turkey: 46.9 tonnes in November, a huge rise from 6.6 tonnes in October. Generally Turkey is the gateway for Arab purchases of gold:
(courtesy Mark O’Byrne)
ECB Draghi’s QE Battle With Germany; Rules Out ECB Gold Buying
The European Central Bank will decide early next year whether to follow the Federal Reserve, Bank of England and the Bank of Japan with quantitative easing or money creation to buy government bonds and other assets but will not buy gold, its president Mario Draghi said yesterday.

Speaking in the ECB’s new 1.3 billion euro headquarters, an imposing Frankfurt skyscraper designed to show the strength of the ‘single’ currency, Draghi threw down the gauntlet to Germany and signaled that he would not allow opposition from Germany or anyone else to stop the ECB’s QE.
Despite the fact that it has failed in Japan and is meeting with mixed success in the UK and U.S.
In his clearest language yet, Mario Draghi underlined his desire and commitment to debt monetisation, and argued the case for creating new money to buy assets such as government bonds. He made the comments during the question and answer period of his monthly press conference following the ECB’s monetary policy meeting.
Interestingly, Draghi ruled out the printing of money to buy gold bullion. He was asked what types of assets the ECB would buy as part of its quantitative easing program. He responded, “we discussed all assets but gold.”
Speculation arose that gold could be part of the central bank’s asset purchases after Yves Mersch, a member of the ECB executive board and former Governor of the Central Bank of Luxembourg, said on November 17 that the ECB could buy a range of assets as part of its quantitative easing program.
The fact that the ECB may soon print money to buy very risky European corporate, bank and sovereign debt from vulnerable economies such as Spain, Italy and Greece and has, from some unexplained reason, ruled out buying gold will make the Germans and others opposed to ECB QE very nervous.
This is likely leading to increasing tensions and divisions. Indeed, Die Welt reported yesterday that Draghi had lost the support of the majority of the ECB Executive Board.
Draghi’s remarks, which came within minutes of a meeting where he clashed with German officials over his ambitions, set him on a possible collision course with the euro zone’s biggest and single most important country.
Painting a gloomy picture of the euro bloc’s prospects, Draghi announced that the ECB expected economic output to be lower in the coming years than it had predicted three months ago, while a slump in the price of oil may lead to lower inflation.
Consumers and businesses are welcoming the fall in oil prices and lower inflation but today low inflation is seen as a trigger by central bankers including Draghi, the ex Goldman Sachs banker, to print money to buy government bonds.
Savers, people and businesses concerned about inflation throughout the world and indeed in Germany oppose this.

“QE has been shown to be effective in the United States and UK,” Draghi told journalists at a press conference. He ignored the fact that the Bank of Japan’s QE appears to have failed as it has not led to a revival of the moribund Japanese economy.
However, a somewhat strident Draghi made clear that he would face down the considerable political opposition to further radical action.
Last week, Sabine Lautenschlaeger, Germany’s appointee to the ECB’s Executive Board, said now was not the time for state bond buying. But Draghi said there was no need for all 18 countries to agree.
Draghi lacks the crucial German support for doing full-blown QE but combatively, he said he did not need that support.
“Do we need to have unanimity to proceed on QE or can we have a majority? I think we don’t need unanimity,” Draghi said, delivering a strong message to Germany.
Lautenschlaeger and Jens Weidmann, the head of Germany’s Bundesbank, opposed a decision on Thursday to harden up Draghi’s goal of bolstering the ECB’s balance sheet of assets, such as credit to banks, central bank sources told Reuters.
The ECB has set itself a goal of expanding its balance sheet — buying assets from banks and others in return for cash it hopes will be pushed into the economy — by up to 800 billion or even 1 trillion euros ($1.24 trillion).
New forecasts by the ECB predicted the bloc’s economy would grow just 1.0 percent next year rather than the 1.6 percent predicted just three months ago.
Inflation is seen at just 0.7 percent in 2015, down from a September forecast of 1.1 percent and way below the target of just under 2 percent.

The European Court of Justice will deliver a non-binding ruling on Jan. 14 about the legality of the ECB’s OMT program, which was credited with stopping a rout in European government bonds in 2012 by pledging to buy debt of countries signing up to reforms. A negative judgment by the court could ultimately impinge on the ECB’s freedom to intervene in sovereign-debt markets.
German opposition, due to their genuine and valid concerns about currency debasement, inflation and hyperinflation, nonetheless remains an obstacle.
It would appear that a titanic battle is taking place in the ECB. If Draghi and the uber monetary doves win, expect euro QE and a devaluation of the euro in the coming months.
Get Breaking News and Updates On Gold Markets Here
MARKET UPDATE
Today’s AM fix was USD 1,204.50, EUR 974.28 and GBP 768.37 per ounce.
Yesterday’s AM fix was USD 1,204.00, EUR 977.59 and GBP 767.42per ounce.
Gold fell $4.20 or 0.35% to $1,206.30 per ounce yesterday. Silver climbed $0.04 or 0.24% to $16.46 per ounce.
Gold looks set for a 3% gain for the week – its biggest jump in ten months- since last February. Most of the gains were seen on Monday (see chart) when gold surged the day after the Swiss gold referendum, to have a mandatory 20% gold backing for the Swiss franc, was badly defeated.
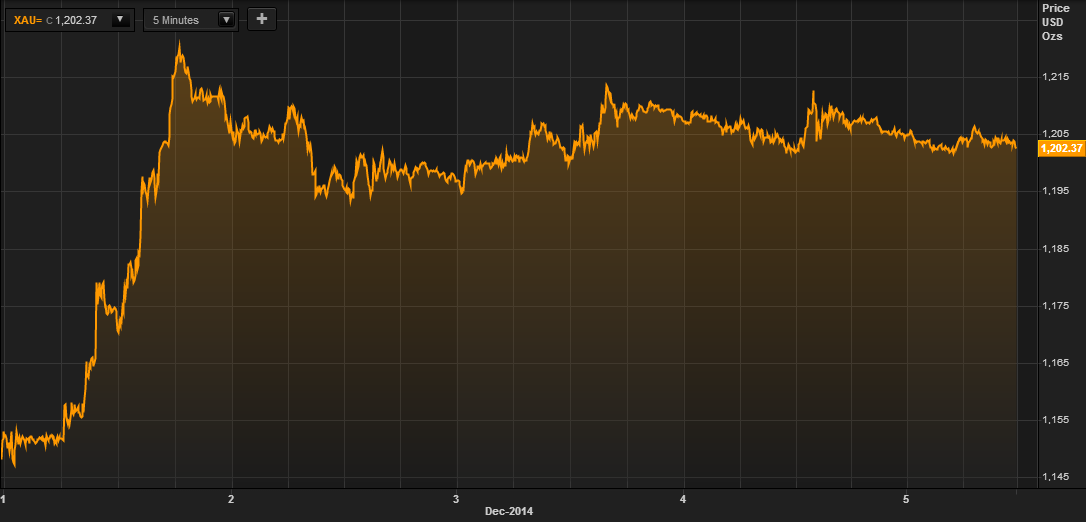
Gold in USD – 5 Days (Thomson Reuters)
Indeed, after initial falls in Asia, gold surged over 6% from peak to trough – from below $1,150/oz to over $1,220/oz. Gold has consolidated on those gains this week.
Gold was marginally lower in London ahead of the U.S. non farm payrolls November report due at 1330 GMT. Spot gold was down 0.1% at $1,202 an ounce in late morning trading in London. Silver was off 0.1% at $16.43 an ounce. Spot platinum was up 0.2% at $1,234.96 an ounce, while spot palladium was up 0.7% at $807 an ounce.
Investors will look for guidance from the U.S. non farm payrolls number. A weaker than expected number after disappointing retail sales this week would lead to a safe haven bid. A better than expected number, would likely see traders sell positions or go short.
A reform to Venezuela’s central bank law will allow the country to hold international reserves in a broader range of currencies than before as well as indiamonds and precious metals.
The bank will now also be able to hold reserves in diamonds and precious metals other than gold, which already makes up the majority of its reserves.
The change may help the OPEC nation shore up its tumbling international reserves by allowing it to include loans from China that are denominated in renminbi.
Finance Minister Rodolfo Marco this week traveled to China to discuss financing deals. Reserves last month hit an 11-year-low due to tumbling oil prices and capital flight driven by an exchange control system that heavily over values the country’s bolivar currency.
Venezuela used a $4 billion loan from China to bolster reserves, though these then fell again and currently stand at roughly $21.7 billion, according to the central bank website.
Demand in China continues to be robust and premiums out of China remain steady at $1-$2.
Middle East gold demand also appears to have picked up again. Turkey’s gold imports surged in November to 46.9 tonnes, a massive jump from October when the country imported 6.6 tonnes of gold bullion, data from Bourse Istanbul showed on Friday.
The country’s gold imports were at 19.3 tonnes in November 2013. The Istanbul Gold Exchange released data that showed gold imports into Turkey more than doubled year on year to 46.9 tonnes in November, which registered its highest monthly imports in over six years.
Global gold demand remains robust which bodes well for gold in 2015.
end
Finally the World Gold Council recognizes the increase in demand for gold from China. Still their figures are way off:
(courtesy Koos Jansen/GATA)
Koos Jansen: World Gold Council increases estimate of Chinese gold demand
11a GMT Friday, December 5, 2014
Dear Friend of GATA and Gold:
Bullion Star market analyst and GATA consultant Koos Jansen reports today that the World Gold Council has increased its estimate of China’s gold demand but still doesn’t come close to Jansen’s own calculations drawn from Chinese sources. Jansen’s commentary is headlined “World Gold Council Rectifies 2013 Chinese Gold Demand” and it’s posted at Bullion Star here:
https://www.bullionstar.com/blog/koos-jansen/world-gold-council-rectifie…
CHRIS POWELL, Secretary/Treasurer
Gold Anti-Trust Action Committee Inc.
end
your weekly commentary from Alasdair Macloed..
(courtesy Alasdair Macleod/goldmoney.com)
Commodities and the dollar
- By Alasdair Macleod
- Posted 05 December 2014
Each commodity market has its own story to tell: oil prices are falling because OPEC can’t agree production cuts, steel faces a glut from overcapacity, and even the price of maize has fallen, presumably because of good harvests.
In local currencies this is not so much the case. Of course, the difference between prices in local currencies and prices in US dollars is reflected in the weakness of most currencies against the dollar in the foreign exchange markets. This tells us that whatever is happening in each individual commodity and in each individual currency the common factor is the US dollar.
This is obvious perhaps, but the fall in commodity prices and the rise in the US dollar have to be seen in context. We should note that for most of the global population, the concern that we are facing global deflation (by which is commonly meant falling prices) is not yet true. Nor is a conclusion that the fall in the oil price indicates a sudden collapse in demand for energy. When the dollar price of oil began to slide, so did the exchange rates for all the other major currencies, confirming a significant part of oil’s price move came from dollar strength, which would have also been true of commodity prices generally.
All we can say is that on average there has been a shift of preferences towards holding dollars and away from holding commodities. Looked at in this light we can see that a trend of destocking can develop solely for financial rather than business reasons, because businesses which account in dollars face financial losses on excess inventory. It is the function of speculators to anticipate these decisions, which is what we have seen in recent months.
Macro-economists, who are Keynesian or monetarist by definition, are beginning to interpret falling commodity prices and a rising dollar as evidence of insufficient aggregate demand, which left unchecked will lead to deflation, increasing unemployment, bankruptcies, falling asset prices, and bank insolvencies. It is, they say, an outcome to be avoided at all costs by ensuring that aggregate demand is stimulated so that none of this happens.
Whether or not they are right in this assessment is not the point. They neglect to allow that some of the move in commodity prices is due to the currency itself as the numéraire of all prices.
For evidence of this we need look no further than the attitude of the Fed and every other central bank that targets price inflation as part of their monetary policy. In forming monetary policy there is no allowance for the possibility, nay likelihood, that in future there will be a change in preferences against the dollar, or any other currency for that matter, and in favour of anything else. The tragedy of this lack of market comprehension is that it’s a fair bet that monetary policy will not only succeed in limiting the rise of the dollar as it is designed to do, but end up undermining it when preferences shift the other way.
The moral of the story is that the Fed may be able to fool some of the people all of the time and all of the people some of the time, but worst of all they are fooling themselves. And we should bear in mind that dollar strength is only a trend which can easily reverse at any time.
end
Have some fun with this: Jim Willie and Rick Wiles:
Entertaining as always.
https://m.youtube.com/watch?v=fiHW4U7Ex64&feature=youtu.be
end
Author Willem Middelkoop, who wrote “THE BIG RESET.” …
http://www.amazon.com/The-Big-Reset-Financial-Endgame/dp/9089645993
just came out and stated in Belgium:
“According to media reports Belgium will start to repatriate foreign held gold reserves as well ..)
Willem nailed The Netherlands gold repatriate move before anyone else.”)
If this becomes a fact, I would bet an avalanche of gold repatriations would occur. Just think of the above:
Belgium, the HQ of the EU and they start to repatriate their gold??? It means that central banks just do not trust one another. I will keep you informed on the above!!
end
Just got this huge email from Koos Jansen this evening:
|
6:15 PM (9 minutes ago)
|
|
||
|
||||
Belgium Investigating To Repatriate All Gold Reserves
Just after I reported on the repatriation of 122.5 tonnes of gold by The Netherlands from the Federal Reserve Bank of New York (FRBNY) and about the Eurosystem allocating as much of its gold reserves as possible – a global run on gold which can only be seen in advance of a reform of the international monetary system, the next Eurosystem member that will repatriate gold has come forward, Belgium.

In Europe so far; Germany has been repatriating gold since 2012 from the US and France, The Netherlands has repatriated 122.5 tonnes a few weeks ago from the US, soon after Marine Le Pen, leader of the Front National party of France, penned an open letter to Christian Noyer, governor of the Bank of France, requesting that the country’s gold holdings be repatriated back to France, and now Belgium is making a move. Who’s next? And why are all these countries seemingly so nervous to get their gold ASAP on own soil?
VTM-nieuws has just reported the Belgium central bank has confirmed it’s investigating to repatriate all its gold reserves.
Our country is investigating to repatriate all our gold reserves. The Belgium central bank has confirmed this to VTM-nieuws.
This is all I could find for now. This post will be updated when more news comes in.
Koos Jansen
end
I will provide for you a snapshot in the morning and in the evening of the following:
Early morning Gold, Silver prices in their various currencies/Platinum and Palladium in USA dollars
7:52 am
|
|
Name
|
Bid
|
Ask
|
Change
|
%Change
|
High
|
Low
|
Time
|
Y %Change
|
52W High
|
52W Low
|
|||
|---|---|---|---|---|---|---|---|---|---|---|---|---|---|
|
Gold (USD)
|
 |
 alert.") |
1190.42
|
1190.80
|
-13.95
|
-1.16%
|
1207.58
|
1186.22
|
05-16:41:15
|
-1.20
|
1388.541
|
1130.02
|
|
|
Gold (GBP)
|
|
|
763.96
|
764.37
|
-4.54
|
-0.59%
|
771.62
|
758.95
|
05-16:41:16
|
5.02
|
836.118
|
712.956
|
|
|
Gold (CAD)
|
|
|
1361.77
|
1362.19
|
-9.71
|
-0.71%
|
1377.30
|
1356.09
|
05-16:40:49
|
6.46
|
1541.009
|
1258.418
|
|
|
Gold (AUD)
|
|
|
1429.87
|
1430.41
|
-6.18
|
-0.43%
|
1445.70
|
1425.33
|
05-16:41:19
|
5.92
|
1539.327
|
1316.747
|
|
|
Gold (INR)
|
|
|
73811.
|
73821.00
|
-632.7
|
-0.85%
|
74671.40
|
73476.20
|
05-16:42:00
|
-0.92
|
84912.7
|
69683.5
|
|
|
Gold (CHF)
|
|
|
1164.77
|
1165.28
|
-4.4
|
-0.38%
|
1174.02
|
1161.47
|
05-16:39:45
|
8.33
|
1212.132
|
1052.824
|
|
|
Gold (EUR)
|
|
|
968.89
|
969.32
|
-3.5
|
-0.36%
|
976.72
|
965.73
|
05-16:41:26
|
10.53
|
999.673
|
857.599
|
|
|
Gold (JPY)
|
|
|
144530.08
|
144589.22
|
246.56
|
0.17%
|
145653.27
|
143893.01
|
05-16:41:19
|
13.92
|
145360.095
|
123737.264
|
|
|
Gold (TRY)
|
|
|
2688.45
|
2691.98
|
-0.99
|
-0.04%
|
2706.15
|
2665.26
|
05-16:40:26
|
4.05
|
3103.045
|
2460.602
|
|
|
Palladium
|
|
|
798.1
|
804.10
|
3.78
|
0.48%
|
805.10
|
793.00
|
05-16:41:55
|
12.18
|
910.3
|
689.75
|
|
|
Platinum
|
|
|
1220.6
|
1224.30
|
-13.3
|
-1.08%
|
1238.30
|
1214.50
|
05-16:38:47
|
-10.77
|
1518.7
|
1174.75
|
|
|
Gold/Silver …
|
|
|
73.04
|
73.18
|
-0.12
|
-0.16%
|
73.63
|
72.81
|
05-16:39:23
|
18.15
|
78.5595
|
59.9678
|
|
|
Silver (USD)
|
|
|
16.28
|
16.29
|
-0.17
|
-1.06%
|
16.55
|
16.21
|
05-16:41:44
|
-16.14
|
22.179
|
14.651
|
|
|
Silver (GBP)
|
|
|
10.45
|
10.46
|
-0.05
|
-0.47%
|
10.55
|
10.37
|
05-16:41:46
|
-10.95
|
13.31137
|
9.38138
|
|
|
Silver (CAD)
|
|
|
18.62
|
18.64
|
-0.11
|
-0.61%
|
18.85
|
18.52
|
05-16:41:44
|
-9.74
|
24.6444
|
16.7731
|
|
|
Silver (AUD)
|
|
|
19.55
|
19.57
|
-0.06
|
-0.33%
|
19.76
|
19.47
|
05-16:41:45
|
-10.24
|
24.6792
|
17.3465
|
|
|
Silver (INR)
|
|
|
1007.9
|
1011.94
|
-7.3
|
-0.72%
|
1021.14
|
1003.23
|
05-16:41:00
|
-16.08
|
1372.68
|
811.72
|
|
|
Silver (CHF)
|
|
|
15.92
|
15.94
|
-0.05
|
-0.29%
|
16.09
|
15.85
|
05-16:37:25
|
-8.15
|
19.6772
|
14.17514
|
|
|
Silver (EUR)
|
|
|
13.24
|
13.27
|
-0.04
|
-0.29%
|
13.38
|
13.18
|
05-16:39:26
|
-6.24
|
16.122
|
11.77875
|
|
|
Silver (JPY)
|
|
|
1976.39
|
1978.42
|
5.44
|
0.28%
|
1994.07
|
1960.99
|
Early Friday morning trading from Europe/Asia
1. Stocks up on major Asian bourses with a lower yen value rising to 120.57 ( Moody’s lowering of its investment grade)
2 Nikkei up 33 points or 0.19%
3. Europe stocks all /Euro up/ USA dollar index up to 88.83./
3b Japan 10 year yield at .42% !!!!(Japan buying 100% of bond issuance)/Japanese yen vs usa cross now at 117.70
3c Nikkei now above 17,000
3fOil: WTI 66.29 Brent: 69.08 /all eyes are focusing on oil prices. A drop to the mid 60′s would cause major defaults.
3g/ Gold down/yen down;
3h/ Japan is to buy the equivalent of 108 billion usa dollars worth of bonds per MONTH or $1.3 trillion
Japan’s GDP equals 5 trillion usa/thus bond purchases of 26% of GDP
3i Japan to buy 100% of all new Japanese debt and by 2018 they will have 25% of all Japanese debt. Fifty percent of Japanese budget financed with debt (see Von Greyerz)
3j USA reports non farm payrolls
3k Japan loses battle in the defense of 120 yen to the dollar level
3l :Polls show Abe will win a landslide in his election bid Dec 14.2014
3m Gold at $1200 dollars/ Silver: $16.37
3n USA vs russian rouble: 53.68 (stronger against the dollar)
4. USA 10 yr treasury bond at 2.26% early this morning.
5. Details: Ransquawk, Bloomberg/Deutsceh bank Jim Reid
(courtesy zero hedge/your early morning trading from Asia and Europe)
Freefalling Yen Levitates Equities Around The World
Confused why in the lack of any horrible economic news (unless of course someone leaked a worse than expected November payrolls print which would put QE4 right back on the table) futures are higher, especially in the aftermath of yesterday’s disappointing ECB conference? Then look no further than the Yen which has now lost pretty much all control and is in freeplunge mode, rising some 25 pips moments ago on no news, but merely as wave after wave of momentum ignition algos now make a joke of the Japanese currency, whose “Panic Premium” line of 123 (as defined by SocGen) is now just 240 pips away. At this pace, Japan’s economy, which as reported yesterday has just seen a record number of corporate bankruptcies due to the plummeting yen, may well be dead some time next week. Which, with Paul Krugman as its new and improved economic advisor, is precisely as expected. RIP Japan.
The other main focus of today’s session stems from yesterday’s after-market ECB source report which suggested that the ECB are said to prepare broad based QE package in January. This, in addition to the freefalling yen, has helped equities to rebound (Euro Stoxx +1.4%) with out-performance in peripheral equities and fixed income products with peripheral spreads tighter to the German benchmark. Oddly enough, when Draghi spoke yesterday, the market’s reaction was diametrically opposite: one wonders how many BIS trading desks were need to turn sentiment around by 180 degrees. Both ECB’s Weidmann and Nowotny have been on the wires this morning, with Weidmann providing his usual hawkish stance and as such failing to move the market, while Nowotny modestly deviated from his usual hawkish stance by saying that he agrees with Draghi’s stance with regards to QE.
In FX markets, USD/JPY has been buoyed by stronger equities making a firm break of 120 trading at its highest levels since 2007. Polls also suggest that Japan’s LDP party may take a super majority which would further help the Abenomics QQE campaign. EUR/USD has traded sideways and GBP/USD has retraced its overnight losses.
WTI, Brent and Gold all trade slightly lower on a lack of any fundamental news and the USD index in small positive territory up +0.2%. More specifically for metals markets, Copper prices pared some of yesterday’s gains amid the subdued tone seen across commodity prices and Chinese iron ore futures also declined as steel mills and traders are said to be cautious on restocking due to oversupply in the market. Nickel prices are on track for a weekly gain of nearly 6% on continued support after Indonesia upheld its raw-ore export ban.
In terms of today’s calendar, we kick this morning off in Europe with the second estimate of Q3 GDP data for the Euro-area along with German factory orders and Spanish industrial output. Away from payrolls and employment data this afternoon in the US, we’ll also have the October trade report, factory orders and consumer credit. There’s also more Fedspeak to look out for with Mester (on financial stability) and Fischer (on fiscal policy) but payrolls will likely be the main focus for today.
In summary: European shares rise, close to intraday highs, with the construction and autos sectors outperforming and basic resources, oil & gas underperforming. Crude oil declines for fourth day. German factory orders ahead of ests., Bundesbank cut its economic forecasts for the country through 2016. The Italian and Spanish markets are the best- performing larger bourses, Swiss the worst. The euro is weaker against the dollar. Japanese 10yr bond yields fall; Greek yields decline. Commodities decline, with WTI crude, Brent crude underperforming and natural gas outperforming. U.S. factory orders, trade balance, consumer credit, nonfarm payrolls, unemployment, average earnings, labor force participation due later.
Market Wrap
- S&P 500 futures up 0.1% to 2073.8
- Stoxx 600 up 1.1% to 348.8
- US 10Yr yield up 2bps to 2.26%
- German 10Yr yield down 1bps to 0.76%
- MSCI Asia Pacific down 0.1% to 140.5
- Gold spot down 0.1% to $1204/oz
Bulletin Headline Summary
- European equities enter the North American crossover in the green following yesterday’s pro-QE ECB source comments, with peripheral fixed income products seeing outperformance.
- USD/JPY continues its uptrend as it extends its move above the 120.00 handle.
- Looking ahead, the market looks forward to US Non-Farm Payrolls, Unemployment Rate and Factory Orders with comments expected from ECB’s Visco (Soft Dove), Fed’s Mester (Soft Hawk) and Fed’s Fischer (Soft Dove)
- Treasuries decline before report forecast to show U.S. economy added 230k jobs in November with unemployment rate holding at 5.8%.
- ECB expects to consider a proposal for broad-based asset purchases including sovereign debt at the next meeting on Jan. 22, said two euro-area central-bank officials familiar with the deliberations
- At least three ECB officials, including board members Yves Mersch and Sabine Lautenschlaeger and Bundesbank’s Jens Weidmann, are said to have opposed Draghi’s statement yesterday that bank’s balance sheet “is intended to move toward the dimensions it had at the beginning of 2012”
- The Bundesbank halved its forecast for German GDP growth next year, predicting an expansion of 1% compared with its June outlook of 2%
- Weidmann, speaking in Frankfurt, it is not sensible to advocate German fiscal stimulus to revive euro-area economy; Euro-area governments have to take long, arduous reform path, must make sure “monetary policy doesn’t become instrument for other goals”
- China’s bad-loan ratio may have been understated by at least a third in the second quarter as an economic slowdown weakened borrowers’ ability to repay debts
- China President Xi Jinping says China economy is within reasonable range, the Xinhua News Agency reports, citing Xi speaking at a meeting on Dec. 1
- JPMorgan put another of its MBS traders on leave, the latest in a string of suspensions amid regulatory scrutiny of the market, according to three people with knowledge of the move
- Ex-UBS Group AG trader Roger Darin, facing U.S. charges of manipulating Libor, claims he’s in a “Kafkaesque situation” that bars him from working or leaving his home country of Switzerland.
- Sovereign yields mostly lower. Asian, European stocks, U.S. equity-index futures gain. Brent crude declines, gold little changed, copper rises
DB’s Jim Reid concludes the overnight summary
It was a case of “Thursday lunchtime’s alright for fighting” for the ECB yesterday. We discussed before the meeting that it was unlikely that they would deliver anything new yesterday but it’s quite clear that behind the scenes things are tense. As we said yesterday we would be reluctant to trade any disappointment themes as we think full QE is coming by the end of Q1 and that the market would/will soon appreciate that. In the 3 hours post the conference it seemed disappointment was the order of the day though. Even though he mentioned QE more times than ever before in his monthly grilling, the market still sold off during and after the press conference. However just as Europe was commuting home, Bloomberg carried a story that the ECB Governing Council “expects to consider a proposal for broad-based asset purchases including sovereign debt next month”. The source was “two euro-area central-bank officials familiar with the deliberations”. A conspiracy theorist might suggest that politically Draghi was always going to struggle to put such an explicit message across in the press conference at this stage and perhaps this story reflected the broader council’s view that someone wanted to articulate.
DB’s Mark Wall summed up yesterday’s meeting nicely with the title of his wrap-up being “friction on the path to inevitable QE”. For us the divide is evident when even the replacement of the word expectation with “intended” – with regards to returning the ECB balance sheet to 2012’s levels – was not unanimous. It seems like a lexicographer is needed these days at ECB meetings! However Draghi reiterated that important monetary policies had previously been put in place without unanimity so he does seem to be paving the pave for QE by majority if not by all. He also made the point of addressing legality concerns by saying that not pursuing the ECB’s primary legal mandate of price stability would be illegal.
So we can’t get away from the view that things are getting tense within the ECB. However at either the January 22nd meeting or the March 5th one, the ECB is likely to commence a broad-based asset purchase scheme whether everyone is behind it or not. The DB view has been that March is more likely but yesterday’s Bloomberg article means we can’t rule out January.
Looking at market reaction yesterday, the Stoxx 600 traded in a narrow range ahead of ECB but dropped as much as 0.7% as an initial reaction immediately following Draghi’s comments on ‘reassessing stimulus next quarter’ and was then compounded further following the central bank downgrades to inflation and growth expectations. The Stoxx600 closed the day 1.29% lower to post its biggest one-day fall since the October 15th sell-off. The Euro spiked to an intraday high of $1.246 (+1.20%) before settling at around $1.238 during the overnight session in Asia. Ten-year Bund yields initially dropped to an intraday low of 0.733% only to reach an intraday high of 0.785% before closing the day at around 0.773%. Xover closed 7bps wider in line with the softer risk tone in equities whilst the 10yr benchmark yields in Spain and Italy also widened by around 5-6bps on the day. So it was a fairly volatile day for European assets overall but US markets did rally back on the Bloomberg story after the European close.
Staying on the same theme the ECB now forecasts inflation of 0.5% for 2014 which is a touch lower from a previous forecast of 0.6% as recently as three months ago. Beyond this year the ECB expects inflation to be 0.7% and 1.3% in 2015 and 2016, respectively. Growth-wise, GDP expectations now sit at 0.8% for 2014, before recovering to 1% in 2015 and 1.5% in 2016. These are all lower than its September’s forecast of 0.9%, 1.6% and 1.9% for 2014, 2015, and 2016, respectively.
With much of yesterday’s focus being on Europe, it was easy to overlook the further decline in oil. Brent lost another -0.7% yesterday to close at a four year low of $69.43/bbl and has fallen slightly lower again in Asia overnight. WTI closed 0.85% lower at $66.8/bbl yesterday and has lost another 30cents during the overnight session. The US energy sector (-0.8%) posted its first decline this week likely as a reaction to these moves which added further pressure to the overall market. Both the S&P 500 (-0.12%) and the Dow (-0.07%) took a breather yesterday after having made new highs on Wednesday. Treasuries also had a softer day with the 10yr yield around 5bps higher to close at 2.234%. Data was relatively light for the region with just the initial jobless claims print which came in more or less in line with consensus at 297k although on the data front the key focus will be on the much anticipated payrolls today.
For the record, our US economists have a relatively bullish view on this and expect a headline print of 250k (vs 230k market consensus)) which would also mark a significant improvement from last month’s 214k. They noted that the recent strong employment components of the Richmond Fed services survey and non-manufacturing ISM should filter through to a better NFP reading. Unemployment and average hourly earnings will likely be the other highlights of today’s calendar and our colleagues are expecting an unchanged +5.8% unemployment print and a slight tick up in the average hourly earnings to +0.2% (from +0.1% previously) – both in line with the wider market.
Turning to overnight markets the risk tone is generally weaker in Asia following the European/US lead yesterday. Chinese equities are having a very choppy session with the Shanghai Composite falling as much as 3% during intraday but now up +1.7% as we type. Petrochina shares are up 10% (limit up) for the second day in a row. Away from China, HK equities are also enjoying a firm day. The Hang Seng and the HSCEI index are up +0.73% and +1.14% respectively as we type. Asian cash credits are broadly unchanged to a touch firmer across the board with China property bonds seeing some stabilisation after a fairly volatile few days. Technicals are generally robust with jumbo deals being well absorbed by the market.
Before we wrap up for the day, we note that the Russian Rouble weakened a further 2.4% against the Dollar yesterday to close at 54.45. The move comes on the back of comments from President Putin who vowed to punish speculators attacking the ruble with ‚harsh? measures in a defiant speech (Bloomberg). Russia’s 5y CDS widened by 7bps yesterday to 369, whilst the yield on the 10y (local) Government bond yield widened a further 27bps to close above 11% for the first time since 2009.
In terms of today’s calendar, we kick this morning off in Europe with the second estimate of Q3 GDP data for the Euro-area along with German factory orders and Spanish industrial output. Away from payrolls and employment data this afternoon in the US, we’ll also have the October trade report, factory orders and consumer credit. There’s also more Fedspeak to look out for with Mester (on financial stability) and Fischer (on fiscal policy) but payrolls will likely be the main focus for today.
Crashing Yen Leads To Record Number Of Japanese Bankruptcies
Last week, Zero Hedge first showed a chart so simple, even a Krugman could get it: at this point (and really ever since USDJPY 110 and higher), any incremental Yen devaluation is destructive for the Japanese economy, leading to an unprecedented surge in corporate bankruptcies and, ultimately, economic depression.

The obvious logic here led even the Keynesian studs at Goldman to declare that “Further yen depreciation could be a net burden.” Unfortunately for Abe and Kuroda, halting the Yen devaluation here would be suicide, as Japan now needs its currency to devalue every single day to mask the fact of the underlying economic devastation, or else the Japanese people may (and should) vote Abe out, which would lead to a prompt end to Abenomics, an epic collapse in the Nikkei, and put thousands of weak-Yen chasing Mrs. Watanabes in margin call purgatory.
Sadly, that will not happen. We say “sadly” because an end end to Abenomics, which is really Krugmanomics now, is the only thing that could save Japan now. And just to prove that, here is Japan Times confirming what we said, with a report that “Corporate bankruptcies linked to the yen’s slide hit a new record in November, highlighting the strains on small and midsize companies as Prime Minister Shinzo Abe campaigns for re-election on his deflation-busting economic strategy.”
Forty-two of the companies that failed in November cited the weakened currency as a contributing cause, bringing total bankruptcies associated with the yen so far this year to 301, almost triple that of the same period in 2013, according to a survey by Teikoku Databank Ltd.
It said surging costs of imported food, metals and construction materials are squeezing small companies.
The yen broke through 120 per dollar on Thursday in New York for the first time since 2007, as Abe’s handpicked Bank of Japan governor pumps a record amount of funds into the economy to stoke inflation.
…
“The business conditions for small and medium-size companies are severe,” said Norio Miyagawa, an economist at Mizuho Securities Co. “The more the yen weakens, the more the drawbacks will become evident, unless the benefits big companies are seeing spill over to consumption through an increase in wages.”
By region, the Kanto area including Tokyo accounted for 11 of the 42 bankruptcies, followed by eight each in the Chubu region around Nagoya and the Kinki region covering Osaka, and five in Hokkaido.
In the first 11 months of this year, the number of bankruptcies induced by the weak yen soared 2.7-fold from a year before to 301, including 75 in Tokyo, 39 in Osaka, 36 in Hokkaido and 35 in Aichi.
“While imported food and construction material prices have soared on the weakening yen, most small companies have failed to pass these hikes on to their product prices,” a Teikoku Databank official said.
As the yen continues to drop, the agency expects such bankruptcies to rise further. Since the Bank of Japan expanded its radical monetary easing program on Oct. 31, the dollar has strengthened by about ¥10.”
Not enough? Here is some more from Bloomberg:
Eight years ago, Isuzu Glass Co. was held up by Japan’s trade ministry as a star among the nation’s small manufacturers. Today, it’s bankrupt, a victim of the weak yen ushered in by Abenomics.
The maker of optical filter glass from the country’s industrial heartland in Osaka was one of a record number of corporate failures last month linked to the slumping currency, according to Teikoku Databank Ltd. Founded in 1905, Isuzu succumbed to a surge in costs of imported raw materials that is pinching many small businesses as Prime Minister Shinzo Abe tries to stoke inflation in the world’s third-biggest economy.
Forty-two of the companies that failed in November cited the yen’s drop as a contributor, bringing the total number of bankruptcies associated with the currency this year to 301, almost triple that of the same period in 2013, according to Teikoku Databank. Soaring costs of imported food, metals and construction materials squeezed small companies, it said.
“Business conditions for small and medium-sized companies are severe,” said Norio Miyagawa, an economist at Mizuho Securities Co. “The more the yen weakens, the more the drawbacks will become evident, unless the benefits big companies are seeing spill over to consumption through an increase in wages.”
They won’t, because the “big companies” realize one thing: the endgame of Keynesian economic devastation in Japan has arrived, and it is so simple a Keynesian caveman can do it.
end
Russia is having a tough time as the rouble hovers around 54 roubles to the dollar. Bond yields have now surpassed the 12% level
(courtesy zero hedge)
Russian Central Bank Intervention Is Losing Its Mojo, Bond Yields Crash Over 12%
The Bank of Russia this week made its heaviest currency intervention in more than a month, according to WSJ, to try to stem the escalating trend of Ruble collapse… but it’s not working. Chatter of three significant interventions this week (which are quite apparent in the USDRUB chart) have had less and less positive impact on the currency and even with warnings of jail for FX speculators, the post-intervention selling continues. It appears, however, that the main pressure today is in the Russian bond market as 10Y RUB Bonds cracked 80bps higher to 12.04% yield… the pressure mounts on Putin.
Central bank data showed Friday that it spent $1.9 billion to ease downward pressure on the ruble on Wednesday after selling $700 million on Monday.
The central bank eliminated regular interventions and let the ruble float freely in early November after the nearly $30 billion it spent from reserves failed to stop the ruble’s rapid depreciation in October. Despite the free-float policy, the central bank said it retains the right to intervene suddenly and at any level if it deems the country’s financial stability is threatened by the ruble rate.
On Thursday, President Vladimir Putin asked the central bank to save the ruble from falling. The central bank later warned it may open an investigation into the possible manipulation of the ruble, which has lost some 40% of its value against the dollar due to massive capital flight, sliding oil prices and Western sanctions.
Interventions having less and less impact…

as The Ruble tracks the price of oil almost perfectly off the highs…

One wonders if FX speculation warnings pushed speculators into the bond market….

Charts: Bloomberg
end
My goodness, Ukraine’s reserves have now dropped below 10 billion usa and they have no gold.
What happened to the dollars that entered Ukraine for the gold ???
(courtesy zero hedge)
Ukraine’s Reserves Plunge 20% In One Month, Drop Below $10 Billion To Lowest In A Decade
Things for Ukraine are going from bad to worse.
Following the revelation that Ukraine’s sovereign gold has mysteriously been Corzined, following a stunning admission by central bank governor Valeriya Gontareva on primetime TV that “in the vaults of the central bank there is almost no gold left. There is a small amount of gold bullion left, but it’s just 1% of reserves” which however left many questions unanswered and which led to prompt legal action against the central bank governor who isbeing charged with criminal abuse of power and misuse of office under Article 364 of the Criminal Code of Ukraine, one would think that at least Ukraine’s dollar reserves would have increased by a modestly proportional, if not market equivalent, amount.
Alas that is not the case.
As the central bank reported overnight, the country’s foreign-currency (and gold reserves) dropped by over 21% in one month, to under $10 billion in November for the first time in nearly a decade due to large payments for debt and gas, from $12.6 billion to $9.966 billion.
The reason for the drop per the CB:
- A reduction of $1.45 billion due to the need to remit a portion of funds that Naftogaz of Ukraine has set aside in a restricted account with the National Bank of Ukraine in order to settle gas bills and arrears with Gazprom OJSC for natural gas imported in November-December 2013 (it remains to be seen if Gazprom confirm receipt or if the funds were merely wired… somewhere).
- A reduction of $897 million due to repayment and service Ukraine’s foreign currency debt obligations, including the installment due to the IMF.
- Lastly, a reduction of $573 million as a resyult of intervention in the foreign exchange market.
As the WSJ comments, the bank’s announcement makes clear that the country is running out of the cash it needs to prop up the currency and pay back its debts, suggesting it needs more assistance from the West to avoid a default.
Ukraine’s coffers have emptied this year as its economy has shrunk and its national currency, the hryvnia, has lost around half its value against the U.S. dollar.
Ukrainian officials and analysts say Ukraine urgently needs a boost to its $17-billion lending program from the International Monetary Fund to prop up its finances. That comes amid a fresh push to stop the armed conflict with Russia-backed rebels after previous efforts have floundered.
And yet, as a result of recently souring relations between Ukraine and Europe, notably Germany, it is becoming increasingly unlikely that Europe which has major economic problems of its own, will be supporting the country which as we saw earlier this week, is well on its way to becoming the latest (vassal) state of the US, now that a US Citizen, Natalie Jaresko, has been appointed the country’s Finance Minister (which as we reported yesterday led to fights in the Ukraine parliament as the locals finally realize they got the short end of the stick in their negotiations with the US). Meaning it would be up to the US to continue providing the funding to keep the Ukraine US-puppet government going, in exchange for which the only quid-pro-quo remains a western backed army preventing aRussian onslaught in the Ukraine and, of course, providing Joe Biden’s son with a director seat on one of the biggest local energy companies. Surely, for national security reasons.
Meanwhile, as the civil war ravaged nation is about to enter the depths of winter, with its reserves evaporating at a torrid pace the next thing Ukraine’s tortured population has to look forward to is hyperinflation as its currency begins losing even more of what little value it has left: first slowly, and then all of a sudden.
Now if only Ukraine had some gold left to sell when the rainy days hit…
end
Oil closes below $66.00 a barrel WTI
WTI Crude Tumbles Back Below $66, Heads For Lowest Weekly Close Since July 2009
It appears the growth-is-back-just-look-at-the-jobs-number meme is not flowing through to the oil complex. WTI just broke below $66.00 (having earlier broken below and bounced back above) and is now down almost 1% on the week having retraced most of Monday’s kneejerk dead-cat-bounce. This will be the lowest weekly close since July 2009 and down 9 of the last 10 weeks.
From surging dead-cat-bounce to slow death…

To the lowest weekly close since July 2009…

But don’t worry, The White House says
- *FURMAN SAYS MOST U.S. OIL PROFITABLE AT CURRENT PRICES: CNBC
Which is just a lie…

Charts: Bloomberg
end
The low price of oil is causing havoc in the high yield oil sector:
(courtesy zero hedge)
Energy Bond Crash Contagion Suggests Oil Will Stay Lower For Longer
When we first explained to the public here, that the excessive leverage and currently squeezed cashflow of many US oil producers could “trigger a broader high-yield market default cycle,” the world’s smartest TV-anchors shrugged off lower oil prices as ‘unequivocally good’ for all. Now, as a 40% collapse in new well permitsand liquidations occurring at the well-head, the world outside of credit markets is starting to comprehend the seriousness of the crash of a sector that was responsible for 93% of jobs created in this ‘recovery’.

The credit risk of HY energy corporates has more than doubled to a record 815bps (over risk-free-rates) crushing any hopes of cheap funding/rolling debt loads.Suddenly expectations of 1/3rd of energy firms restructuring is not so crazy…
The chart above suggests another problem for hopers… credit markets – the most sensitive to cashflows at this stage – are signalling either prices have considerably further to fall or will remain at these thinly-profitable-if-at-all prices for considerably longer…
* * *
There is a bigger problem though. As the following chart shows, there is clear ‘selling’ of high-yield bonds (and some hedging) which has crushed the most-liquid (HYG ETF) instrument for actual yield risk.

In other words, there is contagion and managers are rotating from protection to selling and reducing exposure.
Charts: Bloomberg
end
Eur/USA 1.2351 down .0034
USA/JAPAN YEN 120.57 up .792
GBP/USA 1.5689 up .0100
USA/CAN 1.1404 up .0023
This morning in Europe, the euro is up, trading now well below the 1.24 level at 1.2351 as Europe reacts to deflation and announcements of massive stimulation. In Japan Abe went all in with Abenomics with another round of QE purchasing 80 trillion yen from 70 trillion on Oct 31. And now he wishes to give gift cards to poor people in order to spend. The yen continues to deteriorate like a rotten banana. It finally settled in Japan down 80 basis points and settling now well above the 120 barrier to 120.57 yen to the dollar (heading towards 123). The pound is up this morning as it now trades just below the 1.57 level at 1.5689.(very worried about the health of Barclays Bank and the FX/precious metals criminal investigation). The Canadian dollar is down today trading at 1.1404 to the dollar.
Early Friday morning USA 10 year bond yield: 2.26% !!! down 2 in basis points from Thursday night/
USA dollar index early Friday morning: 88.83 up 13 cents from Thursday’s close
The NIKKEI: Friday morning up 33 points or 0.19% (Abe’s helicopter route to provide free cash)
Trading from Europe and Asia:
1. Europe all in the green
2/ Asian bourses all in the green except Australia and India Chinese bourses: Hang Sang in the green, Shanghai in the green, Australia in the red: /Nikkei (Japan) green/India’s Sensex in the red/
Gold early morning trading: $1200.00
silver:$16.38
Closing Portuguese 10 year bond yield: 2.75% down 5 in basis points from Thursday
Closing Japanese 10 year bond yield: .42% !!! down 2 in basis points from Thursday
Your closing Spanish 10 year government bond Friday down 6 in basis points in yield from Thursday night.
Spanish 10 year bond yield: 1.83% !!!!!!
Your Friday closing Italian 10 year bond yield: 1.98% down 6 in basis points from Thursday:
trading 15 basis points higher than Spain:
IMPORTANT CLOSES FOR TODAY
Closing currency crosses for Friday night/USA dollar index/USA 10 yr bond:
Euro/USA: 1.2292 down .0093
USA/Japan: 121.31 up 1.59
Great Britain/USA: 1.5584 down .0093
USA/Canada: 1.1430 up .0040
The euro fell badly in value during this afternoon’s session, and it is down by closing time , finishing just below the 1.23 level to 1.2292. The yen was down miserably during the afternoon session, and it was down 159 basis points on the day closing well above the 121 cross at 121.39. The British pound lost some ground during the afternoon session and it was down on the day closing at 1.5584. The Canadian dollar was well down in the afternoon and was down on the day at 1.1430 to the dollar.
Currency wars at their finest today.
Your closing USA dollar index: 89.33 up 62 cents from Thursday.
your 10 year USA bond yield , up 4 in basis points on the day: 2.31%!!!!
European and Dow Jones stock index closes:
England FTSE up 63.47 or 0.95%
Paris CAC up 95.59 or 2.21%
German Dax up 235.77 or 2.39%
Spain’s Ibex up 280.80 or 2.64%
Italian FTSE-MIB down 662.85 or 3.41%
The Dow: up 58.69 or .07%
Nasdaq; up 11.32 or .17%
OIL: WTI 65.84 !!!!!!!
Brent: 69.07!!!!
end
And now for your big USA stories
Today’s NY trading:
Third Hindenburg Spotted In Best Week For Silver Since June, Crude Crucified
High-yield credit markets saw spreads widen 12bps on the week and high-yield bond prices fell notably as energy stocks faded after Monday’s exuberant dead-cat-bounce. Trannies tumbled today off early exuberance gains, ending the week the biggest loser despite lower oil prices. Today’s jobs data sparked initial “good news is bad news” weakness, was ramped to Europe’s close then faded with Nasdaq and S&P red post-Payrolls. Treasury yields rose on the day (and week) with dramatic flattening as 2Y-7Y maturities up 17-20bps on the week and 30Y only 7bps higher. 2Y yields exploded 17bps for the worst week since Feb 2011 to Apr 2011 highs. The USDollar closed higher today (up 1.25% on the week) led by dramatic JPY weakness (and EUR fading). Despite USD strength, gold gained 2% on the week and silver +5.4% (best week in 6mo)even as oil lost 0.75% for its lowest close since July 2009. VIX tested down to an 11 handle but closed peeking back into a 12 handle, lower on the week. For the 3rd day of the last 4, internals created a Hindenburg Omen cluster.
Hindenburg Omen cluster is building… 3rd in 4 days

US equity markets (futures) post-payrolls…

The Dow tried to get to 18,000 to prove jobs data was awesome-tastic… but could only manage 17,991.19… as we closed there was the ubiquitous ‘fat finger’ to try and slam the close

On the day session, early gains faded quick after Europe closed… but as soon as the S&P crossed red the ramp efforts began with VIX

Leaving Trannies and Nasdaq down on the week…

HY credit notably underperformed…

On the week, Treasury yields are notably higher with signficant flattening…

5Y yield rose most in 9 months today and had their biggest week since Aug 2013

And 2Y Yields exploded on the week…

The USDollar gained 1.25% on the week, led by JPY weakness and EUR fading…

And Despite the USD strength gold and silver surged and oil faded… (gold’s best week in 2 months, silver’s best in 6 months, oil down 9 of last 10 weeks)

WTI’s week was all about the bounce and fade…

Charts: Bloomberg
Bonus Chart: Energy Sector High Yield Bond risk exploded…

end
Today the USA released its job report and the fudging was in high gear.
The USA supposedly added 321,000 new jobs in November, yet the “unemployment” rate remained at 5.%
(courtesy zero hedge)
US Adds 321K Jobs In November, Most Since 2012, Unemployment Rate Remains At 5.8%
If the Fed needed a flashing red light that the time for a first rate hike is overdue, it just got it moments ago when the BLS reported that in November some 321K jobs were added, a 4 sigma beat to the 230K expected, and well above the revised 243K in October. In fact, this was the biggest monthly jobs addition since January 2012!

From the report:
Total nonfarm payroll employment rose by 321,000 in November, compared with an average monthly gain of 224,000 over the prior 12 months. In November, job growth was widespread, led by gains in professional and business services, retail trade, health care, and manufacturing. (See table B-1.)
Employment in professional and business services increased by 86,000 in November, compared with an average gain of 57,000 per month over the prior 12 months. Within the industry, accounting and bookkeeping services added 16,000 jobs in November. Employment continued to trend up in temporary help services (+23,000), management and technical consulting services (+7,000), computer systems design and related services (+7,000), and architectural and engineering services (+5,000).
Employment in retail trade rose by 50,000 in November, compared with an average gain of 22,000 per month over the prior 12 months. In November, job gains occurred in motor vehicle and parts dealers (+11,000); clothing and accessories stores (+11,000); sporting goods, hobby, book, and music stores (+9,000); and nonstore retailers (+6,000).
Health care added 29,000 jobs over the month. Employment continued to trend up in offices of physicians (+7,000), home health care services (+5,000), outpatient care centers (+4,000), and hospitals (+4,000). Over the past 12 months, employment in health care has increased by 261,000.
In November, manufacturing added 28,000 jobs. Durable goods manufacturers accounted for 17,000 of the increase, with small gains in most of the component industries. Employment in nondurable goods increased by 11,000, with plastics and rubber products (+7,000) accounting for most of the gain. Over the year, manufacturing has added 171,000 jobs, largely in durable goods.
Financial activities added 20,000 jobs in November, with half of the gain in insurance carriers and related activities. Over the past year, insurance has contributed 70,000 jobs to the overall employment gain of 114,000 in financial activities.
Transportation and warehousing employment increased by 17,000 in November, with a gain in couriers and messengers (+5,000). Over the past 12 months, transportation and warehousing has added 143,000 jobs.
Employment in food services and drinking places continued to trend up in November (+27,000) and has increased by 321,000 over the year.
The other notable thing: despite a sharp slowdown in actual wage indicators in recent weeks, the BLS also decided that in November average hourly earnings rose 0.4%, double the 0.2% expected, and up from 0.1% previously. In fact, the Additionally, the average weekly earnings increase of 2.4% is now the biggest since August of 2013. We hope someone out there believes this data point.

Where The Jobs Were: Secretaries, Waiters, Retail, Education, Leisure And Temp-Help
Curious just what the “quality” of jobs that comprised the best jobs report in nearly 3 years? Here is the answer: Retail Trade, Education and Health, and Leisure and Hospitality, as well as Administrative Assistants, cumulatively made up more than half of the jobs gains in the month. All minimum-wage or just above paying jobs. Which is why anyone who believes that wages rose at the rate the BLS would like you to believe, may want to wait until the inevitable downward revision.
The breakdown of the top job categories:
- Professional Services excluding temp help: +63K, of which administative assistants +12K, bookkeepers +16.4K
- Retail Trade: +50K
- Leisure and Hospitality: +38K, of which waiters and bartenders +26.5K
- Manufacturing: +28K
- Temp Help: +22.7K
And visually:

US Factory Orders Tumble, Miss By Most Since January
But, but, but payrolls data was awesome!! US Factory Orders tumbled 0.7% in October (missing 0.0% expectations) for the 3rd month in a row (for the first time since June 2012). Rather notably, the only other time we had 3 straight months of factory orders declines was in the recession and the 2012 decline was saved by QE3. The data was ugly across the board: Non-durable orders -1.5%, non-defense, ex-air tumbled 1.6%, and inventories-to-shipments levels are at the year’s highs. More problematically for GDP enthusiasts, October inventories of manufactured nondurable goods decreased 0.5% to $249.0 billion driven by petroleum and coal products (but wait lower oil prices are unequivocally good right?)
Factory Orders dropped for the 3rd month in a row…

Charts: Bloomberg
end
The flattening of the yield curve means recession is upon us:
(courtesy zero hedge)
Treasury Yield Curve Flattens Dramatically, Below Lehman Levels
The reaction to today’s blockbuster noise-ridden jobs data is muted in stocks but bonds are sending some complicated and uncomfortable signals. 2Y yields are 6-7bps higher and 30Y yield are now unchanged (havingbeen 4-5bps higher) as the market prices in short-term Fed action and the implicit medium-term economic weakness expected. This 6-7bps flattening of the 2s30s curve has crushed the spread to 234bps – below levels seen as Lehman failed and near Summer 2012’s cycle lows. But we are sure 2015 will be the year that rates rise… right?
The post-payrolls reaction…

and the crushing blow to the yield curve…

Charts: Bloomberg
end
The only increase in credit is from student loans and car loans. Consumer credit growth grinds to a halt;
(courtesy zero hedge)
Consumer Credit Growth Misses For 3rd Month, Credit Card Debt Trickles To A Halt
For the 3rd month in a row, Consumer Credit growth rose less than expected. At $13.226 billion (against expectations of a $16.5bn gain), this is the smallest growth since Nov 2013. This is the first 3-month miss since June 2009. Once again, as expected, the rise is practically entirely due to student and auto loans (which now face 27% delinquency for the subprime borrowers) which rose by $12.3 billion, or 93% of the total.
First 3 month miss since June 2009

However, perhaps the most notable facet is a 66% collapse in revolving credit growth from a year ago. As the chart below shows, total revolving credit rose by just $922 million in October: this was two-thirds less than the $2.8 billion increase in revolving credit a year ago, and is the second lowest increase in revolving credit in the past 8 months.

As for sources of consumer credit, well… this one is self-explanatory.

end
US trade deficit drops to $43.4 billion in October with oil imports falling to 5-year low
Associated Press Dec. 5, 2014 | 8:36 a.m. EST + More
By MARTIN CRUTSINGER, AP Economics Writer
WASHINGTON (AP) — The U.S. trade deficit fell slightly in October as exports rebounded while oil imports dipped to the lowest level in five years.
The Commerce Department says the deficit edged down 0.4 percent to $43.4 billion, down from a revised $43.6 billion in September.
Exports climbed 1.2 percent to $197.5 billion, recovering after a September dip. Imports were up as well, rising 0.9 percent to $241 billion but that increase was held back by a 0.6 percent fall in imports of petroleum, which dropped to the lowest level since November 2009. The average price of a barrel of oil dipped to $88.47, the lowest point since February 2011.
Through October, the deficit is running 4.8 percent below the same period in 2013. A lower deficit provides a boost to economic growth
-END-
That is all for today
I will see you Monday night
bye for now
Harvey,


