
Gold: $1073.10 down $3.20 (comex closing time)
Silver $14.09 par
In the access market 5:15 pm
Gold $1071.50
Silver: $14.13
At the gold comex today, we had an extremely poor delivery day, registering 0 notices for nil ounces. And this is the biggest delivery month of the year for gold? Silver saw 1 notice for 5,000 oz.
Several months ago the comex had 303 tonnes of total gold. Today, the total inventory rests at 196.44 tonnes for a loss of 106 tonnes over that period.
In silver, the open interest rose by a smallish 8 contracts as silver was par in price with respect to Wednesday’s trading. The total silver OI now rests at 162,766 contracts In ounces, the OI is still represented by .813 billion oz or 116% of annual global silver production (ex Russia ex China).
In silver we had 1 notice served upon for 5,000 oz.
In gold, the total comex gold OI fell by a small 10 contracts as the OI fell to 394,118 contracts as gold was par in price with respect to Wednesday’s trading.
We had no changes in gold inventory at the GLD, / thus the inventory rests tonight at 634.63 tonnes. The appetite for gold coming from China is depleting not only gold from the LBMA and GLD but also the comex is bleeding gold. Our 670 tonnes of rock bottom inventory in GLD gold has been broken. It looks to me that China has taken the last amounts of physical gold from the GLD. I guess the only place left for China to receive physical gold, after they deplete the GLD will be the FRBNY and the comex. In silver, we had no change in silver inventory at the SLV/Inventory rests at 321.507 million oz
First, here is an outline of what will be discussed tonight:
1. Today, we had the open interest in silver rise by 8 contracts up to 162,766 as silver was at par with respect to Wednesday’s trading. The total OI for gold fell by 10 contracts to 394,118 contracts as gold was par in price with respect to yesterday’s trading.
(report Harvey)
2 a) Gold trading overnight, Goldcore
(Mark OByrne)
3. ASIAN AFFAIRS
i) Last night, 9:30 pm WEDNESDAY night, THURSDAY morning Shanghai time. Japan Nikkei closed down by 254.52 POINTS OR 1.32%, Shanghai finishes barely in the red / Hang Sang falls,Australia falls. Oil retreats a touch. China devalues their yuan again by the most in quite some time
ii) Looks like we have another big Chinese executive disappear or “disappeared”
i)Looks to us that China is warning Turkey and the USA on the sanctity of Iraq’s sovereignty:
ii) Last night, Iran backed Shia forces are threatening Turkey over it’s incursion into Iraq.
iii) Today the USA wants to send attack helicopters to take the key city of Ramadi. The problem is the Iraqi government does not want the USA in there.
iv) Michael Snyder reports on the truth behind the ISIS oil being shipped through Turkey with the help of the Erdogan family
v) Somebody big as blown up. Now Third Avenue Hedge Fund has blocked redemptions stating illiquidity and investors will be hurt if they liquidate now( zero hedge)
( zero hedge)
ii) ConocoPhillips cuts its capex amid the oil price decline. As David Stockman states in his commentary last night, we have a cap ex depression:(courtesy zero hedge/ConocoPhillips)
iii) The low price of oil causes Alaska to reintroduce a personal income tax for the first time in 35 years:
( zero hedge)
ii) It looks like they found the originator of bitcoin in Sydney, Australia. The tax department believes that bitcoin is not a currency and want their share of Wright’s gains(courtesy Reuters/GATA)
iii) SteveForbes, of Fortune Magazine describes how gold can be useful in a gold standard:
(Steve Forbes/Forbes.com/GATA)
iv) Bron Suchecki’s comments on the huge increase in gold demand from China and how they are “increasing” their official reserves
(Bron Suchecki/Perth Mint/GATA)
v) a) Alasdair Macleod talks about a scheme by former chief economist for the IMF, Rajan, whose job it was to rein in the demand for gold by its citizens. It then orchestrated a ludicrous paper gold for real gold confiscation. It never worked in the past and it will never work in the future.
(Alasdair Macleod/GoldMoney)
b)And here is evidence of its complete failure:
( Foss/Mises.Org)
vi) The yuan gold fix is delayed until April/no reason given
i) Today import price index report from the BLS showed a little improvement by declining .4% instead of the expected .8% and this was mainly due to oil and other goods shipped from China. As David Stockman explains (below) we are in a cap ex depression and it will be almost impossible for the globe to escape deflation’s massive fangs:
iii) Evidence suggests that the banks are buying credit default protection against a failure of another bank. This happened 8 years ago and seems to be another Lehman rerun:
iv) Dave Kranzler on Monday and Tuesday talked about the mess at Kinder Morgan. Now David Stockman lays it out in easy to see fashion how these guys are going to fail
a must read…
(courtesy David Stockman)
vi) Another must read from David Stockman. He states that the huge deflation imported from China et al will cause a massive damage to the entire global economic scene. We will have a cap ex depression as the 9 trillion USA short positions unwind and all of those commodities are hurled at us at any price. It will not be a pretty scenario. Stockman also states this:
The hissy fit will happen because the Fed’s words and actions starting next week will not say “we have your back, keep buying”.
The message will be “we are lost and you are on your own”.
this was known as the Bernanke and Yellen put. From next week on, the Fed does not have the bankers back.
( David Stockman/ContraCorner)
Let us head over to the comex:
The total gold comex open interest fell to 394118 for a loss of 10 contracts as gold was par in price with respect to yesterday’s trading. For the past two years, we have strangely witnessed two interesting developments with respect to the gold open interest: 1) total gold comex collapse in OI as we enter an active delivery month, and 2) a continual drop in the amount of gold standing in an active month. Today, the boys did it again as OI for the front month fell despite no issuance of paper as both of the above scenarios continued in earnest. We are now in the big December contract which saw it’s OI fall by 268 contracts from 2276 down to 2008. We had 33 notices filed upon yesterday, so we lost 235 contracts or an additional 23,500 oz of gold that will not stand for delivery in this active delivery month of December. The next contract month of January saw it’s OI fall by 20 contracts up to 638. The next big active delivery month is February and here the OI fell by 258 contracts down to 282,569. The estimated volume today (which is just comex sales during regular business hours of 8:20 until 1:30 pm est) was 110,239 which is poor. The confirmed volume yesterday (which includes the volume during regular business hours + access market sales the previous day was also poor at 147,282 contracts.
December contract month:
INITIAL standings for DECEMBER
Dec 10/2015
| Gold |
Ounces
|
| Withdrawals from Dealers Inventory in oz | nil |
| Withdrawals from Customer Inventory in oz nil | nil |
| Deposits to the Dealer Inventory in oz | nil |
| Deposits to the Customer Inventory, in oz | nil |
| No of oz served (contracts) today | 0 contracts
nil oz |
| No of oz to be served (notices) | 2008 contracts
(200,800 oz) |
| Total monthly oz gold served (contracts) so far this month | 244 contracts(24,400 oz) |
| Total accumulative withdrawals of gold from the Dealers inventory this month | nil |
| Total accumulative withdrawal of gold from the Customer inventory this month | 154,487.3 oz |
Total customer deposits nil oz
DECEMBER INITIAL standings/
Dec 10/2015:
| Silver |
Ounces
|
| Withdrawals from Dealers Inventory | nil |
| Withdrawals from Customer Inventory | 522,685.095 oz
(CNT,HSBC), |
| Deposits to the Dealer Inventory | nil |
| Deposits to the Customer Inventory | 599,485.600 oz
jpm |
| No of oz served today (contracts) | 1 contract
5,000 oz |
| No of oz to be served (notices) | 380 contracts
(1,900,000 oz) |
| Total monthly oz silver served (contracts) | 3515 contracts (17,575,000 oz) |
| Total accumulative withdrawal of silver from the Dealers inventory this month | nil oz |
| Total accumulative withdrawal of silver from the Customer inventory this month | 2,890,091.3 oz |
Today, we had 0 deposit into the dealer account:
total dealer deposit; nil oz
we had no dealer withdrawals:
total dealer withdrawals: nil
we had 1 customer deposit:
i) Into JPMorgan: 599,485.600 oz
total customer deposits: 599,485.600 oz
total withdrawals from customer account: 522,685.095 oz
And now the Gold inventory at the GLD:
Dec 10.2015/no change in gold inventory at the GLD/inventory rests at 634.63 tonnes
DEC 9/no change in gold inventory at the GLD/inventory rests at 634.63 tonnes
Dec 8/ no change in gold inventory at the GLD/inventory rests at 634.63 tonnes
Dec 7/another huge withdrawal of 4.23 tonnes of gold/inventory rests at 634.63 tonnes
Dec 4/no change in gold inventory at the GLD/Inventory rests this weekend at 638.80
Dec 3/ a massive withdrawal of 16.oo tonnes of gold heading straight to Shanghai/tonnage rests tonight at 638.80 tonnes
Dec 2.2015: no change in gold inventory at the GLD/inventory rests at 654.80 tonnes
Nov 30/no change in silver inventory at the SLV/Inventory rests at 318.209 million oz
end
And now your overnight trading in gold and also physical stories that may interest you:
Screaming Fundamentals For Owning Gold Bullion
We’re at a moment of historic opportunity.
By Chris Martenson
Every year or two we update this report which lays out the investment thesis for gold. Here is this year’s version.
Silver is touched upon only as necessary; as a separate report of equal scope is required for that precious metal.
Gold is one of the few investments that every investor should have in their portfolio.
We are now at the dangerous end-game period of a very bold but very reckless & disappointing experiment with the world’s fiat (unbacked) currencies. If this experiment fails – and we observe it’s in the process of failing – gold will provide one of the best forms of wealth insurance. But like all insurance products, it only works if you buy it before you need to rely on it.

Read more on the “The Screaming Fundamentals For Owning Gold” from Chris Martenson.
DAILY PRICES
Today’s Gold Prices: USD 1072.00, EUR 979.44 and GBP 706.40 per ounce.
Yesterday’s Gold Prices: USD 1078.40, EUR 985.60 and GBP 715.38 per ounce.
(LBMA AM)

Gold in GBP – 1o Years
Gold lost $1.90 yesterday to close at $1072.70. Silver was down a cent, closing at $14.15. Platinum gained $13 to $854.
Gold Bars At 2% Premium and Free Storage For Six Months On Orders Before December 31st
- 2016 looks set to be stormy – arguably it has never been a better time to buy gold
- Gold bars (1 oz, LBMA) at just 2% on orders placed prior to December 31st
- One of lowest premiums in market today for one ounce bullion coins and bars
- Currently sell gold bars (1 oz) at 3.75% so this is nearly 50% reduction in premium
- Free storage for six months – allocated and segregated storage of your bars in safest vaults in world * This is a phone offer only ** A minimum order of 5 gold bars applies
*** Gold coins and bars are tax free – no stamp duty, VAT or sales taxCall Us Today To Secure Your Allocation
IRL +353 (0)1 632 5010
UK +44 (0)203 086 9200
US +1 (302) 635 1160
end
Jessie explains what is going on with respect to the eligible gold (customer) and registered gold at the comex (dealer)
(courtesy Jessie/American cafe)
Gold Daily and Silver Weekly Charts – Until Confidence Is Restored

Surprisingly, to some, the economic news continues to show a marked lack of vitality.
In particular, wholesale inventories showed an actual decline, with the prior figure being revised sharply downwards as well. This does not bode well for 4Q GDP.
I have included the particulars in the evening stock markets report.
There are jobs to be had, if you like part time work with few benefits at a poverty level wage. Granted the fortunate few are doing very well. As it has been for quite some time.
The paper asset markets in bonds and stocks are edgy as they think that the Fed will raise next week, without regard to what is happening domestically and in the rest of the world, unless an unavoidable meltdown starts to manifest overseas that cannot be ignored.
At this point, the Fed seems to be so ensnared in the credibility trap that they cannot readily acknowledge the state of the real economy. QE is an unmitigated fiasco, if not a tragic misappropriation of balance sheet flexibility which may be sorely missed in the future.
They must seemingly push on, and raise rates to provide policy room for the cuts to come when their latest paper asset bubble collapses. Meanwhile, the financiers and thought leaders ignore this, burying their heads in the sands of detailed diversions and gettin’ paid.
But, alas, belief in The Recovery™ is flagging among the broader public and those who have a mind to think independently as the economic statistics continue to show it to be wishful thinking. People can only suspend belief in what they see with their own eyes for so long, unless of course their perks and paychecks depend on it.

Speaking of ignoring things, the uncurious reaction by some to the odd happenings in the gold market is similarly puzzling.
Is this huge decline in registered gold compared to open interest and total gold in the warehouses nothing new or notable? This has not happened to this degree before that I can find, and certainly not since the turn of the century.
As a reminder, ‘eligible’ gold is that which has been accepted by a licensed facility as being in a form and purity in accordance with the Nymex rules. That is all that it means. Someone owns it and is storing it in a licensed warehouse facility.
And ‘registered’ means that a warrant is attached to that gold, which is a prerequisite for a public sale on the exchange, that is, one in which the terms of the sale are fully disclosed and transparent.
The warrant is held in the name of a dealer, and not in the name of the owner or customer. This is to facilitate its transfer in a delivery. I tend to think of it as roughly analogous to a broker holding one’s stock in ‘street name.’ Maybe this is not precise, but it certainly seems to fit.
One might look at the trends in the data and conclude that they suggest that the gold that remains in the licensed facilities in New York is held for the most part in strong hands, who are not inclined to sell it at these prices.
The ‘all is well’ crowd likes to point to all the gold in the warehouses, including the eligible bullion that is privately held saying, ‘see there is plenty of gold, and we are well-supplied.’ Except of course that the gold does not belong to the exchange or anyone else except for the owner. And there is a less than usual indication that it is for sale, even to the extent of having a simple warrant for a sale attached to it that is easy to obtain and costs almost nothing.

I am not suggesting that there will be a ‘default’ in New York. It has already become a nearly virtual trading place for synthetic gold claims, rather than for the exchange of bullion between buyers and sellers.
And the rules on what one might obtain in a crunch are remarkably kind to those who have the greatest influence, positions with the exchange, and the largest teams of lawyers.
But increasingly it is starting to look like a game of musical chairs, of borrowing from Peter to pay Paul. .
And even though the warrants do not expire, and do not compel one to ‘sell’ I can see why someone would not wish their gold to be held in some other financial organization’s name, no matter how convenient that might seem. Maybe that is the reason for this.
I notice that JPM has been accumulating gold again for its house account, and I suspect they will be ready to perform the role of key ‘stopper’ should there be any large amounts standing for delivery as this active month of December unwinds. They did step in and supply the big demand in the last active month which we had.
Is this sustainable? Is anyone looking closely at this and what is happening on these exchanges?
Have a pleasant evening.
China said to delay launch of yuan gold benchmark to April
Submitted by cpowell on Thu, 2015-12-10 18:28. Section: Daily Dispatches
From Reuters
via The Times of India, Mumbai
Thursday, December 10, 2015
SINGAPORE — China has delayed the launch of its yuan-denominated gold benchmark on the Shanghai Gold Exchange to next year, two sources familiar with the matter said.
The yuan price fix would mark one of China’s biggest steps so far towards capitalizing on its position as the world’s top producer and consumer of gold. State-run SGE had initially planned to launch the benchmark by the end of this year but it will now be launched in April.
The reason for the delay was not immediately clear. The exchange was without a chairman for nearly six months before it named a central bank official as the head of the bourse in late October.
“It will start in April with Chinese banks and some foreign banks,” said a source with a local bank that imports gold. “Jewellers, miners, and banks could use this price as a benchmark.” …
… For the remainder of the report:
http://economictimes.indiatimes.com/news/economy/policy/china-to-launch-…
end
It looks like they found the originator of bitcoin in Sydney, Australia. The tax department believes that bitcoin is not a currency and want their share of Wright’s gains
(courtesy Reuters/GATA)
Australian police raid Sydney home of reported bitcoin creator
Submitted by cpowell on Wed, 2015-12-09 13:45. Section: Daily Dispatches
By Byron Kaye and Colin Packham
Reuters
Wednesday, December 9, 2015
SYDNEY, Australia — Australian police raided Wednesday the Sydney home and office of a man named by Wired magazine as the probable creator of bitcoin and holder of hundreds of millions of dollars worth of the cryptocurrency, Reuters witnesses said.
More than a dozen federal police officers entered a house registered on the electoral roll to Craig Steven Wright, whom Wired outed as the likely real identity of Satoshi Nakamoto, the pseudonymous figure that first released bitcoin’s code in 2009.
Locksmiths broke open the door of the property, in a suburb on Sydney’s north shore. When asked what they were doing, one officer told a Reuters reporter they were “clearing the house.” …
… For the remainder of the report:
http://www.reuters.com/article/us-australia-bitcoin-exclusive-idUSKBN0TS…
end
Forbes describes how gold can be useful in a gold standard:
(Steve Forbes/Forbes.com/GATA)
Steve Forbes: The New York Times’ leaden analysis of gold
Submitted by cpowell on Wed, 2015-12-09 16:28. Section: Daily Dispatches
By Steve Forbes
Forbes.com
Wednesday, December 9, 2015
The New York Times recently ran an article trashing the idea of a return to a gold standard:
http://www.gata.org/node/15986
A growing number of Republicans, including presidential hopeful Sen. Ted Cruz, advocate fixing the value of the dollar to gold.
If the purpose of the Times story was to discredit such a possibility before it gained any more momentum, it failed. The piece is actually useful in that it encapsulates some of the egregious myths, misunderstandings and just plain ignorance of what a gold standard is all about.
The purpose of a gold standard is to ensure that a currency has a fixed value, just as measures of time, weight, and distance are fixed. We don’t “float” the number of minutes in an hour or inches in a foot. Yet, strangely, economists believe that constantly changing the value of a currency is good for growth. ...
… For the remainder of the commentary:
http://www.forbes.com/sites/steveforbes/2015/12/09/the-new-york-times-le…
end
(courtesy Bron Suchecki/Perth Mint/Australia/GATA)
Bron Suchecki: China accelerates gold reserves accumulation
Submitted by cpowell on Wed, 2015-12-09 16:46. Section: Daily Dispatches
11:49a ET Wednesday, December 9, 2015
Dear Friend of GATA and Gold:
China’s recent announcements of additions to the gold reserves held by the People’s Bank of China suggest an acceleration in gold accumulation, the Perth Mint’s Bron Suchecki writes today.
Of course this involves only the gold China acknowledges holding at its central bank. The bank could be concealing gold in its possession — something it has often done before, as when it accumulated gold for years without announcing any updates to its reserves. Or the Chinese government could be keeping gold at other state-owned institutions, like its foreign-exchange agency and commercial banks, and not reporting it.
Since central bank gold reserve totals are reported to the International Monetary Fund and since the IMF allows central banks to report gold leased or swapped as if it remains in the vault — that is, allows central banks to conceal their interventions in the gold market and to deceive everybody about gold reserves —
http://www.gata.org/node/12016
— official reserve figures should not be taken too seriously. For the location and disposition of government gold reserves are, at least for the major powers, secrets far more sensitive than the location and disposition of nuclear weapons. Nuclear weapons can only destroy the world, but gold reserves, mechanisms of currency marker rigging, can be used to exploit the world. This was all explained in detail in a meeting in the office of U.S. Secretary of State Henry Kissinger in April 1974:
http://www.gata.org/node/13310
Suchecki’s analysis is headlined “China Accelerates Gold Reserves Accumulation” and it’s posted at the Perth Mint’s Internet site here:
http://research.perthmint.com.au/2015/12/09/china-accelerates-gold-reser…
CHRIS POWELL, Secretary/Treasurer
Gold Anti-Trust Action Committee Inc.
CPowell@GATA.org
end
The Indian Government has no chance of getting its citizens gold and also to stop them from purchasing this metal
(courtesy Alasdair Macleod/GoldMoney)
Alasdair Macleod: Indian govt. aims to expropriate its people’s gold
Submitted by cpowell on Thu, 2015-12-10 16:37. Section: Daily Dispatches
11:35a ET Thursday, December 10, 2015
Dear Friend of GATA and Gold:
GoldMoney research director Alasdair Macleod today analyzes the Indian government’s latest gold “monetization” schemes — paperization, actually — and writes that that there is “strong circumstantial evidence” that the International Monetary Fund’s former chief economist, Raghuram Rajan, “was effectively appointed by the West’s central banking establishment with a mandate to rein in Indian buying of physical gold.”
Macleod argues that the Indian government’s objective is to increase its gold reserves so that India may become a more credible member of the Shanghai Cooperation Organization, which is likely to make gold part of its financial system.
Macleod writes: “India’s government therefore sees no option but to obtain sufficient gold from its citizens to hold down its future position in the SCO. And if the current gold monetization scheme fails, the ordinary Indian and his temple will be faced with the prospect of outright government confiscation.
“Indian citizens should be alert to what is going on behind the scenes, and Western observers should follow this story carefully. The Indian government is on course to do what every government does to get its citizens’ gold, by fair means initially and foul when fairness fails. Once their gold has gone into the government coffers, the Indian people will never ever see it again.”
Macleod’s commentary is headlined “India and Gold” and it’s posted at GoldMoney here:
https://www.goldmoney.com/our-research/goldmoney-insights/india-and-gold…
CHRIS POWELL, Secretary/Treasurer
Gold Anti-Trust Action Committee Inc.
CPowell@GATA.org
end
And here is evidence of its complete failure:
(courtesy Foss/Mises.Org)
India’s Failing Gold Monetization Scheme: Seizure Imminent?

DECEMBER 9, 2015 Paul- Martin Foss
India’s newest gold monetization scheme has been a colossal failure. After one month, it has netted only one kilogram (2.2 pounds avoirdupois) out of an estimated 20,000 tonnes (44 million pounds avdp) of privately-held gold. Why is that? Well, let’s look at how the program works.
- Gold-holders turn their gold over to a bank. The banks melt the metal down and provide it to the central bank to loan to jewellers.
- In exchange, the central bank provides gold accounts to the banks on behalf of the gold depositors and pays interest on those deposits.
- The interest rate on those deposits is a little over 2%, while the inflation rate in India right now is over 5%.
- The deposits are time deposits, meaning that depositors receive their principal repaid at the end of the term; short-term depositors receive gold or rupees back, while medium- and long-term depositors receive only rupees.
So you give up all your gold, get at most a -3% rate of return on your investment, and might get both your interest payments and principal paid in rupees that the government has historically devalued at up to 15% per year. And the government wonders why gold-holders aren’t flocking to offload their gold?
But not to worry, the government will make sure this scheme works :
“A finance ministry official said if banks fail to win over temples, the government could intervene directly as it is looking for a big boost to the scheme to keep both imports and the current account deficit under control.”
Shades of 1933 all over again. One would imagine that outright gold confiscation from Hindu temples would result in massive protests and quite a bit of bloodshed. And while most rational people would assume that the government would be smart enough to avoid doing something so drastically stupid, this is the same government that developed the cockamamie gold monetization scheme in the first place. Never underestimate the idiocy of government bureaucrats, especially when those bureaucrats are trying to save face.
Let’s hope for the sake of the Indian people that their government learns its lesson and quietly shelves its futile attempts to monetize private gold holdings. If it really wanted to monetize gold, it would end any restrictions on the importation, transfer, and use of gold as money and allow markets to determine what money they wanted to use. Control is hard to give up, but the Indian economy would be far better off with gold as money instead of rupees.
https://mises.org/blog/india%E2%80%99s-failing-gold- monetization-scheme-seizure-imminent
-END-
1 Chinese yuan vs USA dollar/yuan falls in value , this time to 6.4422/ Shanghai bourse: in the red , hang sang: red
2 Nikkei closed down 254.52 or 1.32%
3. Europe stocks all in the red /USA dollar index up to 97.79/Euro down to 1.0951
3b Japan 10 year bond yield: falls to .312% !!!!(Japan buying 100% of bond issuance)/Japanese yen vs usa cross now at 121.43
3c Nikkei now just above 18,000
3d USA/Yen rate now well above the important 120 barrier this morning
3e WTI: 37.15 and Brent: 40.16
3f Gold up /Yen up
3g Japan is to buy the equivalent of 108 billion uSA dollars worth of bond per month or $1.3 trillion. Japan’s GDP equals 5 trillion usa.
Japan to buy 100% of all new Japanese debt and by 2018 they will have 25% of all Japanese debt. Fifty percent of Japanese budget financed with debt.
3h Oil down for WTI and down for Brent this morning
3i European bond buying continues to push yields lower on all fronts in the EMU. German 10 yr bund falls to .561%. German bunds in negative yields from 5 years out
Greece sees its 2 year rate rise to 8.75%/: still expect continual bank runs on Greek banks
3j Greek 10 year bond yield rises to : 8.35% (yield curve inverted)
3k Gold at $1074.10/silver $14.18 (7:45 am est)
3l USA vs Russian rouble; (Russian rouble up 31/100 in roubles/dollar) 69.00
3m oil into the 37 dollar handle for WTI and 40 handle for Brent/ China purchases huge supplies from Saudi Arabia
3n Higher foreign deposits out of China sees huge risk of outflows and a currency depreciation (already upon us). This can spell financial disaster for the rest of the world/China forced to do QE!! as it lowers its yuan value to the dollar.
30 SNB (Swiss National Bank) still intervening again in the markets driving down the SF. It is not working: USA/SF this morning 0.9858 as the Swiss Franc is still rising against most currencies. Euro vs SF is 1.0807 well above the floor set by the Swiss Finance Minister. Thomas Jordan, chief of the Swiss National Bank continues to purchase euros trying to lower value of the Swiss Franc.
3p Britain’s serious fraud squad investigating the Bank of England on criminal charges/arrests 10 traders for Euribor manipulation
3r the 5 year German bund now in negative territory with the 10 year falls to + .561%/German 5 year rate negative%!!!
3s The ELA lowers to 82.4 billion euros,
The bank withdrawals were causing massive hardship to the Greek bank. the Greek referendum voted overwhelming “NO”. Next step for Greece will be the recapitalization of the banks and that will be difficult.
4. USA 10 year treasury bond at 2.22% early this morning. Thirty year rate at 3% at 2.97% /
5. Details Ransquawk, Bloomberg, Deutsche bank/Jim Reid.
(courtesy Jim Reid/Bloomberg/Deutsche bank/zero hedge)
After Vicious Rollercoaster Session, Global Stocks Flat, US Futures Stage Tepid Rebound In Illiquid Chaos
After yesterday’s rollercoaster session in both the S&P and in oil, where initially stocks soared alongside oil, only to promptly tumble as stops were taken out and as the refiners’ inventory strategy was exposed after the DOE’s latest weekly numbers were released, it has been a quieter session so far, though maybe not for China where stocks jumped at the open only to fizzle and close at the lows in what appears to be ever less intervention by the market manipulating “National Team.”
Much of the overnight action was again in FX , where after yesterday’s dramatic tumble in the USD we had seen a substantial rebound in the greenback especially against the EUR and the JPY, although at last check those gains had reversed somewhat, in turn pushing US equity futures off their session highs. The most notable event of a relatively quiet European session saw the SNB keep rates unchanged as expected and reaffirm commitment to intervene which resulted in temporary volatility in CHF.
Without the ECB pushing extra easing, and without more liquidity from the SNB, and with the Fed expected to hike rates next week, it is not surprising that Europe has continued to meander lower over the past week. with miners and commodities rebounding as a result of Glencore’s pledge to cut debt to as low as $18 billion by end of 2016, scale back operations and sell more assets, becoming the latest mining company to respond to the deepening slump in commodities prices.
“There’s a confluence of events, none of which is horrendous in and of itself but which together have conspired to push markets lower and drag on investor sentiment,” said Daniel Murray, London-based head of research at EFG Asset Management. “People always get a bit nervous when you get a bit of a pull back. All eyes now are pointing towards the Fed.” 11 out of 19 Stoxx 600 sectors fall with financial services, retail underperforming and basic resources, utilities outperforming.

US equity futures, while going very much nowhere but doing so in a very staggered, jagged and algo-driven fashion, confirm one thing: there continues to be no liquidity in the market whatsoever.

There is one more central bank on deck today, with the Bank of England’s last policy decision of the year, due in a few minutes at noon U.K. time – nothing is expected. Elsewhere, oil rises from 6-year low after U.S. stockpiles drop. Asian stocks fall as the yen’s biggest gain in 3 months weighed on Japanese exporters and Australian bank shares decline.
This is how markets looked right now:
- S&P 500 futures up 0.4% to 2051
- Stoxx 600 down 0.2% to 363
- FTSE 100 down 0.3% to 6109
- DAX up less than 0.1% to 10598
- German 10Yr yield down 1bp to 0.59%
- MSCI Asia Pacific down 0.4% to 130
- Nikkei 225 down 1.3% to 19047
- Hang Seng down 0.5% to 21705
- Shanghai Composite down 0.5% to 3455
- US 10-yr yield up 1bp to 2.23%
- Dollar Index up 0.4% to 97.74
- WTI Crude futures up 0.3% to $37.26
- Brent Futures up 0.5% to $40.31
- Gold spot up less than 0.1% to $1,074
- Silver spot up less than 0.1% to $14.21
Looking closer at markets shows Asian equities traded mixed following the lacklustre lead from Wall Stree t as stocks have once again been pressured by rising global growth concerns. In turn, the Nikkei 225 (-1.3%) continued to feel the brunt of a stronger JPY, after the currency surged the most in 3-months. ASX 200 (-0.8%) dismissed the euphoria over of the stellar Australian Jobs report, with the index weighed on by financials. Shanghai Comp. (-0.5%) bucked the trend as participants digested news of long awaited IPO reforms, consequently showing regulators determination to maintain market stability. However, the index slipped into negative territory heading into the European open. JGBs traded in minor negative territory in what has been a quiet session for Japanese credit markets.
“If you’ve got cash you’re better off hanging on to it and seeing how this plays out,” Don Williams, Sydney-based chief investment officer at Platypus Asset Management told Bloomberg. “It’s going to get more difficult into the next calendar year and earnings growth is waning. We’re pretty circumspect.” 8 out of 10 Asian sectors fall with consumer discretionary, health care underperforming and materials, utilities outperforming.
Top Asian News:
- NZ Cuts Key Rate to 2.5% as Seen by Most Economists
- Australian Nov. Employment Rose 71,400 M/M; Est. 10,000 Fall
- Japanese Bought Net 73.1 Billion Yen Overseas Debt Last Week
- Australia’s Best 2-Month Jobs Gain Since ’88: Mirage or Miracle?: AU employers recorded the biggest back-to-back monthly job gains in almost 28 yrs
- Yuan Bears’ Appetite Whetted as PBOC Support for Currency Fades: Yuan headed for 4-yr low, as central bank cut its reference rate to the weakest since 2011
- Xi’s Pared-Back China Growth Minimum May Already Be in Peril: Monetary easing, has done little to spur economy at risk of undershooting 2015 growth target of 7%
- Jeweler’s World-Beating 378% Indian Rally Drubs Tiffany in Slump: Rajesh Exports Ltd. is betting a demand pick-up after gold slid to 5-yr low last week
- Core Core Means No One Is Sure How to Measure Japan’s Inflation: Consumers feel inflation is rising at a faster rate than gov’t headline CPI indicates
In Europe, sentiment remained cautious, while the looming holiday-thinned liquidity also exacerbated the price action across various asset classes. As a result, European equities (Euro Stoxx: -0.2%) initially saw significant weakness before coming off the worst levels of the session to trade flat, while Bunds were supported by the new depo rate which came into effect yesterday and allows the ECB to buy securities that trade below the yield of -0.20%. Material sector staged an impressive recovery having been under considerable selling pressure over the past few sessions, with Glencore (+9.5%) leading the pack after the commodity trading giant widened plan to cut debt.
Top
Sentiment remained cautious, while the looming holiday-thinned liquidity also exacerbated the price action across various asset classes. As a result, European equities (Euro Stoxx: 0.0%) initially saw significant weakness before coming off the worst levels of the session to trade flat, while Bunds were supported by the new depo rate which came into effect yesterday and allows the ECB to buy securities that trade below the yield of -0.20%. Material sector staged an impressive recovery having been under considerable selling pressure over the past few sessions, with Glencore (+9.5%) leading the pack after the commodity trading giant widened plan to cut debt.
Top European News:
- U.K. Oct. Trade Deficit GBP11.8B; Med. Est. Deficit GBP9.7B
- France Oct. Industrial Production +0.5% M/m; Est. Unchanged M/m
- France November Harmonized CPI +0.1% Y/y; Est. +0.2% Y/y
- Vodafone Seeks EU115m in Damages From KPN on Triple-Play Access: co. says KPN delayed its combined TV, Internet and phone offering by 3 years by not honoring existing commitments
- Technip Denies Merger Talks After Reports of FMC Discussions: co. comments in statement
- Centrica Says FY Earnings Outlook In Line With Expectations: says made good operational and strategic progress
- London Finance Vacancies Drop 32% as Banks Retreat, Survey Says: fall from October sharper than expected, Morgan McKinley says
- Billionaire-Backed Danfoss Seeks Takeovers as Cash Pile Grows: CEO says Danfoss can do bigger purchases with bond program
In FX, the most notable event of a relatively quiet European session saw the SNB kept rates unchanged as expected and reaffirm commitment to intervene which resulted in temporary volatility in CHF. While of note, GBP/USD traded relatively range-bound, with the price action contained by option related plays, with good size expiring strikes seen at 1.5200.
During Asia Pacific hours, Antipodeans were in focus, with AUD surging on the back of the blowout Australian jobs data , as the headline reading topped expectations printing the highest figure since July’00, which saw AUD/USD briefly break above 0.7300. While the stellar report also reinforces the RBA’s view that the economy’s prospects have improved. As noted last night, the Australian Employment Change (Nov) M/M 71.4K vs. Exp. -10.0K (Prey. 58.6K, Rev. 58.3K), highest reading since July 2000
In commodities, price action has been relatively choppy in the commodity complex overnight amid light news flow, with the likes of Brent and WTI drifting higher by around USD 0.40/bbl before paring back the gains ahead of the North American crossover. Separately Gold trade was mostly lacklustre and sideways during Asia hours as participants remain side lined ahead of the approaching Fed decision. Elsewhere, copper prices were stable overnight, while Dalian iron ore futures fell to a record low with the outlook subdued on speculation of weak demand from falling steel consumption.
On today’s calendar, key events include the latest initial jobless claims numbers as well as the November import price index print. Later this evening the November Monthly Budget Statement is due out. Away from this, the Bundesbank’s Weidmann is set to speak at a conference this evening.
Top Global News:
- Pound Gains Versus Euro as BOE Seen Maintaining Record-Low Rate: policy makers seen voting 8-1 to hold key rate at 0.5%
- BOE Is Caught Between Fed, ECB as Inflation Remains Below Target: ECB cut its deposit rate last week, Fed may hike next week
- Berenberg Pushes Back BOE Bank Rate Increase to May 2016: Only changes forecast date of move, bps amount stays the same
- SNB Keeps Deposit Rate at Record Low, Says Franc Overvalued; Jordan to brief reporters on SNB thinking at 10 a.m. in Bern
- Glencore Widens Plan to Cut Debt as Commodities Rout Deepens: commodities trader to cut debt to $18-$19 billion by 2016
- Greek Stocks Are World’s Worst as Banks Flood Market With Shares: lenders had record slump last month, trade near lowest ever
- Syngenta Shares Surge on Report of Renewed Offer From ChemChina: offer could trigger bidding war with Monsanto, Bernstein says
Bulletin Headline Summary from RanSquawk and Bloomberg:
- European equities initially saw significant weakness before coming off the worst levels of the session to trade flat, while Bunds were supported by the new depo rate
- SNB kept rates unchanged as expected and reaffirm commitment to intervene
- Today’s highlights include the latest US weekly jobs report, EIA natural gas storage change report and BoE policy decision/minutes
- Treasuries steady as European shares erase losses amid rise in mining companies; week’s auctions conclude with $13b 30Y bonds, WI 2.97% vs. 3.07% in November.
- China’s pared-back minimum growth rate may still be too high. So says a sizable minority of economists who flag the limitations of traditional policy tools
- OPEC’s crude production rose by 230,100 b/d in November to 31.695m b/d, highest since April 2012, as surging Iraqi volumes more than offset a slight pullback in Saudi Arabia
- Glencore Plc pledged to cut debt to as low as $18b by end of 2016, scale back operations and sell more assets, becoming the latest mining company to respond to the deepening slump in commodities prices
- Iraq sought to increase pressure on Turkey to withdraw hundreds of soldiers from the semi-autonomous Kurdish region, escalating the dispute to the UN and threatening to cut trade ties with the government in Ankara
- While in power Sweden’s Moderate party urged voters to “open their hearts” to the waves of refugees flowing out of the world’s trouble spots. A year later — and now in opposition — the party is driving a wedge through the ruling coalition with calls for the borders to be closed
- $17.75b IG priced yesterday, no HY. BofAML Corporate Master Index OAS up 1bp to +166, YTD range 180/129. High Yield Master II OAS widens 7bp to +672, YTD range 683/438
- Sovereign 10Y bond yields lower. Asian stocks lower, European stocks mixed, U.S. equity-index futures gain. Crude oil lower, copper and gold higher
US Event Calendar
- 8:30am: Import Price Index m/m, Nov., est. -0.8% (prior -0.5%)
- Import Price Index y/y, Nov., est. -9.6% (prior -10.5%)
- 8:30am: Initial Jobless Claims, Dec. 5, est. 270k (prior 269k)
- Continuing Claims, Nov. 28, est. 2.155m (prior 2.161m)
- 9:45am: Bloomberg Dec. U.S. Economic Survey
- 9:45am: Bloomberg Consumer Comfort, Dec. 6 (prior 39.6)
- 12:00pm: Household Change in Net Worth, 3Q (prior $695b)
- 1:00pm: U.S. to sell $13b 30Y bonds
- 2:00pm Monthly Budget Statement y/y, Nov., est. -$66b (prior -$56.8b)
DB’s Jim Reid completes the overnight wrap
It’s certainly an uncomfortable December so far for risk. The commodity super cycle that occurred post the GFC continues to unravel fairly spectacularly. The problem being that a fair amount of debt was raised on the back of it which is why US HY and EM in particular are now in focus. In observing the commodity bubble burst one can’t help but shudder at the prospect of the bond bubble one day unraveling. For now while central banks remain big buyers and global inflation remains so low there is virtually no short term risk of such an event occurring. However imagine a scenario at some point in the future where DM inflation (even if only temporarily) looks like moving notably north of 2% and central banks aren’t able to buy bonds due to mandate constraints. Everything we’re seeing with commodities at the moment will be magnified many times over around the globe. Over the last 10-20 years most of the rolling bubbles have eventually mean reverted so it’s debatable whether bonds can escape the same fate. To stress again such an outcome is nowhere on the horizon at the moment but the commodity experience should be a warning sign that nothing lasts forever.
The focus for markets yesterday was once again on the huge volatility in the Oil complex, as it has been for the last week or so now. WTI finished the day down -0.93% and a bit above $37 and has made a new low for the fourth consecutive session now. That was after prices peaked at $39 in the mid-afternoon having surged nearly 4% after the US EIA said that crude inventories were down 3.6m barrels last week. That rally was short lived however with prices at one stage falling 5.5% from those highs, before stabilizing somewhat into the close, albeit still lower on the day. It was a similar pattern of trading for Brent which closed the day -0.37% and just above $40.
Those moves dictated much of the price action in risk assets. In Europe the Stoxx 600 (-0.43%) retreated into the close having looked like it was set to finish in positive territory before that tumble for Oil. In the US the S&P 500 finished down -0.77%, again also paring an earlier gain. Some of the weakness was also driven by tech names however with the Nasdaq (-1.48%) suffering a particularly steep fall as Apple (-2.2%) highlighted a broad-sell off for the sector. Meanwhile gains of nearly 12% each for Dow Chemical and DuPont on the back of the news of a potential mega merger failed to help offset the weaker tone in markets generally yesterday.
European credit markets were under pressure again yesterday with Crossover closing some +12bps wider. Moves were a lot more muted in US credit where indices closed broadly unchanged, although it was a busy day in the primary market there with nearly $18bn of deals pricing in what was the highest volume session since late October. That volume was dominated primarily by one issuer, Visa, who was out with a bumper 6-part $16bn offering – the fourth largest deal in US investment grade this year. Meanwhile the latest move in Oil saw US HY energy spreads finish +10bps wider, a smaller move relative to the +40bps, +45bps and +24bps seen in the prior 3 days, but still another leg wider and extending the record wides now to 1185bps.
Looking at the latest in Asia this morning, it’s been a bit of a mixed start across equity markets in the region. Gains are being led out of China where the Shanghai Comp (+0.40%) and CSI 300 (+0.64%) are both up modestly. The Nikkei (-1.23%) appears to be following more of the lead from the US last night, while the ASX (-0.84%) has fallen steeply despite some strong employment data out of Australia this morning, instead reflecting perhaps the reduced risk of any more near term cuts from the RBA. The Aussie Dollar is up 1% post the data. Meanwhile the NZD has pared back a little but was up a similar amount despite a cut from the RBNZ late last night, lowering the cash rate by 25bps to 2.5%. The currency stronger on the expectation that the move may also mark the end of the current easing cycle. Elsewhere this morning, Oil markets have rebounded nearly 1% in early trading, which has helped US equity futures to edge higher.
Brazil generated a few headlines again yesterday after the sovereign’s Baa3 rating from Moody’s was put on review for downgrade, moving it one step closer to junk. Brazil’s 10y yield jumped about 8bps post the news although a lot of chatter suggested it wasn’t a great surprise given S&P already has the sovereign at BB+. Our EM Economists did however highlight that the pace at which Brazil looks set to lose IG status from at least two agencies is happening a bit quicker than they expected. Shortly following the news Moody’s also announced that it had cut Petrobras’ rating deeper into junk at Ba3 (from Ba2), while also warning that the rating could be lowered further. All this adding to the woes for a company which is very much in focus at the moment given the current corruption investigations. In terms of what a Brazil downgrade to junk means for other Brazilian names, our Economists expect about $12bn of senior bank bonds to be at risk of forced selling giving the potential for a number of banks to lose IG status. They do however highlight that a potential loss of IG status has been well flagged in the market and so positioning is likely already reflecting this to some extent.
In terms of the economic data yesterday, in the US there was some softer than expected wholesale inventories (-0.1% mom vs. +0.2% expected) and trade sales (0.0% mom vs. +0.2% expected) data to report of for October. The USD was actually under pressure for much of the session, the Dollar index eventually closing -1.15% and while the data at the margin wouldn’t have helped, it’s probably a reflection of more of a bounce back for commodity sensitive currencies yesterday. In Europe the only data of note was out of Germany where the October trade surplus came in a tad higher than expected (EUR 22.5bn vs. EUR 21.7bn) as imports (-3.4% mom) fell stronger than exports (-1.2% mom).
There was a bit of ECB chatter as well yesterday, with ECB policymaker Nowotny out saying that markets had misjudged the state of the Euro area economy. Nowotny said that ‘it was absurd what expectations were expressed’ and that ‘I don’t believe the ECB’s communications policy gave a false signal’.
Looking at the day ahead now, we’re kicking off the European session this morning with data out of France where we’ll get the latest CPI print along with industrial and manufacturing production. Shortly following this will be the October trade numbers for the UK before we get the BoE rate decision around midday (no change expected). Over in the US this afternoon we’ll get the latest initial jobless claims numbers as well as the November import price index print. Later this evening the November Monthly Budget Statement is due out. Away from this, the Bundesbank’s Weidmann is set to speak at a conference this evening.
end
Let us begin:
ASIAN AFFAIRS
Last night:
Onshore Yuan Has Been In Freefall Since The IMF Added China To The SDR Basket
For the 5th day in a row, Onshore Yuan has tumbled against the USDollar. Absent the violent devaluation in August, this is the largest drop since March 2014, leaving the Chinese currency at its weakest level against the USD since August 2011. It appears that after showing some signs of ‘stability’ to appease The IMF’s political decision, and following the weak trade data this week, China has decided to escalate the currency wars, perhaps in anticipation of (or in an attempt to stall) any market turbulence when The Fed hikes rates next week and withdraws up to $800bn in liquidity from global markets.
Onshore Yuan is now at its weakest since August 2011…

As it seems, with the blessing of The IMF, China has begun its competitive devaluation efforts…slowly and under the cover of darkness from America’s mainstream media…

Put simply, something is going on as the world’s money markets prepare for what lies ahead next week and the asset classes with the most risk (see CCC US Corps, EM FX, Oil) are the first to suffer before the effects of shortened collateral chains ripple up into mom-and-pop’s 401k.
Charts: Bloomberg
“China’s Warren Buffett” Guo Guangchang Disappears
On November 18, Guotai Junan Chairman and CEO Yim Fung went “missing.”
“We can’t find him,” the broker said, flatly.
Three weeks later, Citic Securities – China’s largest brokerage –lost all contact with Jun Chen, their head of investment banking, and Jianlin Yan, who runs investment banking at the company’s overseas unit.
Where did Yim, Jun, and Jianlin “disappear” to you ask? Well we know Yim was detained in connection with a graft investigation involving Yao Gang, vice chairman of China’s securities regulator and given what we know about the Politburo’s renewed push crackdown on market “manipulators”, sellers, and those suspected of frontrunning purchases by the “national” plunge protection team over the summer, it’s likely Jun and Jianlin suffered the same fate as Gang Xu, another Citic executive who was “summoned” by authorities back in August.
On Thursday, we learn that yet another high profile businessman has apparently vanished and this time, it’s none other than “China’s Warren Buffett,” Guo Guangchang (worth some $7 billion at last count) whose conglomerate Fosun International is morphing into an insurance-focused investment group. Fosun spent more than $6 billion buying stakes in 18 overseas companies between February and July.
“Chinese billionaire Guo Guangchang, chairman of conglomerate Fosun Group, is unreachable,”Bloomberg reports, citing Caixin.
The company says it’s “handling the situation.”

Recall that Fosun was among those bidding for Novo Banco, which was derived from the smoldering ashes of failed Portuguese bank Banco Espirito Santo (bids for Novo dried up during the summer, creating a budget headache for Lisbon).
Fosun’s stock plunged with the rest of the Chinese market over the summer, prompting Guo to issue the following colorful statement: “Amid a sheer panic in the market, we should be brave and act opposite to the crowd. There is always an abandoned pearl in any market with bubbles. In a market full of panic sentiment, even more such opportunities are hidden.”
Yes, “hidden” opportunities and now Guo finds himself “hidden,” probably somewhere deep within the Politburo.
Whether Beijing is questioning Guo about his habit of eschewing investments in China in favor of deploying capital overseas or whether Fosun did something “wrong” in the markets during the selloff is hard to know, but one thing’s for certain: “kill the chicken to scare the monkey” is alive and well.
Copper

GLEN GLENCORE PLC ORD USD0.01
| Price (GBX) | 88.90 | Var % (+/-) | +7.01% ( |
| High | 95.12 | Low | 86.00 |
| Volume | 149,976,464 | Last close | 88.90 on 10-Dec-2015 |
| Bid | – | Offer | 89.20 |
| Trading status | Market Close | Special conditions | NONE |

China urged Iraq and Turkey to further increase communication and coordination in order to resolve the conflict.
BEIJING (Sputnik) — Ankara must respect Iraq’s sovereignty and territorial integrity, Chinese Foreign Ministry spokeswoman Hua Chunying said Wednesday, commenting on the issue of Turkish military presence in northern Iraq.
On December 4, Turkey deployed up to 150 military personnel to Iraqi Nineveh province, without Baghdad’s approval, allegedly to provide training to Kurdish militia who are fighting extremists.

“The Chinese side believes that we should deal with state-to-state relationship in accordance with purposes and principles of the UN Charter as well as other widely-recognized basic norms governing international relations, and that Iraq’s sovereignty and territorial integrity shall be respected,” Hua said at a daily briefing.The Foreign Ministry spokeswoman also urged the parties to further increase communication and coordination in order to resolve the conflict.
Following the deployment, Prime Minister Haider Abadi demanded the withdrawal of the Turkish troops within 48 hours and called on NATO chief Jens Stoltenberg to urge the alliance to help resolve the issue.
The term of the ultimatum has expired, but Permanent Representative of Iraq to the UN Mohamed Ali Hakim said that Baghdad did not intend to appeal to the UN Security Council, instead, in the coming days, the sides would try to resolve the situation privately.
China Says Turkey Needs To Respect Iraq’s Sovereignty, Territorial Integrity
“Turkey is acting recklessly and inexplicably,” Vitaly Churkin, Russia’s ambassador to the UNtold the Security Council at a closed-door meeting on Tuesday.
Churkin was not, as you might have guessed, referring to Ankara’s brazen move to shoot down a Russian warplane near the Syrian border late last month (although we’re quite sure that Moscow would classify that as “reckless and inexplicable” as well).
Churkin was referencing Erdogan’s decision to send between 150 and 300 Turkish troops along with around two dozen tanks to Bashiqa, just northeast of the ISIS stronghold in Mosul.
The Russian ambassador is correct to characterize the deployment as “inexplicable” – at least in terms of Ankara being able to offer an explanation that makes sense to the general public. The official line is that it’s part of an ongoing “training mission” that Iraqi officials agreed to at some point in the past. Baghdad denies this.
Masoud Barzani supports the Turkish effort (and how could he not, given the fact that without Turkey, the Kurds wouldn’t be able to transport crude independently of Baghdad) which serves to provide a kind of quasi-legitimacy to the Turkish presence. But as we outlined last weekend, this may simply be an attempt to secure oil smuggling routes and ensure that Turkey’s interests in Islamic State-held territory are preserved.
The latest from Iraq – as we outlined earlier today – is that some lawmakers are now looking to annul the country’ security agreement with the US on the way to inviting the Russians in to help fight ISIS. As for the “situation” with Turkey, Iraq’s UN ambassador Mohamed Ali Alhakim told reporters after Russia raised the issue thatBaghdad and Ankara “are solving it bilaterally.”
“We have not yet escalated it to the Security Council or to the United Nations,” he added.
Yes, “not yet,” but it’s difficult to see how “bilateral” talks are going to solve this given the fact that Erdogan clearly had some idea of what he wanted to accomplish by sending troops and tanks to Mosul. He had to have known going in that the whole “we’re just replacing 90 troops that had been there for the better part of two years” excuse wasn’t going to fly with Shiite politicians and the various Iran-backed militias who are all hyper-sensitive now that the The Pentagon has suggested the US is set to insert ground troops to assist the Peshmerga in their efforts against ISIS.
Well, when you start to discuss the Security Council in the context of the conflicts raging in Syria and Iraq, it’s important to remember that Russia isn’t the lone voice of dissent among the five permanent members. Recall that back in May of 2014 Beijing voted with Moscow to veto a Security Council resolution that would have seen the conflict in Syria referred to the Hague. Here’s what China had to say at the time:
For some time now, the Security Council has maintained unity and coordination on the question of Syria, thanks to efforts by Council members, including China, to accommodate the major concerns of all parties. At a time when seriously diverging views exist among the parties concerning the draft resolution, we believe that the Council should continue holding consultations, rather than forcing a vote on the draft resolution, in order to avoid undermining Council unity or obstructing coordination and cooperation on questions such as Syria and other major serious issues. Regrettably, China’s approach has not been taken on board; China therefore voted against the draft resolution.
Thus far, China hasn’t involved itself directly in the latest round of Mid-East conflicts, but if Xi were to step in, it’s clear that he would side with the Russians and the Iranians which means that when it comes to Turkey and the US putting boots on the ground in Iraq against Baghdad’s wishes, Beijing would almost surely fall on the side of the Iraqis.
Sure enough, on Wednesday, the Chinese Foreign Ministry weighed in for the first time. Here’s an excerpt from the statement by spokesperson Hua Chunying:
“The Chinese side believes that we should deal with state-to-state relationship in accordance with purposes and principles of the UN Charter as well as other widely-recognized basic norms governing international relations, and that Iraq’s sovereignty and territorial integrity shall be respected.”
That may sound like a rather generic statement, but in fact it sends a very clear message. The implication is that Turkey has violated Iraq’s sovereignty and territorial integrity and that is not something the Security Council should condone.
The question becomes this: what happens when Baghdad annuls its agreement with Washington and the US troop presence ends up representing a similar violation of Iraq’s sovereignty?
If Baghdad were to go to the Security Council and claim that The Pentagon’s deployment of SpecOps to northern Iraq constitutes an illegal act, how would the five permanent members resolve an intractable dispute between the US and France on one side (don’t forget, the French are bombing Iraq as well) and Russia and China on the other?
In short: how long until Xi decides it’s time to awaken the sleeping dragon and enter the Mid-East fray?
For now, Chunying says Beijing will “closely follow the development of the incident.”
Iran-Backed Shia Forces Threaten Turkey Over ‘Incursion’ Into Iraq
Shia militias with ties to Iran on Wednesday threatened to attack Turkish forces deployed to Iraqi territory unless Ankara withdraws its troops from the region.
Last week, Turkey deployed troops to a camp in Mosul in northern Iraq. Baghdad condemned the move as a violation of sovereignty and asked NATO to intervene. It also set a 48-hour deadline to withdraw, which has since expired.
Now, the threat by Shia militias adds to the mounting pressure on Turkey, which says the forces are there to train Iraqi troops battling Daesh, also known as ISIL/The Islamic State.

Karim al-Nuri, a spokesman for the Badr Brigade, the largest coalition of Shia militias, likened the Turkish incursion with the occupation of Iraq by Daesh militants and said “all options” were available.
“We have the right to respond and we do not exclude any type of response until the Turks have learned their lesson,” Nuri said. “Do they have a dream of restoring Ottoman greatness? This is a great delusion and they will pay dearly because of Turkish arrogance.”
Turkey on Tuesday said it will not withdraw its soldiers, but it also would not send anymore. Baghdad said it never invited the forces in the first place.
Iraqi parliament members on Wednesday unanimously approved a motion to support the government in taking whatever measures against the incursion it viewed as appropriate.
Several MPs suggested Iraq could wage “economic war” on Turkey, but Jafaar Hussaini, a spokesman for one of the Shia armed groups, Kata’ib Hezbollah, said violence was likely, Reuters reported.
“We say that they military option is still probable and we might reach a stage in the next few days where we start carrying out operations against the Turks, be it against their soldiers or Turkish interests in Iraq.”
US Wants To Send Attack Helicopters To Iraq As Battle Wages For Key ISIS-Held City
Once Russia turned up the heat on “the terrorists” in Syria, the US was suddenly at pains to explain why Washington’s strategy for dealing with militants differs so markedly from the Russian approach.
The US has resorted to 15 months of spotty airstrikes “backed” by a hodgepodge of loosely organized ground troops that in many cases are tasked with battling fighters the US also trained and equipped at one time or another. The results of this “strategy” have been a disaster. ISIS remains and the latest group of US “trained and equipped” troops was systematically dismantled and embarrassed by al-Qaeda, the latest in a string of boondoggles that reached a humiliating crescendo in the summer of 2014 when everyone involved suddenly realized that allowing Sunni extremists to form “a Salafist principality” (as predicted by The Pentagon in 2012) was a very, very bad idea.
The Russian strategy is far simpler and goes something like this: if you are an anti-Assad element operating in Syria, you’re a terrorist or at the very least you have the potential to become one and so we’re going to bomb you and instead of resorting to shaky alliances with unreliable rebel groups for ground cover, we’ll just partner with Iran and Hezbollah.
While it’s true that Russia hasn’t rolled up ISIS, al-Nusra, and the FSA as quickly as Moscow predicted, The Kremlin has been more effective than the White House at combatting extremists and now, Baghdad and Kabul are reconsidering whether they want to be aligned with the US if it means the Russians can’t participate in routing militants in Iraq and Afghanistan.
In order to convince America’s “partners” in Iraq that the US can still effectively fight terror, US SpecOps partnered with the Peshmerga on an ISIS prison raid in late October and on a successful offensive to retake Sinjar (the northern Iraqi town where ISIS terrorized the Yazidi minority). Next on the agenda: Ramadi.

ISIS overran Ramadi in May and as WSJ notes, “the Iraqi army’s attempt to retake the city is widely seen as a test of preparedness for a planned future offensive in Mosul, Iraq’s second-largest city and the most populous under the group’s control.”
“It’s the biggest city in Iraq’s largest province and the heartland of the Sunni community of Iraq. It’s a big trading post for the country as well, with roads leading into Jordan and Syria,” Al Jazeera’s Imran Khan notes.
Hampering the offensive is a series of IEDs set up to keep enemies from entering and, allegedly, to keep citizens from leaving. Here’s more:
Ramadi, about 60 miles west of the capital of Baghdad, is surrounded by farmland that is also now heavily fortified with IEDs.
In recent months, Islamic State laid a new layer of IEDs alongside the ones it placed after it took the city last spring, leaving Iraqi security forces with even more deadly explosives to defuse than in previous battles with the extremist group.
“For sure, there will be new ways in Ramadi. Today they’re using cellphone IEDs. By the time we figure out how to stop that, they’ll have the next thing. They use tricks. Always they are a step ahead of you, no matter how smart you are,” Ammar Sadoun,an Explosive Ordnance Division engineer advising on operations in the city told WSJ earlier this month.
On Tuesday, the Iraqi army retook a strategic operations center and is now in a position to drive ISIS from the city. Here’s a look at the situation on the ground:

Apparently, ISIS fighters attempted to launch a counteroffensive on Wednesday which nearly succeeded, before US airstrikes drove back the advance.
“The center of Ramadi is under our control,” Brig. Gen. Yahya Rasool, spokesman for the Iraqi army Joint Operations Command, proclaimed.
The interesting thing about the battle for Ramadi is that the Iraqi army resorted to Sunni tribal fighters for extra support rather than the Iran-backed Shiite militias that have proven time and again to be the most effective fighters when it comes to pushing back ISIS. Of course Islamic State subscribes to puritanical, orthodox Sunni Islam. Consider that, and see if you can surmise why the Ramadi strategy is dangerous based on the following account, again from WSJ:
Ramadi and surrounding Anbar province are dominated by Iraq’s Sunni minority andparticipation of Shiite militias in the battle would have risked stoking sectarian tensions.
The offensive has the largest participation of Sunni tribal fighters to date and is a chance for the recently-formed militias to show they are capable of defending territory won back by the army. The Sunni volunteers have only rudimentary training and arms. But their participation has symbolic value, meant to give Sunni-majority areas such as Anbar province confidence that they won’t be abused by the Shiite-dominated army and central government.
The Sunni volunteers didn’t fight alongside the Iraqi forces in this week’s advance, but followed behind the troops to hold territory as it was taken. On Wednesday, some Sunni militia members stood guard at checkpoints along the road into Ramadi that had been freed by the army.
Now what do you imagine might happen when Sunni fighters who distrust the Shiite Iraqi regulars and who know that politicians in Baghdad are loyal to Shiite Iran are left to hold contested territory with “rudimentary training and arms”? It certainly seems possible that they will simply walk away in the face of an ISIS advance, especially if Islamic State offers to spare them due to ideological affinity.
So that’s the situation in Ramadi and according to Ash Carter – who briefed the Senate Armed Services Committee on America’s ISIS “strategy” on Wednesday – the US is prepared to send in the Apaches to assist in securing the city.
“The United States is prepared to assist the Iraqi Army with additional unique capabilities to help them finish the job, including attack helicopters and accompanying advisers, if circumstances dictate and if requested by Prime Minister Abadi,” he said.
Well make no mistake, “circumstances” do indeed “dictate,” because as outlined above, Iraq decided to leave it to untrained, under-equipped Sunni tribesmen to hold captured territory and opted to exclude the fearsome Shiite militias who might have actually been able to secure contested ground. The problem for Carter is that Abadi has already rejected the idea of US attack helicopters and just last week said Baghdad does not want an increased US troop presence.
Asked by the Senate to clarify the role of The Pentagon’s proposed SpecOps force, Carter said only this: “This is a no-kidding force that will be doing important things,”
“The President has not decided to approve the use of attack helicopters in an operation like this,” White House Press Secreatry John Earnest added on Wednesday.
So ultimately, there’s no strategy. The Pentagon apparently wants to send in troops and helicopters but Obama hasn’t approved the latter and Abadi doesn’t want either. Meanwhile, the sectarian divide is preventing the Iraqis from stationing effective forces in captured territory and no one knows what the Turks and the Peshmerga are up to in Bashiqa. Finally, amid the confusion, at least some Iraqi politicians want the US gone altogether in order to pave the way for deeper cooperation with the Russians.
The bottom line is that it now looks like that the US, for whatever reason, is hell bent on getting more troops and more equipment to Iraq – with or without Baghdad’s consent. Washington has a tendency to view Iraq as America’s property and it seems that the more Baghdad pushes back and the closer Iraqi lawmakers get to leaning Russian, the closer the US gets to getting more deeply involved.
Stay tuned.
end
Obama’s ISIS Oil Scandal Deepens As Russia Produces Stunning Photographic Evidence

How is Barack Obama going to get out of this one? On Tuesday, the Russian military produced an impressive array of evidence that clearly shows that ISIS oil is being smuggled into Turkey on an industrial scale. The evidence included photographs taken by satellite and during aerial reconnaissance missions. What the Russians have shown the world is extremely compelling, and it raises some very disturbing questions. First of all, how involved is the Turkish government in all of this? There is no way in the world that an endless parade of trucks carrying ISIS oil could have marched through Turkish border checkpoints without the cooperation of the central government. Secondly, what did Obama know and when did he know it? The U.S. military has far better surveillance capabilities than the Russians do, and so it seems absolutely absurd to suggest that Obama didn’t know what was going on.
This new Russian evidence was presented to the world by Deputy Defense Minister Anatoly Antonov, and he says that “thousands of oil trucks” have been going back and forth over the Turkish border…
According to Deputy Defense Minister Anatoly Antonov, Russia is aware of three main oil smuggling routes to Turkey.
“Today, we are presenting only some of the facts that confirm that a whole team of bandits and Turkish elites stealing oil from their neighbors is operating in the region,” Antonov said, adding that this oil “in large quantities” enters the territory of Turkey via “live oil pipelines,” consisting of thousands of oil trucks.
But Antonov didn’t stop there. He went on to publicly accuse President Erdogan of Turkey and his family of running the entire operation…
“Turkey is the main consumer of the oil stolen from its rightful owners, Syria and Iraq. According to information we’ve received, the senior political leadership of the country – President Erdogan and his family – are involved in this criminal business,” said Deputy Defence Minister Anatoly Antonov.
“Maybe I’m being too blunt, but one can only entrust control over this thieving business to one’s closest associates.”
“In the West, no one has asked questions about the fact that the Turkish president’s son heads one of the biggest energy companies, or that his son-in-law has been appointed energy minister. What a marvelous family business!”
“The cynicism of the Turkish leadership knows no limits. Look what they’re doing. They went into someone else’s country, they are robbing it without compunction,” Antonov said.
And he is right.
The Erdogan family is knee deep in this scandal, and Barack Obama has known about it the entire time. For much more on the involvement of the Erdogan family in the smuggling of ISIS oil, please see my previous article entitled “The Biggest Obama Scandal? He Knows That Turkey Is Buying Oil From ISIS And He Is Doing Nothing To Stop It“.
During his presentation, Antonov gave us a lot of specifics. He even claimed that the Russians know precisely where much of this stolen oil ends up. The following comes from an Infowars report…
“The western route goes to Turkish ports on the Mediterranean coast, the north—to the refinery Batman in Turkey and the east—to the largest transshipment base in the village of Cizre,” theRussian Ministery of Defense web page states.
Oil from fields near the Syrian city of Raqqa—said to be the capital city of the Islamic State—is transported at night through the border town of Azaz, Syria and Reyhanli, Turkey to the port of Iskenderun and Dörtyol where the stolen oil is loaded on tankers.
The Russians claim the convoys are under the control of al-Nusra, the terror group funded by the Gulf Emirates and that cooperates with the Islamic State and supposed moderates in the Free Syrian Army.
Posted below is one of the charts that Antonov used during his presentation. As you can see, the Russians are not just making “vague accusations”…

If you would like to watch video of Antonov’s entire presentation, you can do so right here. What Antonov is saying in the video has been translated into English, so you will be able to understand it.
To me, one of the most striking things about the presentation was when Antonov accused the Turks of supplying fighters, ammunition and vehicles to ISIS and Al-Nusra. The following comes from an RT article…
Up to 2,000 fighters, 120 tons of ammunition and 250 vehicles have been delivered to Islamic State and Al-Nusra militants from Turkish territory, chief of National Centre for State Defense Control Lt.Gen. Mikhail Mizintsev said.
“According to reliable intelligence reports, the Turkish side has been taking such actions for a long time and on a regular basis. And most importantly, it is not planning to stop them.”
If any of these allegations are true, Turkey should be immediately kicked out of NATO.
And if Barack Obama knew about any of this and refused to stop it, he should be facing impeachment proceedings.
For the moment, the official position of the U.S. government is that nothing that the Russians are saying is true…
Following Russian accusations, the US has again defended Turkey, denying any ties between Ankara and Islamic State.
“We flatly reject any notion that the Turks are somehow working with ISIL. Preposterous. And really very, kind of ridiculous,” Steve Warren, Pentagon spokesman, said.
Really?
As an American, I am utterly embarrassed that our “leaders” would continue to try to deny what Turkey is doing after everything that has come out.
By flat out lying to the world, we are losing any credibility that we had left.
Hundreds of millions of dollars worth of stolen oil has been smuggled into Turkey, and our government still has the audacity to try to tell us not to look behind the curtain?
No wonder why most people over in Iraq are convinced that the U.S. is actually on the same side as ISIS. They don’t trust anything that we have to say anymore. The following comes from the Washington Post…
Ordinary people also have seen the videos, heard the stories and reached the same conclusion — one that might seem absurd to Americans but is widely believed among Iraqis — that the United States is supporting the Islamic State for a variety of pernicious reasons that have to do with asserting U.S. control over Iraq, the wider Middle East and, perhaps, its oil.
“It is not in doubt,” said Mustafa Saadi, who says his friend saw U.S. helicopters delivering bottled water to Islamic State positions. He is a commander in one of the Shiite militias that last month helped push the militants out of the oil refinery near Baiji in northern Iraq alongside the Iraqi army.
The Islamic State is “almost finished,” he said. “They are weak.If only America would stop supporting them, we could defeat them in days.”
If we are going to continue to lie about the hundreds of millions of dollars worth of stolen oil that has been smuggled into Turkey, why should anyone believe anything else that we have to say?
The Obama administration and the Turkish government have been caught in a massive, massive lie.
In the end, this is the kind of scandal that could potentially bring down the Obama administration, leaders in Congress, and many among the top brass in the U.S. military.
So what do you think about this emerging scandal?
Please feel free to share your thoughts by posting a comment below…
Michael T. Snyder is a graduate of the McIntire School of Commerce at the University of Virginia and has a law degree and an LLM from the University of Florida Law School. He is an attorney that has worked for some of the largest and most prominent law firms in Washington D.C. and who now spends his time researching and writing and trying to wake the American people up. You can follow his work on The Economic Collapse blog, End of the American Dream and The Truth Wins. His new novel entitled “The Beginning Of The End” is now available on Amazon.com.
Zuma Sparks Outrage in South Africa by Firing Finance Minister
Jacob Zuma’s decision to replace his finance minister with a relative unknown is the biggest in a series of controversies and scandals that have marred his more than six years as South Africa’s president. This time, the impact on the economy may finally start to erode his support.
Zuma’s announcement late Wednesday that lawmaker David van Rooyen would replace Nhlanhla Nene sparked public outrage and drove the rand to a record low against the dollar, while stocks slid and bond tumbled. #ZumaMustFall was the top trending Twitter hashtag in South Africa and talk shows were flooded with calls for Zuma to resign. The Congress of South African Trade Unions, the country’s largest labor group and staunch supporter of the ruling African National Congress, said it was “shocked and disconcerted.”

“It’s a disaster,” said Pierre du Toit, a politics professor at the University of Stellenbosch. “The decisions he is taking are those of a man who doesn’t understand that his own interests are tied to that of South Africa within a global political economy. He doesn’t understand the world we are living in.”
Economy Flounders
Africa’s second-largest economy has floundered since Zuma, a former intelligence operative with no formal education, took power in May 2009. The government has introduced a series of laws that companies say discourage investment. Policy decisions, such as the capping of university fees, are taken without proper budgeting. And key state-owned companies have suffered a management vacuum and wrung up massive losses.
“A decision of this magnitude with such bad timing will have consequences for the president,” Daniel Silke, director of Cape Town-based Political Futures Consultancy, said by phone. “He is likely to face a further erosion of support from moderate business interests within the ANC, who themselves will be damaged by economic instability.”

While many government entities are largely dysfunctional, the National Treasury is well regarded, and Nene and his two predecessors, Pravin Gordhan and Trevor Manuel, were widely respected. Zuma hasn’t given a reason for replacing Nene, who held the post for just 19 months.
Zuma Crosses Line
“The government has crossed a line which it hasn’t crossed for the last 20 years,” Steven Friedman, director of the Center for the Study of Democracy, said by phone from Johannesburg. “This is really effectively the first finance minister to be fired since 1994. The accurate perception is that the reason he was fired is that he was doing his job, insisting on fiscal discipline.”
While Zuma announced in February that the government had taken a decision to build new nuclear plants, Nene insisted that South Africa had to be able to afford them. Nene also clashed with the chairwoman of South African Airways, Dudu Myeni, a former schoolteacher who also heads Zuma’s charitable foundation, after he refused the national carrier permission to restructure a plane leasing deal.
“It is common knowledge that Nhlanhla Nene sought to rein in excessive government spending and was causing too much of a blockage for President Zuma in respect of the nuclear procurement deal and SAA,” Mmusi Maimane, the leader of the main opposition Democratic Alliance, said by e-mail. This is “yet another example of how President Zuma puts himself first and the country second.”
Political Scandals
Zuma has shrugged off a myriad of previous political scandals. He was fired as deputy president in 2005 after being charged with taking more than 700 bribes from arms dealers, but the case was dropped just weeks before he was appointed president. Zuma, a polygamist with four wives, was acquitted of rape charges and admitted he fathered a child out of wedlock with a friend’s daughter. More recently he’s been accused of squandering taxpayers’ money in a 215-million-rand ($14 million) upgrade of his private home. He denies any wrongdoing.
In 2013, family friends of Zuma, the Guptas, flew 217 people in a chartered jetliner to the Waterkloof air-force base in Pretoria for their niece’s wedding. A government report into the scandal that became known as “Guptagate” concluded that the landing had been authorized because Zuma’s name was falsely invoked.
The president’s power stems from his dominance of the ANC, which has run the country since apartheid ended in 1994. He has appointed allies to key posts and shored up his popular support by extending welfare grants to more than 16 million people, or 1 in 3 South Africans. His current term as ANC leader runs until 2017 and as president until 2019.
Hold On Power
“Whilst on paper Zuma looks as though he controls all the levers of power, the reality on the ground is that his actions will weaken his administration and sow seeds of internal distrust and distress in the way South Africa is being governed,” Silke said.
Van Rooyen isn’t the first unknown to be appointed to a key cabinet post. In September, Zuma named Mosebenzi Zwane, a lawmaker whose previous political apex was in the government of the rural Free State province, as mines minister even though he had no experience in the industry.
Among his other appointees was Energy Minister Tina Joemat-Pettersson, who the nation’s graft ombudsman accused of wasting state funds and violating state tender rules. Bheki Cele was fired as the nation’s police commissioner after the ombudsman found he acted unlawfully when a board of inquiry found him unfit to hold office.
While Van Rooyen’s appointment probably won’t immediately loosen Zuma’s grip on power, it may cost the ANC support in next year’s local government elections and that may ultimately backfire on the president, according to Friedman.
“This is a bit more of a complicated issue than one bad guy,” Friedman said. “The president is part of it, but he is not the only part of it. If the result from this is very negative in the market place, which it so far has been, the obviously pressure builds up and people start saying: ‘Why did you get us into this mess?’”
end
With the firing of Nene, South African bond yields climb to 10.2% while the rand touches now 15.3 to the dollar. Credit default swaps rise making South Africa the 10th most likely nation to default
(courtesy zero hedge)
South African Bonds Crash, Rand Hits Record Low After FinMin Fired
Without giving any reasons, South African President Jacob Zuma has fired his finance minister (after just 19 months in office). This has shocked investors, already anxious about the nation’s surging debt and sluggish economy and South African bonds and FX have collapsed. 10Y yields spiked 140bps to 10.18% – the highest since July 2008– and CDS have soared.The Rand has crashed to new record lowsabove 15 to the USD.
The Rand has collapsed to record lows…

Bonds have crashed to 7 year high yields

And South Africa is now the 10th riskiest sovereign in the world…

The shock move came less than a week after credit-rating companies pushed the nation closer to junk status, citing concerns over a sluggish economy and rising debt. Nene’s departure, and uncertainty relating to his successor, raises questions about whether the National Treasury can stick to its spending targets.
“Especially at this point in time, we can ill afford to antagonize international investors,” Mohammed Nalla, head of strategic research at Nedbank Group Ltd., said by phone from Johannesburg. “An event of this magnitude can even be the catalyst for a credit-rating downgrade to junk status. It could lead to a complete loss of investor confidence in South Africa, which could push us into a recession.”
“We are not so concerned about the person but rather whether Treasury controls the line on fiscal deficits and the debt stock, which we are watching,” Ravi Bhatia, director of sovereign ratings at Standard & Poor’s in London, said in an e-mailed response to questions. “South Africa is on negative outlook and our concerns highlighted in our last outlook statement remain.”
The economy is under strain because of plunging metal prices and power constraints. The central bank is forecasting growth of 1.4 percent this year, which would be the slowest pace since the 2009 recession.
Investors are concerned that “worsening macro performance will lead to a more politicized approach to fiscal policy and structural reform,” Arnab Das, head of EM Macro at Invesco in London, said by e-mail. “There is also a threat that further ratings downgrades may well lead to South Africa’s exclusion from global government bond indices in the next one to two years.”
Commerzabnk adds that President Jacob Zuma’s timing in removing Finance Minister Nhlanhla Nene “could not have been worse,” Peter Kinsella, head of EM FX research at Commerzbank, says in note.
Sacking has given rating agencies “perfect justification” for further downgrades and the loss of investment grade status
Investors should be cautious towards the rand, given that carry-trade strategies are “hardly working” and the commodity-price slump shows no signs of ending
“Put simply, this is no time to talk about valuation concepts for ZAR. Such strategies didn’t work before and are unlikely to now”
“If you are of the view that the majority of interest rate rectification by SARB has already taken place, then it makes little sense to liquidate bond positions at current levels”
The incoming Van Rooyen is the third finance minister since Zuma came to power in 2009. In that period, gross debt has surged from about 26 percent of gross domestic product to almost 50 percent.While Nene has sought to contain spending in a bid to rein in a widening budget deficit, his efforts have been frustrated by the government awarding above-inflation wage increases to workers over three years.
So that explains the carnage in capital markets.. the guy who wanted to instil at least some fiscal discipline… has been fired.
Charts: Bloomberg
Euro/USA 1.0951 down .0063
USA/JAPAN YEN 121.43 down .255
GBP/USA 1.5159 down .0018
USA/CAN 1.3548 down .0018
Early this morning in Europe, the Euro fell by 63 basis points, trading now just above the 1.09 level rising to 1.0951; Europe is still reacting to deflation, announcements of massive stimulation (QE), a proxy middle east war, and the ramifications of a default at the Austrian Hypo bank, an imminent default of Greece, Glencore, Nysmark and the Ukraine, along with rising peripheral bond yield, and now further stimulation as the EU is moving more into NIRP and moving in the opposite direction that they were suppose to with the USA tightening on Dec 16. Last night the Chinese yuan down in value (onshore). The USA/CNY up in rate at closing last night: 6.4422 / (yuan down)
In Japan Abe went all in with Abenomics with another round of QE purchasing 80 trillion yen from 70 trillion on Oct 31/2014. The yen now trades in a northbound trajectory as settled up again in Japan by 26 basis points and trading now closer to that all important 120 level to 121.43 yen to the dollar. However the yen carry trade is ceasing!
The pound was down this morning by 18 basis points as it now trades just above the 1.50 level at 1.5159.
The Canadian dollar is now trading up 18 in basis points to 1.3548 to the dollar.
We are seeing that the 3 major global carry trades are being unwound. The BIGGY is the first one;
1. the total dollar global short is 9 trillion USA and as such we are now witnessing a sea of red blood on the streets as derivatives blow up with the massive rise in the rise in the dollar against all paper currencies and especially with the fall of the yuan carry trade. The emerging market which house close to 50% of the 9 trillion dollar short is feeling the massive pain as their debt is quite unmanageable.
2, the Nikkei average vs gold carry trade (blowing up)
3. Short Swiss franc/long assets (European housing/Nikkei etc. This has partly blown up (see Hypo bank failure).(blew up)
These massive carry trades are terribly offside as they are being unwound. It is causing global deflation ( we are at debt saturation already) as the world reacts to lack of demand and a scarcity of debt collateral. Bourses around the globe are reacting in kind to these events as well as the potential for a GREXIT>
AND NOW WE AWAIT THE DECISION OF THE USA TO RAISE RATES AND THE DILEMMA THEY FACE. SOMEONE ELSE MUST DO QE TO REPLACE LOST LIQUIDITY (800 billion of liquidity will be withdrawn on a 1/4% rise in rates)
The NIKKEI: this THURSDAY morning: closed down 254.52 or 1.32%
Trading from Europe and Asia:
1. Europe stocks all in the red
2/ Asian bourses mostly in the red … Chinese bourses: Hang Sang red (massive bubble forming) ,Shanghai in the red even with gov’t intervention / (massive bubble ready to burst), Australia in the red: /Nikkei (Japan) red/India’s Sensex in the green/
Gold very early morning trading: $1074.00
silver:$14.20
Early THURSDAY morning USA 10 year bond yield: 2.22% !!! up 1 in basis points from WEDNESDAY night and it is trading well below resistance at 2.27-2.32%. The 30 yr bond yield rises to 2.97 or up 1 in basis points.
USA dollar index early THURSDAY morning: 97.79 up 40 cents from WEDNESDAY’s close. ( Now below resistance at a DXY of 100)
This ends early morning numbers THURSDAY MORNING
OPEC Production Hits Three-Year High As Oil Price Resumes Slump
The latest confirmation that the oil cartel formerly known as OPEC is effectively non-existent, came a little over an hour ago when in its latest November monthly report, the Organization of Petroleum Exporting Countries reported that total monthly crude output for the member nations rose to 31.695 million barrels per day, the highest amount produced in three and a half years.
The production boost was driven not so much by the wildcard Iran (whose own supply will hit the global market in the near future) but by Iraq, as the second biggest oil producer in OPEC Pumped 4.3 million bpd, an increase of 247,500 barrels from the previous month, offsetting a modest 25,200 barrel decline from Saudi Arabia.

Bloomberg reports that Iraq has pushed output to record levels this year as international companies develop fields in the south, while the semi-autonomous Kurdish region increases independent sales in the north, according to the International Energy Agency. Production had dipped in October as storms delayed southern loadings and as flows through the northern pipeline were disrupted, according to Iraq’s Oil Ministry.
This was the highest monthly production since April 2012, and shows that even OPEC’s recently announced production ceiling of 31.5 million barrels was already breached even before it was introduced.

Some other highlights from the report (link):
- OPEC says in its monthly report that demand for its crude is at 29.4M barrels/day this year – lower than its current output and 200K less than previous estimates. But it’s keeping 2016’s demand view steady at 30.8M and still anticipates global demand rising about 1.25M barrels/day next year versus 2015’s projected increase of 1.5M. OPEC cautions its “oil-demand forecast for 2016 is subject to considerable uncertainties–depending on the pace of economic growth, development of oil prices and weather conditions, as well as the impact of substitution and energy policy changes.” – WSJ
- OPEC trims supply estimates for outside the group in 2016 by 250K barrels/day to 57.1M as it expects the price plunge to take its toll on the US oil industry and other producers near-term. It notes US shale-oil production had been declining since April, and “this downward trend should accelerate in coming months given various factors, mainly low oil prices and lower drilling activities.” – WSJ
According to Global Risk Management oil risk manager Michael Poulsen, “Nothing much has changed even though the market has interpreted OPEC abandoning its output target as a signal that everybody will produce more.” OPEC has been very happy to prove the “market” right, as the race to the production bottom goes full throttle.
As Bloomberg adds, “non-OPEC supply will fall by 380,000 barrels a day next year, averaging 57.14 million a day, with an expected contraction in the U.S. accounting for roughly half the drop, the organization said Thursday in its monthly report. It increased estimates for non-OPEC supply in 2015 by 280,000 barrels a day. The group maintained projections for the amount of crude it will need to pump next year at 30.8 million barrels a day.”
Somehow we doubt OPEC’s forecasts for non-OPEC supply falling will prove accurate especially if US shale contnues to rely on cheap junk bonds to fund its money losing operations as banks are terrified to reveal just how undercollateralized their loans to the sector are, while Russia continues to pump increasingly more in its own private battle to capture as many marginal buyers as it can in this period of major dislocation within the oil producers.
Finally, as can be seen in the chart below, the impact of the report was to promptly squash any hopes that oil may have had for even a modest price rebound today (at least until the algos take over 30 minutes ahead of the NYMEX close at 2:30pm in the well-documented “banging the upside close” phenomenon).

end
ConocoPhillips cuts its capex amid the oil price decline. As David Stockman states in his commentary last night, we have a cap ex depression:
(courtesy zero hedge/ConocoPhillips)
ConocoPhillips Cuts Capex Amid Intractable Oil Rout
It’s a bad time to be in the commodities business.
Crude is in a veritable tailspin as an increasingly disjointed OPEC ramps production to three-year highs…
…and the thanks to a worldwide deflationary supply glut, the Bloomberg commodities index is sitting near its lowest levels of the 21st century portending doom and gloom for prices across the entire commodities complex.
For producers, this means three things: layoffs, asset sales, and capex cuts. Earlier this week Anglo American unveiled a shocker of a reorganization that included the elimination of 60% of the workforce and asset sales that amount to nearly two thirds of the company’s entire portfolio.
On Thursday, we get the latest round of desperate cost saving measures as oil major ConocoPhillips slashes capex by some 25% and looks to raise $2.3 billion from asset sales.
Here’s WSJ with the summary:
ConocoPhillips estimated capital expenditures of $7.7 billion for next year, a 25% decline from the reduced levels the oil major expects to spend for 2015.
During October, Conoco had trimmed its 2015 spending plans again after reporting a wider-than-expected loss for its third quarter. At the time, Conoco projected 2015 capital spending of $10.2 billion, down from its prior guidance of $11 billion. It also lowered its operating cost outlook to $8.2 billion from $8.9 billion.
Chairman and Chief Executive Officer Ryan Lance said in prepared remarks Thursday that the company’s plan for next year highlights actions Conoco accelerated over the past year to position the company for low and volatile prices.
On Wednesday, Chevron Corp. projected capital spending plans for 2016 of $26.6 billion, which the oil giant said is 24% below expected capital and exploratory spending this year.
Full PR:
end
The low price of oil causes Alaska to reintroduce a personal income tax for the first time in 35 years:
(courtesy zero hedge)
Cheap Oil’s First US Casualty: Alaska Forced To Tax Personal Income For First Time In 35 Years
With sadly ironic timing, we noted just last week that the blowback from “unequivocally good” low oil prices was set to cross the border from an increasingly suicidal Canada, and so, as AP reports, it appears Alaska is facing the toughest of times. As oil prices make new cycle lows, Alaska Gov. Bill Walker has called for the state’s first income tax in 35 years in order to close a $3.5-billion-dollar deficit the state is carrying. Alaska is currently the only state that does not have a state sales tax or personal income tax, having relied on oil income but, as Walker tweeted, “now is the time for Alaskans to pull together.”
Alaska is one of seven states without an individual income tax, and it’s the only state to have repealed an existing income tax, according to the Tax Foundation, an independent tax policy research organization.
- States with no income tax: Alaska, Florida, Nevada, South Dakota, Texas, Washington, Wyoming.
- States with nearly no income tax: Tennessee, New Hampshire
In 1980, after oil began coursing through the pipeline, the Legislature voted to repeal the income tax. Two years later, the first dividends were paid.
Alaska has long relied heavily on oil revenue. In recent years, it provided about 90 percent of the money available for lawmakers to spend. That’s down to about 75 percent, the state Revenue department says.
But, as daily oil production has dropped to 500,000 barrels, and after the recent crash in prices, the state relied on savings to cover about $3.7 billion of its $6 billion budget last year, so this ‘tax advantage’ will soon change, as AP reports, Alaska Gov. Bill Walker is proposing instituting a personal income tax for the first time in 35 years as the oil-dependent state looks to plug a multibillion-dollar budget deficit amid chronically low prices.
In laying out his budget plan Wednesday, Walker also proposed using the fund that provides annual checks to most Alaskans to generate a stream of cash to help finance state government. The plan would change how dividends are calculated and mean lower checks, at least initially — with 2016 payouts about $1,000 less than this year’s.
Alaska isn’t alone among oil-producing states to experience hard times as oil prices stay low. But unlike states like Texas or Louisiana, Alaska has few other industries to make up the difference.
Walker’s proposal also includes:
- Adding a dime to every drink of alcohol and $1 per pack of cigarettes.
- Additional budget cuts.
- Changes to the oil tax credit system, a big budget item.
- Increases to industry taxes including mining, fishing and oil.
The administration says the goal was to spread the burden as widely as possible and that even with the proposed increases, the tax burden on individual Alaskans would be among the lowest nationally.
Alaska has been using savings to balance its budget but is blowing through its reserves at an estimated rate of $10 million a day. The state has been warned its bond rating could be lowered if it doesn’t do more to address the deficit. A hit to the credit rating could increase the state’s cost of borrowing and make it harder to finance a major gas project that Walker sees as critical to the state’s financial future.
Walker’s proposal includes a personal income tax – last levied in Alaska three-and-a-half-decades ago – of 6 percent of federal taxes, or an average of 1.5 percent of total income, which would raise a projected $200 million.

The Alaska Dispatch News reports that Wielechowski, the East Anchorage Democratic senator, argued that Walker’s plan was “very regressive” – it would have a disproportionate impact on Alaskans with lower incomes, while leaving the state’s big oil companies largely unscathed.
“They are probably popping champagne corks in London and Texas over this plan,” he said in a statement, referring to the headquarters of Alaska’s biggest oil producers.
In a phone interview, Wielechowski said his preference is to increase taxes on oil companies and spend savings while waiting for oil prices to go up.
The reduced dividend, combined with the new income tax would have a big impact on his constituents, he said.
“It’s about a $5,000 hit for a family of four” with a $50,000 annual income, he said. “Is the Legislature going to vote to whack people’s Permanent Fund dividends in half?”
Having taken to Twitter to call for support for his raise-taxes-and-slash-spending plans, Walker faced a ‘mixed’ response…
“Alaska government is lazy,” wrote Alex Rivera. “How could they not have seen this coming? How incompetent can you be?”
“Do what is best for Alaska,” wrote Alexandria Miles. “We support you.”
Why is this happening? As we noted last week,
Simply because the price of a commodity has dropped to a third of what it was just over a year ago, and the shocking impact has been a paralysis of every aspect of financial, economic and social life, first in Alberta, and soon everywhere else across Canada, as the local recession (on its way to a depression) spreads across the country and eventually crosses the U.S. border.
And cross the border it has.
Portuguese 10 year bond yield: 2.44% down 2 in basis points from WEDNESDAY
The Nasdaq up 22.31 or 0.44%
Markets ‘Bounce’ As Oil Margin-Call-Plunge Sparks Buying-Panic In Energy Stocks
Initial and continuing claims surge dramatically and Crude slammed to 12-year lows inflation-adjusted, so energy stocks rip and lift stocks magically…

h/t @NorthmanTrader
Energy stocks love new multi-year lows in oil…

Longer term…

And led the entire market higher today… but a late-day collapse in crude (which looked like forced liquidation) spoiled the party

Small Caps bounced hard into the close as Trannies won on the day

But all majors remain underwater on the week…

Gunmakers were briefly sold today, but that dip was ripped…GUNs Trump FANGs

FANGs not happy this week (but remember Cramer said “don’t sell”)

Credit markets notably decoupled…

Treasury yields inched higher today with the long-end outperforming (bear flatteners)…

The US Dollar drifted higher today but remains notably below ECB-fail day lows…CAD remains weakest (note the surge in AUD after last night’s ridiculous jobs data)…

As Yuan keeps plunging…
Finally, commodities… Gold, silver, and copper tread water in the green as crude collapses post-OPEC…

And on the day crude tumbled early after the monthly OPEC report showed increase to fresh 3 year high output…

Now down dramatically post-OPEC…

Finally, we note that on an inflation-adjusted basis, WTI just hit a 12 year low…

Charts: Bloomberg
China Exports Most Deflation To The US Since The Financial Crisis
Today’s import price index report from the BLS showed a modest improvement at the headline level: declining by 0.40% this was half the expected decline of -0.80% and a modest pick up from last month’s -0.50%. A big reason for this continues to be oil, which saw a -2.5% drop in November after a 0.1% increase the prior month, with import prices for non-fuel products down -0.2%, the highest since June.
Annually, the pace of declines also picked up modestly dropping “only” -9.4% from a year ago, higher than the -10.50% slide in October. Import prices have now seen an annual decline for 16 consecutive months starting in July 2014.

Some more details from the report:
Fuel Imports: Fuel prices resumed a downward trend in November, declining 2.5 percent following a 0.1-percent uptick the previous month. The price index for import fuel decreased 24.9 percent between June and September. A 2.5-percent drop in petroleum prices and a 4.6-percent decline in natural gas prices both contributed to the November decline in overall import fuel prices. Prices for overall fuel fell 43.2 percent over the past 12 months, after decreasing 15.9 percent between November 2013 and November 2014. Petroleum prices declined 44.5 percent over the past year, while prices for natural gas fell 32.3 percent.
All Imports Excluding Fuel: The price index for nonfuel imports also decreased in November, falling 0.2 percent following 0.3-percent declines in each of the previous 4 months. Lower prices for nonfuel industrial supplies and materials; foods, feeds, and beverages; capital goods; and automotive vehicles all factored into the November decline in nonfuel import prices. Prices for nonfuel imports decreased 3.2 percent for the year ended in November. Prices for nonfuel industrial supplies and materials; foods, feeds, and beverages; and each of the major finished goods categories all fell over the past 12 months.
And while the headline figure suggested there is some hope that import prices will improve at the headline level in the coming months, something else has emerged which suggests that the real importing of others’ deflation is only just starting. Or rather, someone else.
China.
Here are the details from the report:
Prices for imports from China declined 0.3 percent in November, matching a 0.3-percent decrease in May. Those were the largest monthly drops since the index fell 0.6 percent in May 2013. Import prices from China decreased 1.5 percent over the past 12 months, the largest year-over-year drop since the index declined 1.7 percent for the year ended in January 2010.
This means that China just exported the most deflation to the US since the financial crisis!
So if China’s intention was to join Japan and Europe in exporting its deflation to the US, despite the CNY peg to the USD, it has succeeded as shown below.

What is going on here? Simple: with all of its domestic markets fully saturated, China has had no choice but to export its soaring commodity production as we explained in “Behold The Deflationary Wave: How China Is Flooding The World With Its Unwanted Commodities.” This is how Bloomberg qualified the problem:
Shipments of steel, oil products and aluminum are reaching for new highs, according to trade data from the General Administration of Customs.
That’s because mills, smelters and refiners are producing more than they need amid slowing domestic demand, and shipping the excess overseas.
The flood is compounding a worldwide surplus of commodities that’s driven returns from raw materials to the lowest since 1999, threatening producers from India to Pennsylvania and aggravating trade disputes. While companies such as India’s JSW Steel Ltd. decry cheap exports as unfair, China says the overcapacity is a global problem.
The flood of Chinese supplies is roiling manufacturers around the world and exacerbating trade frictions. The steel market is being overwhelmed with metal from China’s government-owned and state-supported producers, a collection of industry associations have said. The nine groups, including Eurofer and the American Iron and Steel Institute, said there is almost 700 million tons of excess capacity around the world, with the Asian nation contributing as much as 425 million tons.
Low-cost supply from China in Europe prompted producer ArcelorMittal to reduce its profit forecast and suspend its dividend. India’s government has signaled it’s planning more curbs on steel imports while regulators in the U.S. are planning to lift levies on shipments from some Chinese companies.
And judging by the relentless surge in exports of Chinese commodities, China’s deflationary wave not only to the US, but the entire world, is only just starting.

So unless the Fed is ready to devalue its own currency, get ready for wholesale inflation to tumble as the US is on deck to import near record amounts of Chinese deflation in the coming months and years, especially if China continues to devalue its currency, either stealthily or not so stealthily as it did in August and as many expect it will do again in the coming months.
Initial Jobless Claims Suddenly Surge To 5-Month Highs, Continuing Claims Spike
Weak surveys, mass layoffs, and poor outlooks appear to have finally rippled through the government’s data and sparked a significant rise in initial jobless claims. Up 13k to 282k, this is the highest claims since early July. Of course, it remains below the Maginot Line of 300k which ‘proves’ everything is awesome, but initial claims is now at the same level as it was when The Fed ended QE3. Perhaps more notable is the spike in continuing claims (up 3.8%) – the end biggest jump since 2008 to 3 month highs.
Big jump in initial claims…

but continuing claims saw their 2nd biggest weekly rise since 2008…to 3 month highs.

So what happens next?

Charts: Bloomberg
In Lehman Rerun, Banks Are Buying Protection Against Their Own Systemic Demise Again
At the peak of the craziness of the last cycle, banks took to protecting themselves by buying (credit) protection on other banks as a ‘hedge’ for systemic risk (which instead exacerbated contagion concerns, seemingly missing the facts that their bids drove risk wider, increasing counterparty risks, and that the inevitable collapse required to trigger these trades would also mean the payoffs to the ‘hedges’ would never be realized). Fast forward 8 years and it appears once again, as Bloomberg reports, that banks are buying (equity) protection in order to hedge the stress-test downside scenarios enforced by The Fed.
For more than a year, dealers in the U.S. equity derivatives market have noted a widening gap in the price of certain options. (chart below shows the absolute premium for downside protection over upside protection)

If you want to buy a put to protect against losses in the Standard & Poor’s 500 Index, often you’ll pay twice as much as you would for a bullish call betting on gains.(chart below shows the relative premium for downside protection over upside protection)

New research suggests the divergence is a consequence of financial institutions hoarding insurance against declines in stocks.As Bloomberg details,
While various explanations exist including simply nervousness following a six-year bull market, Deutsche Bank AG says in a Dec. 6 research report that the likeliest explanation may be that demand is being created for downside protection among banks that are subject to stress test evaluations by federal regulators. In short, financial institutions are either hoarding puts or leaving places for them in their models should markets turn turbulent.
“Since so many banking institutions are facing these stress tests, the types of protection that help banks do well in these scenarios obtain extra value,” said Rocky Fishman, an equity derivatives strategist at Deutsche Bank.
“The way the marketplace has compensated for that is by driving up S&P skew.”
The Federal Reserve’s Comprehensive Capital Analysis & Review, or CCAR, has become one of the most important annual events for the largest banks. It determines whether trading units, including equity derivatives, can handle a market shock and pay out capital to shareholders. In the test, banks must demonstrate that they can weather a crisis and stay above minimum capital ratios even as their amount of equity is reduced by losses and the planned dividends and buybacks.
One aspect of the stress test is gauging how banks respond to what’s the Fed describes as a “severely adverse” scenario. It’s the most extreme of three situations laid out by the central bank during the annual CCAR.
“One of the reasons S&P puts have been so expensive relative to at-the-money options this year is that the severely adverse scenario prescribed by CCAR program implies a very negative shock to the S&P,” said Fishman. “It creates value for the downside options.”
Of course, we have seen this kind of systemic hedging by banks before. When banks bought credit protection against other banks during the last crisis. Still, the Fed stress tests remain the cornerstone of the U.S. central bank’s efforts to prevent a repeat of the 2008 financial crisis and to gauge the ability of banks to withstand economic turmoil. To Dan Deming of KKM Financial LLC, their presence will have a lasting effect on risk tolerance.
“Risk requirements have ramped up to a point where market participants are forced to buy downside puts as an insurance policy against open option positions,” said Deming. “What was perceived as reasonable risk five years ago is no longer seen as reasonable amid all the new requirements.”
But what regulators (since we are sure the banks know) miss in their math is that these so-called hedges only payoff when a systemic collapse happens and, in the case of the last crisis, the actual assumed payoff disappears as counterparty collateral chains dry up, banks implode, and just when you needed the hedge the most… there is no one left to pay you.
Charts: Bloomberg
end
Somebody big as blown up. Now Third Avenue Hedge Fund has blocked redemptions stating illiquidity and investors will be hurt if they liquidate now
(courtesy zero hedge)
The Next Leg Of The Junk Bond Crisis: Third Avenue “Focused Credit Fund” Liquidates, Gates Redemptions
Moments ago, we learned courtesy of the head of Mutual Fund Research at Morningstar, Russ Kinnel, that the next leg of the junk bond crisis has officially arrived, after Third Avenue announced it has blocked investor redemptions from its high yield-heavy Focused Credit Fund, which according to the company has entered a “Plan of Liquidation” effective December 9.
The redemption block takes place after the fund lost some 27% in 2015, with assets plunging by a whopping 66%.
This is what happened:
We believe that, with time, FCF would have been able to realize investment returns in the normal course. Investor requests for redemption, however, in addition to the general reduction of liquidity in the fixed income markets, have made it impracticable for FCF going forward to create sufficient cash to pay anticipated redemptions without resorting to sales at prices that would unfairly disadvantage the remaining shareholders.
As a result, all shareholders will be equally disadvantaged.
How long will investors have to wait for the “Liquidating Trust” to become, well, liquid? Quite a while:
In line with its investment approach, FCF has some investments in companies that have undergone restructurings in the last eighteen months, and while we believe that these investments are likely to generate positive returns for shareholders over time, if FCF were forced to sell those investments immediately, it would only realize a portion of those investments’ fair value given current market conditions. We believe that doing so would be contrary to the interests of all of our shareholders, which is why we have taken steps to protect shareholder value by returning cash and implementing the Liquidating Trust to seek maximum value for these investments.
At least it won’t cost you anything:
Third Avenue will manage the Liquidating Trust in order to obtain the best overall outcome for the beneficiaries. Third Avenue will not charge any fee for those services.
Finally:
Third Avenue is extremely disappointed that we must take this action.
So is everyone else:
Here is the official statement
end
Dave Kranzler on Monday and Tuesday talked about the mess at Kinder Morgan. Now David Stockman lays it out in easy to see fashion how these guys are going to fail
a must read…
(courtesy David Stockman)
Kinder Morgan——Poster Boy For Bubble Finance
by David Stockman • December 10, 2015


The graph below belongs in the “what were they thinking category”.
After Tuesday’s dividend massacre, it’s plain as day that Kinder Morgan (KMI) wasn’t the greatest thing since slice bread after all. That is, a “growth” business paying rich dividends out of rock solid profit margins and flourishing cash flow.
In fact, it was just a momo stock on a borrowing spree.
During the 27 quarters since the beginning of 2009, the consolidated entities which comprise KMI generated $20.8 billion of operating cash flow, but spent $24.3 billion on CapEx and acquisitions.
So the “growth” side of the house ended-up in the red by $3.5 billion. Presumably that’s because it was “investing” for long haul value gains.
But wait. It also had to finance those juicy dividends, and there was a reassuring answer for that, too. The payout was held to be ultra safe owing to KMI’s business model as strictly a toll gate operator in the oil and gas midstream, harvesting risk-free fees from gathering systems, transportation pipelines and gas processing plants.
Accordingly, even when its stock price was riding high north of $40 per share, the yield was 5%. So over the last 27 quarters KMI paid out $17.3 billion in dividends from cash it didn’t have.
It borrowed the difference, of course, swelling its net debt load from $14 billion at the end of 2009 to $44 billion at present. And that’s exactly the modus operandi of our entire present regime of Bubble Finance.
Kinder Morgan is the poster boy.

Yes, you can chalk this off to another “lesson learned” in the Wall Street casino. After all, some definable group of investors and speculators thought they owned $98 billion of market cap a few months ago, and now their accounts are suddenly $60 billion lighter—–including about $7 billion of bottled air that evaporated from the net worth of its founder and indefatigable promoter, Richard Kinder.
But in the alternative, perhaps its time to recognize that healthy, properly functioning free markets do not make egregious $60 billion “mistakes” such as this one over and over. What surely led to the insane peak valuation of KMI is the relentless scramble for yield that has been triggered by 84 months of ZIRP and endless coddling of the stock market by the Fed and other central banks.
The fact is, during the last 31 quarter (i.e. since Q1 2008) KMI has posted the grand total of $900 million in cumulative net income. This means that at its peak April valuation it was trading a 100X the totality of what it had earned during nearly an entire decade; and that during that period it paid out 17 times more in dividends than it earned.
That’s right. The Wall Street gamblers and punters had followed the pied piper of Houston right out of Enron, and into an even greater bubble predicated on the same old scam.
Indeed, KMI is a pipeline company just like Enron. It’s original building block, Enron Liquids Pipeline, was purchased by Richard Kinder and his partner for $40 million back in the late 1990s.
Yet it had no more chance of being worth $100 billion than Enron had of being worth $60 billion before its implosion. It didn’t even have the razz mataz of a fiber optics trading business or a franchise to bring power and light to impoverished villages of India.
The apologists are want to argue, of course, that net income doesn’t mean anything when it comes to valuation. Perhaps we should therefore dispense with the several billions spent annually by the SEC, DOJ and sundry state attorneys general hauling business executives to court and jail for violating GAAP.
On the other hand, there is a reason why GAAP accounting statements require that asset write-offs, goodwill impairments, restructuring charges and stock option costs be charged to net income. At one point or another every one of these charges involved the waste of cash or other corporate assets.
They are not merely “non-recurring” expenses. They always and everywhere generate a recurring loss of value because these charges reflect a business mistake or the impact of Mr. Market’s penchant for “creative destruction”.
Even then, clamber on board with the LBO boys and consider the LTM results for KMI on a so-called cash flow basis. During the year ended September, it posted $5.89 billion of EBITDA and spent $3.9 billion on CapEx and $1 billion on acquisitions. So its free cash flow was a round $1 billion.
Let’s see. At its April stock market peak, Kinder Morgan’s total unlevered enterprise value (TEV) was $140 billion. So the casino was valuing the company at 24X EBITDA, 70X EBITDA less CapEx and 140X free cash flow!
If you have another pipeline company in Houston, I’ve got some swampland in Florida that I will swap for it.
If not, at least believe this. Two decades of Wall Street coddling by the Fed and 84 months of free carry trade money means that the casino is riddled with momo plays and debt-fueled scams like Kinder Morgan.
Now would be an excellent time to get out of harm’s way—–as any sensible KMI shareholder would have done long before Bloody Tuesday.
end
(courtesy Alasdair Macleod/GoldMoney.com)
The Fed’s In A Bind: The Cluelessness Of The Macroeconomic Establishment
Submitted by Alasdair Macleod via GoldMoney.com,
One can understand the Fed’s frustration over the failure of its interest rate policy, and its desire to escape the zero bound.
However, since the FOMC has all but said it will increase rates at its December meeting, events have turned against this course of action. The other major central banks are in easing mode, and the slowdown in China has further undermined both world trade flows and commodity prices. The result has been a strong dollar, which has effectively eliminated any perceived need for higher dollar interest rates. Meanwhile, the US’s non-financial economy remains subdued.
Last August, a similar situation existed, when the FOMC signaled that a rise in the Fed Funds Rate might be announced at its September meeting. Ahead of it, China revalued the dollar by announcing a small devaluation of its own currency, taking the wind out of the Fed’s sails. While the talking heads saw this as a failure of Chinese financial policy, it was nothing of the sort. Given the US was dragging its feet over the yuan’s inclusion in the SDR, it was a salvo in the financial war between the two states, and the Fed found itself in the firing line.
Since then the pressure has been mounting from the IMF for the US to back down over the SDR issue. The result was announced only last week, with the dollar content hardly changing and the yuan being accommodated mostly at the expense of the euro from September next year. However, despite the SDR issue having been dealt with for now, the Fed appears to have very little room for manoeuver before higher interest rates will give rise to a new financial crisis.
The chart below illustrates the problem. It is of the Fed Funds Rate since 1980 and the Fiat Money Quantity, which simply put is the sum of the commercial banks’ reserves at the Fed, plus cash and sight deposits held at the banks.

From the mid-eighties, successive interest rate peaks (the pecked line) have declined to the point, which if the trend continues, would indicate a Fed Funds Rate peak today of roughly 3%.It is clear that the reason for this declining trend is the increase in bank-related debt, the principal counterpart to FMQ, and the interest burden it places on borrowers.
This trend of declining interest rate peaks was established before the Lehman crisis, when the Fed’s response was to rapidly expand its balance sheet. The result is FMQ growth accelerated from a compounding annual rate of 5.8% to 14%, taking FMQ to 70% above the previous long-term trend today. It would therefore require a far smaller increase in interest rates than indicated by the pecked line to tip the monetary system into a crisis, perhaps a Fed Funds Rate of as little as 1%.
The idea that we can be so precise about interest rate levels is obviously nonsense.If the Fed increases the Fed Funds Rate even slightly, non-financial borrowers often end up paying a significantly higher rate that includes a larger interest rate spread. The spread between interbank and corporate borrowing rates becomes an important indicator of financial stress, and junk bonds are already signalling deteriorating borrowing conditions. Just the threat of higher interest rates could turn out to be destabilising for the financial sector.
A problem of the financial sector’s own making
The key metric which has permitted debt to increase at such a pace is the declining rate of price inflation. This rate has not responded to monetary inflation as one would expect, having continually fallen from the high rates of the late ‘seventies, while the quantity of money and credit has increased significantly. The reason the rate of price inflation has declined is that by taking over the securities industry in the 1980s, the banks have been able to combine their licence to create credit out of thin air with the direct application of this credit into financial instruments. The result has not only been extremely profitable for the banks, but it has diverted excess credit from less profitable non-financial activities.
This partly explains why banks have increasingly neglected commercial and retail customers, concentrating capital allocation into investment banking. The effect has been to generally confine price inflation to assets, such as stocks, bonds and property. At the same time consumers have been packaged through securitised bulk lending for mortgages, student loans, credit cards and motor loans. Any pretence that banks exist to provide a service for customers has flown out of the window.
At the same time, this credit and securities duopoly has given the banks the ability to magically create paper substitutes for physical commodities through the futures markets, suppressing prices to levels below where they would otherwise be. In turn, this has reduced the pressure on price inflation for consumer goods. The decline in price inflation over the last thirty-five years is therefore the combined result of suppressed commodity prices, the reduced expansion of credit available to non-financial sectors, as well as favourable changes in statistical methods.
A declining trend of interest rates has been crucial for the profitable expansion of financial activities for their own sake. Since assets are valued with reference to interest rates, the falling trend in interest rates since the mid-eighties has delivered large profits to the banks and their financial customers.
The ground-level which inhibits further credit expansion is zero interest rates, a condition that has existed for seven years. Despite talk of negative rates, the impetus lower interest rates give to expansion of the financial side of the economy has already come to an end. Attempts by the Fed to raise interest rates, even slightly, should be considered in this light.
The next financial crisis could manifest itself in the coming months. The time-line of monetary expansion reflected in the chart above is at risk of being terminated by events. If so, it will mark the end of current central bank monetary policies and state control of markets, as free markets reassert realistic pricing. Government bond yields will normalise, stock markets will fall, and banks will almost certainly fail. Supressed commodity prices will rise as banks, short through paper contracts, will be forced to close their positions. Credit default swaps, where the banks are collectively exposed to losses when interest rates rise, will be a further source of grief.
When something as epochal as this happens, we can expect the macroeconomic establishment to be clueless with respect to the problem itself and its scale. Central banks will naturally revert to the Lehman remedy of further monetary expansion to cover the losses, whose enormous scale will not be apparent at the outset. This time, not only will the fiat money quantity accelerate into hyper-drive, it will be impossible to maintain the purchasing-power of the world’s reserve currency, therefore threatening that of all the others.
This month’s FOMC rate decision will not change this outlook, but it could bring forward the timing.
end
Another must read from David Stockman. He states that the huge deflation imported from China et al will cause a massive damage to the entire global economic scene. We will have a cap ex depression as the 9 trillion USA short positions unwind and all of those commodities are hurled at us at any price. It will not be a pretty scenario. Stockman also states this:
The hissy fit will happen because the Fed’s words and actions starting next week will not say “we have your back, keep buying”.
The message will be “we are lost and you are on your own”.
this was known as the Bernanke and Yellen put. From next week on, the Fed does not have the bankers back.
(courtesy David Stockman/ContraCorner)
The Fed’s Painted Itself Into The Most Dangerous Corner In History—–Why There Will Soon Be A Riot In The Casino
by David Stockman • December 9, 2015
The chart below crystalizes why the Fed is stranded in a monetary no man’s land. By the time of next week’s meeting the federal funds rate will have been pinned at about 10 bps, or effectively zero, for 84 straight months.
Yet during that same period, the consumer price level has risen by 1.75% per year. And that’s if you give credit to all of the BLS gimmicks, such as hedonic adjustments for quality change, homeowners “imputed” rents and product basket substitution, which cause inflation to be systematically understated.
On a basis that is close enough for government work, therefore, the real money market interest rate has been negative 2% for seven years. But that’s so crazy, unjustified, and unprecedented that even the Keynesian money printers who run the Fed have run out of excuses.
Presumably, Yellen and her posse know that we did not have seven years running of negative real money market rates even during the Great Depression of the 1930s.
So after one pretension, delusion, head fake and forecasting error after another, the denizens of the Eccles Building have painted themselves into the most dangerous monetary corner in history. They have left themselves no alternative except to provoke a riot in the casino——-the very outcome that has filled them with fear and dread all these years.
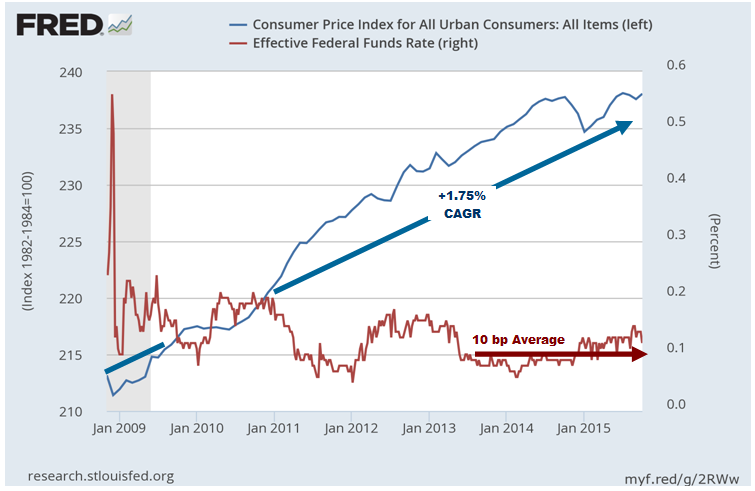
Indeed, Yellen and Bernanke before her have made a huge deal out of communications clarity and forward guidance. But how do you explain to even the credulous gamblers and day traders on Wall Street that the business cycle has not been outlawed and that free money can not last forever, world without end?
Likewise, after all these years of saying that the dollar’s exchange rate is the responsibility of the US Treasury— and that the Eccles Building only does domestic monetary policy—– how will the Fed heads explain that they have wrapped themselves around the axle of an unrelentingly strong dollar?
And that they are impotent to stop the gale force of global deflation and recession being imported into the domestic economy by the inexorable unwinding of the massive dollar short that they have spend years fueling?
For years now the dollar has been a “funding” currency in the global casino—-something the gamblers borrowed or effectively sold short in order to pile into higher yielding EM debt, equities and commodities until they peaked awhile back.
But the fantastic global credit bubble summarized above has now reached its apogee. China and the EM economies are rolling over into a debilitating deflation, thereby catalyzing the mother of all margins calls. This time subprime is lettered in Chinese and speaks with a Portuguese accent.
This time the correction will not be in the overbuilt and over-valued domestic (and other DMs like Spain) housing market. Instead, there will be a global CapEx depression and its contractionary cascade will cause the entire global economy to shrink for the first time since the 1930s. In fact, it is already happening, even by the lights of the IMF.
For most of this century the Fed’s post meeting statements and minutes have been progressively degenerating into embarrassingly empty pabulum, and its overwhelming consensus was an artifact of being on the Easy Button 80% of the time.
In that environment there was little to debate and less to explain. They simply delivered an economic weather report and urged Wall Street to hang on for the ride.
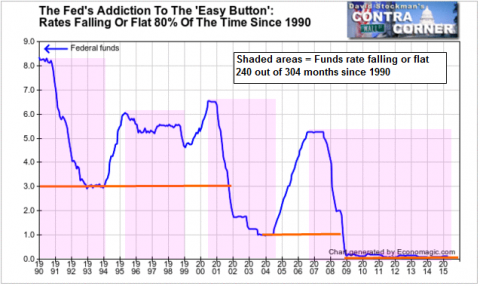
But now the Fed must emerge from the shaded zone shown above for the first time on a sustained basis since the 1980s. Yet as it seeks to explain a macro-economic slump that it absolutely did not see coming and to confess its complete lack of policy tools to reverse the worldwide deflationary tide now mounting, its statements will be reduced to self-evident and self-contradictory gibberish.
Likewise, the 19 members of the Board will take to noisy public quarrelling right in front of the boys and girls on Wall Street for the first time in their lives.
The reason that there will soon be a riot in the casino, therefore, is not owing to the prospect of a 25 bps pinprick after all this time on the zero bound.
The hissy fit will happen because the Fed’s words and actions starting next week will not say “we have your back, keep buying”.
The message will be “we are lost and you are on your own”.
And that’s not “priced in”. Not even close.
Evidence that a completely new monetary policy ball game is commencing comes from JM Keynes’ current vicar on earth himself, Larry Summers. Three days ago he penned a strange op ed in which he apparently reminded himself that the business cycle has not been outlawed——something most non-PhDs presumably already knew:
U.S. and international experience suggests that once a recovery is mature, the odds that it will end within two years are about half and that it will end in less than three years are over two-thirds. Because normal growth is now below 2 percent rather than near 3 percent, as has been the case historically, the risk may even be greater now. While the risk of recession may seem remote given recent growth, it bears emphasizing that since World War II, no postwar recession has been predicted a year in advance by the Fed, the White House or the consensus forecast.
Well now. If you wait until month 78 of a business expansion to end the emergency policy and to then venture even a few basis points off the zero bound, you will indeed use up the remaining runway right fast.
That’s because the average of ten business cycle expansions since 1988 have lasted but 61 months; and the only one appreciably longer than the present tepid affair was the 119 month stretch of the 1990s.
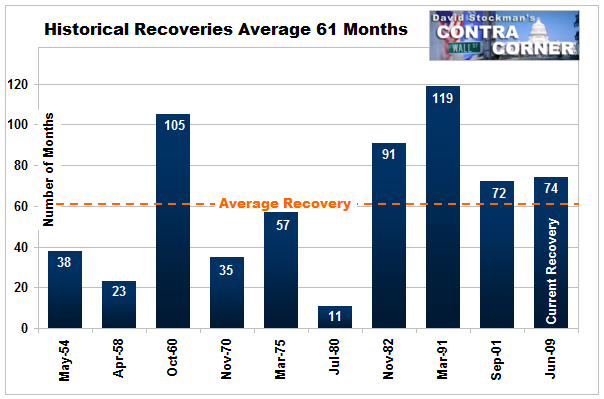
Historical Length of Recoveries
But let’s see. Back then the Fed’s balance sheet was $300 billion, not $4.5 trillion. The world had less than $40 trillion of debt or about 1.4X GDP, not $225 trillion or nearly 3X global income.
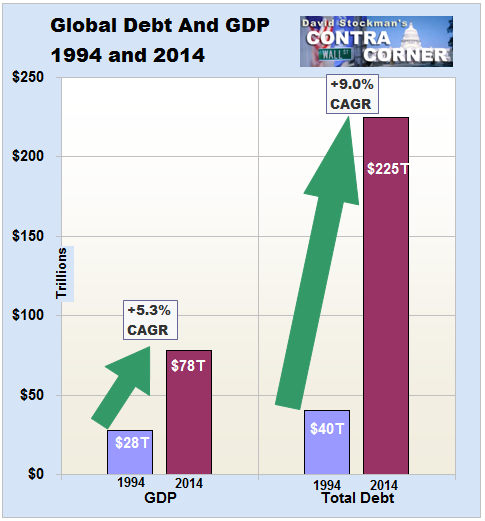
And, most importantly, China was still a quasi-agrarian victim of Mao’s destructrutive experiments in collectivist economics and state generated famine, not today’s towering Red Ponzi. That is, it was irrelevant then, but is now a bloated economic whale sinking under the weight of $30 trillion of debt and the most reckless spree of over-investment and mindless public and private construction in recorded history.
So as this domestic business expansion cycle get long in the tooth, the US economy is confronted by a veritable engine of global deflation in the form of China and its EM supply chain. After a 20 year credit driven boom, it now payback time. All of them find their exports stalled, their exchange rates falling, and their debt service exploding higher.
(To be continued)
end
I am going to leave you with the following summary of the risks that the Fed has if it is to raise the Fed fund rate just 1/4% this coming Dec 16.2015;
We have covered all of the salient point but it is worth a review:
(courtesy zero hedge)
With One Week Left Until The Fed’s Rate Hike, Nobody Knows If The Fed Can Actually Do It
One month ago, when the market was getting excited about the imminent Fed rate hike, now due less than one week from today, Jefferies analysts flagged a red flag about the imminent rate liftoff: few, if anyone, know precisely how it will take place in practice.
We cited Jefferies economists Ward McCarthy and Thomas Simons who in their December 16 note wrote that “indeed the liftoff date, the Fed is running out of time to be ‘well before’ raising rates.” They added that as per the July 29-30 minutes, FOMC participants agreed the committee should provide additional information to the public regarding details of normalization well before first steps in reducing policy accommodation.
And yet, aside from some vague reassurance that the Reverse Repo – IOER corridor “should” work, and an extensive profile by the WSJ of the person tasked with conducting the liftoff, Simon Potter, there has been no detail on the topic. To Jefferies this is a glaring problem:“The lack of any discussion of liftoff logistics is puzzling to us and a potentially significant communication snafu.”
Jefferies added that the Fed has never attempted to raise fed funds rate under “IOER regime” so lack of confidence “is not unreasonable.” In the note, the authors write that still unresolved issues about liftoff logistics and normalization process include:
- Issues include how to communicate liftoff, spread between IOER and RRP, as well as spread between RRP rate and fed funds
- FOMC members still struggling with risks associated with RRP facility, including “appropriate size” that would limit Fed’s role in financial intermediation
And then there is uncertainty “about the efficacy” as how combination of RRP and IOER rates will control fed funds rate.
The punchline according to Jefferies is that the idea that IOER will be primary tool to move fed funds rate is “wishful thinking” as IOER was initially intended to put floor under fed funds rate yet hasn’t been “an effective tool for doing so.”
* * *
Earlier today, Bloomberg picked up on this major caveat to the Fed’s experiment rate hike (experimental, because never before has a tightening been attempted with $2.5 trillion in excess reserves still sloshing around in the financial system), reporting that “as the Fed prepares to raise interest rates from near zero as soon as next week, bond investors are on edge. Beyond all the “is-this-the-right-move” questions that surround every increase, there’s a logistical concern: With so much cash sloshing around, will Fed officials be able to nudge rates as high as they want? Will the new-fangled tools they’ve created to engineer the move work, or instead sow the kind of confusion that can dent the Fed’s credibility and spur a broader market selloff?”
Bloomberg notes that as a result of these numerous questions, “many investors are taking no chances.”
So what are they doing:
They’re piling into the safest, most liquid securities available, or those that move them as far away from the epicenter of the U.S. financial system as possible. James Camp at Eagle Asset Management is buying Treasuries and unloading debt linked to credit, such as corporate bonds. Peter Yi, director of short-term fixed income at Northern Trust Corp. is stockpiling cash. Jerome Schneider, head of short-term strategies at Pacific Investment Management Co., is diversifying into securities such as debt in foreign currencies. In a sign of the search for liquidity, U.S. money funds have cut the average maturity of their assets to the lowest since 2006.

Paradoxically, one of the “flights to safety” away from the short-end of the curve which is the biggest question market in the upcoming rate hike, is the long end, and many investors are buying up the belly of the curve in response, in the process further flattening the curve, and impairing bank Net Interest Margins, once again a thoroughly undesirable outcome to the Fed which needs to see a curve steepening to get validation by the market that it is doing the right thing and not engaging in policy error. After all, an inverted curve would be an undisputed signal by the market that a recession is just around the corner.
“You just stay away from this one,” said Camp, director of fixed-income at Eagle Asset, which manages $30.6 billion in St. Petersburg, Florida. “You just let this play out. It’s OK to wait and see, and see how risk markets react. I love Treasuries here.”
Camp boosted Treasuries holdings by 20 percent in the last six months, most recently adding seven- to 10-year maturities. He sees government debt offering shelter in case the Fed’s tightening leads investors to shun riskier assets, such as high-yield securities, and prefers longer maturities that would be less influenced by turbulence in shorter-dated obligations.
Others are stockpiling liquid and easy to dispose of shorter maturities.
Yi at Chicago-based Northern Trust, which manages $946 billion, has cash and securities maturing within five days as much as 15 percent above levels of prior years in the short-term funds he oversees. He’s focused on boosting holdings that are easy to sell in the event he faces withdrawals.
“We need to be prudent about any interest-rate exposure,” said Pimco’s Schneider, who manages about $250 billion of short-term assets at the Newport Beach, California-based firm. “We’re looking for ways to diversify our liquidity risk in high-quality assets, and doing so with the view that rates are going higher.”
The issue at hand, as discussed extensively over the past several years, is the logistical mechanics of the rate hiking corridor which the Fed will try to push up, bounded on the bottom side by the Fed’s Reverse Repo operations, and on the top end by the interest the Fed pays on Excess reserves. Considering the unprecedented amounts of liquidity, it is not the ceiling of the corridor that is the concern, but rather the floor, and whether the Fed will be able to raise the rate on all paper at the same time.
In previous tightening cycles, there were far less reserves sloshing around in the financial system. That made it a lot easier for policy makers to hit their desired rate.
As Bloomberg summarizes this, “policy makers need new methods to drain that money and push rates higher in an interbank lending market, known as fed funds, that has become harder to influence now that cash-heavy banks rely on it infrequently.
And while many are willing to put their trust in the Fed’s rate plumbing mechanics, “others are watching how the Fed handles the mechanics of the move. Camp at Eagle Asset and strategists at TD Securities say policy makers will need to more than triple the size of its daily reverse-repo program — where they drain money from the financial system by temporarily lending out securities — to at least $1 trillion. Expanding the program, which officials began in September 2013, would help anchor the fed funds rate. Yet the Fed may balk at the move because officials have signaled they’re wary of playing too big a role in money markets.”
Furthermore, as has also been discussed previously, for the first time in a monetary policy move, the Fed will tap an expanded pool of counterparties, including investment companies such as BlackRock Advisors LLC, Federated Investors Inc. and Fidelity Investments as participants in the reverse repo program. It used to just deal with primary dealers, a group that currently numbers 22.
Bloomberg’s closing quote is troubling for a Fed which in recent months has stretched its credibility with the capital markets:
“This is new territory for investors,” said Yi at Northern Trust. “We are all hoping it works, but can’t rule out a possibility that it’s not perfect. Our expectation is that it is probably going to be initially pretty sloppy.”
Alas, the Fed can hardly afford to be sloppy in illiquid capital markets in which one false move can result in an immediate flash crash in one or more asset classes.
* * *
But even assuming the Fed will be flawless in executing a rate hike experiment that has never been tried before, another just as important question is what the impact on market liquidity this purported 25 bps rate hike will have. Luckily, we roughly know what the answer is, as reported last week in “But It’s Just A 0.25% Rate Hike, What’s The Big Deal?” – Here Is The Stunning Answer, in which we cited the work, and calculation, Wedbush’s Scott Skyrm:
Where will General Collateral trade when the fed funds target range is moved 25 basis points higher to .25% to .50%? In the most simple method, GC has averaged about .15% for the past month, which implies a GC rate around .40% after the Fed move.
However, given the unprecedented amount of liquidity in the financial system,there’s a belief the Fed will have problems moving overnight rates higher.
We have two quantifiable events over the past few years where the Fed moved Repo rates higher or lower: quarter-end and the QE programs. Given there are so many moving parts, consider these to be very rough estimates: Beginning in 2015, when funding pressure began each quarter-end, the market, on average, took approximately $255B additional collateral from the Fed and, on average, GC rates averaged 20.5 basis points higher.
In 2013 on my website, I calculated that QE2 moved Repo rates, on average, 2.7 basis points for every $100B in QE. So, one very rough estimate moved GC 8 basis points and the other 2.7 basis points per hundred billion. In order to move GC 25 basis points higher, in a very rough estimate, the Fed needs to drain between $310B and $800B in liquidity.

So according to Skyrm, to push rates by a paltry 25 bps, the smallest possible increment, what the Fed will have to do is drain up to a whopping $800 billion in liquidity!
As we put that in context last week, QE2 – which pushed the S&P higher from November 2010 until June 2011 – was “only” $600 billion. In other words, to “prove” to itself that it is in control and the economy is viable, the Fed will effectively conduct, via reverse repo, an overnight QE2, only in reverse.
* * *
To conclude: we are less than one week away from a historic monetary experiment in two parts: the first one, which will attempt the (almost literally) Sisyphean task of pushing up the rate of interest on over $2.5 trillion in excess liquidity, and the second one, to assure the market that it has correctly priced in the overnight evaporation of up to $800 billion in liquidity in current asset prices.
If one or both of these fail to deliver, than the embarrassing disappointment that marked the ECB’s December announcement and its dramatic impact on asset prices and FX levels, will be a walk in the park compared to “disappointment” that the Fed will unleash once the market realizes that while in theory the Fed can and is ready to hike, it simply can’t do so in practice. And if that implies that trillions in excess reserves be drained first before the RR-IOER corridor can work then watch out below…
end


[…] by Harvey Organ Harvey Organ’s Blog […]
LikeLike
[…] by Harvey Organ, HarveyOrganblog: […]
LikeLike