
Gold: $1091.90 up $13.50 (comex closing time)
Silver $13.96 up 1 cent
In the access market 5:15 pm
Gold $1094.00
Silver: $14.02
Today, gold broke above the critical resistance level of 1080.00 and once that level was cleared, gold was off to the races. But not silver.
At the gold comex today, we had a poor delivery day, registering 0 notices for nil ounces.Silver saw 0 notices for nil oz.
Several months ago the comex had 303 tonnes of total gold. Today, the total inventory rests at 199.48 tonnes for a loss of 103 tonnes over that period.
In silver, the open interest fell by 674 contracts even though silver was well up in price to the tune of 13 cents with respect to yesterday’s trading and without a doubt we had more short covering. We have an extremely low price of silver and a very high OI. However we moved back into backwardation in silver at the comex up until March. The total silver OI now rests at 167,520 contracts. In ounces, the OI is still represented by .838 billion oz or 120% of annual global silver production (ex Russia ex China).
In silver we had 0 notices served upon for nil oz.
In gold, the total comex gold OI rose by 3860 contracts to 413,688 contracts as gold was up $3.30 in yesterday’s trading.
we had a 1.90 tonnes withdrawal in gold inventory at the GLD, and his gold headed straight for Shanghai / thus the inventory rests tonight at 640.97 tonnes. The appetite for gold coming from China is depleting not only gold from the LBMA and GLD but also the comex is bleeding gold. Our 670 tonnes of rock bottom inventory in GLD gold has been broken. It looks to me that China has taken the last amounts of physical gold from the GLD. I guess the only place left for China to receive physical gold, after they deplete the GLD will be the FRBNY and the comex. In silver, we had huge changes in inventory at the SLV/we had massive withdrawals of 4.28 million oz /Inventory rests at 317.797 million oz.
First, here is an outline of what will be discussed tonight:
1. Today, we had the open interest in silver fell slightly by 674 contracts down to 167,510 despite the fact that silver was up in price with respect to yesterday’s trading to the tune of 13 cents. The total OI for gold rose by 3,860 contracts to 413,688 contracts as gold was up $3.30 in price yesterday
(report Harvey)
2 a) Gold trading overnight, Goldcore
(Mark OByrne)
b) Federal Reserve Bank of NY report of gold movement last month.
(Harvey)
3. ASIAN AFFAIRS
EARLY LAST NIGHT:
Last night, MONDAY night, TUESDAY morning: Shanghai closes down sharply throughout the day with an attempted relief rally into the close , Hang Sang falls, Chinese yuan rises a bit after a big devaluation over the holiday season. Stocks in Asia all in the red, . Oil falls slightly in the morning,. Stocks in Europe mixed. Offshore yuan continues to collapse as it trades at 6.64 yuan to the dollar vs 6.515 for onshore yuan:
4.EUROPEAN AFFAIRS
5. RUSSIAN AND MIDDLE EASTERN AFFAIRS
the Saudi currency the Riyal takes a nasty fall after ties are cut with Iran
( Press TV)
2, if you think that Syria is a mess just look at see what is going on in Libya:
( zero hedge)
6. GLOBAL ISSUES
i) North Korea claims a successful Hydrogen bomb. However it looks like more of an atomic blast than a H. Bomb
ii) An excellent commentary by Nomi Prins on the chaotic roadmap for 2016:
7. EMERGING MARKETS
none
8. OIL MARKETS
i)Crude drops into the 34 dollar column after record gasoline inventory build up plus Cushing increase;
( zero hedge)
ii)In 12 to 18 months you will find these 25 shale companies under default status:
9. PHYSICAL MARKETS
i) Steve St Angelo describes the huge fall in registered silver at the comex
(Steve St Angelo/Chris Powell)
ii) Bron Suchecki comments that we should pay more attention to central bank gold inventories instead
of Comex gold inventories
(Bron Suchecki/Perth Mint)
iii) China’s rigged markets will no doubt fall much further
v) Bill Holter’s important commentary tonight is entitled:
“Why would he say this?”
vi) The author is correct that once they initiate a gold price fix in yuan in April, that would be a game changer:
10 USA STORIES WHICH WILL INFLUENCE GOLD AND SILVER.
i) what a joke!! The ADP payrolls report shows highest employment in the private sector since 2014. And yet a load of this;
ii) zero hedge responds to the report why asking the ADP adjusters to explain why the USA ISM manufacturing at post recession lows along with the uSA Mfg PMI, plus the huge inventories to sales ratio at record levels, why on earth are the goods producers hiring at such a frantic pace?
iii) Although the trade deficit improved last month, it did so on the back of both exports and imports decreasing.
iv) ISM services collapses, lowest level since March 2014: (follows ISM mfg to a tee)
v) Total USA factory orders tumble for the 13th month in a row:
vi) the next company in the USA to fall on its sword: Chipotle as its December sales per same store falls 30%. They are also in receipt of a FDA subpoena:
vii) And now it is Apple’s turn to collapse
viii) Beige book is now out and the Fed is showing lack of confidence:
x) Another Macy’s Massacre: earnings down badly/an another 600 workers to be fire:
Let us head over to the comex:
The total gold comex open interest rose to 413,688 for a gain of 3860 contracts as gold was up by over $3.30 in price with respect to yesterday’s trading. For the past two years, we have strangely witnessed two interesting developments with respect to the gold open interest: 1) total gold comex collapse in OI as we enter an active delivery month, and 2) a continual drop in the amount of gold standing in an active month. Today, both scenarios were in full force.. We are now in the non active January contract which saw it’s OI fall by 50 contracts to 260. We had 0 notices filed upon yesterday, so we lost 50 contracts or an additional 5000 oz will not stand for delivery in this non active delivery month of January. The next big active delivery month is February and here the OI rose by 69 contracts up to 272,978. The estimated volume today (which is just comex sales during regular business hours of 8:20 until 1:30 pm est) was 213,978 which is good. The confirmed volume yesterday (which includes the volume during regular business hours + access market sales the previous day was also poor at 112,122 contracts. The comex is in backwardation in gold up to April.
December contract month:
INITIAL standings for January
Jan 6/2016
| Gold |
Ounces
|
| Withdrawals from Dealers Inventory in oz | nil |
| Withdrawals from Customer Inventory in oz nil | 9709.300 oz
Scotia, Brinks, Manfra 302 kilobars |
| Deposits to the Dealer Inventory in oz | nil |
| Deposits to the Customer Inventory, in oz | 64,300.000 oz
Scotia
2,000 kilobars
|
| No of oz served (contracts) today | 0 contracts
oz |
| No of oz to be served (notices) | 260 contracts
(31000 oz) |
| Total monthly oz gold served (contracts) so far this month | contracts(nil oz) |
| Total accumulative withdrawals of gold from the Dealers inventory this month | nil |
| Total accumulative withdrawal of gold from the Customer inventory this month | 10,866.3 oz |
Total customer deposits 64,300.000 oz
January INITIAL standings/
Jan 6/2016:
| Silver |
Ounces
|
| Withdrawals from Dealers Inventory | nil |
| Withdrawals from Customer Inventory | 76,963.83 oz
Brinks,CNT,Scotia |
| Deposits to the Dealer Inventory | nil |
| Deposits to the Customer Inventory | 102,820.359 oz
SCOTIA |
| No of oz served today (contracts) | 0 contracts
nil oz |
| No of oz to be served (notices) | 361 contracts
(1,805,000 oz) |
| Total monthly oz silver served (contracts) | 12 contracts (60,000 oz) |
| Total accumulative withdrawal of silver from the Dealers inventory this month | nil oz |
| Total accumulative withdrawal of silver from the Customer inventory this month | 76,963.83 oz |
Today, we had 0 deposits into the dealer account:
total dealer deposit;nil oz
we had 0 dealer withdrawals:
total dealer withdrawals: nil
we had 1 customer deposit:
i) Into CNT: 600,411.06 oz
total customer deposits: 600,411.06 oz
total withdrawals from customer account: nil oz
we had 2 adjustments:
i) Out of Brinks:
150,860.900 oz was removed from the dealer side and placed into the customer side (probably a settlement)
ii) Out of CNT:
132,969.140 oz was removed from the dealer side of CNT and placed into the customer side of CNT
(probably a settlement)
And now the Gold inventory at the GLD:
Jan 6/2016/we had a withdrawal of 1.6 tonnes of gold from the GLD/Inventory rests at 640.97 tonnes/
Jan 5/2016: since my last report we had a total of 3.57 tonnes of gold withdrawal from the GLD/Inventory rests at 642.37 tonnes
Dec 23. will update GLD inventory tomorrow
Dec 22.no change in inventory tonight/inventory rests at 645.94 tonnes/
Dec 21/tonight a huge deposit of 15.77 tonnes of gold was added to the GLD/Inventory rests tonight at 645.94 tonnes
(With gold in backwardation it is highly unlikely that physical gold was added/probably a paper gold addition.)
Dec 18.2015: late last night: a huge withdrawal of 4.46 tonnes of gold/Inventory tonight rests at 630.17 tonnes
DEC 17.no changes in gold inventory at the GLD/Inventory rests at 634.63 tonnes/
dec 16/no changes in gold inventory at the GLD/inventory rests at 634.63 tonnes.
Dec 15.2105/no changes in gold inventory at the GLD/Inventory rests at 634.63 tonnes
Dec 14.no change in gold inventory at the GLD/Inventory rests at 634.63 tonnes
DEC 11/no change in gold inventory at the GLD/inventory rests at 634.63 tonnes
Dec 10.2015/no change in gold inventory at the GLD/inventory rests at 634.63 tonnes
And now your overnight trading in gold and also physical stories that may interest you:
Gold Price Up On Mid East, Asia Risk – January Best Monthly Performance
– Gold up 2.5% in January on stock falls, Korea nuclear test, Middle East tensions
– Gold up an average of 4.4% in January over past decade
– January positive month for gold and silver
Gold prices hit a four-week high today over $1,088 per ounce, extending gains for the third day and leading to a 2.5% gain year to date. Deepening concerns over the indebted Chinese economy saw falls in stock markets again and tensions rose in Asia and the Middle East.
 Stocks globally fell for a fifth day as China added to fears about its economy by allowing the yuan to weaken further in the ongoing currency war, and a nuclear test by North Korea added to a growing list of geopolitical worries.
Overnight, North Korea said it successfully tested a miniaturised hydrogen nuclear device on Wednesday, setting off alarm bells in Japan and South Korea. Relations between Saudi Arabia and Iran collapsed over the weekend after the Kingdom’s execution of nearly 50 people including a Shi’ite cleric, a prominent critic of Saudi policy, set off violent protests and condemnation from Tehran.

Bullion has has been one of the best months for gold in terms of monthly performance in the last 10 years. Bloomberg confirms that today:
Bullion has advanced 4.4 percent on average in January over the past 10 years, climbing in all but three cases. Its performance in the first month beats that in any other. January is a time when Chinese shoppers stock up on gold in anticipation of the Lunar New Year.
Seasonally, the months of November, December, January and February have historically been positive months for gold. October often sees declines in the gold price followed by strong gains in November, December, January and February (see table above and chart below).
Risk aversion has seen gold move closer to key chart levels, including the December high at $1,088.70. A push above $1,088 would indicate that gold may have bottomed out for now after twice rebounding from the $1,045 area in December, a technical analyst told Reuters.
Silver is up 0.3 percent at $14.11 an ounce, while platinum is up 0.1 percent at $893.75 an ounce and palladium was down 0.6 percent lower at $533.40 an ounce.
Daily Prices
6 Jan LBMA Gold Prices: USD 1083.85, EUR 1,009.66 and GBP 739.84 per ounce
5 Jan LBMA Gold Prices: USD 1078.00, EUR 1,000.75 and GBP 734.31 per ounce
4 Jan LBMA Gold Prices: USD 1072.70, EUR 982.30 and GBP 725.02 per ounce
31 Dec LBMA Gold Prices: USD 1062.25, EUR 974.32 and GBP 716.36 per ounce
Breaking Gold News and Commentary Today – Click here
Must-Read Guide: Gold and Silver Storage Must Haves
China’s rigged markets could fall much further, much faster
Submitted by cpowell on Tue, 2016-01-05 13:10. Section: Daily Dispatches
Good thing the West’s markets aren’t rigged — or that they seldom suffer critical journalism like this.
* * *
China’s Rigged Markets Could Fall Much Further, Much Faster
By Craig Stephen
MarketWatch.com, New York
Monday, January 4, 2015
HONG KONG — Those fearing that China is the big risk in the year ahead for global markets hope that the first trading day of 2016 does not set the tone for the rest of the year.
Between a 7-percent fall in shares that triggered new circuit breakers on the Shanghai and Shenzhen stock exchanges and accelerated weakness in the yuan, there is ample fodder for China bears.
The question being posed anew is whether 2016 will be the year Beijing finally throws in the towel on its attempts to coerce multiple asset markets upward while its economy continues to sink in a sea of debt.
While yet more weak industrial activity numbers from the Caixin China December PMI got the new year off to a flat start, the bigger concern is whether the leadership still has the will or the ability to continue holding up stock prices as its confronts ever more painful policy choices. …
… For the remainder of the report:
http://www.marketwatch.com/story/chinas-rigged-markets-could-fall-much-f…
END
Yesterday, I alerted you on the huge drop in registered or dealer silver. Last night, Steve St Angelo commented on this huge reduction and what it means. He also comments on the huge increase in the Shanghai silver exchange
(courtesy Steve St Angelo/SRSRocco report)
In a stunning development, the Comex Registered Silver inventories experienced a large one day decline yesterday. Nearly 10% of total Comex Registered Silver inventories were removed from the exchange on the last day of the year and reported on Jan 4th.
According to the CME Group’s Metal Depository Statistics, 3.5 million ounces (Moz) of Registered Silver Inventories were withdrawn and transferred to the Eligible category:
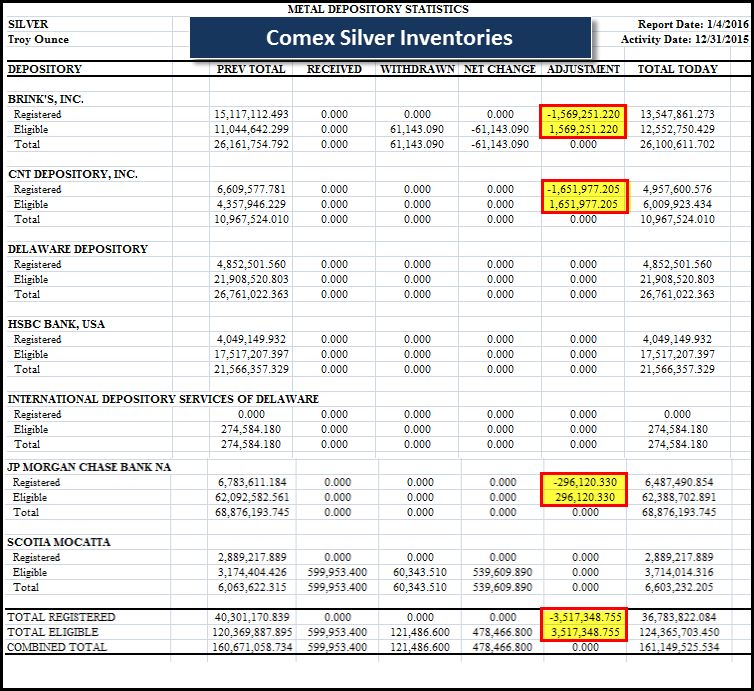
As we can see, there was 1.5 Moz transferred out of Brinks, 1.6 Moz from the CNT Depository and nearly 300,000 oz removed from JP Morgan for a total of 3,517,348 oz. At the end of 2015 (Dec 31st), there were 40.3 Moz held in Registered Silver inventories at the Comex. After this large one day transfer, only 36.7 Moz remains.
This is an interesting development for two reasons:
- This is the lowest level the Comex Registered Silver inventories have been for the past three years and,
- The motivation for depositories to transfer that much silver out of its deliverable category.
First, the last time the Comex Registered Silver inventories were this low was in Feb 8th, 2013 at 36.2 Moz. The lowest the Registered Silver inventories fell to was 26.6 Moz in July 2011. However, the overall trend of the Registered Silver inventories was up until April, 2015… where they peaked at 70.5 Moz.
In just the past eight months, Registered Silver inventories at the Comex have fallen be nearly 50%. Again, Registered Silver inventories are those that are ready to be delivered into the market.
Second, something has motivated the holders of this silver to remove it so it is no longer able to be delivered into the market. If we assume that industrial silver demand has fallen due to a weaker U.S. and global economic activity and there is no longer a retail shortage of silver (as there was from June-Sept 2015), why are we continuing to see silver removed from the Registered Category?
You would think we would be seeing the opposite as the Registered Silver inventories started to build in August, 2011… after the peak and decline of the silver price and investment demand. And interestingly, the opposite is taking place at the Shanghai Future Exchange.
Shanghai Future Exchange Silver Inventories Surge End Of Year
Silver inventories at the Shanghai Futures Exchange (SHFE) grew from a low of 176 metric tons (mt) in January 2015 to 394 mt in June. They bottomed in August at 233 mt and then continued to build steadily until spiking at the end of the year:
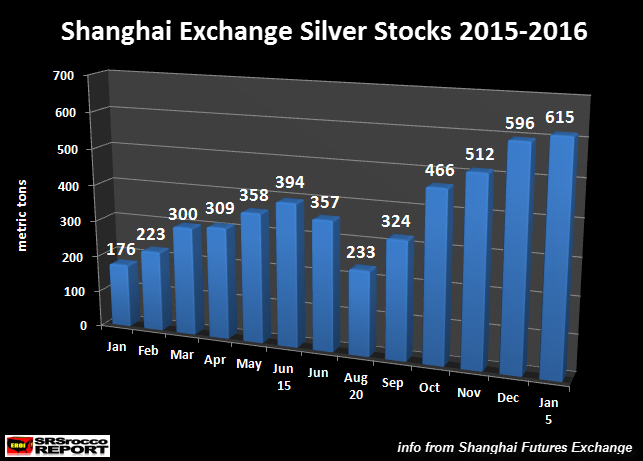
What is really interesting about the build of SHFE silver inventories is the rapid increase since Dec 28th. On Dec 28th, there were 535 mt of silver at the SHFE, only 23 mt higher than the beginning of the month. Then over the next week and including the first few days in 2016, total inventories at the Shanghai Futures Exchange jumped 80 mt to 615.
Precious metal investors need to realize the Chinese view gold more as an investment than silver. Furthermore, the Chinese also have to pay a 17% vat tax on silver investment. According to the 2015 World Silver Survey, Chinese silver bar investment demand was only 6.2 Moz in 2014 while Official Coins sales were 5.9 Moz. The notion that the Chinese are buying a lot of physical silver investment is not true… however, they are buying one hell of a lot of gold.
So, this spike of SHFE silver inventories must be motivated more by the decline of industrial silver demand in China than investment demand. China is the largest silver fabricator in the world as they consumed 5,788 mt (186 million oz) of silver in 2014 via industrial applications (2015 World Silver Survey).
Again, something very strange is happening here. The Comex continues to see a drain of its Registered Silver inventories (for delivery), while the SHFE inventories are showing a rapid increase.
It will be interesting to see what happens to the silver inventories at these two exchanges over the next 6 months. If Comex Registered Silver inventories continue to fall (just like the Gold Registered inventories), this could spell more trouble for the highly leveraged paper based precious metal markets going forward.
Please check back for new articles and updates at the SRSrocco Report. You can also follow us at Twitter below:
![]()
END
(courtesy Bron Suchecki/Perth Mint and Chris Powell/GATA)
important for you to read
Comex gold inventories don’t matter as much as central bank inventories do
Submitted by cpowell on Wed, 2016-01-06 15:37. Section: Daily Dispatches
10:42a ET Wednesday, January 6, 2016
Dear Friend of GATA and Gold:
The Perth Mint’s Bron Suchecki today notes that gold inventories on the New York Commodities Exchange are not necessarily a good indicator of tightness in the gold market, since “eliglble” gold — gold in Comex warehouses — easily can be converted to “registered,” gold available for delivery against Comex contracts. Suchecki’s analysis is headlined “Issuers Can Make Deliveries Using Eligible” and it’s posted at the Perth Mint’s research page here:
http://research.perthmint.com.au/2016/01/06/issuers-can-make-deliveries-…
This is a point GATA often has made, though in different ways and for different purposes.
That is, if, as GATA has maintained from its inception, central banks are intervening surreptitiously in the gold market to control currency values, interest rates, bond prices, and equity prices, central bank gold inventories are far more relevant to the gold price than mere Comex inventories. For through intermediary bullion banks, central bank gold inventories may become Comex inventories as quickly as “eligible” gold in Comex warehouses may be reclassified as “registered.”
That’s why, as the International Monetary Fund discerned in a secret report in March 1999, central banks intervening surreptitiously in the gold market insist on concealing their gold swaps and leases, lest the market get an idea of the real supply of gold, the supply available for intervention:
http://www.gata.org/node/12016
Indeed, studying Comex data last June, securities lawyer Avery B. Goodman concluded that bullion bank JPMorganChase was administering the U.S. government’s gold leasing and swapping operations and that the U.S. gold reserve was effectively guaranteeing Comex gold contracts, at least for the time being:
http://www.gata.org/node/15441
Yes, as Suchecki writes, some gold bugs make far too much of the decline of “registered” Comex gold stocks. But then many gold market analysts, including Suchecki himself, make far too little of the overwhelming documentation of surreptitious intervention in the gold market by central banks, since doing that can get one in trouble with the authorities. In fairness to Suchecki particularly, it must be noted that the Perth Mint is an agency of the government of Western Australia.
A summary of the documentation of central bank rigging of the gold market can be found at GATA’s Internet site here:
There’s a lot more of it here:
http://gata.org/taxonomy/term/21
GATA pleads for it to be analyzed, concurred in, or disputed — anything but ignored.
CHRIS POWELL, Secretary/Treasurer
Gold Anti-Trust Action Committee Inc.
CPowell@GATA.org
end
This is a strange one!! UBS says that we should buy gold because a 30% downfall in S and P is coming!
(courtesy UBS/zero hedge)
A Disturbing Warning From UBS: “Buy Gold” Because A 30% Bear Market Is Coming
As Wall Street axioms (Santa rally, January effect, as goes January etc.) are rapidly falling by the wayside at the start of 2016, following a chaotic but return-less 2015, the UBS analysts who correctly forecast last year’s volatility are out with their forecast for 2016. It’s simple – Sell Stocks, Buy Gold.
UBS Technical Analysts Michael Riesner and Marc Müller warn the seven-year cycle in equities is rolling over.

UBS expects S&P 500 to move into a 2Q top and fall into a full size bear market, with risk of a 20% to 30% correction into minimum later 2016 and worst case early 2017
“The comeback of volatility was the title of our 2015 strategy. Last year’s rise in volatility was in our view just the beginning for a dramatic rise in cross-asset volatility over the next few years,”

Noting that while equities have had a good run, Risener and Muller warn, “we are definitely more in the late stages of a bull market instead of being at the beginning of a new major breakout.”
Our key message for 2016 is that even if we were to see another extension in price and time, we see the 2009 bull cycle in a mature stage, which suggests the risk of seeing a significant bear cycle event in one to two years.
S&P-500 trades in 4th longest bull market since 1900 Bear markets are defined by a market decline of 20% and more. It’s a fact that since its March 2009 low, with 82 months and a performance of 220%, the S&P-500 now trades in its 4th longest and 5th strongest bull market since 1900. So from this angle alone we suggest the 2009 bull cycle has reached a mature stage.
Keep in mind, since 1937 the average downside in a 7-year cycle decline was 34%…
Having said that, if we look at equities globally the picture looks more diverse. Last year we said we think the May top in the MSCI World represents a major equity top. Our view is unchanged, and in this context it is important to understand and sort in the extent of last year’s summer correction. In the MSCI World universe, we saw in 20 out of 48 markets a correction of 20% and more (DAX -25%), which is per definition bear market territory. The MSCI Emerging Market has been factually trading in a bear market since 2011 but from its May top alone the EM complex lost another 28% into its late August low!
Together with the 200-day moving averages rolling over in more and more markets globally, the break of the 2011 bull trend in the Russell-2000 and the equally weighted Valueline-100 index in the US, as well as intact sell signals in our monthly trend work, we can clearly say that globally, a bear market is already underway in more and more markets; whereas the S&P- 500 has just corrected 13% from its May top, and where into H1 2016 we can still see the large and mega cap driven S&P-500, Dow Jones Industrial and Nasdaq Composite to hit a new all-time high.
In 2013, high yields topped out and particularly since 2014, we have a real bear market underway in the high yield segment, which in the meantime is forming a multi-year divergence versus the S&P-500, similar as prior to the major market tops in 2000 and 2007.
The bear market started with the energy complex but it is a trend, which is filtering through into other commodity themes, as well as Emerging Markets, Asia and at the end of the day into the Western world, which translated means we are running through a very classic credit cycle.
2016 is a Presidential Election year, which usually have a rather bullish track record in the 4-year cycle. However, if we look more selectively into this cycle there is a big divergence between a normal Presidential Election year and the 8th year of a presidential turn, which we highlighted red in chart 9.
Since 1920, more or less all 8th years of a presidential turn were amongst the worst election years.
Also, pattern-wise the two cycles have a very contrarian message where the average of all 8th years of a presidential turn is actually outright negative for next year, which we think would be quite a big surprise for most investors.


So if stocks are due for a 30% correction – what to do? Buy Gold…
Gold has been trading in a cyclical bear market since 2011.
In 2016, we expect gold and gold mines moving into an eight-year cycle bottom as the basis for the next multi-year bull market.
Initially, we see gold profiting as a safe haven and as of 2017, gold could profit from the US dollar moving in a major top and starting a bear market.
Tactically, over the last three years, we’ve tried playing bear market rallies in gold and gold mines several times. In 2013 and 2014, our targets were reached.
In 2015, the bounce in gold was weaker than expected. However, in all these cases we made it clear that we just expect a bear market rally before resuming its dominant cyclical bear trend. Generally, our cyclical roadmap and our long-term call on gold of the last few years has not changed.
A potential bottom in 2016 bottom could be a rather powerful bottom, since together with a four-year cycle low we have also an eight-year cycle low projection for this year. In this context we expect a potential 2016 low in gold to be the basis of a new multi-year bull market.

In contrast to the underlying secular trend in commodities (which has turned bearish) UBS sees gold (which is in our view a currency and not a commodity) still trading in a secular bull market.
Pattern wise we continue to see the 2011/2016 cyclical bear market in the same context as the 1975/1976 bear cycle in gold. Keep in mind, in the mid-70s gold lost 43% of its value from its January 1975 top before another gold bull market started into the January 1980 bubble peak. It is amazing to see that with a loss of 45% from its August 2011 top into the early December 2015 low, the decline in gold has more or less exactly the same proportion as in the mid-70s.
Furthermore, there are still a lot of market commentators who say that the August 2011 top in gold was the top of a bubble. According to the average gains we have seen in historical financial bubbles, the gold bull run from 2001 into 2011 (760%) was far away from any bubble territory. In the first gold bubble, gold gained 2400%. In the 1903 to 1929 Dow bubble, the Dow Jones Industrial gained 1200%. The 1979 – 1989 Nikkei bubble came in at around 2000% and the 1980 – 2000 Nasdaq bubble topped out a +3900%.
So if gold moves into a bubble, we would need to see a gold price of minimum $3300, and in this case we would still talk about a low bubble phenomena such as the 1903 – 1929 Dow Jones bubble!!
What kind of macro environment could justify such a gold bull market in the end of the decade?
In December we saw the Fed’s first rate hike. Even if we were to see another 1 or 2 rate hikes in H1 2016, with a 20% to 30% bear market event in later 2016 or into early 2017, it would bevery likely to see a big U-turn in the Fed policy where initially we should see a negation of the rate hikes and at the end of the day we would expect the Fed to move into QE4.
Our call is, that at the point where we see a Fed u-turn, we get the top of the decade in the US Dollar, and together with the accommodative stance of the ECB, BOJ and the PBOC, this would be the trigger for the ultimate reflationary trade, where equities, commodities and finally also gold could rally hard on the back of a big recovery in inflation towards the end of the decade.
And judging by the market so far this year – and post FOMC – the Buy Gold, Sell Stocks plan is already being implemented…

Preview YouTube video Fisher Fed At Fault

China to Start Yuan-Based Gold Price Fix in April: Game Changer?
 China has been quietly accumulating a significant amount of gold bullion in recent years. They are now the top producer and top consumer of gold in the world. They are believed to keep all of their domestic production, plus import significant amounts from other nations. In addition, they have been buying up gold mines around the globe at steep discounts and bringing home gold they had stored in London, New York and Switzerland.
After accumulating all of this gold, along with their close ally Russia, many believe they will eventually break the metal free from the price manipulation undertaken by the banks/governments in the United States and United Kingdom. Once price discovery moves from West to East, they will allow the price to float to free-market levels and the value of all the gold they have been accumulating will skyrocket.
Removing the gold price suppression will be accompanied by wholesale dumping of U.S. treasury bonds and test the world’s faith in the US dollar debt-based fiat currency system. This will give China, Russia and others a greater influence in world financial markets and better stability in their currencies. It may give them a considerable strategic advantage over the United States, a nation that many believe no longer has the gold that they claim. Indeed, with a lack of a comprehensive audit and unwillingness of officials to allow one, many believe the gold is no longer in Fort Knox.
Now we move to the really interesting part of this story. Not only has China been accumulating huge amounts of gold (on and off record), but they also launched their own international gold trading platform on the SGE. It has become the largest physical gold exchange in the world, with an estimated 52 times more physical gold withdrawals versus the predominantly paper exchange of the COMEX.
Fast forward to the first week of 2016 and China is warning foreign banks that they must participate in Yuan-based gold price fixing or lose their Chinese gold import rights. This first-ever Chinese benchmark is set to launch in April of this year and could be a game-changer for gold prices moving forward.
Reuters reported today that:
China has warned foreign banks it could curb their operations in the world’s biggest bullion market if they refuse to participate in the planned launch of ayuan-denominated benchmark price for the metal, sources said.
The world’s top producer and consumer of gold has been pushing to be a price-setter for bullion as part of a broader drive to boost its influence on global markets.
Derived from a contract to be traded on the state-run Shanghai Gold Exchange,the Chinese benchmark is set to launch in April, potentially denting the relevance of the current global standard, the U.S. dollar-denominated London price.
In a trial run for the fix in April 2015, some foreign banks participated along with many major Chinese banks. Traders at those banks said earlier that while they were interested in the benchmarking process, their legal and compliance teams may be reluctant.
Perhaps a little sensationalized, but Jim Willie recently commented:
The Gold market cannot be fixed by paper gold on a repeated basis, surely not in perpuity. When the Shanghai shock comes, all the Paper Gold structures will fall, all the FOREX derivatives will collapse, all the control rooms will go into panic mode.
The Shanghai shock is not likely to materialize all at once and cause an immediate collapse of the dollar, the COMEX or our fiat monetary system. However, it is another nail in the proverbial coffin and significantly increases the odds of more honest price discovery in precious metals as it moves from West to East.
The red line in the chart below shows Asian gold reserves as a percentage of total gold reserves. The percentage has been rising steadily for decades, but the pace of the increase has picked up significantly since the 2008/09 financial crisis.

If you believe that the gold price has been suppressed in order to maintain faith in fiat money and allow governments to continue deficit spending to secure their power, it is logical to conclude that gold prices may rise sharply as the disconnect between paper and physical pricing intensifies. And it would make sense for China, Russia and other BRICS nations to push for such a transition, as it would diminish the dominance of the United States in global trade and finance, leveling the playing field.

In any event, it will be an interesting development to watch during 2016. I believe it could be another catalyst in a long list that could cause a spike in gold and silver prices.
1 Chinese yuan vs USA dollar/yuan falls badly in value , this time to 6.5527/ Shanghai bourse: in the green with a late rally , hang sang: red
2 Nikkei closed down 182.68 or .99%
3. Europe stocks down badly /USA dollar index up to 99.39/Euro down to 1.0746
3b Japan 10 year bond yield: falls to .250 !!!!(Japan buying 100% of bond issuance)/Japanese yen vs usa cross now at 118.37
3c Nikkei now just above 18,000
3d USA/Yen rate now well below the important 120 barrier this morning
3e WTI: 35.05 and Brent: 35.05
3f Gold up /Yen up
3g Japan is to buy the equivalent of 108 billion uSA dollars worth of bond per month or $1.3 trillion. Japan’s GDP equals 5 trillion usa.
Japan to buy 100% of all new Japanese debt and by 2018 they will have 25% of all Japanese debt. Fifty percent of Japanese budget financed with debt.
3h Oil down for WTI and down for Brent this morning
3i European bond buying continues to push yields lower on all fronts in the EMU. German 10 yr bund falls to .538% German bunds in negative yields from 6 years out
Greece sees its 2 year rate rise to 8.80%/: still expect continual bank runs on Greek banks
3j Greek 10 year bond yield rises to : 8.31% (yield curve inverted)
3k Gold at $1085.30/silver $14.00 (7:45 am est)
3l USA vs Russian rouble; (Russian rouble down 72/100 in roubles/dollar) 74.07
3m oil into the 35 dollar handle for WTI and 35 handle for Brent/
3n Higher foreign deposits out of China sees huge risk of outflows and a currency depreciation (already upon us). This can spell financial disaster for the rest of the world/China forced to do QE!! as it lowers its yuan value to the dollar.
30 SNB (Swiss National Bank) still intervening again in the markets driving down the SF. It is not working: USA/SF this morning 1.0089 as the Swiss Franc is still rising against most currencies. Euro vs SF is 1.0845 well above the floor set by the Swiss Finance Minister. Thomas Jordan, chief of the Swiss National Bank continues to purchase euros trying to lower value of the Swiss Franc.
3p Britain’s serious fraud squad investigating the Bank of England on criminal charges/arrests 10 traders for Euribor manipulation
3r the 6 year German bund now in negative territory with the 10 year falls to + .538%/German 6 year rate negative%!!!
3s The ELA at 75.8 billion euros,
The bank withdrawals were causing massive hardship to the Greek bank. the Greek referendum voted overwhelming “NO”. Next step for Greece will be the recapitalization of the banks and that will be difficult.
4. USA 10 year treasury bond at 2.19% early this morning. Thirty year rate at 3% at 2.95% /POLICY ERROR
5. Details Ransquawk, Bloomberg, Deutsche bank/Jim Reid.
(courtesy Jim Reid/Bloomberg/Deutsche bank/zero hedge)
The Carnage Returns: Stocks Tumble After Sharp Chinese Devaluation; Brent At 2004 Lows; Gold Surges
On the first trading day of the year, stocks crashed after China shocked the world with a circuit-breaking market slide that was not contained by the government. On the second trading day, after the Chinese government intervened drastically, global equities stabilized if just barely.
Then overnight, even as Chinese stocks surged higher by 2.3% after the ban on major shareholder selling was extended, the global market was far more focused with what was going on in China’s currency, which as previously reported, plunged to new 5 year lows, while the spread between the onshore and offshore Yuan rose to a record wide, suggesting the depreciation in the currency is only going to accelerate from here, and a big payday for Kyle Bass is coming. Then again, how this is surprising since China’s December 11 announcement it would devalue against a basket of currencies, not just the USD, is not exactly clear to us.

“China is for sure back in focus,” said Didier Duret, chief investment officer at ABN Amro NV’s wealth-management unit. “I’d say this is an echo of what happened in August maybe more than a replay. It’s making people nervous.”
This accelerating depreciation, despite constant official lies to the contrary, such as this one from yesterday….
- CHINA’S YUAN WON’T SEE SHARP DEPRECIATION: SECURITIES JOURNAL.
… has clearly spooked traders and heightened concerns that the outlook for global growth is dimming. To be sure, North Korea’s first hydrogen bomb test overnight even as geopolitical tensions in the Mideast refuse to go away, have not helped risk sentiment. The MSCI All-Country World Index fell 0.4 percent at 10:49 a.m. London time. The Stoxx Europe 600 Index slid 1.1 percent and futures on the Standard & Poor’s 500 Index dropped 1.4 percent.
As a result, the sharp weakness seen early in the session in US equity futures has growing worse, and while global equities are down across the board, today’s session could be as bad as that of Monday if not worse, especially since moments ago Brent tumbled below $35 for the first time since 2004.

Elsewhere, the yen reached its strongest level since October and Treasuries rose for a fifth session on demand for haven assets. Finally, despite or perhaps due to the broad risk-off sentiment, gold has finally woken up and as of this morning was trading at the highest price in over a month.

Before we go into details of the overnight carnage, this is where we stand currently: S&P futures now down 33 points or 1.63% while 2Y Treasury rallies pushing its yield back below 1% as EU stocks extend their drop after China weakened its currency, North Korea says it tested a hydrogen bomb; Brent crude falls to lowest level since 2004.
Equity Futures:
- S&P 500 futures down 33pts or 1.63% to 1978; (high 2012; low 1976)
- DJIA futures -266pts or 1.5%
- Nasdaq 100 futures -79pts or 1.8%
- Stoxx 600 down 1.5% to 354
- MSCI Asia Pacific down 0.9% to 127
- Brent Futures down 3.1% to $35.09
- Gold spot up 0.5% to $1,083
- Silver spot up less than 0.1% to $13.99
Commodities:
- WTI Crude -2.5% to $35.09/bbl (range $34.80 to $36.39)
- Brent Crude -3.6% to $35.12/bbl
- Gold +0.8% to $1,087/oz
- Copper -1.1% to $2.07/lb
Rates/FX:
- 30-yr -5.92bps to 2.9359%
- 10-yr -5.31bps to 2.1826%
- 2-yr -2.19bps to 0.992%
- Dollar Index Spot little changed at 99.43
- Euro/Dollar -0.1% to $1.074
- GBP/Dollar -0.1% to $1.4659
- Dollar/Yen +0.6% to 118.37
Looking at regional markets, Asian stocks traded mostly lower following the subdued lead from Wall St., with further weak Chinese data, more aggressive CNY softening by the PBoC and a North Korea nuclear bomb test adding to the risk averse tone. ASX 200 (-1.2%) was led lower by commodity-linked weakness, while Nikkei 225 (-1.0%) declined as JPY strength dampened exporter sentiment, with poor Chinese services PM! which posted a 17-month low, adding to the region’s gloom . Elsewhere, US equity futures also saw a bout of pressure overnight in the wake of a North Korean nuclear bomb test and further softness in the CNH which was perceived as a negative signal from the world’s second largest economy, while the MSCI emerging market index reached its lowest level since July 2008. However, the Shanghai Comp (+2.3%) outperformed on reports that China is to extend the ban on major shareholders from selling shares. Finally, 10yr JGBs gained as the negative sentiment in the region spurred demand for safer assets, while the BoJ were also in the market for 1.27tr1 of government debt.
A quick reminder why China’s devaluation is bad – in a zero sum world, China’s export gains, mean everyone else’s export loses: “This isn’t good for the rest of the world. Until China stops weakening the yuan, global markets will struggle to stabilize,” said Koichi Kurose, Tokyo-based chief market strategist at Resona Bank Ltd. “The Chinese authorities may be trying to prop up the economy by boosting exports, but while that’ll help one part of China’s economy, it comes at the sacrifice of someone else.”
“There’s word spreading in the market that state funds are buying, but the idea is to hold up the market, not to bolster it by a large margin,” said Dai Ming, a fund manager at Hengsheng Asset Management Co. in Shanghai.
Top Asian News:
- Caixin China Services PMI Falls to Second Lowest in Decade: Gauge fell to 50.2 in Dec. vs 51.2 in Nov.
- Chinese Brokerage Head Targeted in Probe by Communist Party: Changjiang Securities case adds to wave of probes in finance
- Rupee Bonds Cheaper Than Loans Make Arrangers Bullish for 2016: Offerings will probably rise to a record this year
- Huawei Starts Selling Honor-Brand Smartphone in U.S. Market: Available for pre-order on Amazon and Newegg.com
European equities sank after emerging-market stocks dropped to a six-year low and developing-nation currencies slid on concern a weaker yuan may spark a wave of global turmoil similar to what followed China’s shock depreciation in August. Indeed, sentiment in Europe today has once again been dictated by events in Asia overnight, with China remaining in focus, while elsewhere sentiment has been shaken by North Korean hydrogen bomb tests . European equities spent the morning in the red, with Euro Stoxx down over 1% on the day and around 3.8% for the week. Dialog Semiconductor (-4.2%) is the worst performer in Europe today after reports that Apple are to reduce output of its latest iPhone by 30%.
Amid the concerns surrounding China, the materials sector is the notable underperformer amid growth concerns, while the metals complex sees gold as the notable outperformer amid risk off sentiment. Separately, the energy complex has seen further softness this morning to pare yesterday’s API inventory inspired gains, with the weakness attributed to USD strength.
“It could be a difficult year,” said Fredrik Nerbrand, HSBC’s London-based head of asset allocation. “We believe 2016 is a year for capital protection rather than appreciation. The increased focus on uncertain and volatile economic data releases is likely to cause markets to overreact.”
Top European News:
- John Lewis Provides Holiday Cheer as Store’s Online Sales Soar: Web sales rose 21% in six weeks ended Jan. 2
- U.K. Services Cool in December as Confidence Hits 3-Year Low: Markit said report together with its latest surveys of manufacturing and construction indicates U.K. economy grew 0.5% in 4Q, down from 0.6% it estimated last month.
- ‘Brexit’ Gamble Enters Crunch Phase as Cameron Returns to Merkel: Cameron travels to Bavaria on Wednesday to meet with German Chancellor Angela Merkel
Dialog Semiconductor Plc, the chipmaker whose biggest client is Apple Inc., dropped 4.3 percent as Nikkei Asian Review reported the U.S. company would reduce the first quarter output of its latest iPhones by about 30 percent. AMS AG and ARM Holdings Plc, also Apple suppliers, lost at least 3 percent.
Taiwan’s Largan Precision Co. and Catcher Technology Co. led declines among Apple suppliers, slumping more than 5 percent and sending Taiex index to a four-month low.
In FX, today’s session was again dominated by the JPY pairs, with Asia once again providing the major drivers of trade. China Caixin services PMI contract dropped significantly, and with the CNH weakening to fresh multi year highs, growth and instability concerns dominated. North Korea added to global woes with its first H-bomb test, so it was no surprise to see spot and cross JPY extending recent lows, though notable was USD/JPY finding strong support comfortably ahead of 118.00. As a result, the yen appreciated 0.5 percent to 118.46 per U.S. dollar and reached 118.34, the strongest since Oct. 15. Japan’s currency surged more than 1 percent against the yuan to the highest level since October 2014, just before the Bank of Japan expanded monetary easing.
EUR/JPY has tested 127.00 and AUD/JPY to sub 84.00, dragging the respective spot rates lower, though anticipated EUR/USD bids ahead of 1.0700 continue to support. CAD has raced through 1.4000 on broader risk sentiment, with fresh losses in Oil adding to weakness here. AUD now eyeing a fresh move on .7000. GBP largely ignored the small miss in UK services PMI (55.5 vs 55.6 exp).
In commodoties, Brent crude for February settlement fell as much as $1.59, or 4.4 percent, to $34.83 a barrel on the London-based ICE Futures Europe exchange. West Texas Intermediate declined 2.5 percent after dropping 2.2 percent Tuesday. U.S. oil inventories probably increased by 500,000 barrels last week, according to a Bloomberg survey before Energy Information Administration data Wednesday. The industry-funded American Petroleum Institute was said to report stockpiles fell by 5.6 million barrels while fuel supplies gained.
Gold for immediate delivery advanced 0.6 percent to $1,084.52 an ounce following two days of gains. Demand for the precious metal has been bolstered as gyrations in global stock markets enhance its allure as a haven investment. Zinc on the London Metal Exchange dropped 2.2 percent to the lowest since Dec. 29. Copper fell 0.9 percent.
It’s a busy session on the US calendar today, where the session kicks off firstly with the December ADP employment change print, followed closely by the November trade balance. The final December services and composite PMI’s follow this before we get the all-important ISM non-manufacturing where market expectations are currently sitting for little change at 56.0. November factory orders data along with the final revisions to durable and capital goods orders are also due out before we get the Fed’s FOMC minutes from its first rate hike in 9 years at 2pm.
Top Global News:
- Yuan Sinks to Five-Year Low as PBOC Surprises With Weaker Fixing: China sending out confusing policy signals, Macquarie says
- Valeant Said to Name New CEO With Pearson Still Hospitalized: Schiller, Rosiello may be candidates, Wall Street Journal says
- North Korea Says It Successfully Tested First Hydrogen Bomb: Regime in Pyongyang says won’t give up nuclear development. North Korea’s Hydrogen Bomb Claim Disputed by Weapons Experts: Data show explosion yield lower or similar to previous blasts
- Apple Suppliers Drop in Asia After IPhone Output Cut Report: Nikkei Asian Review reports cut of 30% in first quarter
- Brent Crude Drops to 11-Year Low Before U.S. Oil-Stockpile Data: Citigroup, UBS see possible slide in prices toward $30
- Halliburton Faces Longer EU Probe on Missing Early Offer Slot: Co. will likely face protracted antitrust review of its plan to buy oil services rival Baker Hughes for $26b
- Verizon Said to Start Process to Sell Data Centers, Reuters Says: Co. hopes to get more than $2.5b from sale
- NuVasive to Acquire Ellipse Technologies in $410m Deal: Elipse develops surgical implants to treat skeletal deformities
Bulletin Headline Summary from RanSquawk and Bloomberg
- Aggressive CNY softening by the PBoC and a North Korea nuclear bomb test have added to the weeks risk averse tone
- In FX markets, today’s session was again dominated by the JPY pairs, with Asia providing the major drivers of trade
- Highlights today include, US ADP employment change, ISM non-manufacturing composite, factory orders, durable goods and the release of FOMC minutes
- Treasuries gain for a fifth day as China devalues yuan, North Korea says it successfully tested its first hydrogen bomb and a report said Apple would reduce 1Q output of iPhones.
North Korea’s hydrogen bomb test risks reigniting tensions with China and the U.S. after months of calm even as some experts cast doubt on the full extent of Pyongyang’s claim - The yuan sank to a five-year low and tumbled 1.1% in Hong Kong after the PBOC set the reference rate at an unexpectedly weak level, a sign that policy makers are becoming more tolerant of depreciation
- A private Chinese services gauge slumped to the second- lowest reading since the series began a decade ago and close to a level signaling contraction, suggesting conditions may be weaker than the government’s official index indicates
- The Chinese economy may be headed for a “hard landing” as borrowers are taking on record amounts of debt to repay interest on their existing obligations, said Marc Faber
- Apple Inc. suppliers from Asia to Europe fell after a report saying the world’s most valuable company would reduce 1Q production of its latest iPhones by about 30%
- S&P 500 will fall into a full-sized bear market this year as seven-year cycle in equities is rolling over, UBS technical analysts wrote in a note
- Merkel’s government said about 1.1m asylum seekers entered Germany last year, reaching a record as Europe struggles to manage the influx of refugees from the Middle East and beyond
- A U.K. services gauge eased in December as risks including a British exit from the EU weighed on hiring and business expectations fell to a three-year low
- $25.75b IG priced yesterday, no HY. BofAML Corporate Master Index OAS holds at +173, YTD range 180/129. High Yield Master II OAS narrows 7bp to +703; YTD range 733/438
- Sovereign bond yields lower. Asian and European stocks lower, U.S. equity-index futures slide. Crude oil lower and copper lower, gold gains
US Event Calendar
- 2:00pm: FOMC Minutes, Dec. 15-16
DB’s Jim Reid concludes the overnight wrap
With the exception of bourses in China, it’s been a broadly weak start for risk assets for most of the region as concerns reverberate around further weakening of the Chinese Yuan, while headlines of nuclear testing in North Korea are not helping sentiment. Losses are being led out of Japan where the Nikkei is -1.15%, while there’s been falls also for the Hang Seng (-0.92%), Kospi (-0.50%) and ASX (-1.07%). In credit the Asia iTraxx is currently +3bps wider. This is in contrast to moves in China however where the Shanghai Comp (+0.69%), CSI 300 (+0.35%) and Shenzhen (+0.56%) are all up at the midday break and more than likely a sign of those government support measures yesterday. Much of the newsflow this morning however is being dominated by the latest moves in China’s currency. The PBoC set the Yuan fix 0.22% weaker this morning (lower for the seventh day in a row) to the weakest level since 2011 while the spread between the onshore and offshore currencies at one stage widened to the largest on record. The offshore Yuan is currently down -0.48% as we type and at its weakest level since 2010. That’s seen EM currencies come under similar pressure this morning where there are declines of around half a percent for most.
Meanwhile we’ve also had some data out this morning and it’s made for more disappointing news. The non-official Caixin services PMI in China revealed a 1pt fall to 50.2, the lowest reading since July 2014. Combined with the soft manufacturing print from earlier in the week, the composite dipped below 50 last month to 49.4, a fall of 1.1pts. China was cited as a big risk for markets in most 2016 outlook publications and while it’s very early days, events there are dominating markets and price action for now.
Recapping the rest of the news and price action yesterday. 2016 hasn’t been too kind for Oil markets so far and yesterday saw WTI (-2.15%) take another dip lower, at one stage falling below $36 only to finish slightly above that by the closing bell. Despite that US HY spreads actually closed more or less flat although still underperformed relative to the modest gains over in Europe. With markets a bit more stable, yesterday saw the new issue market get going, with over $25bn pricing in the IG space alone.
Meanwhile, yesterday saw our US economists slash their Q4 GDP forecast. They now expect Q4 real GDP to be just 0.5%, a full percentage point cut from the previous forecast while at the same time highlighting that this still might be too high in light of what could be a much larger inventory liquidation than what they have assumed. This downward adjustment has the effect of now lowering their projected Q4-over-Q4 rate of real GDP growth by 30bps to 1.7%. They highlight however that some of the expected Q4 GDP softness may carry over into the current quarter and so have also trimmed their current quarter growth projection by 50bps to 1.5%. Highlighting the reasons for the downward changes to the forecasts, our team highlight that the data released over the last couple of weeks (i.e. durable goods, international trade, constructing spending and manufacturing ISM) have been softer than expected with most of this adjustment due to less stockpiling. They point out that there is a high correlation between the change in private inventories and the inventory component of the manufacturing ISM (nearly 0.8). In fact, last quarter ISM inventories fell to 44.3 from 48.8, the lowest since Q4 2009, when inventory liquidation totaled nearly -$50bn. This raises the possibility that inventories could in fact be lower than what they predict and raising the possibility of taking GDP temporarily into negative territory. It’s worth reminding, as we noted yesterday, that the Atlanta Fed recently downgraded their Q4 GDP forecast to just 0.7%.
Staying on the data theme, after Monday’s disappointing German inflation numbers, Euro area CPI failed to meet hopes for a modest rise after the core reading came in unchanged at +0.9% yoy in December (vs. +1.0% expected), with an estimate for the headline at +0.2% yoy. Italian CPI (-0.1% mom vs. +0.2% expected) also missed to the downside, while Germany’s unemployment rate held steady at 6.3% in December as expected. Meanwhile in the US we saw the ISM NY print rise 1.3pts in December to 62.0, while the total vehicle sales reading for last month showed a slightly disappointing pullback in sales to 17.2m on an annualized basis (from 18.1m).
It’s set to be a busy day ahead with a packed calendar for us to get through. This morning in Europe will be all about the PMI’s with the final services and composite prints due for the Euro area, Germany and France as well as indicators out of the UK, Italy and Spain. French consumer confidence data and Euro area PPI is also due out in the European session this morning. The US session kicks off firstly with the December ADP employment change print, followed closely by the November trade balance. The final December services and composite PMI’s follow this before we get the all-important ISM non-manufacturing where market expectations are currently sitting for little change at 56.0, although our US economists are less optimistic and expect a drop to 54.0 (from 55.9). November factory orders data along with the final revisions to durable and capital goods orders are also due out before we get the aforementioned FOMC minutes at 7pm GMT.
ASIA AFFAIRS
let us begin:
Last night, TUESDAY night, WEDNESDAY morning: Shanghai closes UP with an relief rally into the close, the only bourse to rise , Hang Sang falls badly, Chinese yuan sharply down with another big devaluation. Stocks in Asia all in the red, . Oil falls again in the morning,. Stocks in Europe deeply in the red. Offshore yuan continues to collapse as it trades at 6.67 yuan to the dollar vs 6.5527 for onshore yuan:
A Shocked Wall Street Reacts To China’s “Surprising” Devaluation
Less than a month ago, and just days after the Yuan was finally inducted into the IMF’s hall of reserve currency fame, the Chinese Foreign Exchange Trade System, a part of the PBOC, made it very clear that what was about to happen would not be pretty, when it announced – in a statement which clearly everyone ignored – that going forward it would index the relative strength of the CNY not to the USD but the a basket of currencies (against which the USD to which it is pegged has been soaring).

At the time we explained that “what this means is that for anyone who thought the Yuan devaluation is over, now that the currency is at the lowest level relative to the dollar since 2011, the reality is that the devaluation relative to everyone else is only just starting.
And, with the PBOC’s warning that the “RMB is relatively a strong currency among the major international currencies” the real devaluation is, just as we warned four months ago, about to be unleashed. Expect at least a 15% reduction in Trade-Weighted terms in the coming weeks and months, especially if the Fed hikes.
One month later, it appears that not a single person heeded this warning, and now that the PBOC has unleashed a whopper of a devaluation round…
… precisely as we warned a month ago, everyone is panicking. So, more for comic relief than anything, here are Wall Street’s reactions to last night’s latest “shocking” PBOC devaluation, which nobody could have possibly seen coming.
Sean Callow, Sydney-based FX strategist at Westpac:
- Today’s fixing was a big surprise, and impression is that upside risks to USD/CNY have grown
- Allowing the yuan to trend lower against the dollar this year is consistent with the need to loosen domestic financial conditions to support growth
- PBOC may not tolerate widening CNY-CNH spread for long since it will encourage capital outflows
Tommy Xie, Singapore-based economist at OCBC:
- PBOC’s actions are conflicting: there was suspected intervention yesterday and sentiment stabilized, but it set such a low fixing today
- PBOC may be taking dollar demand into consideration: usually at the start of a new year, retailers’ and corporates’ foreign-exchange requirements are higher
- Central bank may be using the fixing to convey a message to the market that it doesn’t want the RMB index to be too strong
Zhou Hao, Singapore-based senior economist at Commerzbank:
- Lowered-than-expected yuan fixing today shows authorities will tolerate more weakness for the time being
- Will help loosen monetary conditions; still, risk of capital outflows could increase concurrently
- Increasing outflow pressures may rule out excessive drop in yuan
Liu Dongliang, Shenzhen-based senior analyst at China Merchants Bank:
- Yuan depreciation this week aims to stabilize the yuan index amid a stronger dollar environment
- Expects 5%-10% depreciation by end of the year, though this depends on the pace of PBOC’s intervention and health of macroeconomy
So to avoid any further surprise, here is a preview of what happens next: China continues to devalue, and does so aggressively. But don’t believe us. Here is what Kyle Bass said over the weekend:
“Given our views on credit contraction in Asia, and in China in particular, let’s say they are going to go through a banking loss cycle like we went through during the Great Financial Crisis, there’s one thing that is going to happen: China is going to have to dramatically devalue its currency.”
His full thoughts here.
end
Eyewitness Account Of The “Monstrous” Migrant Attacks In Germany: “It’s Like Civil War”
On Tuesday, we documented multiple reports that suggest as many as 1,000 men “of Arab or North African origin” participated in what appeared to be coordinated attacks on German women in Cologne.
“About 90 women have reported being robbed, threatened or sexually molested at New Year celebrations outside [the city’s] cathedral,” Reuters writes, adding that the men were “between 18 and 35” and appeared to be “mostly drunk.”
Cologne mayor Henriette Reker called the incident “unbelievable and intolerable” while Justice Minister Heiko Maas described the attacks as “a new scale of organized crime.”
For her part, Reker has been variously criticized for comments which seem to place some of the blame with the victims. “The Mayor of Cologne said today that women should adopt a “code of conduct” to prevent future assault at a crisis meeting following the sexual attack of women by 1000 men on New Year’s eve,” The Independent reports. “The suggested code of conduct includes maintaining an arm’s length distance from strangers, to stick within your own group, to ask bystanders for help or to intervene as a witness, or to inform the police if you are the victim of such an assault.”
“We need to prevent confusion [among asylum seekers] about what constitutes happy behaviour and what is utterly separate from openness, especially in sexual behaviour,” Reker said, as though this might all be one big misunderstading.
“Ms Merkel where are you? What do you say? This scares us!,” read a sign held by one of hundreds of protesters who gathered outside the cathedral on Tuesday. Here are some images from the demonstrations:


“A spokeswoman for the interior ministry in North-Rhine Westphalia, the state in which Cologne is located, said there were three suspects but declined to give further details,” Dow Jones says, before detailing the alleged attacks: “Police have said the women reported small groups of men attacking them among a crowd of around 1,000 people that had gathered in front of the station to set off fireworks. Women were allegedly cornered by groups of 20 to 30 men, mugged and in some cases sexually assaulted.”
Assaults were also reported in Hamburg and Stuttgart. Authorities are attempting to discern if there’s a connection.
“Mrs Merkel, is Germany ‘colorful and cosmopolitan’ enough for you after the wave of crimes and sexual attacks?,” AfD party leader Frauke Petry tweeted, taunting the iron chancellor’s open-door policy for Mid-East asylum seekers, more than 1.1 million of whom streamed into the country in 2015.
While Integration commissioner Aydan Ozoguz warned Germans to avoid putting migrants under “blanket suspicion” for the attacks, it is precisely these types of incidents that trigger dangerous bouts of scapegoating xenophobia, embolden right-wing political movements, and provoke violent responses from otherwise peaceful people who feel their home is being invaded by hostile foreigners. As we put it on Tuesday, “at this point it is too late for damage control, however, as this has become a case of guilty until proven innocent.”
Below, find a first-hand account of the New Year’s Eve assaults in Cologne from Ivan Jurcevic, a hotel club bouncer who was on the job (literally) as the melee unfolded. “These people that we welcomed just three months ago with teddy bears and water bottles … started shooting at the cathedral dome and started shooting at police,” Jurcevic says. “Well seasoned police officers then confessed to me that they never saw something like this in their entire lives,” he adds. “They called it a ‘civil war like situation.'”
‘Saudi currency takes a tumble after ties cut with Iran’
-

The Saudi riyal has taken a nosedive after Riyadh cut its ties with Iran. (file photo)
Saudi Arabia’s national currency, the riyal, has fallen sharply in the wake of Riyadh’s move to sever ties with Tehran, according to Reuters.
The Saudi money dropped against the US dollar in the forward foreign exchange market early on Monday, raising concern in the Persian Gulf monarchy that dollar funding for the kingdom could become more expensive, the report said.
On Sunday, Saudi Foreign Minister Adel al-Jubeir announced the kingdom’s severing of diplomatic relations with Iran following Tehran’s strong condemnation of the Riyadh regime’s Saturday execution of prominent Shia cleric Sheikh Nimr al-Nimr.
On Monday, one-year dollar/Saudi riyal forwards jumped to 680 points, near a 16-year high, from a close of 425 points on Thursday.
The riyal has little scope to move in the spot foreign exchange market because of its peg of 3.75 to the dollar, so banks use the forwards market to hedge against risks, the report said.
In the last few months, the riyal dropped in the forwards market to its lowest level since 1999 because of fears that huge Saudi budget deficits due to low oil prices might eventually force Riyadh to abandon the currency peg.
An austerity budget for 2016, which Riyadh announced last week appeared to partly ease such fears, but geopolitical tensions may now increase them.
According to Reuters, the breaking of diplomatic ties will not necessarily have a direct impact on the economies of Iran and Saudi Arabia, which have ‘minimal’ trade and investment ties.
But geopolitics could make foreign banks and investors more wary of funding Saudi Arabia, at a time when Riyadh is considering borrowing abroad to ease the pressure of funding its fiscal deficit on the domestic banking system.
“One-year forwards will likely touch 800 points levels this week, depending on the level of escalation of the events between Saudi and Iran,” Reuters quoted a senior bank trader from the region, who spoke on condition of anonymity.
A recent report said Saudi Arabia’s economic growth is expected to further slow down in 2016 after the country announced record budget deficits due to slumping oil prices.
Jadwa Investment’s forecast report, released last month, said the Saudi economy will grow by only 1.9 percent this year, down from 3.3 percent in 2015.
end
\
if you think that Syria is a mess just look at see what is going on in Libya:
(courtesy zero hedge)
“Pray For Us”: Libya Issues “Cry For Help” As ISIS Advances On Oil Fields
“We are helpless and not being able to do anything against this deliberate destruction to the oil installations. NOC urges all faithful and honorable people of this homeland to hurry to rescue what is left from our resources before it is too late.”
That’s from Libya’s National Oil Corp and as you might have guessed, it references the seizure of state oil assets by Islamic State, whose influence in the country has grown over the past year amid the power vacuum the West created by engineering the demise of Moammar Qaddafi.
The latest attacks occurred in Es Sider, a large oil port that’s been closed for at least a year.
Seven guards were killed on Monday in suicide bombings while two more lost their lives on Tuesday as ISIS attacked checkpoints some 20 miles from the port. “Es Sider and Ras Lanuf, Libya’s biggest oil ports, have been closed since December 2014,” Reuters notes. “They are located between the city of Sirte, which is controlled by Islamic State, and the eastern city of Benghazi.”

ISIS also set fire to oil tanks holding hundreds of thousands of barrels of crude. “Four tanks in Es Sider caught fire on Tuesday, and a fifth one in Ras Lanuf the day before,” Ali al-Hassi, a spokesman for the the Petroleum Facilities Guard told Bloomberg over the phone.

(a fire at Ras Lanuf)

(a smoking storage tank in Es Sider)
Ludovico Carlino, senior analyst at IHS Country Risk says the attacks are “likely diversionary operations” during Islamic State’s takeover of the town of Bin Jawad, a seizure that may enable the group to expand and connect “its controlled territory around Sirte to the ‘oil crescent.’”
Islamic State is pushing east from Sirte in an effort to seize control of the country’s oil infrastructure, much as the group has done in Syria and Iraq. As Middle East Eye wrote last summer, “the desert region to the south of the oil ports has been strategically cleared in a series of attacks by IS militants on security personnel and oil fields, where employees have been killed and kidnapped, and vehicles and equipment seized.”
“I expect they will try and take Sidra and Ras Lanuf and the oil fields on the west side of the oil crescent,” one oil worker said. “There are few people left to protect the oil fields apart from local security from isolated towns.”


Efforts to protect Libya’s oil are complicated immeasurably by the fractious (and that’s putting it nicely) political environment.
In short: the country is a modern day Wild West and a strong central government is now a distant memory. This makes administering the country’s resources nearly impossible. Oil production is now just a quarter of what it was under Qaddafi. Essentially, both of Libya’s two governments have what they call a National Oil Corp. The eastern NOC is run by the exiled government in Tobruk (which is internationally recognized), where the House of Representatives was exiled in 2014 after elections produced an outcome that wasn’t agreeable to Islamist elements in Tripoli.
Unfortunately, large foreign oil companies won’t work with Tobruk’s NOC which sets up the following ridiculous scenario: the internationally recognized government in Tobruk has an NOC no one wants to work with, while Tripoli’s NOC (which foreign oil companies will do business with) is run by a government that the world doesn’t deem legitimate.
To top it all off, there’s every reason to believe that neither Tobruk nor Tripoli actually control the country’s oil. Here’s Foreign Policy:
On the ground, the conflict involves far more than just the two bickering governments. Libya is composed of dozens of tribes, each with its own shifting interests and allegiances. “There’s a question about the extent to which the political forces actually have control over the important militias on the ground,” said Chivvis. “I think all this comes down to who controls the oil; it comes down to alliances on the ground. Which political forces control which sites within Libya.”
Ibrahim Jadhran is a perfect — and crucial — example. The 35-year-old was a militia leader during the 2011 revolution, and was appointed commander of the Petroleum Defense Guards by the still-unified transitional government in 2012. Originally from the eastern city of Ajdabiya, the rogue militia leader is an outspoken advocate of a federal system for Libya and frequently uses his power to open or close oil ports, shutting off oil exports — and therefore salaries — when he disagrees with either government.
“One of the initial causes for the plummeting of Libyan oil production was the blockade imposed by Ibrahim Jadhran in August of 2013,” said Porter. The commander has continued the tactic of stoppages in defiance of both regimes, even trying to steal a tanker full of crude to sell on the black market. The ship was finally stopped by the U.S. Navy off the coast of Cyprus.
Jadhran’s power is not to be underestimated. In fact, according to local media reports, it was actually him, and not the Tobruk government, that closed the Zuetina port. As Porter points out, it is Jadhran — not Tripoli or Tobruk — who truly controls exports.

Got that? There are two governments and two NOCs, but that doesn’t really matter because the whole show is run by a militia leader. “Jadhran is a mystery even to us. We have not yet understood what he really is, apart from an oil thief,” Misrata Military Council head Ibrahim Beitemal told Middle East Eye last year.
Ali al-Hassi (quoted above) is a spokesperson for Jadhran’s forces.
Islamic State then, is apparently at war with Jadhran which is interesting for a number of reasons.
First, Jadhran’s brother is in ISIS. “ISIS’ Libya branch released an online statement earlier in the week claiming to have taken control of the coastal city of Bin Jawed, about 120 miles east of Sirte,” CBS reported on Monday. “Bin Jawed is the last city before the oil town of Sidra and the huge oil port of Ras Lanouf, both currently witnessing fierce clashes between ISIS and al-Jadhran’s men.” And more: “ISIS fighters were reportedly attacking Siddra from three directions, aided by al-Jadhran’s own brother, who apparently joined the ISIS camp.”
Additionally, some say Jadhran once tried to broker a deal with the group and it’s not entirely clear what, if any, relationship he has with the militants. “We have been told that Jadhran proposed some reinforcements to ISIS but on the condition that he kept control of the oil ports and fields, but this was rejected,” a source told Middle East Eye.
So Libya’s vast oil wealth is effectively up for grabs and the person guarding it has a brother who not only joined ISIS, but is actually participating in the battle for key ports and facilities. Now, Britain is apparently on the verge of sending in thousands of troops to halt the ISIS advance in yet another example of the West engineering regime change only to go back in later in a futile attempt to clean up the mess.”Crack SAS troops are in Libya preparing for the arrival of around 1,000 British infantrymen to be sent against ISIS there in early 2016,” The Mirror reports. “The operation will involve around 6,000 American and European soldiers and marines – led by Italian forces and supported mainly by Britain and France.”
Of course that wouldn’t be necessary if the West hadn’t thrown out the government in Tripoli back in 2011. Now, the stepped up ISIS attacks threaten to derail the formation of a unitary governing body.
“In December, representatives of Libya’s two rival powers signed a United Nations-brokered power-sharing pact that called for the formation of a national unity government by mid-January,” WSJ notes, adding that the violence could “undermine the financial viability of a peace agreement by destroying the country’s main source of revenue.”
“I urge the swift formation of a national unity government and the establishment of a unified force structure capable of bringing peace to this country and protecting its natural resources,” Mustafa Sanallah, chairman of National Oil Co., said, in a statement posted on the company’s website on Wednesday.
Now that Russia has begun to dismantle Islamic State’s oil operation in Syria and now that the link with the Turks has been revealed, it might very well be that ISIS is turning to Libya as an alternative source of financing. Taking control of the country’s oil crescent would be a good start.
Will the country’s rival governments unite in time to stop the assault? Will Jadhran resort to some manner of negotiated settlement with ISIS if it means retaining his influence over Libya’s oil riches? How will ISIS get its captured crude to market without a cross-border state sponsor?
All good questions that will be answered soon enough. For now, we close with one final quote from Jadhran’s spokesperson:
“Pray for us.”
* * *

“Miss me yet?”
North Korea Confirms It Conducted “Successful Hydrogen Bomb Test” As “Act Of Self-Defense” Against US
North Korea has confirmed that it has “successfully tested a hydrogen bomb.” The test was “an act of self-defense” against threats like the US.
This is the 3rd test during Obama’s administration…
As we detailed earlier…
A 5.1-magnitude earthquake detected near North Korea’s nuclear test site appears to have been artificial, according to South Korea’s meteorological service, raising the prospect the isolated regime tested a nuclear device. As Bloomberg reports, the “earthquake” follows North Korea’s threat in September that it is ready to use atomic weapons against the U.S. at any time and that its main nuclear facility was fully operational. The Pentagon is reportedly “looking into” the quake reports.
Coincidence?

As AP reports,
South Korean officials detected an “artificial earthquake” near North Korea’s main nuclear test site Wednesday, a strong indication that nuclear-armed Pyongyang had conducted its fourth atomic test. North Korea said it planned an “important announcement” later Wednesday.
A confirmed test would mark another big step toward Pyongyang’s goal of buildinga warhead that can be mounted on a missile capable of reaching the U.S. mainland.
The U.S. Geological Survey measured the magnitude of the seismic activity at 5.1 on its website. An official from the Korea Metrological Administration, South Korea’s weather agency, said it believed the earthquake was caused artificially based on their analysis of the seismic waves and that it originated 49 kilometers (30 miles) north of Kilju, the northeastern area where North Korea’s main nuclear test site is located. The country conducted all three previous atomic detonations there.
South Korean government officials couldn’t immediately confirm whether a nuclear blast or natural earthquake had taken place.
North Korea conducted its third nuclear test in February 2013.
Another test would further North Korea’s international isolation by prompting a push for new, tougher sanctions at the United Nations and worsening Pyongyang’s already bad ties with Washington and its neighbors.
Pyongyang is thought to have a handful of crude nuclear weapons. The United States and its allies worry about North Korean nuclear tests because each new blast brings the country closer to perfecting its nuclear arsenal.
Since the elevation of young leader Kim Jong Un in 2011, North Korea has ramped up angry rhetoric against the leaders of allies Washington and Seoul and the U.S.-South Korean annual military drills it considers invasion preparation.
* * *
South Korea is responding:
“We are checking whether this is indeed a nuclear test or something else,” said a spokesman of the South’s Defense Ministry, who spoke on customary condition of anonymity.
- *S. KOREA TO CONVENE NATIONAL SECURITY MEETING AT 12PM: YONHAP
- *BOK TO HOLD MEETING AT 2 P.M. LOCAL TIME TO DISCUSS N. KOREA
* * *
It appears Kim has had enough playing second geopolitical pain-in-the-ass fiddle to Syria so decided to get back in the headlines.
Ironic really after Kim Jong-Un’s “fabulous” year.

Various twitter sources report that North Korea is due to make an “important announcement” at 2230ET.
Nomi Prins’ Financial Road Map For 2016: “The Potential For Chaotic Fluctuations Is Greater Than Ever”
Authored by Nomi Prins, author of “All The Presidents’ Bankers”, via NomiPrins.com,
We are currently in a transitional phase of geo-political-monetary power struggles, capital flow decisions, and fundamental economic choices. This remains a period of artisanal (central bank fabricated) money, high volatility, low growth, excessive wealth inequality, extreme speculation, and policies that preserve the appearance of big bank liquidity and concentration at the expense of long-term stability. The potential for chaotic fluctuations in any element of the capital markets is greater than ever.
The butterfly effect – the flutter of a wing in one part of the planet altering the course of seemingly unrelated events in another part – is on center stage. There is much information to process. So, I’d like to share with you – not my financial predictions for 2016 exactly – – but some of the items that I will be examining from a geographical, political and financial perspective as the year unfolds.
1) Central Banks: Artisans of Money
Since the Fed raised (hiked is too strong a word) rates by 25 basis points on December 16th, the Dow has dropped by about 3.5%. Indicating a mix of fear of decisive movements and a market awareness deficit regarding the impact of its actions, the Federal Reserve hedged its own rate rise announcement, noting that its “stance of monetary policy remains accommodative after this increase.”
These words seem fairly clear: there won’t be many, if any, hikes to come in 2016 unless economies markedly improve (which they won’t, or the words would be much more definitive.) Still, Janet Yellen did manage to alleviate some stress over the Fed’s inaction on rate rises during the past 7 years, by invoking the slighted action possible with respect to rates.
Projections are past reactions here. The Fed, to save face more than anything or to “appear” conclusive, raised the Fed Funds rate (the rate US banks charge each other to borrow excess reserves, of which about $2.5 billion are with the Fed anyway), to .25-.50% from 0-.25%. And yet, the effective rate stood within the old Fed target range, or at an average of .20% on December 31 for various reasons, the timing of which was not lost on the Fed. It was at .35% or so on the first day of 2016. The Fed’s rate move was tepid, and it’s possible the Fed moves rates up another 25 or 50 basis points over 2016, but less likely more than that and more likely it engages in heightened currency swap activities with other central banks as a way to “manage” rates and exchange rates regardless.
Meanwhile, most other central banks (Brazil being an extreme counter example) remain in easing mode or mirror mode to the Fed. It’s likely that more creative QE measures amongst the elite central banks will pop up if liquidity, markets or commodities head southward. Less powerful central banks will attempt to respond to the needs of their local economies while balancing the strains imposed upon them by the elite central banks.
2) Global Stock Markets
They say that behavior on the first day of the year is indicative of behavior in the year to come. If so, the first trading day doesn’t bode well for the rest. Turmoil began anew with Asian stock markets crumbling at the start of 2016. In China, the Shanghai Composite hit two circuit breakers and China further weakened the yuan.
Yes, there’s the prevailing growth-decline story, a relic of 2015 “popular opinion”, being served as a reason for the drop. But also, restrictions on short selling by local Chinese companies are expiring. Just as in last August, China will have to balance imposing fresh sell restrictions with market forces pushing the yuan down.
The People’s Bank of China will likely inject more liquidity through further reserve requirement reductions and rate cuts to counter balance losses. The demise in stock values is not simply due to slower growth, but to high debt burdens and speculative foreign capital outflows; the story of China as a quick bet is no longer as hot as it was when China opened its markets to more foreign investors in mid-2014, since which volumes and volatility increased. It will be interesting to see if China responds with more capital controls or less, and how its “long-game” of global investments plays out.
Blood shed followed Asian into European markets. Subsequently, the Dow dropped by about 1.6% unleashing its worst start to a year since the financial crisis began. Last year’s theme to me was volatility rising; this year is about markets falling, even core ones. This is both a reaction to global and local economic weakness, and speculative capital pondering definitive new stomping grounds, hence thinner and more dispersed volumes will be moving markets.
3) Global Debt and Defaults
As of November 2015, Standard & Poor’s tallied the number of global companies that defaulted at 99, a figure only exceeded by that of 222 in 2009. Debt loads now present greater dangers. Not only did companies (and governments, of course) pile on debt during this zero interest rate bonanza period; but currency values also declined relative to the dollar, making interest payments more expensive on a local basis.
If the dollar remains comparatively strong or local economies weaken by an amount equivalent to any dollar weakening, more defaults are likely in 2016. In addition, the proportion of junk bonds relative to investment grade bonds grew from 40% to 50% since the financial crisis, making the likelihood of defaults that much greater. Plus, the increase in foreign, especially dollar, denominated debt in emerging markets will continue to hurt those countries from a sovereign downgrade and a corporate downgrade to default basis.
I expect sovereign downgrades to increase this year in tandem with corporate downgrades and defaults. Also, as corporate defaults or default probabilities increase, so does corporate fraud discovery. This will be a year of global corporate scandals.
In the US about 60% of 2015 defaults were in the oil and gas industry, but if oil prices stay low or drop further, more will come. Related industries will also be impacted. In mid-December, Fitch released its leveraged loan default forecast of the TTM (Trailing Twelve Month index) predicting a 2.5% rise in default rates for 2016, or $24 billion in global defaults. That’s an almost 50% increase in default volume over 2015, and more than the total over the 2011-2013 period. Besides higher energy sector defaults, the retail sector could see more defaults, as consumers lose out and curtail spending.
4) Brazil and Argentina
Brazil is a basket case on multiple levels with nothing to indicate 2016 will be anything but messier than 2015. Even the upcoming Olympics there have reeked of scandal in the lead up to the summer games.
Brazilian corporations have already sold $10 billion in assets to scrape together cash in 2015, a drop in the bucket to what’s needed. Brazil’s main company, Petrobras, is mired in scandal, its bond and share prices took massive hits last year as it got downgraded to junk, and a feeding frenzy between US, Europe and China for any of its assets on the cheap won’t be enough to alter the downward trajectory of Brazilian’s economy. In fact, it will just make recovery harder as core resources will be effectively outsourced.
Fitch downgraded seven Brazilian sub nationals to junk, with more downgrades to come. Brazil itself was downgraded to junk by S&P with no positive outlook from anywhere for 2016. Falling revenues plus higher financial costs due to higher debt burdens will accentuate trouble. In addition, pension funds are going to be increasingly underfunded, which will enhance local population and political unrest, as unemployment increases, too.
Though Brazil will have the toughest time relative to neighboring countries, Argentina, will not be having a walk in the park under its new government either. The new centrist government removed currency capital controls in a desperate bid to attract capital. This resulted in crushing the Argentinean Peso (a.k.a. “Marci’s devaluation”) and will only invite further speculative and political volatility into the country. It could get ugly.
5) The Dollar and Gold
Despite what will be a year of continued pathways to trade and currency arrangements amongst countries trying to distance themselves from the US dollar, the fact that much of the world is careening toward global Depression will keep the dollar higher than it deserves to be. It will remain the comparative currency of choice, as long as central banks continue to fabricate liquidity in place of government revenues from productive growth.
Outside the US, most central banks (except Brazil which has a massive inflation problem) have maintained policies of rate reduction, lower reserve requirements, and other forms of QE or currency swap activities. As in 2015, the dollar will be a benefactor, despite problems facing the US economy and its general mismanagement of monetary policy. But the US dollar index and the dollar itself might exhibit more volatility to the downside this year, straying from its high levels more frequently than during 2015.
Last year, given the enhanced volatility in various markets, I expected gold to rise during the summer as a safe haven choice, which it did, but it also ended the year lower in US dollar terms. Because the US dollar preserved its strength, the dollar price of gold fell during the year – yet not by as much as other commodities, like oil.
I take that as a sign of gold finding some sort of a floor relative to the US dollar, with the possibility of more upside than downside for 2016, though in similar volatility bands to the US dollar. Gold relative to the Euro was just slightly down for 2015, relative to the approximate 10% decline in value relative to the US dollar. Considering the home currency is important when examining gold price behavior.
Also, it’s important to note that investing in gold requires a longer time horizon – months and years, rather than weeks and months – and should be done through physical gold, coins orallocated bars depending on disposable investment thresholds, not paper gold.
In addition, as I mentioned last year, routinely extracting cash from bank accounts and keeping it in safe non-bank locations, remains a smart defensive play for 2016.
6) The People’s Economies
As companies default and economies suffer, industries will inevitably shed jobs this year around the world. The Fed’s publicly expressed optimism about employment figures and the headline figure decrease in US unemployment will be met with the realities of companies cutting jobs to pay the debts they took on during the ZIRP years and due to decreased demand.
Unemployment is already rising in many emerging countries, and it will be important to note what happens in Europe and Japan, as well as the US in that regard. This Recession 3.0 (or ongoing Depression) could fuel further artisanal money practices that might again be good for the markets and banks, but not for real economies or jobs lost through reactive corporate actions.
7) Oil
With Saudi Arabia and Iran pissed off at each other in a round of tit-for-tat power positioning, it’s unlikely either OPEC heavy weight will reduce oil production, this while tankers worldwide remain laden with their loads and rigs are quiet. Tankers off the coast of Long Beach in California for instance, that used to come in and unload, remain in stalling patterns away from the shoreline, waiting for better prices. This means tankers are making money on storage, but also that extra oil supplies are hovering off shore, and even if prices rise, release of that supply would have a dampening consequence on prices.
Oil futures have been a generally highly speculated product, so I’ve never believed that simple supply and demand ratios drive the price of spot oil as it relates to the futures price of oil. Only in this case, not only is there oversupply and weakening demand, but speculators are playing to the short side as well. That combination seems destined to keep oil prices low, or push them lower in the near future, but should be closely watched.
Meanwhile, signs of knock on problems are growing. In China, for instance, shipyards are struggling because global rig customers don’t need their rig model orders fulfilled.
8) Europe
While Greece faces more blood-from-a-stone extortion tactics and none of the Troika get why austerity measures don’t actually produce local revenues at high enough levels to pay expensive debts to foreign investors and multinational entities, other parts of Europe aren’t looking much better for 2016. Spain is facing political unrest, Italy, despite exhibiting a tenuous recovery of sorts, still has a major unemployment problem, and the Bank of Portugal lowered its growth estimates – for the next two years.
Mario Draghi, European Central Bank (ECB) head decided to extend Euro-QE to March 2017 from September 2016, having had the markets punish his less enthusiastic verbiages about QE late last year, because he has no other game. The Euro will thus likely continue to drop in value against the dollar, negative interest rates will prevail, and potential bail ins will appear if this extra dose of QE doesn’t keep the wheels, big banks and core markets of Europe properly greased.
9) Mexico
The Mexican Peso closed near record lows vs. the dollar for 2015. Much of the Peso’s weakness was attributed to low oil prices and Mexico’s dependence on its oil sector, but the Peso was already depreciating before oil prices dropped. If the US dollar remains comparatively high OR if oil prices continue to remain low or drop, the Peso is likely to do the same.
When I was in Mexico a few years ago, addressing the Senate on the dangers of foreign bank concentration, there were protests throughout Mexico City on everything from teachers’ pay to the opening of Pemex, Mexico’s main oil company to foreign players. The government’s promise then was that foreign firms would provide capital to Mexico as well as industry expertise that would translate to revenues. Oil prices were hedged then at 74 dollars per barrel. With oil prices at half of that, many of those hedges are coming off this year and that will cause additional pain to the industry and Pemex.
That said, though Mexico will feel the global Depression pain this year as a major player, it is still set to have a much better year than Brazil on every level; from a higher stock market to a higher currency valuation relative to the US dollar to lower inflation to lower unemployment to a better balance of trade with the US than Brazil will have with China. Plus, it has far less obvious inbred corporate-government corruption.
10) Elections and Media Coverage
It’s been a minute since the last debate or late night show fly-by from any Presidential hopeful, but this is the year of the US election. I look forward to continuing to post my monthly wrap on TomDispatch as the Democratic and Republican nominees emerge. I will be taking stock of the most expensive election in not just US history, but in the history of the World. Look for more on the numbers behind the politics later this month.
From a financial standpoint, this election has low impact on flows of capital. Given the platforms of everyone in reasonable contention (with the exception of Bernie Sanders’ platform), no one will actually touch excessive speculation, concentration risk in the banking or other critical sectors like healthcare, or meaningfully examine the global role of artisanal central bank policy, particularly as emanating from the Fed.
Elsewhere, economic stress throughout the globe and a general sense of exasperation and distrust with politicians is putting new leaders in place that are pushing for more austerity or open capital flow programs rather than foundational growth and restrictions on the kind of flows that cause undue harm to local economies. That is a recipe for further economic disaster that will fall most heavily on populations worldwide.
your early morning currency/gold and silver pricing/Asian and European bourse movements/ and interest rate settings/WEDNESDAY morning 7:00 am
Euro/USA 1.0746 down .0004
USA/JAPAN YEN 118.37 down .27
GBP/USA 1.4646 down .0037
USA/CAN 1.4093 up .0106
Early this morning in Europe, the Euro fell by 4 basis points, trading now well below the important 1.08 level falling to 1.0746; Europe is still reacting to deflation, announcements of massive stimulation (QE), a proxy middle east war, and the ramifications of a default at the Austrian Hypo bank, an imminent default of Greece, Glencore, Nysmark and the Ukraine, along with rising peripheral bond yield,collapsing global bourses further stimulation as the EU is moving more into NIRP and the USA tightening by raising their interest rate / Last night the Chinese yuan was down massively in value (onshore). The USA/CNY down in rate at closing last night: 6.5527 / (yuan down and still undergoing massive devaluation which will spread throughout the globe)
In Japan Abe went all in with Abenomics with another round of QE purchasing 80 trillion yen from 70 trillion on Oct 31/2014. The yen now trades in a northbound trajectory as settled up again in Japan by 74 basis points and trading now well below that all important 120 level to 118.37 yen to the dollar.
The pound was down this morning by 27 basis points as it now trades just below the 1.47 level at 1.4646.
The Canadian dollar is now trading down 106 in basis points to 1.4093 to the dollar.(due to collapsing oil prices)
We are seeing that the 3 major global carry trades are being unwound. The BIGGY is the first one;
1. the total dollar global short is 9 trillion USA and as such we are now witnessing a sea of red blood on the streets as derivatives blow up with the massive rise in the rise in the dollar against all paper currencies and especially with the fall of the yuan carry trade. The emerging market which house close to 50% of the 9 trillion dollar short is feeling the massive pain as their debt is quite unmanageable.
2, the Nikkei average vs gold carry trade (blowing up and the yen carry trade also blowing up)
3. Short Swiss franc/long assets (European housing/Nikkei etc. This has partly blown up (see Hypo bank failure).(blew up)
These massive carry trades are terribly offside as they are being unwound. It is causing global deflation ( we are at debt saturation already) as the world reacts to lack of demand and a scarcity of debt collateral. Bourses around the globe are reacting in kind to these events as well as the potential for a GREXIT>
The NIKKEI: this WEDNESDAY morning: closed down 182.68 or .99%
Trading from Europe and Asia:
1. Europe stocks all deeply in the red
2/ Asian bourses all in the red except the badly manipulated Shanghai / Chinese bourses: Hang Sang red (massive bubble forming) ,Shanghai in the green/last hour rise / (massive bubble ready to burst), Australia in the red: /Nikkei (Japan) red/India’s Sensex in the red /
Gold very early morning trading: $1085.30
silver:$14.00
Early WEDNESDAY morning USA 10 year bond yield: 2.19% !!! down 4 in basis points from TUESDAY night and it is trading BELOW resistance at 2.27-2.32%. The 30 yr bond yield falls to 2.95 down 5 in basis points. ( still policy error)
USA dollar index early WEDNESDAY morning: 99.39 up 6 cents from TUESDAY’s close. ( Now below resistance at a DXY of 100)
This ends early morning numbers WEDNESDAY MORNING
end
OIL RELATED STORIES
Crude drops into the 34 dollar column after record gasoline inventory build up plus Cushing increase;
(courtesy zero hedge)
WTI Crude Plunges To $34 Handle After Record Gasoline Inventory Build
Following last night’s API-reported large draw in overall crude inventories (year-end and exports driven), DOE reports a 5.09mm draw (more than expectations of a 4.1mm draw but less than API’s 5.6mm draw). However, Cushing inventories rose for the 9th week in a row (+917k) and more troubling for the future is gasoline inventories soared 10.58mm barrels – an all-time record (and distillates rose 6.31mm barrels). Crude prices already gave up their API gains and are tumbling back below $35 on this build news.
DOE conmfirms API’s reported large draw but Cushing continues to build for the 9th week in a row…

But…
- *GASOLINE INVENTORIES ROSE 4.78%, EIA SAYS
- *DISTILLATE INVENTORIES ROSE 4.12%, EIA SAYS
A record build in gasoline stocks!!

The build in distillates means that primary product may be gettiung shipped away but there is no demand.So exporting oil from US helps with overall inventory decline, but massive build of gas, distillate shows clear production surplus
And even more worrisome, Domestic Supply in lower 48 up 20,000 boe/d and HIGHER than a year ago.
Crude jumped on the API news but gave it all up as growth fears rose overnight…

As we continue to remind traders – December ALWAYS see notably drawdowns as firms lighten up inventories on their balance sheet ahead of year-end to reduce tax burdens…

And judging from history, as Bloomberg notes, it should resume as soon as the festive season is over:Stocks have built by 3.2 million barrels on average in January since 1921.
Charts: Bloomberg
Fed Lack Of Confidence Sends WTI Crude To $33 Handle Even As Dollar Dumps
The FOMC Minutes hardly rang loudly and proudly of the strong economy that warrants rate hikes… and crude is tumbling.

The Shale Defaults Begin Here: Banks Quietly Shrink These 25 Companies’ Credit Facilities
Everyone knows that at $35/barrel oil, virtually every US shale company is cash flow negative and is therefore burning through cash and other forms of liquidity such as bank revolvers and term loans, just as everyone knows that should oil remain at these prices, the US shale sector is facing an avalanche of defaults.
What is less known is who will be the next round of companies to default.
One good place to get an answer is to find which companies’ bankers are quietly tightening the liquidity noose (because they don’t want to be stuck holding worthless assets in bankruptcy or for whatever other reason), by quietly reducing the borrowing base on existing credit facilities.
It is these companies which find themselves inside this toxic feedback loop of declining liquidity, which forces them to utilize assets even faster, thus even further shrinking the borrowing base against which their banks have lent them money, that will be at the forefront of the epic bankruptcy wave that is waiting to be unleashed across the US, leading to tens of billions of defaults junk bonds over the next 12-18 months.
So, without further ado here are 25 deeply distressed companies, whose banks we found have quietly shrunk the borrowing base of their credit facilities anywhere from 6% in the case of Black Ridge Oil and Gas to a whopping 51% for soon to be insolvent New Source Energy Partners.

Source: Bloomberg
Stocks Plunge To 3-Month Lows Amid Crude Carnage, Chinese Currency Collapse
Ok to summarize – China has lost control of its currency (whether intentionally or not) and that is forcing carry unwinds en masse; North Korea tests a nuke; European inflation disappoints; US services economy collapses (follows manufacturing’s lead and another pillar of hope is destroyed); Crude crashes to fresh decade plus lows; The Fed offers nothing in the way of hope for growth (or puts); Bernanke says not to expect Fed to save stocks; World Bank cuts global growth outlook… But apart from that, everything is awesome!!!
Before we start, this happened!! Bloodbath in Yuan (offshore Yuan near record lows)…

On the day, a wild ride… with the ubiquitous closing ramp

Deja Deja Vu all over again…

On the week – year-to-date – it appears bad news is bad news – let’s just hope China doesn’t open tonight eh?

Note that evwerything but Nasdaq is red since the end of QE3…

Post-FOMC, everything was chaotic… Gold flat, bonds up and stocks rescued…

We do note the VIX-manipulation to move stocks around…

Stocks are catching down to their breadth-based reality…

And it’s looking a lot like August again…

Energy stocks plunged back to reality… who could have seen that coming?

Financials are catchiung down to credit again…

FANTAsy stocks were mostly lower but NFLX was ripped higher as CEO Reid Hadtings spewed some more bullshit… #netflixeverywhere – seriously!!

AAPL had a mysterious massive buyer as it broke $100…

Treaaury yields plunged with 7Y back under 2% and 30Y back under 3%… on the week 2s30s is now 6bps flatter

The USD slipped lower after FOMC Minutes but is brioadly flat for 2 days (and up on the week)…as AUD collapses and JPY surges…

Crude was clubbed, copper limped lower but PMS rallied further…

Carnage…

WTI Crude crashes to its lowest level since Dec 08’s lows at $32.40…

Charts: Bloomberg
ADP Payrolls Soar To Highest Since 2014, Zandi Sees “Return To Full Employment By Mid-Year”
Great news right? For those hoping for some “bad news is good news to slow The Fed down” data, ADP is a disappointment. The December monthly change was a rise of 257k – hugely better than the expected 198k and the biggest ise since December 2014. Most importantly the goods-producing sector added a shocking 23,000 jobs – despite every single manufacturing indicator deep in recession. Service-sector jobs added 234k.
Best jobs gains in a year (does that sound right?)

The details from the report:

Payrolls for businesses with 49 or fewer employees increased by 95,000 jobs in December, up from November’s downwardly revised 72,000. Employment among companies with 50-499 employees increased by 65,000 jobs, up about 10 percent from last month. Employment at large companies – those with 500 or more employees – came in at 97,000 an increase from the upwardly revised 80,000 jobs added in November. Companies with 500-999 added 39,000 jobs, while companies with over 1,000 employees gained 58,000 jobs.Goods-producing employment rose by 23,000 jobs in December, well up from a downwardly revised -2,000 the previous month. The construction industry added 24,000 jobs, which was roughly in line with the 21,000 average monthly jobs gained for the year. Meanwhile, manufacturing stayed in positive territory for the second straight month adding 2,000 jobs.
Service-providing employment rose by 234,000 jobs in December, up from an upwardly revised 213,000 in November. The ADP National Employment Report indicates that professional/business services contributed 66,000 jobs, the largest increase in this sector in 2015. Trade/transportation/utilities grew by 38,000, off a bit from an upwardly revised 41,000 the previous month. The 13,000 new jobs added in
financial activities were right in line with the average for the year.
“2015 had a strong close with December showing the largest job gains of the year,”said Ahu Yildirmaz, VP and head of the ADP Research Institute. “Overall, the average monthly employment growth was just under 200,000 for the year in contrast to almost 240,000 jobs per month in 2014. Weakness in the energy and manufacturing sectors was mostly responsible for the drop off.”Mark Zandi, chief economist of Moody’s Analytics, said, “Strong job growth shows no signs of abating. The only industry shedding jobs is energy. If this pace of job growth is sustained, which seems likely, the economy will be back to full employment by mid-year. This is a significant achievement, given that the last time the economy was at full employment was nearly a decade ago.”


http://www.adpemploymentreport.com/2015/December/NER/images/infographic/…” width=”598″ />
Charts: Bloomberg
Dear Mark Zandi… Please Explain This
If Mark Zandi and his “whatever it takes” seasonal-adjusters at ADP are to be believed, the US manufacturing sector added the most jobs in 11 months in December. Our question is simple – with ISM Manufacturing Employment at post-recession lows and US Manufacturing PMIs at post-recesssion lows, and inventories-to-sales ratios at post-recession highs, why are goods-producers hiring at such a frantic pace?

Double-Seasonal-adjustment?
Trade Deficit Improves In November Despite Trade Slowdown, As “Exports Decrease Less Than Imports”
While the recent dramatic revision in construction spending – a direct input into GDP – which as we noted earlier this week, was a huge revision in the series by the US government which admitted to “processing errors” would lead to substantial downward revisions to recent GDP prints, moments ago the US November Trade deficit printed at $42.4 billion, down from $44.6 billion in October and better than the $44.0 billion consensus expectation.
However, instead of suggesting on overall improvement, the only reason the deficit improved is because as the BEA admitted, “exports decreased less than imports”, in other words, both decreased. Specifically, imports fell 1.7% in Nov. to $224.59b from $228.36b in Oct, while exports fell 0.9% in Nov. to $182.21b from $183.78b in Oct. A key driver was another decline in petroleum imports which fell $262 million to a total of $10.7 billion courtesy of the drop in oil prices.

From the report:
The U.S. monthly international trade deficit decreased in November 2015 according to the U.S. Bureau of Economic Analysis and the U.S. Census Bureau. The deficit decreased from $44.6 billion in October (revised) to $42.4 billion in November, as exports decreased less than imports. The previously published October deficit was $43.9 billion. The goods deficit decreased $2.3 billion from October to $61.3 billion in November. The services surplus decreased $0.1 billion from October to $18.9 billion in November.
The full breakdown, first Exports
- Exports of goods and services decreased $1.6 billion, or 0.9 percent, in November to $182.2 billion. Exports of goods decreased $1.4 billion and exports of services decreased $0.1 billion.
- The decrease in exports of goods mainly reflected decreases in other goods ($0.7 billion), in industrial supplies and materials ($0.7 billion), and in consumer goods ($0.6 billion).
- The decrease in exports of services mainly reflected decreases in transport ($0.1 billion), which includes freight and port services and passenger fares, and in government goods and services ($0.1 billion).
Then Imports
- Imports of goods and services decreased $3.8 billion, or 1.7 percent, in November to $224.6 billion. Imports of goods decreased $3.7 billion and imports of services decreased $0.1 billion.
- The decrease in imports of goods mainly reflected decreases in consumer goods ($3.0 billion) and in capital goods ($0.6 billion).
- The decrease in imports of services mainly reflected a decrease in travel (for all purposes including education) ($0.1 billion).
And the breakdown of trade by key geographic area:
- The deficit with Mexico decreased from $6.3 billion in October to $5.4 billion in November. Exports decreased $0.9 billion to $18.8 billion and imports decreased $1.8 billion to $24.2 billion.
- The surplus with members of OPEC increased from $0.4 billion in October to $1.1 billion in November. Exports increased $1.3 billion to $6.5 billion and imports increased $0.6 billion to $5.4 billion.
- The deficit with Canada increased from $0.4 billion in October to $0.9 billion in November. Exports decreased $0.1 billion to $22.7 billion and imports increased $0.4 billion to $23.5 billion.
In short: global trade continues to slow, but because the price of imports is tumbling, and because exports are slowing less than imports, this is an improvement and may boost Q4 GDP marginally from already sub-stall speed levels.
end
Manufacturing Leads, Services Follow: ISM Collapses To Weakest Since March 2014 As “Pace Of Hiring” Slows
As goes US manufacturing, so goes US services. In a narrative-crushing print, US Services PMI dropped to 54.3 – the lowest since January 2015. Output and New business growth slumped to 11-month lows, optimism dropped, and input cost inflation continued to moderate as “suggests the pace of hiring has slowed since earlier in the year as businesses have become more cautious.” Then, confirming this plunge, ISM Services printed 55.3 – its lowest since March 2014 as unadjusted new orders collapsed to their lowest since February 2014.
Sevices PMI tumbles…

Catching down to Manufacturing (who could have seen that coming?)

“The PMI surveys show the service sector losing momentum alongside a stalling of growth in the manufacturing sector, pushing the overall rate of economic expansion down to the weakest for a year.”The survey also signals robust employment growth, but likewise suggests the pace of hiring has slowed since earlier in the year as businesses have become more cautious in the face of worries such as the forthcoming elections, the strong dollar, global growth jitters and the outlook for interest rates. The December survey data are consistent with non-farm payrolls rising by around 175,000 compared to an average of 200,000 in the first eleven months of the year.
And then ISM hit...and it was a disaster – crashing to levels it was last lower than in March 2014…

Unadjusted new ordrs plunged…

WHAT RESPONDENTS ARE SAYING…
“Business continues to be strong for consulting/operational outsourcing of real estate operations.” (Management of Companies & Support Services)
“Professional and skilled craft labor is difficult to find.” (Construction)
“Continued downturn in global energy pricing has given way to reduced costs from vendors.” (Mining)
“We see continued spend demand higher than any months of this year; however, productivity reaches its peak and projects have to be carried over to 2016.” (Professional, Scientific & Technical Services)
“Holiday shopping volume is in line with forecast.” (Retail Trade)
“Currently very busy in the holiday rush season. Purchasing of supplies, postage & freight, and direct labor all more than double non-holiday periods.” (Transportation & Warehousing)
“The supply chain is faster than in previous years and equipment is more readily available.” (Wholesale Trade)
“Construction projects continue at a record pace.” (Educational Services)
* * *
It would appear the “yeah but The Services Economy will save us” meme just collapsed – so what next?
US Factory Orders Deep In Recession – Tumble YoY For 13th Month In A Row
US factory orders have never dropped this far for so long without the US economy overall being in recession. November’s 4.2% YoY drop is the 13th consecutive monthly drop. Revistions to durable goods data shows a 1% drop in new orders ex-defense in November after rising 1.4% in October.. and as a reminder, this data was buoyed by a 46.9% surge in defense aircraft and parts orders to all-time highs.
Factory Ordedrs are flashing deep red recessionary indicators…

And nominally orders are going nowehere…

Traders better hope for moar war or the reality of the economy will peak out from behind the military-industrial complex veil. This was the highest level of defense spending since 9/11!!
Chipotle December Sales Collapse; Reports Receipt Of FDA Subpoena, New Stock Buyback
And the hits just keep on coming. In a double-whammy for investors hoping to catch Chipotle’s falling-knife, the mexican fast-food restaurant reports a 30% collapse in same-store-sales for December and receiving a grand jury subpoena with regard the California Norovirus event. The stock crashed 10% on the news. However, the stock’s initial collapse has been rescued as CMG reports a boost to its buyback program… seriously!
From CMG’s statement:
December 2015 Sales Trend Detail
In a report on Form 8-K filed on December 4, we noted that comparable restaurant sales were trending at -16% at the onset of the month. Following the isolated norovirus incident during the week of December 7 in a Chipotle restaurant in Brighton, Massachusetts, which garnered national media attention, comparable restaurant sales decreased to average -34%, and then recovered to -31%. The week of December 21, 2015, the U. S. Centers for Disease Control and Prevention (CDC) announced that new illnesses related to the E. coli incident associated with Chipotle restaurants in October and November 2015 had slowed substantially, but also that it is investigating five new cases that were reported in November 2015 of the same strain of E. coli O26 but with a different DNA fingerprint. Following this announcement and related national media attention, our comparable restaurant sales trended down to -37%.For the full month of December, comparable restaurant sales were -30%. Future sales trends may be significantly influenced by further developments.
Receipt of Grand Jury Subpoena
In December 2015, Chipotle was served with a Federal Grand Jury Subpoena from the U.S. District Court for the Central District of California in connection with an official criminal investigation being conducted by the U.S. Attorney’s Office for the Central District of California, in conjunction with the U.S. Food and Drug Administration’s Office of Criminal Investigations. The subpoena requires us to produce a broad range of documents related to a Chipotle restaurant in Simi Valley, California, that experienced an isolated norovirus incident during August 2015. We intend to fully cooperate in the investigation.
It is not possible at this time to determine whether we will incur, or to reasonably estimate the amount of, any fines, penalties or further liabilities in connection with the investigation pursuant to which the subpoena was issued.
The stock crashed…

But the stock is being rescued:
This report is also filed to announce that our Board of Directors has authorized repurchases of Chipotle common stock with a total aggregate purchase price of $300 million, exclusive of commissions.
These authorized repurchases are in addition to $300 million in repurchase authorizations announced on December 4, 2015, of which $116 million remained available as of December 31, 2015.
During the fourth quarter 2015, we repurchased approximately 609 thousand shares of stock at an average price of $556 per share. During the month of December, we repurchased approximately 401 thousand shares of stock at an average price of $527 per share. The Board’s authorization of the repurchase program may be modified, suspended or discontinued at any time.
So they are facing a huge loss on recently purcahsed buyback shares… but Buybacks are the solution to all problems it would appear…

How long will that bounce last?
end
Apple Tumbles To ETFlash Crash Levels, Saved (For Now) By Another Tim Cook Hail Mary Announcement
Apple’s shares broke below $100 in pre-market trading as analyst downgrades and further component producer outlook reductions weighed heavily on the “no brainer.” It appears increasingly likely that Tim Cook’s “rescue” email to Cramer on August was perhaps not the entire truth.. and the market is trading back to levels it first crossed in August 2014 (i.e. unchanged in 16 months). Of course, amid this carnage this morning, AAPL attempted to save the day and issued a quick statement proclaiming January 1st as the biggest App Store spending day in history… for now the stock is not excited about that.
Following our reports of FoxConn’s hiring freeze in November 9which was ignored by all the talking heads), and confirming Nikkei’s recent report of a 30% production cut in iPhones, this morning’s headlines are not helping…
- Hit 1: *CATCHER TECHNOLOGY SAYS APPLE SLOWDOWN SEEN HITTING 1H: NIKKEI
- Hit 2: *APPLE CUT TO NEUTRAL VS BUY AT ROSENBLATT
Stock tumbles below $100…

Then saved: *APPLE SAYS JAN. 1 WAS BIGGEST DAY IN APP STORE HISTORY
But it’s not lasting.
* * *
However, things just do not add up the way that Tim Cook said they were…
Here is what Tim Cook told Jim Cramer via email at the peak of the panic in August:
“I get updates on our performance in China every day, including this morning, and I can tell you that we have continued to experience strong growth for our business in China through July and August. Growth in iPhone activations has actually accelerated over the past few weeks, and we have had the best performance of the year for the App Store in China during the last 2 weeks.”
As we asked at the peak of the panic in August, So did Tim Cook lie?
If one uses channel check data to objectively determine end demand, the answer is a resounding yes. To be sure, Cook may be telling the truth in a very narrow sense, if Apple is simply be resorting to the oldest trick in the book at this point: channel stuffing.
The problem with channel stuffing is that it only allows you to mask the problem for 2-3 quarters at which unless there has been a dramatic improvement in the end-demand picture, it re-emerges that much more acutely: just ask AOL which was channel stuffing for months on end, only to be ultimately exposed, leading to a epic plunge in the stock price.
It all depends on China: if the world’s most populous nation can get its stock market, its economy and its currency under control, then this too shall pass. The problem is that if, as many increasingly suggest, China has lost control of all three. At that point anyone who thought they got a great deal when buying AAPL at $92 will have far better opportunities to dollar-cost average far, far lower.
Macy’s Massacre: Retailer Slashes Guidance Again, Fires Thousands; Blames Warm Weather
It was less than two months ago when we brought to you the “Macy’s Massacre”: on November 11, the stock of the iconic retailer crashed 13% and its CDS soared after Macy’s reported a trifecta of weak data, reporting a miss on Q3 sales which came at $5.87 billion below the $6.1 billion expected, down from the $6.2 billion, but also a plunge in comparable store sales which tumbled by 3.9%, far worse than the expected drop of -0.4%, and nearly three times as bad as the 1.4% drop a year ago.
Cash flow also plunged: cash provided by operating activities was $278 million in the first three quarters of 2015, compared with $841 million in the first three quarters of 2014.
Finally, M also slashed its full year same store guidance down from flat to -1.8% to -2.2% with sales projected to drop -2.7% to -3.1%, compared to a previous guidance of -1%, as contrary to the propaganda, the discretionary spending of the US consumer is bad and getting worse by the day.
Fast forward to today when the massacre is back with a vengeance, after the company not only reported yet another cut in its guidance, but also announced it would be laying off another boatload of retailers, demonstrating just how strong the “service” economy truly is.
First, Macy’s said that its comparable sales on an owned plus licensed basis declined by 4.7% percent in the months of November and December 2015 combined, compared with the same period last year. This compares to previous, already poor guidance, of -2% to -3%. The weather was, of course, blamed.
“The holiday selling season was challenging, as experienced throughout 2015 by much of the retailing industry. In the November/December period, we were particularly disadvantaged by the historically warm weather in northern climate zones where both Macy’s and Bloomingdale’s are especially well-represented. About 80 percent of our company’s year-over-year declines in comparable sales can be attributed to shortfalls in cold-weather goods such as coats, sweaters, boots, hats, gloves and scarves. We also continued to feel the impact of lower spending by international tourists as the value of the dollar remained strong,” said Terry J. Lundgren, Macy’s, Inc. chairman and chief executive officer.
Compare this to Macy’s 8-K from precisely two years ago, and try not to laugh too hard
“poor January sales were due to the unusually harsh winter weather across much of the country. Once warm spring weather arrives and our full assortment of fresh spring merchandise is in place, we believe customers will return to a more normalized pattern of shopping.”
So much for the comedy, now back to the tragedy for shareholders, as the company admits not even “harsh cold weather” can save it as it slashes earnings guidance…
Macy’s, Inc. is not expecting a major change in sales trend in January and expects a comparable sales decline on an owned plus licensed basis in the fourth quarter of 2015 to approximate the 4.7 percent decline in November/December (from previous guidance of down between 2 percent and 3 percent for the fourth quarter). This calculates to guidance for comparable sales on an owned plus licensed basis in the full-year 2015 to decline by approximately 2.7 percent (from previous guidance of down 1.8 percent to 2.2 percent).
Earnings per diluted share for the full-year 2015 now are expected in the range of $3.85 to $3.90, excluding expenses related to cost efficiencies announced today and asset impairment charges associated primarily with spring 2016 store closings. This compares with previous guidance in the range of $4.20 to $4.30. Updated annual guidance calculates to guidance for fourth quarter earnings of $2.18 to $2.23 per diluted share, excluding charges associated with cost efficiencies and store closings. This compares with previous guidance for earnings per diluted share of $2.54 to $2.64 in the fourth quarter. Earnings guidance for 2015 includes an expected $250 million gain on the sale of real estate in downtown Brooklyn.
… and a tragedy for its employees, many of whom are about to be fired.
Macy’s, Inc. today announced a series of cost-efficiency and process improvement measures to be implemented beginning in early 2016 that will reduce SG&A expense by approximately $400 million while still investing in growth strategies, particularly in omnichannel capabilities at Macy’s and Bloomingdale’s. The actions represent progress toward the company’s previously stated goal of re-attaining over time an EBITDA rate as a percent of sales of 14 percent.
To address the need for greater efficiency and productivity, among the changes being implemented by Macy’s, Inc. in early 2016 are:
Adjusting staffing levels at each Macy’s and Bloomingdale’s store in line with current sales volume to increase productivity and improve efficiency. An average of three to four positions will be affected in each of Macy’s and Bloomingdale’s approximately 770 going-forward stores (out of an average workforce of approximately 150 associates in each store), for a total of about 3,000 affected associates nationwide. Roughly 50 percent of affected store associates are expected to be placed in other positions.
Implementing a voluntary separation opportunity for about 165 senior executives in Macy’s and Bloomingdale’s central stores, office and support functions who meet certain age and service requirements and chose to leave the company beginning in spring 2016. Approximately 35 percent of these executive positions will not be replaced.
Reducing an additional 600 positions in back-office organizations by eliminating tasks, simplifying processes and combining positions, with about 150 of these associates reassigned to other positions.
Luckily, the US service economy is so very strong as Macy’s results confirm, or otherwise someone might get the idea that the “manufacturing recession is not contained.”
FOMC Minutes Show Fed Rate Hike Decision Was “A Close Call”, Feared Market Reaction
Since The December 16th FOMC decision to hike rates, Gold is up over 2%, Bonds up 1%, and stocks down 3% suggesting the word “error” with regard Fed policy. As The FOMC Minutes are released, traders anticipate confident-hawkishness and a focus on ignoring current data in favor of preferring their own confident outlook:
- *ALMOST ALL FED OFFICIALS AGREED LIFTOFF CONDITIONS MET IN DEC.
- *FED: LINGERING RISKS TO OUTLOOK INCLUDED FURTHER USD STRENGTH
- *A FEW FED OFFICIALS SAID FINANCIAL RISKS COULD ALTER RATE PATH
January’s meeting has negligible probabilities for a rate move but March has 45% chance of a hike and 3% chance of a cut. The apparent unanimity of December’s decision appears questionable given the Minutes suggestions of some dissent.
Pre-FOMC Minutes: S&P Futs 1983.25, 10Y 2.19%, Gold $1094, EUR 1.0755, WTI $34.05
Policy “error” or not?

* * *
Further headlines:
- *SOME FOMC MEMBERS SAW DECEMBER RATE RISE AS `CLOSE CALL’
- *RISKS TO INFLATION INCLUDED OIL, STRONGER DOLLAR: FED
- *COUPLE MEMBERS WORRY GLOBAL DISINFLATION MAY OFFSET JOB GAINS
- *SOME FOMC MEMBERS STRESSED NEED TO SEE INFLATION RISING
- *SOME FOMC MEMBERS SAW `CONSIDERABLE’ RISK TO INFLATION OUTLOOK
The key section showing that the rate hike was a “close call”:
If the Committee waited to begin removing accommodation until it was closer to achieving its dual-mandate objectives, it might need to tighten policy abruptly, which could risk disrupting economic activity. Members observed that after this initial increase in the federal funds rate, the stance of monetary policy would remain accommodative. However, some members said that their decision to raise the target range was a close call, particularly given the uncertainty about inflation dynamics, and emphasized the need to monitor the progress of inflation closely.
On the future path:
Even after the initial increase in the target range, the stance of policy wouldremain accommodative. Participants saw several reasons why a gradual removal of policy accommodation would likely be appropriate.
When does the Fed stop hiking? When “financial stability” risk emerges:
Several participants discussed potential interactions between policy normalization and risks to financial stability… few participants also indicated that significant risks to financial stability, should they emerge, could alter their view of the appropriate policy path.
The Fed on market expectatitons:
Quotes in financial markets and survey results suggested that investors were quite confident that the Committee would raise the federal funds target range 25 basis points at the current meeting.
On correcting asset prices, aka energy junk bonds:
In their discussion, several participants commented that markets for leveraged finance had been correcting since midyear—particularly for the most risky assets, including those associated with energy firms—and noted that the widening of credit spreads in corporate bond markets appeared to be largely due to the repricing of riskier assets
The Fed on liquidating and gating mutual funds:
Concerns among investors about the high-yield bond market increased notably in the days before the meeting after an openended mutual fund specializing in junk bonds suspended redemptions and closed.
FOMC Minutes.
end
Fed Mouthpiece Reads “Liftoff” Tea Leaves
Last month, in what will likely be viewed in hindsight as an ill-fated attempt to begin the long and painful process of normalizing monetary policy, the Fed “went there.” Janet Yellen raised rates.
Investors were meant to take solace in the FOMC’s use of the term “gradual” to describe the trajectory for rates going forward, as well as from the apparent unanimity, but as is becoming more clear with each passing week, “liftoff” was a policy mistake and may well go down as the worst timed rate hike in history.
On Wednesday we get a peak into the minds of the Eccles cabal with the release of the December meeting minutes. Here to read the tea leaves is the incomporable Jon Hilsenrath.
* * *
Federal Reserve officials expressed glimmers of trepidation as they decided at a mid-December policy meeting to raise short-term U.S. interest rates after keeping them near zero for seven years.
Though the decision to raise rates was unanimous, some officials expressed concern about lingering low inflation and the stifling effects on the U.S. economy of a strong U.S. dollar and slow growth overseas.
“Because of their significant concern about still-low readings on actual inflation and the uncertainty and risks present in the inflation outlook, (officials) agreed to indicate that the (Fed) would carefully monitor actual and expected progress toward its inflation goal,” the Fed said in minutes of its Dec. 15-16 policy meeting released Wednesday.
Some officials said they wanted to see confirmation that inflation was actually rising as they looked forward to additional rate increases in 2016, the minutes said. Some also said it was a “close call” as to whether they should move in December.
Inflation has run below the Fed’s 2% goal for 3½ years.
The Fed tries to keep inflation near that goal to diminish disturbances to the economy. Persistently low readings since the financial crisis suggest underlying weakness in overall economic activity, even though employment has risen and the jobless rate declined.
In theory, inflation should pick up as joblessness falls and slack in the economy diminishes. With that in mind, “nearly all” of the Fed officials in the room at the meeting had become “reasonably confident” inflation would rise in the months ahead, the minutes said. Months earlier, the Fed had set “reasonable” confidence on inflation as a benchmark for deciding to raise rates.
Still, officials pointed to factors that could throw their inflation outlook off course: Additional declines in oil prices could further weigh on inflation readings, as could continued appreciation of the dollar.
“Although almost all still expected downward pressure on inflation from energy and commodity prices would be transitory, many viewed the persistent weakness in those prices as adding uncertainty or imposing important downside risks to the inflation outlook,” the minutes said.
The Fed said at the meeting and reiterated in its minutes that officials planned to move gradually on additional interest-rate increases because of these and other uncertainties.
They have tentatively penciled in four rate increases in 2016, according to projections they made public in December. The minutes emphasized their intention to take a go-slow approach.
end
Well that about does it for tonight
I will see you tomorrow night
h.


[…] JAN 6/TURMOIL IN LIBYA AS ISIS SET TO TAKE THEIR OIL FIELDS/OIL NOW IN THE 33 DOLLAR COLUMN/CHINA DO… […]
LikeLike
Maybe Kim Jong Punk needs to immigrate to Saudi Arabia, to complete his Axis Of Despunkable.
LikeLike
[…] by Harvey Organ, HarveyOrganblog: […]
LikeLike