
Gold: $1116.40 up $.80 (comex closing time)
Silver 14.23 up 1 cents
In the access market 5:15 pm
Gold $1118.10
Silver: $14,25
At the gold comex today, ON FIRST DAY NOTICE we had a poor delivery day, registering 58 notices for 5800 ounces. Silver saw 0 notices for nil oz for first day notice, February contract month. Late in the evening, we had 7 notices for silver for the January contract month for 35,000 oz. Thus the total number of contracts served upon for silver in January numbered 122 for 610,000 oz
Several months ago the comex had 303 tonnes of total gold. Today, the total inventory rests at 199.90 tonnes for a loss of 103 tonnes over that period.
In silver, the open interest rose by 642 contracts up to 156,925. In ounces, the OI is still represented by .785 billion oz or 112% of annual global silver production (ex Russia ex China).
In silver we had 0 notices served upon for nil oz.
In gold, the total comex gold OI fell by a rather large 8,744 contracts to 373,252 contracts as gold was down $0.50 with yesterday’s trading.
Today both the gold comex and the silver comex are in severe stress with gold in backwardation up to March.
We had no changes in gold inventory at the GLD, / thus the inventory rests tonight at 669.23 tonnes. The appetite for gold coming from China is depleting not only gold from the LBMA and GLD but also the comex is bleeding gold. Our 670 tonnes of rock bottom inventory in GLD gold has been broken. It looks to me that China has taken the last amounts of physical gold from the GLD. I guess the only place left for China to receive physical gold, after they deplete the GLD will be the FRBNY and the comex. In silver,/we had another change in inventory, a withdrawal of 1.143 million oz and thus/Inventory rests at 309.510 million oz.
First, here is an outline of what will be discussed tonight:
1. Today, we had the open interest in silver rise by 642 contracts up to 156,925 despite the fact that silver was down 22 cents with respect to yesterday’s trading. The total OI for gold fell by 8,744 contracts to 373,252 contracts as gold was down only $0.50 in price from yesterday’s level.
(report Harvey)
2 a) Gold trading overnight, Goldcore
(Mark OByrne)
b) COT report/Harvey
3. ASIAN AFFAIRS
v)FROM CHINA: 8:30 pm last night
from calculations on daily Chinese interventions, it is now assumed that China experienced a net outflow for the 2015 of 1.6 trillion USA. China must act fast as huge FX reserves are liquidated to support the tumbling yuan. China so far has resorted to only one strategy only, i.e. to issue debt and that debt is 350: 1 (total debt/GDP)
( zero hedge)
vi) The introduction of Japanese NIRP will result in currency wars and especially cause the Chinese yuan to devalue faster.
vii) The markets were stunned by Japan’s announcement as one week ago, Kuroda stated that he would not entertain NIRP. No doubt he received a phone call from the BIS that he must do something. The euphoria will last a few days of trading and then reality will set in. NIRP will do nothing for its economy except start a currency war with China and the rest of the currency boys:
ii)Grenade hurled at a refugee shelter but did not explode. Approximately 40% of Germans are telling Merkel to resign:( zero edge)
USA STORIES WHICH SHOULD INFLUENCE THE PRICE OF GOLD/SILVER
i)Fourth quarter GDP grew by only .69%. If you would use a proper deflator then the GDP would probably be negative.
( zero hedge)
ii)Macy’s slashes guidance once again:
iii) A good look at the USA economy and what it is really producing:
iv) The important University of Michigan confidence index tumbled from its December print. Also the important (for the Fed) inflation expectations for 12 months drops again:
v) do not put faith in these crooked numbers for the national Chicago manufacturing PMI index:
| Gold COT Report – Futures | ||||||
| Large Speculators | Commercial | Total | ||||
| Long | Short | Spreading | Long | Short | Long | Short |
| 170,471 | 111,431 | 60,993 | 115,343 | 175,176 | 346,807 | 347,600 |
| Change from Prior Reporting Period | ||||||
| 12,151 | -3,195 | -15,050 | -25,380 | -5,690 | -28,279 | -23,935 |
| Traders | ||||||
| 136 | 111 | 90 | 47 | 53 | 224 | 220 |
| Small Speculators | ||||||
| Long | Short | Open Interest | ||||
| 38,543 | 37,750 | 385,350 | ||||
| 4,794 | 450 | -23,485 | ||||
| non reportable positions | Change from the previous reporting period | |||||
| COT Gold Report – Positions as of | Tuesday, January 26, 2016 | |||||
Our commercials:
Those commercials that have been long in gold pitched a monstrous 25,380 contracts from their long side??
Those commercials that have been short in gold covered 5680 contacts from their short side.
Our small specs;
those small specs that have been long in gold added 4794 contracts to their long side
those small specs that have been short in gold added a tiny 450 contracts to their short side.
Conclusions;
the commercials go net short by a whopping 19700 contracts but it is done by liquidating 25,380 contracts from their long position. very strange!
| Silver COT Report: Futures | |||||
| Large Speculators | Commercial | ||||
| Long | Short | Spreading | Long | Short | |
| 68,920 | 31,334 | 16,749 | 46,228 | 91,352 | |
| 724 | -7,904 | -2,525 | -3,280 | 5,810 | |
| Traders | |||||
| 95 | 46 | 44 | 32 | 40 | |
| Small Speculators | Open Interest | Total | |||
| Long | Short | 154,734 | Long | Short | |
| 22,837 | 15,299 | 131,897 | 139,435 | ||
| 294 | -168 | -4,787 | -5,081 | -4,619 | |
| non reportable positions | Positions as of: | 141 | 122 | ||
| Tuesday, January 26, 2016 | © SilverSeek.com | ||||
Our large specs:
Those large specs that have been long in silver added 724 contracts to their long side
Those large specs that have been short in silver covered a huge 7904 contracts from their short side.
Our commercials;
those commercials that have been long in silver pitched 3280 contracts from their long side
those commercials that have been short in silver added 5810 contracts to their short side.
Our small specs:
Those small specs that have been long in silver added 294 contracts to their long side
Those small specs that have been short in silver covered 168 contracts from their short side.
end
And now your overnight trading in gold, FRIDAY MORNING and also physical stories that may interest you:
Gold and Silver Manipulation: Can It Be Verified?
Dr Brian Lucey, Dr Jonathan Batten and Dr Maurice Peat have just published some interesting research looking at the thorny issue of whether there is manipulation of gold and silver prices.
In their paper “Gold and Silver Manipulation: What Can Be Empirically Verified?”, they examine the issue of “gold and silver price manipulation, in particular price suppression.”

Source: Gold and Silver Manipulation: What Can Be Empirically Verified? – SSRN
Their research, to be found on the Social Science Research Network (SSRN) website, is not conclusive:
“Do these findings clearly support the notion of price suppression? No. They are at best suggestive,” said authors, Brian Lucey of Trinity College in Dublin, Jonathan Battena of Monash University in Australia, and Maurice Peat of the University of Sydney Business School.
The study highlights contract expiration dates as the likely time for price manipulation or suppression. The researchers said they noticed large spikes in returns around the last three days of each month, which is typically when futures and options contracts expire.
Precious Metal Prices
29 Jan: USD 1,112.90, EUR 1,019.89 and GBP 776.84 per ounce
28 Jan: USD 1,119.00, EUR 1,026.14 and GBP 781.59 per ounce
27 Jan: USD 1,116.50, EUR 1,027.14 and GBP 781.04 per ounce
26 Jan: USD 1,114.70, EUR 1,028.42 and GBP 785.80 per ounce
25 Jan: USD 1,103.70, EUR 1,020.29 and GBP 773.96 per ounce
Most Popular Guides In 2015
10 Important Points To Consider Before You Buy Gold
Essential Guide to Tax Free Gold Sovereigns
Protecting Your Savings In The Coming Bail-In Era
From Bail-Outs To Bail-Ins: Risks and Ramifications
Essential Guide To Storing Gold In Singapore
Essential Guide To Storing Gold In Switzerland
Please share our research with family, friends and colleagues who may benefit from being informed by it.
Mark O’Byrne
Research Director
(courtesy Ted Butler)
end
The following is something that we have been harping on for years:
(courtesy Jeffrey Snider/Alhambra partners)
(courtesy SRSRocco Report/Steve St Angelo)
Federal Reserve Bank of NY report on gold leavings its vaults:
In November the total earmarked gold held = 8,001 million dollars worth of gold at $42.22
In December: the closing earmarked gold held: 7995 million dollars worth of gold at $42.22
Thus a total of 6 million dollars worth of gold left NY at a value of 42.22 dollars per oz
or 142,112 oz . This represents a total of only 4.4203 tonnes and this gold definitely left for Germany as this is the gold that they wished repatriated. I am now not sure if this was already included in Germany’s total repatriation of 210 tonnes as you will recall we were missing 5 tonnes. Thus the missing 5 tonnes could be the 5 tonnes that was shipped in 2013 or the latest 4.4 tonnes of December removal from the FRBNY. Regardless, Germany is the recipient of all FRBNY shipped out.
And now your overnight FRIDAY morning trades in bourses, currencies and interest rate from Asia and Europe:
1 Chinese yuan vs USA dollar/yuan RISES to 6.5525 / Shanghai bourse: in the green up 3.09%/ hang sang: GREEN
2 Nikkei closed up 476.85 or 2.80%
3. Europe stocks IN THE GREEN /USA dollar index UP to 99.12/Euro DOWN to 1.0919
3b Japan 10 year bond yield: FALLS PRECIPITATELY to .12 !!!!(Japan buying 100% of bond issuance)/Japanese yen vs usa cross now at 120.97
3c Nikkei now well below 18,000
3d USA/Yen rate now well below the important 120 barrier this morning
3e WTI:: 33.48 and Brent: 35.10
3f Gold down /Yen down
3g Japan is to buy the equivalent of 108 billion uSA dollars worth of bond per month or $1.3 trillion. Japan’s GDP equals 5 trillion usa.
Japan to buy 100% of all new Japanese debt and by 2018 they will have 25% of all Japanese debt. Fifty percent of Japanese budget financed with debt.
3h Oil up for WTI and up for Brent this morning
3i European bond buying continues to push yields lower on all fronts in the EMU. German 10 yr bund falls to 0.371% German bunds in negative yields from 7 years out
Greece sees its 2 year rate fall to 13.91%/:
3j Greek 10 year bond yield rise to : 9.81% (yield curve deeply inverted)
3k Gold at $1113.60/silver $14.21 (7:45 am est) the bankers are whacking because of OTC/LBMA options expiry
3l USA vs Russian rouble; (Russian rouble up 36/100 in roubles/dollar) 75.95
3m oil into the 33 dollar handle for WTI and 35 handle for Brent/
3n Higher foreign deposits out of China sees huge risk of outflows and a currency depreciation (already upon us). This can spell financial disaster for the rest of the world/China forced to do QE!! as it lowers its yuan value to the dollar/expect a huge devaluation imminently from POBC.
JAPAN LAST NIGHT, JAN 29.2016 INITIATES NIRP
30 SNB (Swiss National Bank) still intervening again in the markets driving down the SF. It is not working: USA/SF this morning 1.0210 as the Swiss Franc is still rising against most currencies. Euro vs SF is 1.1148 well above the floor set by the Swiss Finance Minister. Thomas Jordan, chief of the Swiss National Bank continues to purchase euros trying to lower value of the Swiss Franc.
3p Britain’s serious fraud squad investigating the Bank of England on criminal charges/arrests 10 traders for Euribor manipulation
3r the 7 year German bund now in negative territory with the 10 year falls to + .371%/German 7 year rate negative%!!!
3s The ELA at 75.8 billion euros,
The bank withdrawals were causing massive hardship to the Greek bank. the Greek referendum voted overwhelming “NO”. Next step for Greece will be the recapitalization of the banks and that will be difficult.
4. USA 10 year treasury bond at 1.93% early this morning. Thirty year rate at 2.74% /POLICY ERROR)
5. Details Ransquawk, Bloomberg, Deutsche bank/Jim Reid.
(courtesy Jim Reid/Bloomberg/Deutsche bank/zero hedge)
Global Stocks, Bonds Jump On BOJ NIRP Stunner; Rally Fizzles After Crude Fades Gains
It is safe to say that nobody expected the BOJ stunner announced last night, when Kuroda announced that Japan would become the latest country to unleash negative interest rates, for one simple reason: Kuroda himself said Japan would not adopt negative rates just one week ago! However, a few BIS conference calls since then clearly changed the Japanese central banker’s mind and as we wrote, and as those who are just waking up are shocked to learn, negative rates are now a reality in Japan.
The immediate reaction was to send the USDJPY surging by nearly 200 pips, back to levels seen… well, about a month ago.

“The Bank of Japan gave markets a nice surprise to end the month,” said Heinz-Gerd Sonnenschein, a strategist at Deutsche Postbank AG in Bonn, Germany. “It’s a bit too early to say whether we’ll finally get that long-lasting rebound.”
Actually no it isn’t: it is virtually certain that the BOJ action will exacerbate global currency wars as it forces China to retaliate once more, in turn accelerating capital outflows from China, depressing asset prices and not only adding to global volatility but also depress both the Japanese and global recovery as we explained earlier.
Then again, central banks really have no choice at this point: they have to keep pushing or face systemic collapse. As SocGen’s Kit Jukes points out, whether or not it works matters less than fact that “disinflationary forces in the global economy are so entrenched” that central banks feel need to “set off on this path at all” He notes that one should “feed on the symbolism” as Germany, Switzerland and Japan, “three great current account powers of the post-Bretton Woods era,” are being told “in no uncertain terms to stop saving.”
However, for now the post-BOJ euphoria still lingers, but while stocks and bonds rallied around the world, the biggest impact was on the bond market where the yield on 10Y has tumbled to a just 1.92% as Japanese institutions will clearly be forced to buy even more US paper, in the process flattening the US curve – that all important recession signal – even more.
Curiously, the stock rally, which started off strong, has lost much of its earlier spark driven by the latest episodes in the Russian-OPEC “headline” fiasco, when this time the Russian energy minister Novak admitted he may have skewed reality a little yesterday, saying there was no confirmed meeting with OPEC or non-OPEC countries, adding Russia hasn’t begun internal discussions on how any cuts would work but that it is ready to at least discuss issue of output cuts, even if it is not ready for a decision. He concluded that coordinated cuts would only be possible after detailed talks.
In other words, all Russia did was conduct a trial balloon on reaction to oil supply cut headlines. The only problem is getting the Saudis on the same page.
The result is that after spiking another 2% in overnight trade, dropped into the red before rebounding modestly, which in turn is capping gains on US equity futures.
The focus on the US calendar will be the Q4 GDP print while we will also get the quarterly ECI and PCE readings. The January Chicago PMI and ISM Milwaukee are also due before the final revision to the January University of Michigan consumer sentiment print. It’s a quieter day for earnings reports with just 18 S&P 500 companies due to give their latest quarterlies, with Chevron (pre-market) the highlight of the bunch. We’re also due to get comments from the Fed’s Williams (due at 8.30pm GMT) – the first Fedspeak since the FOMC meeting this week.
Where markets stand now:
- S&P 500 futures up 0.7% to 1894
- Stoxx 600 up 0.8% to 338
- FTSE 100 up 0.8% to 5981
- DAX up 0.5% to 9693
- German 10Yr yield down 5bps to 0.36%
- Italian 10Yr yield down 6bps to 1.45%
- Spanish 10Yr yield down 7bps to 1.55%
- MSCI Asia Pacific up 1.6% to 121
- Nikkei 225 up 2.8% to 17518
- Hang Seng up 2.5% to 19683
- Shanghai Composite up 3.1% to 2738
- US 10-yr yield down 5bps to 1.93%
- Dollar Index up 0.5% to 99.01
- WTI Crude futures up 0.4% to $33.37
- Brent Futures up 0.5% to $34.07
- Gold spot down 0.1% to $1,114
- Silver spot up 0.1% to $14.26
Asian equity markets traded higher following the gains on Wall St., where strong earnings coupled with a rally in crude boosted risk sentiment, while volatility was observed with the BoJ initially jolting markets after unexpectedly announcing negative rates. This saw volatile trade in the Nikkei 225 (+2.8%) while the ASX 200 (+0.6%) was supported by outperformance in energy names. Shanghai Comp (+3.1 %) outperformed after the PBoC announced to conduct OMO every working day around the new year holiday as it seeks to avoid a liquidity crunch while also today injecting CNY 80bIn via 28-day reverse repos and CNY 20bIn via 7-day reverse repos. 10yr JGBs soared by over a point as Japanese bond yields fell to record lows following the BoJ announcement of negative rates with tenure declining to as low as 0.09%
Asian Top News
- Sony Profit Beats Estimates as PlayStation Trumps Sensor Slump: 3Q oper. profit 202.1b yen vs est. 173.6b yen
- Japan Bonds Biggest Winners as Stocks Soar, Yen Tumbles on BOJ: Benchmark 10-year yields plunge to record low of 0.09%, yen heading for its biggest decline in more than a year
- Mizuho Quarterly Profit Falls on Loan Income, Bond Trading: Net falls to 135.3b yen from 167.9b yen y/y, est. 137b yen
- Docomo to Buy Back $4.1b in Shares as Profit Climbs: To repurchase as many as 220m shares, or 5.7% of non-treasury stock outstanding, from Feb. 1 to Dec. 31
- PetroChina Sees 2015 Profit Falling as Much as 70% on Oil Slump: Net profit will fall because of the slump in oil and drop in domestic natural gas prices, co. said
- China Life Expects FY Net Income to Rise About 5%-10% on Year: Co. cites rising investment return for the net income increase
- Alibaba’s Reliance on China Spooks Investors as Economy Cools: Jack Ma seeking out new businesses from cloud to services
- Paper Trail of Fraud Shows Flaws in Booming China Funding System: China’s bank regulator pushing lenders to tighten controls
- Waiting for Ambani Tests Patience of Billionaire’s Bondholders: No major asset sales completed since September announcement
European equities (Eurostoxx 600 +0.7%) gapped higher taking their lead from Asia whose indices closed firmly in the green following the shock decision by the BoJ to introduce negative rates . Consequently, financials outperform in Europe as a result of more monetary easing. Energy is the second best performing sector, with speculation of production cuts doing the rounds as Brent and WTI hold the USD 33.00 level, which is not demonstrative of overtly bearish sentiment given this weeks lows.
Gains are broad based however in the Eurostoxx 600, with the majority of all 20 subsectors trading higher. The Italian FTSE MIB continues to be extremely choppy, as are its counterparts, with Banco Populare and Monte Pashe swinging wildly in European trade.
European Top News
- Euro-Area Inflation Accelerates in Temporary Reprieve for ECB: Consumer prices rose annual 0.4% in Jan., most since 2014
- James Murdoch Returns as Sky Chairman After Four Years: James Murdoch, 43, Rupert Murdoch’s son, replaces Nicholas Ferguson, who is stepping down after 12 years on the board
- Monte Paschi Posts Yearly Profit After Restating Accounts: Without restatement, bank would have suffered loss for 2015
- Gamesa Jumps as Siemens Said to Talk to Iberdrola on Making Bid: Siemens has hired Deutsche Bank to explore a purchase of Gamesa and has discussed options with Iberdrola, the Spanish utility that owns a 19.7% stake, El Confidencial reported
- Spain Maintained Growth in Fourth Quarter, Showing Momentum: Spanish economy grew 3.2% in 2015 with 10 quarters of growth
- French Growth Slows at Year End as Terrorism Hurts Spending: GDP grew 0.2% in the final three months of 2015, vs 0.3& in the previous qtr
- Norway to Buy Record Amount of Kroner as Oil Price Crash Stings: Will buy NOK900m ($104m) a day in Feb. as it converts its oil income into local currency to cover budget needs
In FX, all the action this morning as centred on the JPY pairs, after the BoJ surprised the markets by cutting the deposit rate to a negative 0.10%. Spot and cross/JPY rallied hard, with USD/JPY tearing through 120.00 to hit a high of 121.35. The yen fell 1.6 percent versus the dollar, its biggest loss since December 2014. Against the euro, it dropped 1.1 percent.
“They previously rejected taking rates to negative, so that was the surprise element in the announcement,” said Imre Speizer, a markets strategist at Westpac Banking Corp. in Auckland. “It weakened the yen, as it should.”
The recovery settled in the mid 120.00’s at the start of London trade, but has been trying to push higher since. The crosses have been tempered by their respective spot rates easing off — Cable underperforming, but the CAD not too far behind as Oil prices tail off. More from the Russian energy minister, but this time saying no scheduled meetings between OPEC and non OPEC nations. CHF still on the back foot as equities buoyant all round — healthy KoF (100.3 vs 96.6 prey) ignored. EU CPI marginally higher at 1 %, but EUR/USD sticking close to 1.0900.
A gauge of 20 developing-nation currencies rose 0.3 percent in its
fourth day of gains. It’s 1.1 percent advance this week has help trim
January’s loss to 1.7 percent. Russia’s ruble added 0.4 percent,
paring earlier gains with a pullback in oil. The central bank kept rates
on hold, in line with analysts estimates.
In commodities, the on-going will-they-won’t-they saga surrounding an OPEC meeting to decide upon production cuts, continues to dictate price action in oil markets. The latest headline to this effect has been two OPEC delegates commenting that no decision has been made on whether to hold a meeting between OPEC and non-OPEC countries . They added that if such a meeting were to happen, it would occur February or March. They went onto say that any meeting should be on an expert level, as oppose to a ministerial one.
OPEC nations, with a few notable exceptions, are reluctant to make any production cuts without their non-OPEC counterparts. Furthermore, Russian Energy Minister Novak stated earlier there are no confirmed meetings between OPEC and non-OPEC nations, after the latest comments both WTI and Brent have drifted lower, Brent breaking the USD 34.00 level to the downside.
Gold was volatile in Europe overnight with the safe-haven initially declining as stocks surged following the BoJ’s decision to unexpectedly introduce negative rates. Price action reversed however, once the 1110.00 level was hit, and the market rejected a move lower . Of note, the 1110.00 level seems to have emerged as a significant level of support over the past week. Furthermore, spot gold is still on course for its best month in a year, having benefited from stock market volatility in January and expectations of a shallower fed hike path. However some analysts have noted that the BoJ’s move to stoke inflation may strengthen the USD, and therefore diminish golds potential gains in coming months.
Global Top News:
- Xerox Said to Split in Two; Icahn Gets Board Seats, WSJ Says: Will divide itself into a co. grouping its hardware operations and another that will house its services business, Carl Icahn will be given 3 board seats on the services company’s board
- Japan Adopts Negative-Rate Strategy to Aid Weakening Economy: Central bank continues its record asset-purchase program. Bank of Japan’s Negative Interest Rate Decision Explained
- Microsoft’s Cloud-Fueled Revival Persists as Azure Sales Jump: Results bolstered by Web-based services, Office 365 software; FY2Q adj. EPS 78c vs est. 71c, up 6% post-mkt on >1m shares
- Amazon’s Jeff Bezos Steps Up Spending Again to Chase Growth: 4Q EPS $1.00 vs est. $1.55, 4Q net rev. $35.7b vs est. $35.9b; sees 1Q oper. income $100m-$700m vs est. $731.7m
- Honda Profit Misses Estimates as Takata Air Bag Recalls Mount: 3Q net income 124.2b yen vs est. 149.3b yen
- Takata CEO Said Prepared to Resign Amid Crisis; Shares Rise
- Russia Sees Decision on Oil Cut Only If All Exporters Agree: A decision on cutting oil production is possible only if all crude exporting nations are in consensus, and there is no timing for talks yet: Russia’s Energy Minister Alexander Novak
- Visa Profit Tops Estimates as Customer Card Spending Rises: 1Q adj. EPS 69c, est. 68c, shrs up ~3.9% post-mkt
- Apple Said Developing Wireless-Charged Phone for as Soon as 2017: Said trying to overcome technical challenge of distance
- GE Said to Plan More Than $760m of Investment in Italy: The deals may be signed as soon as this weekend or early next week when GE Chairman Jeff Immelt visits the country
- Merck Prices Hepatitis C Drug Lower Than Rivals in Crowded Field: FDA says Merck drug is approved for genotypes 1 and 4
- Carlyle Sweetens Lending Terms for Banks Funding Veritas Buyout: Under the changes, the banks will have more flexibility to boost yields and offer discounts on the loans when they try to sell them to capital-market investors
- Freeport’s Grasberg Mine Still Working as Export Permit Expires
- Stock Investors Mind the Bounce as S&P 500 Rebounds Take Longer: Benchmark gauge posts weakest rebound of the bull market
- Congress Juniper Probe to Cover Possible NSA Involvement: Rtrs
Bulletin Headline Summary from RanSquawk and Bloomberg
- European equities (Eurostoxx 600 +0.7%) gapped higher, taking their lead from Asia whose indices closed firmly in the green following the shock decision by the BoJ to introduce negative rates
- All the FX action this morning has centred on the JPY pairs, after the BoJ surprised the markets
- Looking ahead, highlights include US and Canadian GDP, Chicago PMI, University of Michigan sentiment and comments from ECB’s Costa and Fed’s Williams
- Treasuries higher overnight as the Bank of Japan sprung another surprise on investors, adopting a negative interest-rate strategy to spur banks to lend, sparking demand for USD assets; economic data today includes 4Q GDP and Core PCE.
- Decision to charge Japanese banks to park cash at the central bank will put pressure on loan profitability that’s already among the weakest in the world
- In the event of “further nasty global financial or economic shocks,” expect more central banks, “perhaps even the Fed,” to consider negative policy rates, Oxford Economics economists wrote in note yesterday
- Lloyds Banking Group and other big U.K. retail lenders face higher capital requirements as the Bank of England moves to bolster the industry’s ability to withstand shocks without hurting the economy
- The Federal Reserve said it will analyze in its annual stress tests how 33 large banks, including Bank of America and JPMorgan, would withstand a severe global recession, a doubling of the U.S. unemployment rate to 10% and moderate deflation
- Russia’s central bank left its benchmark interest rate unchanged for a fourth consecutive meeting, warning it may tighten policy if inflation risks intensify
- A decision on cutting oil production is possible only if all crude-exporting nations are in agreement and there’s no timing for talks, Russia’s Energy Minister Alexander Novak said
- Two years after it was formed by Marxist university professors and student activists, anti-austerity group Podemos is making most of the running in Spain’s search for a government, shaping the policy process before they’ve even got a hand on the reins of power
- Sovereign 10Y bond yields lower led by Japan. Asian, European stocks rise; U.S. equity-index futures rise. Crude oil and copper rise, gold drops
-
- )
DB’s Jim Reid concludes the overnight wrap
It’s straight to Japan this morning where the BoJ have given the plates another spin after the announcement that the Bank is to adopt negative interest rates. The benchmark rate has been slashed by 20bps to -0.1% having last been cut in 2010. Details are still coming through but it appears to be in the form a three-tier system with negative rates to be applied on deposits over a certain amount. There was no change in the current level of BoJ asset purchases of ¥80tn per year. Headlines are suggesting it was a close call after being passed by a majority vote of 5-4. It’s caught the market by surprise however with only 6 of 42 economists forecasting for any sort of easing (all 6 economists forecasting for more QE and just 1 expecting a rate cut).
At the same time, the BoJ has delayed its target date of reaching its 2% inflation goal by six months, aiming for the first half of fiscal 2017 now (March to October 2017) while also downgrading current year forecasts. Markets have been super volatile in the aftermath and by the time you read this may have moved even more. The Yen initially plummeted over 2% only to then rally back to close to unchanged on the day (around ¥119), but has since resumed a sell off past ¥120 (-1.47% weaker). There’s been similar price action for equity markets where the Topix and Nikkei were up over +3% initially, then tumbled to losses of -1.6% and -1% respectively, but have now bounced back with strong gains (+2.49% and +2.58%). Other Asian bourses have rallied with gains of 2-3% across the region. The JGB market appears to be the only asset class moving in one direction with yields heading south in a hurry. 2y, 5y and 10y JGB yields have all struck record all-time lows of -0.050%, -0.066% and 0.100% respectively.
This morning’s announcement also came post some softer than expected data in Japan overnight. Headline CPI during the December fell one-tenth to +0.2% yoy (as expected) with the ex food and energy reading down one-tenth but unexpectedly to +0.8% yoy (vs. +0.9% expected). The significant miss came in last month’s industrial production number which fell -1.4% mom in December (vs. -0.3% expected).
It’s hard to pinpoint the huge swings in risk post the BoJ announcement as we digest the headlines but with Governor Kuroda due to speak as we go to print its worth keeping a close eye on the price action.
Ahead of the US GDP data today, yesterday’s very soft durable and capital goods order numbers raised the prospects of further downside risk to activity levels in the quarter. Headline durable goods orders for December printed at -5.1% mom which was well below expectations for a more modest -0.7% decline. The ex-transportation reading was also weak (-1.2% mom vs. -0.1% expected) while core capex orders fell -4.3% mom (vs. -0.2% expected) which was the largest monthly decline since October 2014. On the surface of it, the data shows that there is significant downward momentum in private domestic demand. DB’s Joe Lavorgna warned yesterday that while durable goods data are notoriously volatile and it is possible business spending will rebound this quarter, the ongoing weakness in oil prices and sharp plunge in CEO confidence makes him doubt that this will occur. Importantly the data wasn’t in isolation with the November data also revised down. The nondefense capital goods shipments ex aircraft are the important data used to estimate GDP output and post yesterday’s numbers, the -5.8% annualized drop last quarter was the lowest since Q3 2013. This implies significant pullback in Q4 capital spending which we should see in today’s data.
Along with the data, Oil once again dominated the newsflow as headlines (which appeared to be eventually played down) reverberated suggesting that Russia and OPEC were looking at setting up talks to discuss production cuts (up to 5% according to the WSJ). WTI peaked at just shy of $35/bbl (and up 7% on the day) following the news before settling down to close at $33.22/bbl (+2.85% on the day). That now makes it 22% off last Wednesday’s intraday low and so technically speaking in a bull market. In any case, the leg up for oil helped the S&P 500 (+0.55%) close in positive territory after a fairly rocky early session post a mixed batch of earnings releases (more below). US credit had a slightly better day too while US Treasuries chopped around before eventually finishing a smidgen lower (10y -2bps to 1.979%). Prior to this we’d seen European risk assets shrug off the moves in oil and instead focus on some weaker than expected earnings reports in the region. The Stoxx 600 closed yesterday -1.57%.
In terms of the rest of the data yesterday, in the US we saw initial jobless claims decline 16k last week to 278k which was slightly better than expected (281k expected). The latest housing market data was less supportive however with pending home sales only up +0.1% mom last month (vs. +0.9% expected) while the only other release of note was the Kansas City Fed manufacturing activity index which was unchanged at a still lowly -9. In Europe we saw the preliminary CPI print for Germany come in line at -0.8% mom, with the YoY rate nudging up a couple of tenths to +0.5%. Euro area confidence indicators all generally surprised to the downside while in the UK there were no surprises in the Q4 GDP print of +0.5% qoq (and +1.9% yoy) which met market expectations.
Back to the earnings, yesterday saw 51 S&P 500 companies report with just 22 beating sales expectations (43%) but 42 coming ahead of earnings forecasts (82%) – albeit estimates that have been beaten down in recent weeks. The latter was in-line with what we’ve seen so far this quarter but the number of revenue misses was weaker (averaged 50% so far). Aside from the market digesting those contrasting numbers from tech giants Facebook and eBay which we touched on yesterday, Caterpillar numbers also garnered some attention and more so as an indicator for what looks set to be another bleak year ahead for industrials. The latest quarterly earnings came in ahead of expectations (thanks to impressive cost control) but the company highlighted that they expect sales in the resource industries to fall between 15 to 20% this year, while sales in construction are expected to fall 5 to 10%.
Looking now at what’s set to be a busy day ahead. In the European session this morning, the main highlights are French Q4 GDP, CPI and PPI data along with German retail sales numbers for December. This will be closely followed by the Euro area advanced CPI core reading for January along with an estimate of the headline number. The focus this afternoon in the US will of course be on the Q4 GDP print while we will also get the quarterly ECI and PCE readings. The January Chicago PMI and ISM Milwaukee are also due before the final revision to the January University of Michigan consumer sentiment print. It’s a quieter day for earnings reports with just 18 S&P 500 companies due to give their latest quarterlies, with Chevron (pre-market) the highlight of the bunch. We’re also due to get comments from the Fed’s Williams (due at 8.30pm GMT) – the first Fedspeak since the FOMC meeting this week.
(courtesy zero hedge)
FROM JAPAN 8:30 pm last night: Rumours of negative interest rates:
Markets Turmoil After Nikkei Reports Bank Of Japan Discussed Negative Interest Rate Policy
Just minutes before The BoJ released its statement, USDJPY and Nikkei 225 went haywire around 2220ET as Nikkei news dropped a headline about NIRP discussions taking place at The BoJ. This is not the BoJ statement but has sparked chaos in Japanese (and all carry trade linked markets).
Total chaos broke out ahead of the BoJ Statement…as Nikkei News issued this headline…
- *BOJ DISCUSSES NEGATIVE INTEREST RATE POLICY, NIKKEI SAYS

Having given up all its gains since the last QQE update…

end
One hour later: they vote is in (5 vs 4) and they unleash NIRP. HOWEVER THE BADLY NEEDED ASSET PURCHASES ARE KEPT UNCHANGED
(courtesy zero hedge)
Bank Of Japan Unleashes 3-Tier Negative Interest Rate Policy
While keeping asset purchases the same, The Bank of Japan confirmed the earlier leaked details that it will shift to a negative interest rate policy:
- *BOJ: ADOPTS RATE OF -0.1%
- *BOJ: VOTES 5-4 TO ADOPT NEGATIVE INTEREST RATES
- *BOJ: WILL CUT RATE FURTHER IF NEEDED
- *BOJ: KEEPS ASSET PURCHASES UNCHANGED
- *BOJ RETAINS PLAN FOR 80T YEN ANNUAL RISE IN MONETARY BASE
- *BOJ: JAPAN ECONOMY HAS CONTINUED TO RECOVERY MODERATELY
- *BANK OF JAPAN: NEGATIVE INTEREST RATE TO APPLY FROM FEB. 16
Clearly the decision was far from unanimous. Japanese stocks and USDJPY have exploded higher…

The adoption of NIRP enables The BoJ to break the bond market even further…
- *BOJ: POLICY FRAMEWORK DESIGNED TO LET BOJ PURSUE MORE EASING
- *BOJ: TIERS TO INCLUDE POSITIVE RATE, ZERO RATE OR NEGATIVE RATE
- *BOJ: MULTI TIER SYSTEM RESEMBLES SOME IN EUROPE E.G. SWISS BANK
- *BOJ: DEPOSIT RATE CUT WILL LOWER SHORT END OF YIELD CURVE
So The BoJ follows EU’s route – because that has worked out so well for them!!
- *BOJ: 3-TIER RATES ENSURE NO `UNDUE DECREASES’ IN BANK EARNINGS
- *BANK OF JAPAN: NEGATIVE INTEREST RATE TO APPLY FROM FEB. 16
- *BOJ: POSITIVE RATE OF 0.1% APPLIES TO EXISTING BALANCE
- *BOJ: ZERO RATE APPLIES TO REQUIRED RESERVES HELD BY BANKS
- *BOJ:MINUS RATE APPLIES TO ACCOUNTS IN EXCESS OF THESE AMOUNTS
- *BOJ WILL CONTINUE NOT TO SET LOWER BOUND FOR YIELD ON JGB BUYS
In other words – all excess reserves will cost you – so liquify the stock market with them!
Dow futures are soaring on the collapse in Yen…

* * *
end
At 11.30 PM EST LAST NIGHT/10:30 AM FRIDAY MORNING (TOKYO TIME)
the markets go haywire with the nikkei after being up 1000 points crashes:
Nikkei Crashes 1000 Points Post-Kuroda After BoJ Adopts NIRP, Fails To Increase QE
Well that did not last long. After initial exuberance over The BoJ’s wishy-washy decision to adopt a 3-tiered rate policy including NIRP, markets have realized that without further asset purchases (which were maintained at the current pace), there is no ammo to lift stocks. An almost 200 point surge in Dow futures has been erased and Nikkei 225 has dropped 1000 points from its post BOJ highs…

And Nikkei has crashed 1000 points…

end
from calculations on daily Chinese interventions, it is now assumed that China experienced a net outflow for the 2015 of 1.6 trillion USA. China must act fast as huge FX reserves are liquidated to support the tumbling yuan. China so far has resorted to only one strategy only, i.e. to issue debt and that debt is 350: 1 (total debt/GDP)
(courtesy zero hedge)
Here Is The Reason For January’s Selloff: China’s January Outflows Soar To Second Highest Ever
While China’s currency devaluation has, alongside the price of commodities, become one of the two key drivers of market volatility and tubulence around the globe, when it comes to risk, one far more important Chinese metric is the actual amount of capital that leaves the nation.
The reason for this is that as explained over the weekend, in a world where Quantitative Tightening by EMs and SWFs has emerged as a powerful counterforce to Quantitative Easing – or liquidity injections – by developed central banks, what matters for global risk levels is the net effect of these two opposing money flows.

Of all the global “quantitative tighteners”, the biggest culprit is China, which has seen over $1 trillion in reserve selling since the summer of 2014, the direct result of a virtually identical amount in capital outflows.
Furthermore in for a “closed’ Capital Account system like is China, the selling of FX reserves is a direct function of capital outflows, so the only real data needed to extrapolate not only the matched reserve selling and thus Quantitative Tightening, but also the direct impact onglobal risk assets, is how much capital outflow has taken place.
This takes place in one of two ways: by relying on official Chinese historical data, or by estimating how much outflows take place on a concurrent basis, thus allowing one to estimate how much capital is flowing out in real time. Indicatively, China’s SAFE released onshore FX settlement data for the whole banking system (PBoC+banks), suggesting some $97bn of FX outflows in Dec, which is broadly in line with the fall in official reserves.
But much more important is the question what is taking place right now, the answer to which can either wait until SAFE releases January data in several weeks… or rely on day to day estimates of outflows in the form of central bank FX intervention.
Luckily, we have just that.
According to a Goldman report, so far in January “there has been around $USD 185bn of intervention (with the recent intervention predominantly taking place in the onshore market)” split roughly $143 billion on the domestic side and $42 billion on the offshore Yuan side.

This would make January the month with the second largest amount of intervention since August 2015, and thus the second highest month of capital outflows, and would explain the ongoing deterioration across global asset classes as China’s various FX reserve managers have been forced to sell not just government bonds but equities as well.
Goldman also calculates that “total intervention over the last 6 months, using our estimates, sums to USD 775bn.” Run-rating this amount would suggest that nearly $1.6 trillion in Quantiative Tightening is taking place just due to China’s attempts to stem capital flight. This number excludes the hundreds of billions in reserves that all other petrodollar and EM nations have to liquidate as well to prevent the rapid devaluation of their own currencies as the world remains caught in the global dollar margin call we first explained in early 2015.
The implications from this are two-fold:
- For the selling culprit, responsible for the recent market weakness look no further than China, whose reverse “flow” has been responsible for the terrible start to 2016 capital markets.
- For the Beijing politburo, halting capital outflows is becoming a matter of life or death, because there are only so many liquid reserves China can liquidate before it enters dangerous territory; worse, the less the reserves, the greater the desire will be on behalf of the local population to take their money and run.
Of course, China’s rabid defense of further capital outflows means that its original intent, to devalue the Yuan to a degree that boosts its economy via exports, has been put on hiatus, or in other words China is trapped, and instead of an external rebalancing it is forced to boost its economy in the one way it knows best: by issuing ever more debt. However, with China’s total debt now estimated at 350% of GDP, it only has a finite amount of time before the debt bubble finally pops as well.
In other words, for China there is, as of this moment, quite literally no way out, and what’s worse the longer it delay the decision of how it will reset its economy, the worse it will be for global risk markets.
“The BoJ’s NIRP Will Result In More Currency Wars And Global Growth Slowdown”
As reported previously the Bank of Japan, which not even the most optimistic central bank watchers had expected would unleash anything remotely as aggressive to prevent price discovery, stimulate asset prices and boost the exporting of deflation, became the latest central bank who, after a 5 to 4 vote, unleashed the monetary neutron bomb of Negative Interest Rates in the process pulling an anti-Draghi and shocking markets, even if admitting it can no longer boost QE due to previously discussed concerns it would run out of monetizable bonds in the very near future.

The initial market reaction was one of shocked surprise, with the Yen crashing and risk soaring, subsequently followed by disappointment that QE may be now be officially over and the BOJ will be stuck with negative rates, and then euphoria once again regaining the upper hand if only for the time being as yet another central banks does all it can to levitate asset prices at all costs, even if in the long run it means even more deflationary exports from all other banks and certainly China which will now have to retaliate against the devaluation of its “basket” of currencies.
The BOJ’s excuse was simple: everyone else is doing it: as Kuroda said quickly after the NIRP announcement, the BOJ’s monetary policy is “just the same as central banks in the U.S. and Europe,” and “doesn’t target currencies.” Well, it does target currencies, but he is right: it is the same as policy in Europe and the US, where as a reminder, NIRP is coming next.
The Japanese government loved it, of course, since recent Japanese data has been ugly and getting worse, and since it allows Abe to punt all reform policies to the BOJ. Sure enough, moments ago Chief Cabinet Secretary Yoshihide Suga spoke to reporters in Tokyo. He said that the BOJ made the appropriate decision and that he welcomes BOJ’s new method aimed at achieving 2% inflation target, adding that he “can sense the BOJ’s strong determination.” He said that a delay in hitting price target due to factors such as lower oil prices than expected.
A full summary of the BOJ has done comes from Goldman which frankly was even more stunned today than after the BOJ’s Halloween 2014 “Yen massacre”when Kuroda boosted QE. Here is what Goldman said:
BOJ surprises with negative interest rate
The Bank of Japan (BOJ) surprised by introducing a negative interest rate of 0.1% at the Monetary Policy Meeting (MPM) on January 28-29, while maintaining its monetary base target and Japanese government bond (JGB) purchasing program. Our base scenario called for additional easing at end-April, with today’s move seen as our risk scenario. The Bank called this move “Quantitative and Qualitative Monetary Easing (QQE) with a Negative Interest Rate” and it was passed with a 5-4 majority vote.
We think the BOJ intended to cause a strong announcement effect on the forex market in particular, by implementing the measure Governor Kuroda had explicitly denied the idea of resorting to until now, when financial markets remaining volatile and macro data poor. The Bank said it is prepared to lower the interest rate further into negative territory if it decided this was necessary.
In specific terms, the BOJ will introduce a three-tier system for the outstanding balance of each financial institution’s current account at the Bank: a positive interest rate (for the basic balance(1)), a zero interest rate (for the macro add-on balance (2)), and a negative interest rate (for the policy-rate balance (3)).
- The basic balance refers to the balance accumulated thus far by each financial institution under QQE. The BOJ will continue to apply a positive interest rate of 0.1% to this balance, with the aim of preventing pressure on the earnings of financial institutions.
- The macro add-on balance is the amount outstanding of the required reserve held by financial institutions subject to the Reserve Requirement System, among others, and will be increased as the QQE program makes progress going forward, using a currently unknown calculation method.
- The policy-rate balance is the amount outstanding of each financial institution’s current account at the Bank in excess of (1) and (2) above. This balance will increase with new transactions. The BOJ will impose a negative interest rate of 0.1% on this balance.
The Outlook for Economic Activity and Prices (Outlook Report), also released today, cut the fiscal 2016 core CPI outlook to +0.8%, from +1.4% in October, as we expected. It also pushed back the timing for achievement of the 2% price stability target by six months to “around the first half of fiscal 2017,” from “around the second half of fiscal 2016.” It only fine-tuned other forecasts.
Governor Kuroda’s press conference will be screened live from 15:30 JST today, and attention is likely to focus on the reasoning that led to the introduction of a negative interest rate at this stage after the BOJ had continued to reject it thus far. The introduction of a negative interest rate could suggest the BOJ is close to its limit for purchases of JGBs.
An important reason cited when the BOJ maintained its monetary policy in October last year was the strength of price trends, which it gauges by referring to the CPI index that excludes energy and fresh food prices (new BOJ core CPI). Thus attention is also likely to focus on the logic that led to today’s decision at this stage when that index is still robust at +1.3% in December.
BOJ framework for interest rate on current account
BOJ economic and price outlook (as of January 2016)
The BOJ’s quantitative and qualitative monetary easing program


Some other analyst reactions promptly pointed out the biggest flaw in the BOJ’s action, namely the raising of doubts over policy viability:
Izuru Kato, chief economist at Totan Research in Tokyo:
- Introduction of negative rate gives impression of policy stalemate; isn’t a dramatic turn given asset-purchase target was retained
- There is a limit to how deep negative rate can go; further cut would prompt a reduction in retail deposit rates
- Yields likely to fall, overall economic impact unclear
Satoshi Okagawa, global market analyst at Sumitomo Mitsui Banking Corp. in Singapore:
- Effect of BOJ’s additional easing is uncertain given quantity is kept unchanged
- Likely to have only limited impact over Asian currencies because dollar is more largely used in the region
- Move may ease risk aversion, not turn sentiment completely; cites Nikkei 225 paring earlier gains
Tsutomu Soma, general manager of fixed-income department at SBI Securities in Tokyo:
- Indicates central bank’s strong support for success of Abenomics; weaker yen normally boosts stocks, inflation
- Length of impact depends on how strongly Governor Kuroda intends to stick to the 2% inflation target
- USD/JPY may gradually strengthen toward 124 over next three months
Masafumi Yamamoto, chief currency strategist at Mizuho Securites in Tokyo:
- introducing negative rates, BOJ avoids giving impression that there would be no more policy options
- Likely to eliminate short USD/JPY positions in near term; remains to be seen whether Japan’s negative rates can offset yen appreciation pressure stemming from risk aversion
But the comment of the night came from Credit Agricole’s Valentin Marinov who said, correctly, that the BOJ’s easing is not supportive of risk because it will merely reinvigorates currency wars, in the process pushing the USD stronger and commodities weaker, forcing asset prices even lower. As a reminder this was DB’s argument against more QE by the ECB as well.
More importantly, since “almost 60% of the households’ financial assets are held in deposits. If indeed, the Japanese banks pass on some of the costs from the BoJ’s penalty rate to their depositors, this will result in a negative wealth effect, reducing the purchasing power of the Japanese consumers. Domestic demand should suffer and Japan’s contribution to global growth could decrease further. The BoJ’s measures thus should result in more currency wars and continuing slowdown in global trade and growth.”
Here is his full remark:
BoJ easing to reinvigorate currency wars, not supportive for risk
In a surprise move, the BoJ cut to -0.1% the rate applied to a portion of the Japanese banks’ current accounts. In theory, the policy should boost the effectiveness of its QE program by encouraging the banks to spend rather than save the cash they receive in exchange for their JGB holdings. In reality, the measure is aimed at cheapening JPY. Indeed, as in the case of EUR, the negative rates could encourage portfolio and FX reserve diversification out of JPY and boost its attractiveness as a funding currency.
The BoJ actions should lead to further intensification of global currency wars with central banks around the world trying to engineer sustained competitive devaluation against the background of slowing global trade and growth as well as persistent commodity price disinflation. With its latest measures the BoJ will allow Japan to borrow more growth from its trading partners and limit the severity of the imported disinflation.
At the same time, the negative deposit rates could weigh on domestic demand and hurt the economy’s growth prospects. This is because almost 60% of the households’ financial assets are held in deposits. If indeed, the Japanese banks pass on some of the costs from the BoJ’s penalty rate to their depositors,this will result in a negative wealth effect, reducing the purchasing power of the Japanese consumers. Domestic demand should suffer and Japan’s contribution to global growth could decrease further. The BoJ’s measures thus should result in more currency wars and continuing slowdown in global trade and growth.
JPY depreciated sharply in the wake of the BoJ decision and the downside pressure could persist for now. That said, given that the rate cut could fuel more global currency wars and global growth uncertainty, it need not necessarily support investors’ risk appetite. The risk aversion we had since the start of the year could therefore persist and limit the JPY-losses to a degree. We think that other Asian currencies should remain vulnerable and we like to fade the latest bounce in both NZD and AUD especially given the slew of Chinese data next week.
We also think that currencies that are vulnerable to more central bank easing and/ or FX intervention like EUR and CHF should remain attractive selling opportunities. Against the background of raging currency wars, we remain constructive on USD and believe that GBP could be in for a short squeeze ahead of the BoE IR next week.
And now we await for the PBOC, whose hand has just been forced by the BOJ, to respond and devalue further in the process unleashing even greater, record capital outflows and even more market volatility.
However, the best news in all of the above is that the BOJ’s action takes the world one step closer to the full collapse of the central bank regime as with every incremental expansion of “emergency” policies, with every new “policy error”, the monetary emperors demonstrate how naked and ultimately powerless they have been all along.
This Is Why “Everyone Was Shocked” By The BOJ Announcement
There is just one phrase to explain the market’s reaction to last night’s BOJ announcement that it would join the ECB, Sweden, Denmark, and Switzerland into negative territory:stunned shock.
As the WSJ writes, “many investors had anticipated an expansion of the bank’s asset-purchasing program this year, but few expected Japan to join the European Central Bank and central banks of Sweden, Denmark and Switzerland in negative territory on Friday.”
Reuters add that “there’s a significant surprise factor: almost no economist was calling for this,” according to Alex Dryden, global market strategist at JP Morgan Asset Management.
And so on.
But if nobody expected negative rates out of the BOJ last night, there’s a good reason for this: just one week ago Kuroda himself said on the record that he has “no plan to adopt negative rates now“

This was reported by Reuters on January 21, exactly one week before the BOJ announcement:
Bank of Japan Governor Haruhiko Kuroda said he is not thinking of adopting a negative interest rate policy now, signalling that any further monetary easing will likely take the form of an expansion of its current massive asset-buying programme.
“There are pros and cons of adopting negative interest rates … The Federal Reserve didn’t adopt negative interest rates and yet, its policy succeeded in stimulating the U.S. economy,” he told parliament on Thursday.
Kuroda has maintained his optimism on Japan’s economy, saying that it continues to recover moderately and is helping keep inflation on a broad uptrend. But he identified the recent global market rout as among risks to Japan’s economic outlook, stressing the central bank’s readiness to expand monetary stimulus if needed to ensure achievement of its 2 percent inflation target.
It seems someone made an urgent phone call into the BOJ over the next 7 days, because the next Reuters headline is the following:

The Bank of Japan unexpectedly cut a benchmark interest rate below zero on Friday, stunning investors with another bold move to stimulate the economy as volatile markets and slowing global growth threaten its efforts to overcome deflation.
Global equities jumped, the yen tumbled and sovereign bonds rallied after the BOJ said it would charge for a portion of bank reserves parked with the institution, an aggressive policy pioneered by the European Central Bank (ECB).
“What’s important is to show people that the BOJ is strongly committed to achieving 2 percent inflation and that it will do whatever it takes to achieve it,” BOJ Governor Haruhiko Kuroda told a news conference after the decision.
We disagree: what is far more important is that the BOJ, just like the Fed which admitted one week ago it hikes rates just as the economy was slowing, has demonstrated it has absolutely no clue either what it is doing, and certainly no idea how to properly communicate with the markets. For now the response is positive. We give the BOJ’s action of sheer panic and desperation a half-life of a few days before the euphoria fully fizzles as China is forced to retaliate to this latest bomb explosion in an increasingly more violent global currency war.
END
Deutsche Bank Eliminates Management Bonuses After “Horrible,” “Grim” Results
Grenade hurled at a refugee shelter but did not explode. Approximately 40% of Germans are telling Merkel to resign:
(courtesy zero edge)
Grenade Hurled At Refugee Shelter As 40% Of Germans Tell Merkel To Resign
On Thursday evening we detailed the dramatic increase in Google search queries for gun permits in Germany. Specifically, since January 1, the number of Germans Googling “gun permits” has risen more than 1,000%.
Meanwhile, sales of non-lethal weapons such as tear gas pistols have skyrocketed, as Germans look to protect themselves against what many see as a hostile foreign invasion.
But while most Germans are (for now) content to counter the perceived threat from hostile migrants with non-lethal arms, at least one citizen on Friday decided to deploy a more deadly weapon in the “battle” to preserve German society: a grenade.
“Unknown assailants hurled a hand grenade at a shelter for asylum seekers in southern Germany on Friday but the device did not explode and no one was injured,” AFP reports. “Police in Villingen-Schwenningen said about 20 residents of the shelter were temporarily evacuated but were able to return to their rooms in the early morning hours.”
“Security staff discovered the intact explosive device and notified the police,” a statement from authorities read.
The pin was pulled, but for whatever reason, it didn’t explode. Police later detonated it in a controlled explosion.
Although no one was harmed in this particular attack, it underscores just how precarious the situation has become. Refugees probably thought the days of having grenades lobbed at them were over once they escaped the war-torn Mid-East. They were wrong.
Meanwhile, a new poll by Insa shows just how fed up Germans have become with Berlin’s refugee policy. According to the survey – which was conducted for Focus magazine – 40% of the country believes Angela Merkel should resign.
“The Insa poll for Focus magazine surveyed 2,047 Germans between Jan. 22 to Jan. 25,” Reuters reports. “It was the first time the pollster had asked voters whether Merkel should quit.”

As Reuters goes on to note, “Merkel enjoyed record high popularity ratings early last year [but] has grown increasingly isolated in recent months as members of her conservative bloc have pressed her to take a tougher line on asylum seekers and European allies have dragged their feet on the issue.”
On Thursday, Germany moved to tighten asylum rules in an effort to stem the flow of refugees into the country. Specifically, Berlin added Algeria, Morocco and Tunisia to the “safe countries of origin list,” allowing Germany to easily deny asylum to migrants from those countries.
Vice Chancellor Sigmar Gabriel also said family reunions for migrants would be blocked for two years.
Also on Thursday, Finland joined Sweden in promising to deport tens of thousands of the refugees it sheltered last year. Paivi Nerg, administrative director of the interior ministry told AFP the country would deport two thirds, or 32,000 migrants in 2016.
Clearly, the situation in Europe is deteriorating at a rather rapid clip. All that’s needed now is one more major “incident” akin to the Paris attacks for the entire thing to unravel in earnest.

Bond Yields Are Collapsing Around The World
Kuroda’s decision to go full NIRP-tard is benefitting investors worldwide… in bonds. JGB yields hit record lows, 5Y Bunds are trading below the -30bps ECB deposit rate, and US Treasury yields are collapsing across the curve with 10Y below August’s Black Monday lows back to 9 months lows…
US Treasury yields are plunging…

With German and Japanese bond yields negative to 8Y and 9Y respectively…

Macro Hedge Funds Crushed Again
That giant sucking sound you hear is the P&L of macro/FX hedge funds as they look in dismay at their USDJPY exposure. Why? Because as the following chart from SocGen shows, net spec positioning in the JPY was has quietly risen to the highest it has been since 2012!

This what SocGen’s Kit Juckes said just last night:
USD/JPY hasn’t fallen as much as a blind correlations with equities might suggest. Or, if the causation goes the other way, the Nikkei is doing worse than it really ought to on the back of the move in USD/JPY to date. In part that reflects (probably prematurely) concern about the BoJ acting to stop the yen rallying further. It also reflects the shift in positioning. The market is turning net long yen, though I don’t think that is reflected in a short USD/JPY position as much as shorts in AUD/JPY, NZD/JPY. GBP/JPY and even EUR/JPY (Chart 2).
Well, Kit didn’t have much to wait: after last night’s NIRP shocker by the BOJ, explicitly denied by Kuroda just one week earlier, the USDJPY is soaring…

… and all those hedge funds who moved to long yen positions in recent months are getting a quick refresher in the lesson of “don’t fight the Bank of Japan”, even when it is sprawled out and about to lose all credibility.
end
Norway is caught in a Catch 22: the lower the price of oil causes lower foreign earnings which in translates into a higher demand for NOK which hurts the country as it cannot lower the NOK to shore up its economy:
(courtesy zero hedge)
Norway’s Kroner Conundrum Deepens As Central Bank Buys Record Amount Of Currency
“The paradox of Norway’s oil exports is that lower foreign earnings translate into more, not less, demand for NOK.”
That’s from Deutsche Bank and it sums up the conundrum facing Norwegian officials as they attempt to cope with the sharp decline in crude prices that threatens to cripple the country’s economy.
Norway’s prime minister, finance minister and central bank governor held an extraordinary meeting last week to discuss the possibility of implementing emergency measures to shore up the economy in addition to record fiscal stimulus.
It’s “not a crisis,” they concluded, an assessment that’s sharply at odds with comments made by Bente Nyland, director general of the Norwegian Petroleum Directorate earlier this month and sharply at odds with reality.

“Right now the economic policies that we presented in our October budget are working,” Finance Minister Siv Jensen said. “What we have said today is that we are prepared to act if needed.”
Compounding the problem for Norway is that while the country’s officials remain “ready to act”, central bankers the world over are already acting and that’s inhibiting the NOK’s ability to function as a counter cyclical buffer for the country’s economy.
Even as the ECB, the SNB, the Nationalbank, and the Riksbank all stuck in NIRP, the Norges Bank is at 75 bps. Positive 75 bps.
That means the NOK can’t fall as much as it needs to to help the economy absorb the blow from lower crude. As Bloomberg put it last year, the krone “just can’t get weak enough.”
Here’s the rub. In order to fund the fiscal stimulus the economy needs to stay on its feet, Norway is tapping into its sovereign wealth fund. In short, expenditures are set to exceed revenues and so, it’s time to tap the piggy bank which, at $830 billion, is the largest rainy day fund on the planet. The problem here is that oil proceeds must be converted to kroner before they can be used to cover budget needs. That means the Norges bank is a buyer of NOK. Here’s how it works, via Deutsche:
The amount of state petroleum revenues converted into NOK is a function of the non-oil budget deficit. Revenues in foreign currency from the SDFI are transferred daily to the Norges Bank’s petroleum buffer, before being distributed to the GPFG. By contrast, revenues from the Statoil dividend and oil tax are transferred to the government directly in krone, after companies have sold their foreign exchange revenues to pay the dividend and the tax.
When krone revenues from the Statoil dividend and oil tax exceeds the non-oil budget deficit, the Norges Bank converts this surplus on behalf of the government into foreign exchange, depositing it in the petroleum buffer before transfer to the GPFG. The Norges Bank thus buys foreign exchange and sells krone on behalf of the government. Where krone revenues from the Statoil dividend and oil tax are insufficient to cover the non-oil budget deficit, no krone is converted back into FX by Norges Bank. Instead, SDFI revenues in the petroleum buffer are converted into krone. As a result the Norges bank sells FX and buys krone on behalf of the government.
Simple enough. Here it is visually:

Here’s a look at the history as well as a chart which depicts the convergence of oil revenues and the deficit:

So as you can see from the left pane above, the Norges Bank announced it was set to become a buyer of NOK at a clip of 250 million per day starting in October of 2014.
“The amount that they will buy is even bigger than we expected,” Kjersti Haugland, an analyst at DNB ASA, remarked at the time.
That total was up to 500 million per day by the end of 2015 and today we learn that it’s about to get a whole lot bigger.
“The Nordic country will buy 900 million kroner ($104 million) a day next month as it converts its oil income into local currency to cover budget needs, ” Bloomberg reports.
“This is a substantial change,” DNB ASA’s Magne Oestnor remarked. “This will add pressure to the appreciation of the krone. Suddenly Norges Bank goes from being just a medium size flow everyday to starting to be a flow to reckon with.”
Yes a “flow to be reckoned with,” and the problem with that should be immediately apparent. Norway needs to buy NOK in order to fund the stimulus the country hopes will support the economy. But by doing so, the Norges Bank is putting upward pressure on the currency at a time when it really needs to depreciate. In other words, what Norway must do to pay for stimulus (buy kroner) is indirectly hurting the economy by keeping the NOK from depreciating as much as it otherwise would. This is complicated by the fact that the country’s largest export destinations are still in easing mode.

(Norway’s export destinations)
On Friday, data showed unemployment soaring to its highest level in more than a decade and retail sales falling. “The poor economic data offset the effect of rising krone purchases,” Bloomberg notes.
Maybe. But the upward pressure on the currency is going to intensify in February and besides, were it not for Norges Bank buying, the currency might have fallen further on the bad data.
It will be interesting to see how this “paradox” resolves itself going forward and whether the Norges Bank will end up fighting itself à la Fight Club by cutting rates to drive down the NOK even as they buy the currency hand over fist.
Your early morning currency/gold and silver pricing/Asian and European bourse movements/ and interest rate settings/FRIDAY morning 7:00 am
Euro/USA 1.0919 down .0016 (Draghi’s jawboning still not working)
USA/JAPAN YEN 120.97 up 2.047 (Abe’s new negative interest rate (NIRP)
GBP/USA 1.4295 down .0063
USA/CAN 1.4065 up .0027
Early this FRIDAY morning in Europe, the Euro fell by 16 basis points, trading now just above the important 1.08 level rising to 1.0919; Europe is still reacting to deflation, announcements of massive stimulation (QE), a proxy middle east war, and the ramifications of a default at the Austrian Hypo bank, an imminent default of Greece, Glencore, Nysmark and the Ukraine, along with rising peripheral bond yield further stimulation as the EU is moving more into NIRP and the threat of continuing USA tightening by raising their interest rate / Last night the Chinese yuan was up in value (onshore). The USA/CNY down in rate at closing last night: 6.5525 / (yuan up but will still undergo massive devaluation/ which will cause deflation to spread throughout the globe)
In Japan Abe went BESERK with NEW ARROWS FOR HIS Abenomics WITH THIS TIME INITIATING NIRP (SEE BELOW) . The yen now trades in HUGE SOUTHbound trajectory as IT settled DOWN in Japan by 204 basis points and trading now well ABOVE that all important 120 level to 120.97 yen to the dollar.
The pound was DOWN this morning by 63 basis point as it now trades just below the 1.43 level at 1.4295.
The Canadian dollar is now trading down 27 in basis points to 1.4065 to the dollar.
Last night, Asian bourses were ALL IN THE GREEN with Shanghai UP 3.09% . All European bourses were in the green as they start their morning.
We are seeing that the 3 major global carry trades are being unwound. The BIGGY is the first one;
1. the total dollar global short is 9 trillion USA and as such we are now witnessing a sea of red blood on the streets as derivatives blow up with the massive rise in the rise in the dollar against all paper currencies and especially with the fall of the yuan carry trade. The emerging market which house close to 50% of the 9 trillion dollar short is feeling the massive pain as their debt is quite unmanageable.
2, the Nikkei average vs gold carry trade (blowing up and the yen carry trade also blowing up/and now NIRP)
3. Short Swiss franc/long assets blew up ( Eastern European housing/Nikkei etc.
These massive carry trades are terribly offside as they are being unwound. It is causing global deflation ( we are at debt saturation already) as the world reacts to lack of demand and a scarcity of debt collateral. Bourses around the globe are reacting in kind to these events as well as the potential for a GREXIT>
The NIKKEI: this FRIDAY morning: closed down 122.47 or 0.71%
Trading from Europe and Asia:
1. Europe stocks all in the green
2/ Asian bourses green/ Chinese bourses: Hang Sang green (massive bubble forming) ,Shanghai in the green by 3.09% (massive bubble bursting), Australia in the green: /Nikkei (Japan)green/India’s Sensex in the green /
Gold very early morning trading: $1112.25
silver:$14.20
Early FRIDAY morning USA 10 year bond yield: 1.93% !!! down 6 in basis points from last night in basis points from THURSDAY night and it is trading BELOW resistance at 2.27-2.32%. The 30 yr bond yield rises to 2.74 down 6 in basis points from last night. ( still policy error)
USA dollar index early FRIDAY morning: 99.10 up 52 cents from THURSDAY’s close.(Now below resistance at a DXY of 100)
This ends early morning numbers FRIDAY MORNING
OIL MARKETS
what a joke: Iran states that it will never support any supply cut and thus there goes your emergency OPEC meeting:
(courtesy zero hedge)
What Oil Production Cuts: Iran Says It Won’t Support Any Supply Cut Or Emergency OPEC Meeting
The main reason for oil’s torrid surge over the past 2 days is that following yesterday’s Russia-Opec “oil production cut” headline fiasco, crude traders – who as we previously reported already had a record net short position – scrambled to cover their exposure on the assumption that where there is oily smoke, there will be fire.
We can now put to rest any speculation that OPEC will proceed with any supply cuts, whether Russia requests it or not, because as the WSJ reported moments ago, not only will OPEC not support a supply cut but it will also not support an emergency OPEC meeting.
Will oil respond negatively to this headline as it did so positively to yesterday’s volley of speculation that sent it surging? Judging by the initial response, the short covering may have ended…

… although it remains unclear if it will undo all gains over the past 24 hours.
Still, remember the Saudis previously warned the oil market is oversupplied by about 3MM B/D, which means that all those fundamentals that ceased to matter this week will be back front and center in the coming hours, if indeed it is Iran’s fault this time that OPEC simply is unable to reach an agreement.
As for the Saudis, they are delighted to point a finger at Iran as the culprit for why overproduction will continue, even as it is their ultimate strategy to put shale producers out of business. At least this way, the US energy sector can now blame Tehran instead of Riyadh.
WTI Plunges To $32 Handle – Erases All “OPEC Production Cut Hope” Gains
Well that de-escalated quickly…

Just as we warned, it appears the short-covering is over…
WTI Crude Slides Despite Significant Rig Count Decline
The US total rig count dropped 18 to 619 in the last week with a drop of 12 in oil rigs (to 498) as the ongoing lagged drop of crude drives rig counts every lower. Perhaps oddly, given the rig count decline, WTI is tumbling as a 12 rig drop is clearly not enough…
- *U.S. TOTAL RIG COUNT DOWN 18 TO 619 , BAKER HUGHES SAYS
- *U.S. OIL RIG COUNT DOWN 12 TO 498, BAKER HUGHES SAYS
The trend continues…

And it appears the market wanted more rig count declines…
Charts: Bloomberg
end
Deutsche Bank downgrades crude oil:
(courtesy Deutsche bank/zero hedge)
$7 Crude? Deutsche Bank Downgrades Oil ‘Lower For A Lot Longer’
Oil prices around USD 30/bbl mean that an increasingly significant volume of future oil projects no longer make sense. Although Deutsche Bank does not expect US crude inventories to reach capacity, rising US inventories and high US crude imports may heighten downside pressures to push prices closer to marginal cash costs of USD 7-17/bbl for US tight oil.
With few plausible scenarios for a strong price recovery in the short term, Deutsche lowers their Q1-2016 price forecasts to USD 33/bbl for WTI and Brent.
We see downside risks stemming from a lower demand growth outlook this year in the event that US product demand remains extremely weak, and from the possibility that equity market declines feed through into lower consumer confidence and spending. Upside risks may arise from either a weak or unsustained rise in Iranian exports, which may then lead to OPEC production in 2017 below our assumption of 32.4 mmb/d (excluding Indonesia).
One might be tempted to claim that prices have detached from fundamentals given the rapidity of the decline since December. Although we could choose to attribute some part of price movement to outside factors such as market psychology, an undeniable rise in risk aversion since the start of the year, and associated equity market weakness, this would do little to advance the state of knowledge regarding oil fundamentals. Therefore we prefer to (i) identify a possible fundamental basis for the further decline in oil prices, which could sustain prices at a low level, and (ii) assess the likely impact of prices remaining around USD 30/bbl on the forward balance.
With regard to the first point, the disappointment in Chinese economic growth for Q4-15 should not be a key driver as the most recent data on apparent consumption remains strong as of November 2015, with average year-on-year demand growth of +400 kb/d for the three months ending in November, Figure 2.
The further strengthening of the trade-weighted US dollar (TW$) may be a more substantial influence as since mid-December we have seen a further 1.4% appreciation, along with a continuation of the newly negative correlation of crude-oil daily returns with the TW$. However the dollar-oil correlation is still not nearly as strong as that observed over the 2006-2013 period and appears to be reverting to a more neutral level, such as that observed over the 1991-2002 period, Figure 3.
Perhaps the most negative piece of fundamental data originates from the United States where despite a more normal weather from the start of January, Figure 4, total product demand is down versus 2015 by -230 kb/d in the most recent week of data, Figure 5.
We note that more substantial demand worries may yet surface over the balance of the year as slowing economic growth outside of the US may infect the domestic outlook, particularly if equity markets do not recover materially and translate into weaker confidence and, in turn, consumer spending.


Finally Deustche Bank shows two long-term charts that hopefully make for interesting reading when considering just how “lower” for “longer” oil could be…
Firstly a long-term real adjusted chart we publish every year in our annual longterm study that shows that the average price (in today’s money) since 1861 is $47/bbl. So current levels are low but not exceptionally low relative to longterm history. Nevertheless in this year’s long-term study if prices stay at similar levels it will be the first time our long-term mean reversion exercise will show positive return expectations for Oil since we first started it over a decade ago.
Although we don’t claim to be experts on Oil markets our long held belief is that commodities that are factors of production are unlikely to outstrip inflation over the long-term as if they do there will be alternatives found. Clearly this can take years if not decades to resolve so even if we’re correct commodity cycles can still last a long time before they eventually mean revert. Overall the graph doesn’t suggest that current levels are as extreme as many would suggest even if long term value has returned. The $140 prices a few years back look especially bubble like in a long-term prospective.
The second chart looks at US recessions since the early 1970s and the price of Oil.
The Oil price was broadly fixed for much of the post-war Bretton Woods period but has floated since its collapse (average real price since then $57.7). As can be seen ahead of the five recessions seen over this period, all have been preceded by a significant spike higher in the price of Oil. While there are many potential drivers of a recession it is food for thought when you look at the current situation.


As we say on a regular basis we are firmly in the secular stagnation camp but have some sympathy that the consumer is getting a big benefit at the moment from the sharp fall in Oil.If only there wasn’t huge amount of leverage in the financial system exposed to commodities that could potentially be systemic.
Portuguese 10 year bond yield: 2.88% down 10 in basis points from THURSDAY
New York equity performances plus other indicators for today:
Bank of Japan Policy Panic Unleashes Stock, Bond Buying Pandemonium
Some soothing month-end meditation…
So let’s start with today’s idiocy… US equities driven by fundamentals!!
- *S&P 500 EXTENDS GAIN TO 2.1%, HEADED FOR BEST DAY SINCE SEPT.8

But here is some context for January’s moves…
For China…

Worst ever…

For US markets – apart from 2009’s collapse, this is the worst January ever… Saved by today’s total panic!

But bonds had a great one!!

This is Gold’s 3rd January up in a row (and 8th of the last 11 years)…

Across asset-classes, Bonds & Bullion did well, stocks and crude not so much…

Small Caps underperformed while the S&P was the least bad performer…

FANTAsy stocks are all down aside from FB – with TSLA and NFLX down over 20%…

Bond yields are down across the curve… The belly (5Y and 7Y yield) outperformed – down a stunning 40-45bps on the month…

So not an awsesome month but hey… what a week right!!
* * *
On the week…even Nasdaq managed to get green despite AAPL and AMZN collapse…

Energy stocks simply exploded higher off Monday’s lows…

Bonds & Stocks were bid…

With Treasury yields down 12-15bps on the week (though 30Y oddly underperformed)

The USDollar Index soared back to unchanged on the week after BoJ’s idiocy…

Commodities all gained on the week with crude and copper best…

Finally today…
Total panic buying…

Yeah this really happened!!! 3000 points of swing in Nikkei 225

Creating a giant squeeze in US equities…

Well it is Friday after all…

Charts: Bloomberg
Bonus Chart: An awkward reality check…
Fourth quarter GDP grew by only .69%. If you would use a proper deflator then the GDP would probably be negative.
(courtesy zero hedge)
“Peddling Fiction” – US Economy Grew A Paltry 0.69% In The Fourth Quarter, Missing Expectations
And so the final quarter of 2015 is in the history books and we can officially accuse the US Bureau of Economic Analysis of “peddling fiction” about the US recovery, because at a growth rate of 0.69%, the annualized rate of economic growth was the lowest since the first quarter of 2015 when it grew an almost identical 0.64% which was blamed on the harsh weather. This time however, there is no easy scapegoat.
The breakdown was as follows:
- Fixed Investments, that residual from the oil collapse, tumbled although at 0.03% annualized it was still a contributor to growth. Expect this to change
- Inventories, as expected, subtracted -0.45% from GDP. This was less than many had expected suggesting there will be more inventory liquidation in Q1
- The government contributed 0.12% to Q4 GDP
- Net Trade, as was to be expected in a world in which global trade is slowing drastically, subtracted another 0.47% from the annualized report
- The only silver lining was Personal Consumption, which rose 2.20%, above the 1.8% expected, and contribted 1.46% to the bottom line. However, as we will show in a subsequent post, the bulk of this “growth” came from just one line item again: healthcare.
In other news, core PCE rose 1.2% in 4Q after rising 1.4% prior quarter, while the clearest confirmation of the rapidly slowing US economy was final sales to private domestic purchasers which rose just 1.8% in 4Q after rising 3.2% the prior quarter.
But what some may be most interested by is that the Q3 implicit price deflator was +0.8%, begging the question: just what would the real GDP print be if it wasn’t propped up by CPI gimmicks.
Here is a chart of US GDP by quarter:

And a full breakdown:

The punchline: annual GDP growth has just dropped to 2.9%, below the 3.1% in Q3, and the lowest in three years, since the 2.5% recorded in Q2 2013.

Most importantly, the inventory hangover remains strong as ever, because if anyone can spot the “inventory liquidation” in Q4, they win a Zero Hedge hat.

Macy’s Slashes Guidance Again, Twice In One Month
Less than 4 weeks ago, on January 6, we reported of the “Macy’s Massacre: Thousands Fired; Guidance Slashed (Again); Weather Blamed“, where in addition to the massive layoffs announced by the iconic retailer, we learned that as a result of the “historically warmer weather”, the company’s prior guidance was no longer valid. Here is what it said in early January:
Macy’s, Inc. is not expecting a major change in sales trend in January and expects a comparable sales decline on an owned plus licensed basis in the fourth quarter of 2015 to approximate the 4.7 percent decline in November/December (from previous guidance of down between 2 percent and 3 percent for the fourth quarter). This calculates to guidance for comparable sales on an owned plus licensed basis in the full-year 2015 to decline by approximately 2.7 percent (from previous guidance of down 1.8 percent to 2.2 percent).
Earnings per diluted share for the full-year 2015 now are expected in the range of $3.85 to $3.90, excluding expenses related to cost efficiencies announced today and asset impairment charges associated primarily with spring 2016 store closings. This compares with previous guidance in the range of $4.20 to $4.30. Updated annual guidance calculates to guidance for fourth quarter earnings of $2.18 to $2.23 per diluted share, excluding charges associated with cost efficiencies and store closings. This compares with previous guidance for earnings per diluted share of $2.54 to $2.64 in the fourth quarter. Earnings guidance for 2015 includes an expected $250 million gain on the sale of real estate in downtown Brooklyn.
Well, moments ago Macy’s issued a press release in which it announced that as a result of the completion of a “real estate transaction with Tishman Speyer that will enable the re-creation of its Brooklyn store on Fulton Street” (there is always something), it has just cut guidance once again:
Given this timing change in accounting for the transaction, Macy’s management has revised its earnings guidance for the fourth quarter and full-year 2015, which previously has assumed the entire gain would be booked in the fourth quarter of 2015. Earnings per diluted share for the full-year 2015 now are expected in the range of $3.54 to $3.59, excluding expenses related to cost efficiencies announced earlier in January and asset impairment charges associated primarily with spring 2016 store closings. This compares with previous guidance in the range of $3.85 to $3.90. Updated annual guidance calculates to guidance forfourth quarter earnings of $1.85 to $1.90 per diluted share, excluding charges associated with cost efficiencies and store closings. This compares with previous guidance for earnings per diluted share of $2.18 to $2.23 in the fourth quarter.
At least Macy’s didn’t blame the “historical snow storm” in January for this latest cut.
And just like that, in the span of several months, with the January 6 interim step, Macy’s has lowered its full year outlook by 16% from $4.25 to $3.57. And since the stock is now trading near the highest levels since early November when the guidance cuts began, we can only imagine that all those betting on multiple expansion will be richly rewarded at a time when the US consumer is starting to finally feel to full impact of the manufacturing, at first, recession that is spreading across the nation.
Chicago PMI Spikes Most Since 1980… Yeah, Seriously
After crashing to post-Lehman lows in December, there was some hope for a bounce in January but this is simply idiotic. Chicago PMI soared 30% – the most sicne 1980 – from 42.9 (7 year lows) to 55.6 (1 year highs). This was miraculously driven by double-digit and all-time record gains in new orders and order backlogs.
Behold… everything is awesome again!

As MNI adds,
While the surge in activity in January marks a positive start to the year, it follows significant weakness in the previous two months, with the latest rise not sufficient enough to offset theprevious falls in output and orders. On previous occasions, surges of such magnitude have not been maintained.
While there is typically a mild seasonal pick up in January, some purchasers noted the “typical ‘hockey stick’ order cycle was not as steep as in previous years.
The uptick in ordering and output was not accompanied by a surge in hiring, though it can lag. Employment, which did not suffer as much during November and December’s output downturn, contracted at a slower pace, marking its fourth consecutive contraction.
* * *
The Last Time Inflation Expectations Were This Low, Bernanke Unveiled QE2
While University of Michigan confidence slipped modestly from December’s print, the tumble in expectations (hope) from the preliminary print is perhaps more important as stocks dropped and volatility struck. However, more problematic for an inflation-hoping Federal Reserve is the drop in 12-month inflation expectations.

The last time inflation expectations were lower than this was September 2010.. when Bernanke hinted at QE2 at jackson Hole.
end
STOCKMAN’S CORNER
Death Throes Of The Bull
by David Stockman • January 28, 2016


The fast money and robo-machines keep trying to ignite stock rallies, but they all fizzle because bad karma is beginning to infect the casino. That is, apprehension is growing among whatever adults are left on Wall Street that 84 months of ZIRP and $3.5 trillion of Fed balance sheet expansion, aka money printing, didn’t do the trick.
Not only is the specter of recession growing more visible, but it is also attached to a truth that cannot be gainsaid. Namely, having stranded itself at the zero bound for an entire business cycle, the Fed is bereft of dry powder. Its only available tools are a massive new round of QE and negative interest rates.
But these are absolutely non-starters. The former would provoke riots in the financial markets because it would be an admission of total failure; and the latter would provoke a riot in the American body politic because the Fed’s seven year war on savers and retirees has already generated electoral revulsion. Bernie and The Donald are not expressions of public confidence in the economic status quo.
So the dip buying brigades have been reduced to reading the tea leaves for signs that the Fed’s four in store for 2016 are no more. Yet even if the prospect of delayed rate hikes is good for a 50-handle face ripping rally on the S&P 500 index from time to time, here’s what it can’t do. The Fed’s last card—-deferring one or more of the tiny interest rate increases scheduled for this year——cannot stop the on-coming recession.
And it is surely coming. We got one more powerful indicator on that score in this morning’s data on core capital goods orders (i.e. nondefense excluding aircraft). Not only were they down sharply from last month, but at $65.9 billion were down 11% from the September 2014 peak, and are also now below the prior cyclical peaks in early 2008 and 2001.
In fact, core CapEx orders in December were at a level first reported in April 2000, and that’s in nominal dollars. In real terms, they are down nearly 25%.
Needless to say, there will be pandemonium in the casino when the downturn is no longer deniable. That’s because the main prop under the market today is, in fact, the Wall Street mantra that bear markets never happen in the absence of a recession and that none is purportedly visible.
On that score, it is no use listing and documenting all the flashing red lights or that the BLS jobs report is both a lagging indicator and virtually worthless. Today in a nearby column, Lance Roberts reminds that at the top of the cycle the BLS nearly always over-reports employment gains, and that these estimates get revised away in the four subsequent iterations of the data over the next several years.
But in the current context, he thinks there is something especially fishy. Namely, that the continuing decline of the labor market participation rate is not consistent with the allegedly robust job count gains, and also it is not consistent with any prior historical relationship between the two.
But here is the potential problem for the Fed’s dependence on current employment data as justification for tightening monetary policy – it is likely wrong. Economic data is very subject future revisions. While the current employment data has indeed been the strongest since the late 1990’s, there is a probability that the data is currently being overestimated.
The reason is shown in the chart below.
If the employment gains were indeed as strong as the Fed, and the BLS, currently suggest; the labor force participation rate should be rising. This has been the case during every other period in history where employment growth increased. Since the financial crisis, despite employment gains, the labor force participation rate has continued to fall.
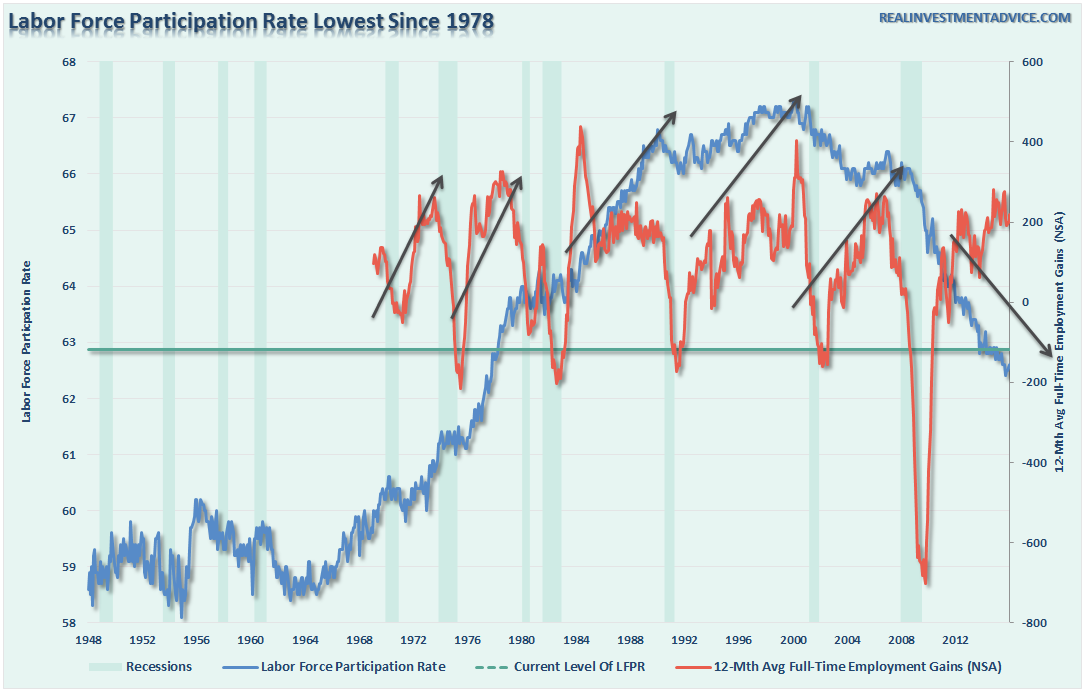
No, the consumers of America cannot shop the nation out of recession, either. That would take robust job and earnings gains, which are not happening, or a new round of household leverage gains, which are not remotely feasible given the condition of “peak debt” now prevalent.
On this score, we reported the other day that the vaunted strength of auto sales was actually nothing of the kind; and that we are likely at the turning point in the auto sales recovery cycle because virtually anyone who can fog a rear view mirror has already been given a car loan.
Indeed, during the past 12 months auto dealer sales rose by $65 billion but vehicle loans outstanding soared by $90 billion to an all-time high! The surging dealer lots would actually have been even more flooded with unsold cars without this final injection of cash to the bottom of the credit ladder.
Still, the talking heads keep telling you that households have substantially deleveraged and are fixing to embark on a new spending spree.
No they are not. After a few quarters of reduction owing to the massive write-downs of mortgage debt after the crisis, household debt has again crept higher. In fact, it is up by nearly $1 trillion since the late 2011 lows; and at 180% of wage and salary income remains drastically elevated by all historical standards.
Wall Street never forecasts a recession, of course. Not even when powerful indicators like the soaring inventory-to-sales ratio suggest that a downward production and income adjustment is just around the corner.
In fact, as of the most recent data, total business sales—–manufacturing, wholesale and retail—–were down by nearly 4% from their mid-2014 peak. And the ratio of inventory to sales has shot up to levels last posted in October 2008.
Business sales and investment are the heart of the equation. When they head south, the recession is just around the corner. It is only after the fact that the nation’s stock market obsessed C-suites get around to unloading excess labor inventories.
In the meanwhile, the sell-side does its level best to keep the dying bull alive with its own hockey stick projections. At the moment, the all is awesome chorus insists that what will be another negative growth earnings season should be ignored. That’s because its just the energy industry profits plunge rotating through the year-over-year comparisons.
Needless to say, by the second half of this year and 2017 it will all be blue skies again. In fact, the current consensus EPS for 2017 is no less than $141 per share on the S&P 500. And at today’s closing price of 1893 that’s a PE multiple of just 13.4X. No sweat!
Then again at the comparable point in the 2015 earnings cycle—-that is, February 2014—-the Wall Street hockey stick pointed to $137/per share. After three quarters of actuals and the downgraded estimates for Q4, that number has plummeted to $106 per share; and that’s after excluding about $12 per share of inconvenient “ex-items” stuff like restructuring charges, plant closings, lease write-offs, stock option costs and much more.
In fact, however, the actual GAAP earnings reports, which are filed with the SEC and signed off by the CEO and CFO on penalty of jail time, are pointing in a decidedly different direction. Reported GAAP earnings peaked at $106 per share on the S&P 500 more than a year ago for the LTM period ending in September 2014.
By the most recent reporting period they were down by 14.4% to $90.66 per share, and there is no reason to believe that this slide will rebound when the Q4 numbers are actually tallied.
Here’s the thing. This exact pattern occurred during the 2007-2009 collapse. While the Wall Street hockey sticks were projecting earnings of $120 per share or more for 2008, actual GAAP earnings starting falling in the June 2007 LTM period, and kept plunging until they hit bottom at $7 per share in June 2009.
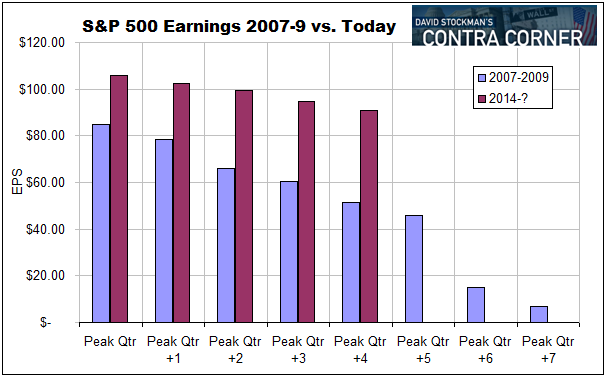
The blue bars mark the death throes of a dying bull last time. Self-evidently, this one—market in red—– is not far behind.
END
Looks like Hillary is going to be charged under violation of the secrets act with her handling of documents on her personal server:
(courtesy zero hedge)
Indictment Looms As FBI Declares 22 Clinton Home-Server Emails “Top Secret”
Just as we warned, and she must have known, it appears at least 22 of the emails found on Hillary Clinton’s private email server have been declared “top secret” by The FBI(but will not be releasing the contents) according to AP.
Clinton has insisted she never sent or received information on her personal email account that was classified at the time. No emails released so far were stamped “CLASSIFIED” or “TOP SECRET,” but reviewers previously had designated more than 1,000 messages at lower classification levels for public release. Friday’s will be the first at the top secret level.
The Obama administration is confirming for the first time that Hillary Clinton’s unsecured home server contained some closely guarded secrets, including material requiring one of the highest levels of classification.
The revelation comes just three days before the Iowa presidential nominating caucuses in which Clinton is a candidate.
The State Department will release more emails from Clinton’s time as secretary of state later Friday.
But The Associated Press has learned that 7 email chains are being withheld in full for containing “top secret” material.
The 37 pages include messages recently described by a key intelligence official as concerning so-called “special access programs” — a highly restricted subset of classified material that could point to confidential sources or clandestine programs like drone strikes or government eavesdropping.
Department officials wouldn’t describe the substance of the emails, or say if Clinton had sent any herself.
Spokesman John Kirby tells the AP that no judgment on past classification was made. But the department is looking into that, too.
For those that Clinton only read, and didn’t write or forward, she still would have been required to report classification slippages that she recognized.
Possible responses for classification infractions include counseling, warnings or other action, State Department officials said, though they declined to say if these applied to Clinton or senior aides who’ve since left the department. The officials weren’t authorized to speak on the matter and spoke on condition of anonymity.
However, as we previously noted, the implications are tough for The DoJ – if they indict they crush their own candidate’s chances of the Presidency, if they do not – someone will leak the details and the FBI will revolt… The leaking of the Clinton emails has been compared to as the next “Watergate” by former U.S. Attorney Joe DiGenova this week, if current FBI investigations don’t proceed in an appropriate manner. The revelation comes after more emails from Hilary Clinton’s personal email have come to light.
“[The investigation has reached] a critical mass,” DiGenova told radio host Laura Ingraham when discussing the FBI’s still pending investigation. Though Clinton is still yet to be charged with any crime, DiGenova advised on Tuesday that changes may be on the horizon. The mishandling over the classified intelligence may lead to an imminent indictment, withDiGenova suggesting it may come to a head within 60 days.
“I believe that the evidence that the FBI is compiling will be so compelling that, unless [Lynch] agrees to the charges, there will be a massive revolt inside the FBI, which she will not be able to survive as an attorney general,” he said.
“The intelligence community will not stand for that. They will fight for indictment and they are already in the process of gearing themselves to basically revolt if she refuses to bring charges.”
The FBI also is looking into Clinton’s email setup, but has said nothing about the nature of its probe. Independent experts say it is highly unlikely that Clinton will be charged with wrongdoing, based on the limited details that have surfaced up to now and the lack of indications that she intended to break any laws.
“What I would hope comes out of all of this is a bit of humility” and an acknowledgement from Clinton that “I made some serious mistakes,” said Bradley Moss, a Washington lawyer who regularly handles security clearance matters.
Legal questions aside, it’s the potential political costs that are probably of more immediate concern for Clinton. She has struggled in surveys measuring her perceived trustworthiness and an active federal investigation, especially one buoyed by evidence that top secret material coursed through her account, could negate one of her main selling points for becoming commander in chief: Her national security resume.
end
Let’s close the week out with this wrap with courtesy of Greg Hunter of uSAWatchdog
(courtesy Greg Hunter/USAWatchdog)
All Trump All the Time, Bad Economy Sold as Good, Lucifer is In Style-NOT

Trump talks, he makes news. Trump doesn’t talk, he makes news. Trump tweets, he makes news. Trump offends, he makes news. Trump makes sense, he makes news. You may think what is going on with Donald Trump is all about Trump, it is really about the changing landscape of media and the old mainstream media (MSM) losing its relevance. Look at what just happened with Trump and this debate fiasco with FOX. FOX thinks it’s still running the media show, and Trump is showing them they are not. When you hear about Trump tweeting, switch out the word ‘tweet’ with ‘broadcast’ and there you have it. Trump, via the new media such as Facebook and Twitter, doesn’t need a network of TV stations or a cable outlet. The mainstream media is so freaked out they cover each and every tweet of Trump’s so as to not miss out and retain some relevance. No front-runner would have ever turned down a TV appearance until now. Why did he turn it down–he doesn’t need it. The MSM needs him. Times are changing, and the MSM is losing its grip in media and thus its relevance. Of that there is no doubt.
The USA Today finally stopped saying we are in a recovery. You know why? Because we are not in a recovery, at least not for Main Street, but that doesn’t stop them from pushing what I think is a false narrative. For example, this week in the money section, they come out with a title that says “3 Reasons You Shouldn’t Worry About the Stock Market in 2016.” Never mind the stock market has plunged and is off to the worst start—ever. Never mind there is a Plunge Protection Team. Never mind there have been banks convicted of massive hundreds of trillions of dollars of fraud with commodities, interest rates and currencies. This article basically says buy good stocks and don’t worry and “don’t care.” I say “Run Forrest Run.” And so does David Stockman, who is a best-selling author and a former White House Budget Director. He will be on Sunday for the “Early Release.”
The standoff in Oregon is winding down, but not before one of the protesters was shot dead by the FBI. Details are sketchy, and the Feds are not saying why one protester was shot at a road block. At its core, this is about the question: who owns public land? Is it “We the People” or the federal government that can use the land as it wants, even if it hands out goodies to their donors and cronies. This is not the last time you will hear about this issue.
FOX is giving Lucifer a makeover. What??? The Devil is evil, yet, with FOX, and this new series, not so much. The Devil is a liar and a deceiver and everything he touches turns to rust or manure. Shame on FOX. For as the Bible says, “Woe unto them that call evil good, and good evil; that put darkness for light, and light for darkness; that put bitter for sweet, and sweet for bitter!”
Join Greg Hunter as he analyzes these stories and more in the Weekly News Wrap-Up.
Harvey


[…] by Harvey Organ Harvey Organ’s Blog […]
LikeLike