
GOLD: $1334.40 DOWN $10.50
Silver: $16.77 down 43 cents
Closing access prices:
Gold $1333.20
silver: $16.60
SHANGHAI GOLD FIX: FIRST FIX 10 15 PM EST (2:15 SHANGHAI LOCAL TIME)
SECOND FIX: 2:15 AM EST (6:15 SHANGHAI LOCAL TIME)
SHANGHAI FIRST GOLD FIX: $1356.09 DOLLARS PER OZ
NY PRICE OF GOLD AT EXACT SAME TIME: $1348.00
PREMIUM FIRST FIX: $8.09
xxxxxxxxxxxxxxxxxxxxxxxxxxxxxxxxxxxxxxxxxxxxxx
SECOND SHANGHAI GOLD FIX: $1354.87
NY GOLD PRICE AT THE EXACT SAME TIME: $1348.70
Premium of Shanghai 2nd fix/NY:$6.17
SHANGHAI REJECTS NY /LONDON PRICING OF GOLD
xxxxxxxxxxxxxxxxxxxxxxxxxxxxxxxxxxxxxxxxxxxxxxxxxxx
LONDON FIRST GOLD FIX: 5:30 am est $1345.00
NY PRICING AT THE EXACT SAME TIME: $1345.65
LONDON SECOND GOLD FIX 10 AM: $1331.15
NY PRICING AT THE EXACT SAME TIME. $1330.75
For comex gold:
FEBRUARY/
NUMBER OF NOTICES FILED TODAY FOR FEBRUARY CONTRACT: 196 NOTICE(S) FOR 19600 OZ.
TOTAL NOTICES SO FAR: 871 FOR 87100 OZ (2.709 TONNES),
For silver:
jANUARY
0 NOTICE(S) FILED TODAY FOR
nil OZ/
Total number of notices filed so far this month: 124 for 620,000 oz
XXXXXXXXXXXXXXXXXXXXXXXXXXXXXX
Bitcoin: BID $7,598/OFFER $7,695:DOWN $1424(morning)
Bitcoin: BID/ $8528/offer $8,628: down $490 (CLOSING/5 PM)
end
In case you missed this yesterday:
From the CBO:
it now looks like Congress will run out of money by the first half of March instead of late March or April
the way that the Democrats are acting, it does not look good for them to raise the debt ceiling!!
CBO>>
“Congress urged to take action on debt ceiling ahead of deadline: A Bloomberg report notes on Wednesday the CBO revised its estimate on when the Treasury Department will exhaust extraordinary measures to avoid debt default, with the expected deadline now in the first half of March (vs prior estimate for late March/early April). The Treasury Department separately urged Congress to “act promptly” amid its own estimated deadline at the end of February. According to the memo released by the CBO, the passage of tax reform legislation was a primary driver of the revised deadline amid changes to tax revenue projections. The updated timelines from the CBO and Treasury come as Congress continues to negotiate a government funding agreement following last month’s short- term stopgap bill.”
Let us have a look at the data for today
xxxxxxxxxxxxxxxxxxxxxxxxxxxxxxxxxxxxxxxxxxxxxxxxxxxxxxxxxxxxxxxxxxxxxxxxxx
In silver, the total open interest ROSE BY HUGE 4770 contracts from 198,036 RISING TO 202,806 DESPITE YESTERDAY’S 7 CENT FALL IN SILVER PRICING. WE OBVIOUSLY HAD NO COMEX LIQUIDATION. HOWEVER, WE WERE AGAIN NOTIFIED THAT WE HAD ANOTHER GOOD SIZED NUMBER OF COMEX LONGS TRANSFERRING THEIR CONTRACTS TO LONDON THROUGH THE EFP ROUTE: 1884 EFP’S FOR MARCH AND AND ZERO FOR ALL OTHER MONTHS AND THUS TOTAL ISSUANCE OF 1884 CONTRACTS. HOWEVER THE MOVEMENT ACROSS TO LONDON IS NOT AS SEVERE AS IN GOLD AS THERE SEEMS TO BE MAJOR PLAYERS WILLING TO TAKE ON THE BANKS AT THE COMEX. STILL, WITH THE TRANSFER OF 1884 CONTRACTS, WHAT THE CME IS STATING IS THAT THERE IS NO SILVER (OR GOLD) TO BE DELIVERED UPON AT THE COMEX AS THEY MUST EXPORT THEIR OBLIGATION TO LONDON. ALSO KEEP IN MIND THAT THERE CAN BE A DELAY OF 24 HRS IN THE ISSUING OF EFP’S.
ACCUMULATION FOR EFP’S/SILVER/ STARTING FROM FIRST DAY NOTICE/FOR MONTH OF FEBRUARY:
6546 CONTRACTS (FOR 3 TRADING DAYS TOTAL 6546 CONTRACTS OR 32.73 MILLION OZ: AVERAGE PER DAY: 2182 CONTRACTS OR 10.010 MILLION OZ/DAY)
TO GIVE YOU AN IDEA AS TO THE HUGE SUPPLY THIS MONTH IN SILVER: SO FAR THIS MONTH: 32.73 MILLION PAPER OZ HAVE MORPHED OVER TO LONDON. THIS REPRESENTS AROUND 4.67% OF ANNUAL GLOBAL PRODUCTION
ACCUMULATION IN YEAR 2018 TO DATE SILVER EFP’S: 267.7 MILLION OZ.
ACCUMULATION FOR JAN 2018: 236.879 MILLION OZ
RESULT: A HUGE SIZED GAIN IN OI COMEX DESPITE THE 7 CENT FALL IN SILVER PRICE. WE HOWEVER HAD A GOOD SIZED EFP ISSUANCE OF 1884 CONTRACTS WHICH EXITED OUT OF THE SILVER COMEX AND TRANSFERRED THEIR OI TO LONDON AS FORWARDS. SPECULATORS CONTINUED THEIR INTEREST IN ATTACKING THE SILVER COMEX FOR PHYSICAL SILVER . FROM THE CME DATA 1884 EFP’S FOR MARCH WERE ISSUED FOR TODAY FOR A DELIVERABLE FORWARD CONTRACT OVER IN LONDON WITH A FIAT BONUS. WE REALLY GAINED 6654 OI CONTRACTS i.e. 1884 open interest contracts headed for London (EFP’s) TOGETHER WITH A INCREASE OF 4770 OI COMEX CONTRACTS. AND ALL OF THIS HAPPENED WITH THE FALL IN PRICE OF SILVER OF 7 CENTS AND A CLOSING PRICE OF $17.20 WITH RESPECT TO YESTERDAY’S TRADING. YET WE STILL HAVE A GOOD AMOUNT OF SILVER STANDING AT THE COMEX.
In ounces AT THE COMEX, the OI is still represented by just OVER 1 BILLION oz i.e. 1.0040 BILLION TO BE EXACT or 145% of annual global silver production (ex Russia & ex China).
FOR THE NEW FRONT FEBRUARY MONTH/ THEY FILED: 0 NOTICE(S) FOR NIL OZ OF SILVER
In gold, the open interest FELL BY 1427 CONTRACTS DOWN TO 550,608 DESPITE THE GOOD SIZED RISE IN PRICE OF GOLD WITH YESTERDAY’S TRADING ($8.00). IN ANOTHER DEVELOPMENT, WE RECEIVED THE TOTAL NUMBER OF GOLD EFP’S ISSUED FOR TODAY AND IT TOTALED A GOOD SIZED 6579 CONTRACTS OF WHICH APRIL SAW THE ISSUANCE OF 6579 CONTRACTS AND ALL OTHER MONTHS ZERO. The new OI for the gold complex rests at 550,608. ALSO REMEMBER THAT THERE WILL BE A DELAY IN THE ISSUANCE OF EFP’S. THE BANKERS REMOVE LONG POSITIONS OF COMEX GOLD IMMEDIATELY. THEN THEY ORCHESTRATE THEIR PRIVATE EFP DEAL WITH THE LONGS AND THAT COULD TAKE AN ADDITIONAL 48 HRS SO WE GENERALLY DO NOT GET A MATCH WITH RESPECT TO DEPARTING COMEX LONGS AND NEW EFP LONG TRANSFERS. DUE TO THE DELAY IN THE RELEASE OF YESTERDAY’S DATA YOU CAN BET THE FARM THAT THEY HAVE DELAYED THE RELEASE OF MANY EFPS. DEMAND FOR GOLD INTENSIFIES GREATLY AS WE CONTINUE TO WITNESS A HUGE NUMBER OF EFP TRANSFERS TOGETHER WITH THE MASSIVE INCREASE IN GOLD COMEX OI TOGETHER WITH THE TOTAL AMOUNT OF GOLD OUNCES STANDING FOR JANUARY COMEX. EVEN THOUGH THE BANKERS ISSUED THESE MONSTROUS EFPS, THE OBLIGATION STILL RESTS WITH THE BANKERS TO SUPPLY METAL BUT IT TRANSFERS THE RISK TO A LONDON BANKER OBLIGATION AND NOT A NEW YORK COMEX OBLIGATION. LONGS RECEIVE A FIAT BONUS TOGETHER WITH A LONG LONDON FORWARD. THUS, BY THESE ACTIONS, THE BANKERS AT THE COMEX HAVE JUST STATED THAT THEY HAVE NO APPRECIABLE METAL!! THIS IS A MASSIVE FRAUD: THEY CANNOT SUPPLY ANY METAL TO OUR COMEX LONGS BUT THEY ARE QUITE WILLING TO SUPPLY MASSIVE NON BACKED GOLD (AND SILVER) PAPER KNOWING THAT THEY HAVE NO METAL TO SATISFY OUR LONGS. LONDON IS NOW SEVERELY BACKWARD IN BOTH GOLD AND SILVER (BIG RISE IN BOTH GOFO AND SIFO) AND WE ARE WITNESSING DELAYS IN ACTUAL DELIVERIES. IN ESSENCE TODAY WE HAVE A GAIN OF 5152 CONTRACTS: 1427 OI CONTRACTS DECREASED AT THE COMEX AND A STRONG SIZED 6579 OI CONTRACTS WHICH NAVIGATED OVER TO LONDON.
YESTERDAY, WE HAD 8262 EFP’S ISSUED.
ACCUMULATION OF EFP’S/ GOLD(EXCHANGE FOR PHYSICAL) FOR THE MONTH OF FEBRUARY STARTING WITH FIRST DAY NOTICE: 29,212 CONTRACTS OR 2,921,200 OZ OR 90.86 TONNES (3 TRADING DAYS AND THUS AVERAGING: 9,737 EFP CONTRACTS PER TRADING DAY OR 973,700 OZ/DAY)
TO GIVE YOU AN IDEA AS TO THE HUGE SIZE OF THESE EFP TRANSFERS : SO FAR THIS MONTH IN 2 TRADING DAYS: IN TONNES: 90.86 TONNES
TOTAL ANNUAL GOLD PRODUCTION, 2017, THROUGHOUT THE WORLD EX CHINA EX RUSSIA: 2200 TONNES
THUS EFP TRANSFERS REPRESENTS 90.86/2200 x 100% TONNES = 4.13% OF GLOBAL ANNUAL PRODUCTION SO FAR IN FEBRUARY ALONE.
ACCUMULATION OF GOLD EFP’S YEAR 2018 TO DATE: 743.17 TONNES
ACCUMULATION OF GOLD EFP’S FOR JANUARY 2018: 653.22 TONNES
Result: A FAIR SIZED DECREASE IN OI AT THE COMEX DESPITE THE GOOD SIZED RISE IN PRICE IN GOLD TRADING YESTERDAY ($8.00). IT IS WITHOUT A DOUBT THAT MANY OF THE DEPARTED COMEX LONGS ARE WAITING TO RECEIVE A PRIVATE EFP CONTRACT FOR EITHER FEBRUARY OR APRIL AND THESE GUYS ARE STILL NEGOTIATING THEIR DEAL. WE HAD ANOTHER GOOD SIZED NUMBER OF COMEX LONG TRANSFERRING TO LONDON THROUGH THE EFP ROUTE: 6579 AS THESE HAVE ALREADY BEEN NEGOTIATED. THERE OBVIOUSLY DOES NOT SEEM TO BE MUCH PHYSICAL GOLD AT THE COMEX AND YET WE ALSO OBSERVED A HUGE DELIVERY MONTH FOR THE MONTH OF DECEMBER. I GUESS IT EXPLAINS THE HUGE ISSUANCE OF EFP’S…THERE IS HARDLY ANY GOLD PRESENT AT THE GOLD COMEX FOR DELIVERY PURPOSES. IF YOU TAKE INTO ACCOUNT THE 6579 EFP CONTRACTS ISSUED, WE HAD A NET GAIN IN OPEN INTEREST OF 95152 contracts ON THE TWO EXCHANGES:
6579 CONTRACTS MOVE TO LONDON AND 1427 CONTRACTS DECREASED AT THE COMEX. (in tonnes, the GAIN in total oi equates to 16.02 TONNES).
we had: 196 notice(s) filed upon for 19600 oz of gold.
xxxxxxxxxxxxxxxxxxxxxxxxxxxxxxxxxxxxxxxxxxxxxxxxxxxxxxxxxxx
With respect to our two criminal funds, the GLD and the SLV:
GLD
No change in gold inventory at the GLD/
Inventory rests tonight: 841.35 tonnes.
SLV/
HUGE CHANGES IN SILVER INVENTORY AT THE SLV/ A WITHDRAWAL OF 982,000 OZ INVENTORY RESTS AT 312.914 MILLION OZ/
end
First, here is an outline of what will be discussed tonight:
1. Today, we had the open interest in silver ROSE BY A HUGE 4770 contracts from 198,036 UP TO 202,806 (AND now A LITTLE FURTHER FROM THE NEW COMEX RECORD SET ON FRIDAY/APRIL 21/2017 AT 234,787) DESPITE THE FALL IN PRICE OF SILVER (7 CENTS WITH RESPECT TO YESTERDAY’S TRADING). OUR BANKERS USED THEIR EMERGENCY PROCEDURE TO ISSUE ANOTHER GOOD 1884 PRIVATE EFP’S FOR MARCH (WE DO NOT GET A LOOK AT THESE CONTRACTS AS IT IS PRIVATE BUT THE CFTC DOES AUDIT THEM) AND 0 EFP’S FOR ALL OTHER MONTHS . EFP’S GIVE OUR COMEX LONGS A FIAT BONUS PLUS A DELIVERABLE PRODUCT OVER IN LONDON. WE HAD MINIMAL COMEX SILVER COMEX LIQUIDATION. IF WE TAKE THE OI GAIN AT THE COMEX OF 4770 CONTRACTS TO THE 1884 OI TRANSFERRED TO LONDON THROUGH EFP’S WE OBTAIN A GAIN OF 6546 OPEN INTEREST CONTRACTS. WE STILL HAVE A GOOD AMOUNT OF SILVER OUNCES THAT ARE STANDING FOR METAL IN JANUARY (SEE BELOW). THE NET GAIN TODAY IN OZ ON THE TWO EXCHANGES: 32.73 MILLION OZ!!!
RESULT: A HUGE SIZED INCREASE IN SILVER OI AT THE COMEX DESPITE THE SMALL SIZED FALL OF 7 CENTS IN PRICE (WITH RESPECT TO YESTERDAY’S TRADING). BUT WE ALSO HAD ANOTHER GOOD 1884 EFP’S ISSUED TRANSFERRING COMEX LONGS OVER TO LONDON. TOGETHER WITH THE GOOD SIZED AMOUNT OF SILVER OUNCES STANDING FOR FEBRUARY, DEMAND FOR PHYSICAL SILVER INTENSIFIES AS WE WITNESS MAJOR BANK SHORT COVERING ACCOMPANIED BY INCREASES IN GOFO AND SIFO RATES INDICATING SCARCITY.
(report Harvey)
.
2.a) The Shanghai and London gold fix report
(Harvey)
2 b) Gold/silver trading overnight Europe, Goldcore
(Mark O’Byrne/zerohedge
and in NY: Bloomberg
3. ASIAN AFFAIRS
i)Late THURSDAY night/FRIDAY morning: Shanghai closed UP 15.10 points or 0.44% /Hang Sang CLOSED DOWN 40.31 or 0.12% / The Nikkei closed DOWN 2111.58 POINTS OR 0.90%/Australia’s all ordinaires CLOSED UP 0.50%/Chinese yuan (ONSHORE) closed UP at 6.2870/Oil UP to 65.76 dollars per barrel for WTI and 69.31 for Brent. Stocks in Europe OPENED RED . ONSHORE YUAN CLOSED DOWN AGAINST THE DOLLAR AT 6.2870. OFFSHORE YUAN CLOSED UP AGAINST THE ONSHORE YUAN AT 6.2922//ONSHORE YUAN MUCH STRONGER AGAINST THE DOLLAR/OFF SHORE MUCH STRONGEER TO THE DOLLAR/. THE DOLLAR (INDEX) IS MUCH STRONGER AGAINST ALL MAJOR CURRENCIES. CHINA IS HAPPY TODAY.(WEAKER CURRENCY BUT STRONG MARKETS )
3a)THAILAND/SOUTH KOREA/NORTH KOREA
i)North Korea
b) REPORT ON JAPAN
The Bank of Japan realized yesterday that they were in trouble as their long 10 yr bond yield hit .10%. They announced another round of QE buying. This time they are buying any bond any time the yield hits .11% on an unlimited basis as well as boosting POMO in a panic response to its surging rates
( zerohedge)
3 c CHINA
i)Chinese stocks tumble especially the Hang Sang. Hong Kong officials are now monitoring a surge in ATM withdrawals a citizens expect a big devaluation
( zerohedge)
( Investing In Chinese Stocks blog)
4. EUROPEAN AFFAIRS
i)Italy
Italian banks are dumping Italian sovereign bond debt by the bucketful. The only buyer: the ECB
( zerohedge)
ii)Germany/Deutsche Bank)
( zerohedge)
5. RUSSIAN AND MIDDLE EASTERN AFFAIRS
( zerohedge)
6 .GLOBAL ISSUES
7. OIL ISSUES
8. EMERGING MARKET
9. PHYSICAL MARKETS
ii)Russian banks accumulated 205 tonnes of gold as official reserves last year
iii)LBMA always promises transparency but it never delivers upon that promise( Ronan Manly/Bullionstar/GATA)
Two commentaries: Chris Powell on Ted Butler/Ted Butler GATA)
v)Almost 1000 miners trapped in an underground mine, Sibanye in South Africa/the rescued
two commentaries
( Business Day/J’berg/GATA)
vi)Bitcoin crashes
( zerohedge)
vii)Bank of America and JPMorgan both bar crypto purchases on credit cards
10. USA stories which will influence the price of gold/silver
iii b)Here is where the jobs went in January: who is hiring and who is not
vi)This is not suppose to happen in a booming economy: core capital goods orders tumble the most in over a year
vii)All USA companies report a slump in January car sales
( zerohedge)
viii)My goodness: NEWSWEEK publisher caught defrauding the Government Agency in an ad revenue scheme
( zerohedge)
The memo is released and everything that we speculated on has proven to be true
I outlined the key points in red.
( zerohedge)
b)New text messages between our love birds discussed evading new security and monitoring issues and legal discovery( zero hedge)
c)Trump blasts the FBI leadership in their roll with respect to the issuing of FISA warrants, illegally spying on USA citizens
( zerohedge)
d)The Obama State department under the stewardship of John Kerry secretly distributed its own
“dossier” leaking it to Sen Cardin, a democrat from Maryland in an attempt to undermine Trump once he assumed the Presidency. This is according to new Freedom of Information documents
( zero hedge)
Let us head over to the comex:
The total gold comex open interest SURPRISINGLY FELL BY A CONSIDERABLE 1427 CONTRACTS DOWN to an OI level 550,608 DESPITE THE GOOD SIZED RISE IN THE PRICE OF GOLD ($8.00 GAIN WITH RESPECT TO YESTERDAY’S TRADING). WE HAD CONSIDERABLE COMEX GOLD LIQUIDATION. HOWEVER THE CME REPORTS THAT THE BANKERS ISSUED ANOTHER STRONG COMEX TRANSFER THROUGH THE EFP ROUTE AS THESE LONGS RECEIVED A DELIVERABLE LONDON FORWARD TOGETHER WITH A FIAT BONUS. WE HAD A GOOD SIZED 6579 EFP’S ISSUED FOR APRIL AND 0 EFP’s FOR ALL OTHER MONTHS: TOTAL 6579 CONTRACTS. THE OBLIGATION STILL RESTS WITH THE BANKERS ON THESE TRANSFERS. ALSO REMEMBER THAT THERE IS NO DOUBT A HUGE DELAY IN THE ISSUANCE OF EFP’S AND IT PROBABLY TAKES AT LEAST 48 HRS AFTER LONGS GIVE UP THEIR COMEX CONTRACTS FOR THEM TO RECEIVE THEIR EFP’S AS THEY ARE NEGOTIATING THIS CONTRACT WITH THE BANKS FOR A FIAT BONUS PLUS THEIR TRANSFER TO A LONDON FORWARD… THE COMEX IS NOW AN ABSOLUTE FRAUD!!
ON A NET BASIS IN OPEN INTEREST WE GAINED TODAY: 5152 OI CONTRACTS IN THAT 6579 LONGS WERE TRANSFERRED AS FORWARDS TO LONDON AND WE LOST 1427 COMEX CONTRACTS.
NET GAIN ON THE TWO EXCHANGES: 5152 contracts OR 515,200 OZ OR 16.02 TONNES,
Result: A STRONG DECREASE IN COMEX OPEN INTEREST DESPITE THE GOOD SIZED GAIN IN YESTERDAY’S GOLD TRADING ($8.00.) WE HAD CONSIDERABLE COMEX GOLD LIQUIDATION. TOTAL OPEN INTEREST GAIN ON THE TWO EXCHANGES: 5152 OI CONTRACTS..
We have now entered the active contract month of FEBRUARY where we lost 737 contracts to 2897 contracts. We had 223 notices filed upon yesterday, so we lost 514 contracts or 51,400 oz will not stand in this active contract month of February AND THESE WERE MORPHED INTO LONDON BASED FORWARDS.
March saw a GAIN of 33 contracts UP to 2078. April saw a LOSS of 1314 contracts DOWN to 397,395.
We had 196 notice(s) filed upon today for 19600 oz
PRELIMINARY VOLUME TODAY ESTIMATED; 280,450
FINAL NUMBERS CONFIRMED FOR YESTERDAY: 395,706
comex gold volumes are RISING AGAIN
Here is a summary of the latest gold trading volumes at the Comex per year
certainly the introduction of EFP’s has certainly had an effect:
Trading Volumes on the COMEX
Meanwhile, gold-trading volumes on the COMEX have never been higher:

end
xxxxxxxxxxxxxxxxxxxxxxxxxxxxxxxxxxxxxxxxxxxxxxxxxxxxxxxxxxxxxxxxxxxx
And now for the wild silver comex results.
Total silver OI ROSE BY A HUGE 4770 CONTRACTS FROM 198,036 UP TO 202,806 DESPITE YESTERDAY’S 7 CENT LOSS. WE WERE ALSO INFORMED THAT WE HAD ANOTHER FAIR SIZED 1884 EMERGENCY EFP’S FOR MARCH ISSUED BY OUR BANKERS (WITH 0 EFP CONTRACTS FOR ALL OTHER MONTHS TO COMEX LONGS WHO RECEIVED A FIAT BONUS PLUS A DELIVERABLE PRODUCT OVER IN LONDON: THE TOTAL EFP’S ISSUED: 1884. THE SILVER BOYS HAVE STARTED TO MIGRATE TO LONDON FROM THE START OF DELIVERY MONTH AND CONTINUING RIGHT THROUGH UNTIL FIRST DAY NOTICE JUST LIKE WE ARE WITNESSING TODAY. USUALLY WE NOTED THAT CONTRACTION IN OI OCCURRED ONLY DURING THE LAST WEEK OF AN UPCOMING ACTIVE DELIVERY MONTH AS WE HAVE JUST SEEN IN GOLD TODAY. THIS PROCESS HAS JUST BEGUN IN EARNEST IN SILVER STARTING IN SEPTEMBER 2017. HOWEVER, IN GOLD, WE HAVE BEEN WITNESSING THIS FOR THE PAST 2 YEARS. NICK LAIRD WAS KIND ENOUGH TO SUPPLY US THE TOTAL FOR 2017 GOLD EFP’S AND IT WAS 6600 TONNES FOR THE ENTIRE YEAR. WE OBVIOUSLY HAD ZERO LONG COMEX SILVER LIQUIDATION AND A HUGE SIZED GAIN IN TOTAL SILVER OI. WE ARE ALSO WITNESSING A FAIR AMOUNT OF SILVER OUNCES STANDING FOR COMEX METAL IN THIS NON ACTIVE JANUARY AS WELL AS THAT CONTINUAL MIGRATION OF EFPS OVER TO LONDON. ON A PERCENTAGE BASIS THERE ARE MORE EFP’S ISSUED FOR GOLD THAN SILVER. ON A NET BASIS WE GAINED 6546 SILVER OPEN INTEREST CONTRACTS:
4770 CONTRACT GAIN AT THE COMEX COMBINING WITH THE ADDITION OF 1884 OI CONTRACTS NAVIGATING OVER TO LONDON.
NET GAIN TWO EXCHANGES: 6546 CONTRACTS
We are now in the poor non active delivery month of FEBRUARY and here the front month lost 8 contracts DOWN TO 3 contracts. We had 8 notices filed upon yesterday so we LOST 0 contracts or NIL ADDITIONAL oz will stand for delivery.
The March contract LOST 40 contracts DOWN to 126,457.
We had 0 notice(s) filed for NIL NIL for the FEBRUARY 2018 contract for silver
INITIAL standings for FEBRUARY
Feb2/2018.
| Gold | Ounces |
| Withdrawals from Dealers Inventory in oz | nil oz |
| Withdrawals from Customer Inventory in oz |
nil oz
|
| Deposits to the Dealer Inventory in oz | nil oz |
| Deposits to the Customer Inventory, in oz |
7523.100
oz Scotia
|
| No of oz served (contracts) today |
196 notice(s)
19600 OZ
|
| No of oz to be served (notices) |
2701 contracts
(270,100 oz)
|
| Total monthly oz gold served (contracts) so far this month |
871 notices
87100 oz
2.709 tonnes
|
| Total accumulative withdrawals of gold from the Dealers inventory this month | NIL oz |
| Total accumulative withdrawal of gold from the Customer inventory this month | xxx oz |
For FEBRUARY:
Today, 0 notice(s) were issued from JPMorgan dealer account and 182 notices were issued from their client or customer account. The total of all issuance by all participants equates to 196 contract(s) of which 153 notices were stopped (received) by j.P. Morgan dealer and 41 notice(s) was (were) stopped/ Received) by j.P.Morgan customer account.
xxxxxxxxxxxxxxxxxxxxxxxxxxxxxxxxxxxxxxxxxxxxxxxxxxxxxxxxxxxxxxxxxxxxxxxxxx
To calculate the INITIAL total number of gold ounces standing for the FEBRUARY. contract month, we take the total number of notices filed so far for the month (871) x 100 oz or 87,100 oz, to which we add the difference between the open interest for the front month of FEB. (2897 contracts) minus the number of notices served upon today (196 x 100 oz per contract) equals 357,200 oz, the number of ounces standing in this active month of FEBRUARY
Thus the INITIAL standings for gold for the FEBRUARY contract month:
No of notices served (871 x 100 oz or ounces + {(2897)OI for the front month minus the number of notices served upon today (196 x 100 oz )which equals 357,200 oz standing in this active delivery month of February (11.110 tonnes). THERE IS 13.463 TONNES OF REGISTERED GOLD AVAILABLE FOR DELIVERY SO FAR.
WE LOST 514 CONTRACTS OR AN ADDITIONAL 51,400 OZ WILL NOT STAND BUT THEY WILL JOIN OTHER LONGS AS THEY HAVE BEEN TRANSFERRED TO A LONDON BASED FORWARD THROUGH THE EFP ROUTE.
xxxxxxxxxxxxxxxxxxxxxxxxxxxxxxxxxxxxxxxxxxxxxxxxxxxxxxxxxxxxxxxxxxxxxxx
XXXXXXXXXXXXXXXXXXXXXXXXXXXXXXXXXXXXXXXXXXXXXXXX
IN THE LAST 17 MONTHS 66 NET TONNES HAS LEFT THE COMEX.
end
And now for silver
AND NOW THE DECEMBER DELIVERY MONTH
FEBRUARY FINAL standings
| Silver | Ounces |
| Withdrawals from Dealers Inventory | nil oz |
| Withdrawals from Customer Inventory |
352,369.800 oz
CNT
|
| Deposits to the Dealer Inventory |
nil
oz
|
| Deposits to the Customer Inventory |
591,161.460 OZ
JPMORGAN
|
| No of oz served today (contracts) |
0
CONTRACT(S)
(NIL OZ)
|
| No of oz to be served (notices) |
3 contracts
(15,000 oz)
|
| Total monthly oz silver served (contracts) | 124 contracts
(620,000 oz) |
| Total accumulative withdrawal of silver from the Dealers inventory this month | NIL oz |
| Total accumulative withdrawal of silver from the Customer inventory this month |
we had no inventory movement at the dealer side of things
total inventory movement dealer: nil oz
we had 1 inventory deposits into the customer account
i) into JPMORGAN: 591,161.460 oz
total inventory deposits: 591,161.460 oz
JPMORGAN CONTINUES TO ADD TO ITS INVENTORY DESPITE BEING THE BIGGEST SHORT AT THE COMEX. ACCORDING TO BUTLER JPMORGAN HAS AMASSED IN 2 YRS: 700 MILLION OZ PHYSICAL SILVER. THIS COULD EASILY BE PROVEN. THIS BEHAVIOUR IS TOTALLY CRIMINAL
we had 1 withdrawals from the customer account;
i) out of CNT: 352,369.800 oz
total withdrawals; 352,369.800 oz
we had 0 adjustment
i
total dealer silver: 43.131 million
total dealer + customer silver: 246.260 million oz
The total number of notices filed today for the FEBRUARY. contract month is represented by 0 contract(s) FOR NIL oz. To calculate the number of silver ounces that will stand for delivery in FEBRUARY., we take the total number of notices filed for the month so far at 124 x 5,000 oz = 640,000 oz to which we add the difference between the open interest for the front month of FEB. (3) and the number of notices served upon today (0 x 5000 oz) equals the number of ounces standing.
.
Thus the INITIAL standings for silver for the FEB contract month: 124(notices served so far)x 5000 oz + OI for front month of FEBRUARY(3) -number of notices served upon today (0)x 5000 oz equals 635,000 oz of silver standing for the FEBRUARY contract month.
WE LOST 0 CONTRACTS OR AN ADDITIONAL NIL OZ WILL STAND AT THE COMEX
xxxxxxxxxxxxxxxxxxxxxxxxxxxxxxxxxxxxxxxxxxxxxxxxxxxxxxxxxxx
ESTIMATED VOLUME FOR TODAY: 87,093
CONFIRMED VOLUME FOR YESTERDAY: 114,604 CONTRACTS
YESTERDAY’S CONFIRMED VOLUME OF 114,604 CONTRACTS EQUATES TO 573 MILLION OZ OR 81.8% OF ANNUAL GLOBAL PRODUCTION OF SILVER
COMMODITY LAW SUGGESTS THAT OPEN INTEREST SHOULD NOT BE MORE THAN 3% OF ANNUAL GLOBAL PRODUCTION. THE CROOKS ARE SUPPLYING MASSIVE PAPER TRYING TO KEEP SILVER IN CHECK.
The record level of silver open interest is 234,787 contracts set on April 21./2017 with the price at that day at $18.42
The previous record was 224,540 contracts with the price at that time of $20.44
end
NPV for Sprott
1. Sprott silver fund (PSLV): NAV RISES TO -2.24% (FEB 1/2018)
2. Sprott gold fund (PHYS): premium to NAV FALLS TO -0.65% to NAV (FEB 1/2018 )
Note: Sprott silver trust back into NEGATIVE territory at -2.24%-/Sprott physical gold trust is back into NEGATIVE/ territory at -0.65%/Central fund of Canada’s is still in jail but being rescued by Sprott.
Sprott WINS hostile 3.1 billion bid to take over Central Fund of Canada
(courtesy Sprott/GATA)
3.SPROTT CEF.A FUND (FORMERLY CENTRAL FUND OF CANADA): NAV FALLS TO -3.49%: NAV 13.77/TRADING 13.30//DISCOUNT 3.49%
END
And now the Gold inventory at the GLD/
Feb 2/no change in gold inventory at the GLD/Inventory rests at 841.35 tonnes
Feb 1/with gold up by $8.00/the crooks decided not to add any new physical gold metal into the GLD./inventory rests at 841.35 tonnes
Jan 31/with gold up $3.15 today, GLD shed another 5.32 tonnes of gold from its inventory/inventory rests at 841.35 tonnes
jan 30/with gold down by $4.85/GLD shed another 1.47 tonnes of gold from its inventory/inventory rests at 846.67 tonnes
JAN 29/with gold down $11.25, the GLD shed 1.18 tonnes of gold/inventory rests at 848.14 tonnes
jan 26/2018/no changes in gold inventory at the GLD/inventory rests at 849.32 tonnes
jan 25/no changes in gold inventory at the GLD/inventory rests at 849.32 tonnes
Jan 24/A HUGE DEPOSIT OF 2.65 TONNES OF GOLD INTO GLD/INVENTORY RESTS AT 849.32 TONNES
Jan 23/NO CHANGE IN GOLD INVENTORY DESPITE GOLD’S RISE/INVENTORY RESTS AT 846.67 TONNES
Jan 22/a huge deposit of 5.71 tonnes of gold despite a drop in price/inventory rests at 846.67 tonnes. In 3 trading days, the GLD has added 17.71 tonnes/the bankers are now in trouble!!
Jan 19/no change in gold inventory at the GLD/Inventory rests at 840.76 tonnes
Jan 18/SHOCKINGLY A HUGE DEPOSIT OF 11.80 TONNES WITH GOLD DOWN ALMOST $12.00/INVENTORY RESTS AT 840.76
Jan 17/no changes in gold inventory at the GLD/inventory rests at 828.96 tonnes
Jan 16/NO CHANGES IN GOLD INVENTORY AT THE GLD/INVENTORY RESTS AT 828.96 TONNES
Jan 12/no changes in inventory at the GLD despite the rise in gold price/inventory rests at 828.96 tonnes
Jan 11/ANOTHER IDENTICAL WITHDRAWAL OF 2.95 TONNES FROM THE GLD INVENTORY/INVENTORY RESTS AT 828.96 TONNES
Jan 10/with gold up today, a strange withdrawal of 2.95 tonnes/inventory rests at 831.91 tonnes
Jan 9/no changes in gold inventory at the GLD/Inventory rests at 834.88 tonnes
Jan 8/with gold falling by a tiny $1.40 and this being after 12 consecutive gains, today they announce another 1.44 tonnes of gold withdrawal from the GLD/
Jan 5/NO CHANGE IN GOLD INVENTORY AT THE GLD/INVENTORY RESTS AT 836.32 TONNES
Jan 4/2018/no change in gold inventory at the GLD/Inventory rests at 836.32 tonnes
Jan 3/a huge withdrawal of 1.18 tonnes of gold from the GLD/Inventory rests at 836.32 tonnes
Jan 2/2018/no changes in gold inventory at the GLD/inventory rests at 837.50 tonnes
Dec 29/NO CHANGES IN GOLD INVENTORY AT THE GLD/INVENTORY RESTS AT 837.50 TONNES
Dec 28/NO CHANGES IN GOLD INVENTORY AT THE GLD/INVENTORY RESTS AT 837.50 TONNES
Dec 27/NO CHANGES IN GOLD INVENTORY AT THE GLD/ INVENTORY RESTS AT 837.50 TONNES
Dec 26/no change in gold inventory at the GLD
Dec 22/ A DEPOSIT OF 1.48 TONNES OF GOLD INTO GLD INVENTORY/INVENTORY RESTS AT 837.50 TONNES
Dec 21′ NO CHANGE IN GOLD INVENTORY AT THE GLD/INVENTORY RESTS AT 836.02 TONNES
xxxxxxxxxxxxxxxxxxxxxxxxxxxxxxxxxx
Feb 2/2018/ Inventory rests tonight at 841.35 tonnes
*IN LAST 318 TRADING DAYS: 99.80 NET TONNES HAVE BEEN REMOVED FROM THE GLD
*LAST 252 TRADING DAYS: A NET 57.51 TONNES HAVE NOW BEEN ADDED INTO GLD INVENTORY.
end
Now the SLV Inventory
Feb 2/we lost 982,000 oz from the SLV inventory /inventory rests at 313.896 million oz/
Feb 1/no change in silver inventory at the SLV/Inventory rests at 313.896 million oz/
Jan 31/ no change in inventory at the slv in total contrast to gold/inventory rests at 313.896 million oz/
Jan 30/no change in inventory/SLV inventory rests at 313.896 million oz/
Jan 29/no change in inventory/SLV inventory rests at 313.896 million oz/
Jan 26.2018/inventory rests at 313.896 million oz
Jan 25/with silver up today and yesterday, the SLV could only muster a gain of 848,000 oz
Inventory rests at 313.896 oz
jan 24/NO CHANGE IN SILVER INVENTORY DESPITE THE GOOD ADVANCE IN PRICE/INVENTORY RESTS AT 313.048 MILLION OZ/
Jan 23/ANOTHER HUGE WITHDRAWAL OF 1.131 MILLION OZ OF SILVER DESPITE THE TINY LOSS/THE CROOKS ARE USING THE INVENTORY TO RAID ON SILVER.
JAN 22.2018/with silver down by 5 cents/ the crooks at the SLV liquidate 1.321 million oz of silver/inventory rests at 314.179 million oz/
Jan 19/ no changes in silver inventory at the SLV/inventory rests at 315.500 million oz/
jan 18/A WITHDRAWAL OF 848,000 OZ OF SILVER FROM THE SLV/INVENTORY RESTS AT 315.500 MILLION OZ/
Jan 17/no changes in silver inventory at the SLV/inventory rests at 316.348 million oz/
Jan 16/NO CHANGES IN SILVER INVENTORY AT THE SLV/INVENTORY RESTS AT 316.348 MILLION OZ
Jan 12/no changes in silver inventory at the SLV/inventory rests at 316.348 million oz/
Jan 11/NO CHANGE IN SILVER INVENTORY AT THE SLV/INVENTORY RESTS AT 316.348 MILLION OZ/
Jan 10/with silver up again, we had a huge withdrawal of 1.227 million oz from the SLV/inventory rests at 316.348 million oz
Jan 9/a withdrawal of 848,000 oz from the SLV/Inventory rests at 317.575 million oz/
jan 8/no change in silver inventory at the SLV/Inventory rests at 318.423 million oz/
Jan 5/DESPITE NO CHANGE IN SILVER PRICING, WE HAD A HUGE WITHDRAWAL OF 2.026 MILLION OZ/INVENTORY RESTS AT 318.423 MILLION OZ.
Jan 4.2018/a slight withdrawal of 180,000 oz and this would be to pay for fees/inventory rests at 320.449 million oz/
Jan 3/NO CHANGE IN SILVER INVENTORY AT THE SLV/INVENTORY RESTS AT 320.629 MILLION OZ.
Jan 2/WITH SILVER UP DRAMATICALLY THESE PAST 4 TRADING DAYS, THE FOLLOWING MAKES NO SENSE: WE HAD A WITHDRAWAL OF 2.83 MILLION OZ FROM THE SLV
INVENTORY RESTS AT 320.629 MILLION OZ/
Dec 29/no changes in silver inventory at the SLV/inventory rests at 323.459 million oz/
Dec 28/DESPITE THE RISE IN SILVER AGAIN BY 13 CENTS, WE LOST ANOTHER 1,251,000 OZ OF SILVER FROM THE SILVER.
Dec 27/WITH SILVER UP AGAIN BY 17 CENTS, WE LOST ANOTHER 802,000 OZ OF SILVER INVENTORY/WHAT CROOKS/INVENTORY RESTS AT 324.780 MILLION OZ/
Dec 26/no change in silver inventory at the SLV./Inventory rests at 325.582
Dec 21/NO CHANGE IN SILVER INVENTORY AT THE SLV/INVENTORY RESTS AT 326.227 MILLION OZ/
.
Feb 2/2017:
Inventory 312.914 million oz
end
6 Month MM GOFO
Indicative gold forward offer rate for a 6 month duration
+ 1.70%
12 Month MM GOFO
+ 2.12%
end
At 3:30 pm we receive the COT report. With new revelations on the use of EFP’s which transfer longs to London, this report is totally useless. But for completeness sake, I am including it in my reporting to you
First/ gold COT
| Gold COT Report – Futures | ||||||
| Large Speculators | Commercial | Total | ||||
| Long | Short | Spreading | Long | Short | Long | Short |
| 298,327 | 91,065 | 57,648 | 154,690 | 379,766 | 510,665 | 528,479 |
| Change from Prior Reporting Period | ||||||
| -7,485 | -63 | -6,875 | -6,768 | -16,244 | -21,128 | -23,182 |
| Traders | ||||||
| 182 | 86 | 73 | 45 | 56 | 262 | 185 |
| Small Speculators | ||||||
| Long | Short | Open Interest | ||||
| 48,667 | 30,853 | 559,332 | ||||
| -1,961 | 93 | -23,089 | ||||
| non reportable positions | Change from the previous reporting period | |||||
| COT Gold Report – Positions as of | Tuesday, January 30, 2018 | |||||
OUR LARGE SPECULATORS
those large speculators that have been long in gold pitched a very large 7485 contracts from their long side and no doubt many are on their way to London
those large specs who have been short in gold covered a very tiny 63 contracts from their short side
OUR COMMERCIALS
those commercials who have been long in gold pitched a huge 6768 contracts from their long side
those commercials who have been short in gold covered a huge 16,244 contracts. (at the comex their obligation ends but in London on EFP transfers it begins.
commercials go net long by 9476 contracts
OUR SMALL SPECULATORS
those small specs who have been long in gold pitched 1961 contracts from their long side and these guys also morphed into London forwards.
those small specs who have been short in gold added 93 contracts to their short side.
| Silver COT Report: Futures | |||||
| Large Speculators | Commercial | ||||
| Long | Short | Spreading | Long | Short | |
| 72,145 | 39,723 | 30,601 | 68,278 | 115,569 | |
| -4,048 | -7,389 | 5,985 | -3,808 | 1,986 | |
| Traders | |||||
| 103 | 52 | 44 | 42 | 40 | |
| Small Speculators | Open Interest | Total | |||
| Long | Short | 198,358 | Long | Short | |
| 27,334 | 12,465 | 171,024 | 185,893 | ||
| 244 | -2,209 | -1,627 | -1,871 | 582 | |
| non reportable positions | Positions as of: | 163 | 121 | ||
| Tuesday, January 30, 2018 | © SilverSeek.c | ||||
OUR LARGE SPECULATORS
those large speculators who have been long in silver pitched a huge 4048 contracts from their long side these figures are net. Many longs in silver morphed into EFP contracts acquiring London based forwards.
those large speculators who are short in silver covered a huge 7389 contracts from their short side
OUR COMMERCIALS
those commercials who have been long in silver pitched 3803 contracts from their long side and maybe they were morphed into London based forwards.
those commercials who have been short in silver added a net 1986 contracts to their short side
OUR SMALL SPECULATORS
those small specs who have been long in silver added a tiny 286 contracts to their long side
those small specs who have been short in silver covered a huge 2347 contracts from their short side.
end.
Major gold/silver trading /commentaries for FRIDAY
GOLDCORE/BLOG/MARK O’BYRNE.
GOLD/SILVER
U.S. Debt Is “Extraordinarily High” and Are Stock And Bond Bubbles – Greenspan
– “We have a stock market bubble” warns Greenspan
– “Bond bubble will be the big issue” he tells Bloomberg TV (see video)
– “Fiscally unstable long-term outlook in which inflation will take hold”
– “Ratio of federal debt to GDP which is extraordinarily high” (see chart)
– Higher interest rates, inflation and stagflation coming
– Gold is the “ultimate insurance policy” – Greenspan
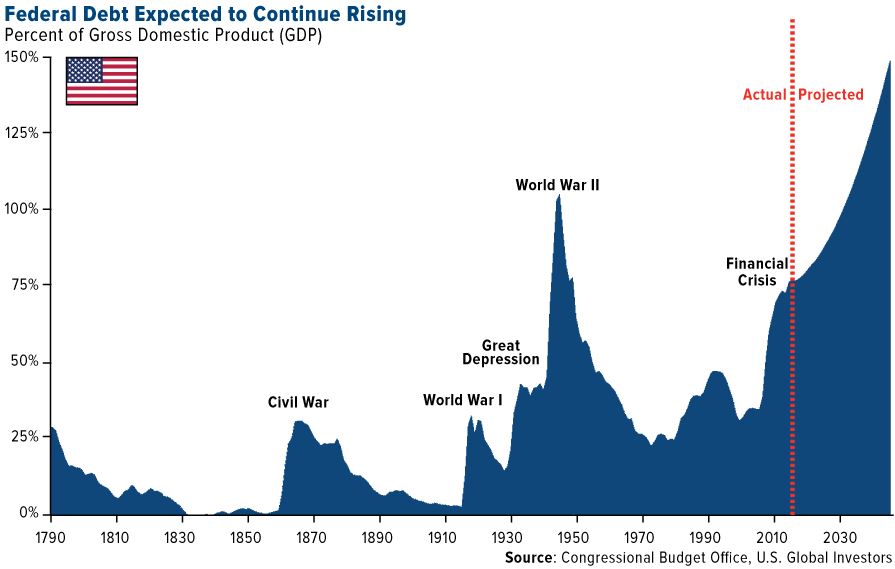
Source: US Funds
The man who made the term “irrational exuberance” famous says investors are at it again.
“There are two bubbles: We have a stock market bubble, and we have a bond market bubble,” Alan Greenspan, 91, said Wednesday on Bloomberg Television with Tom Keene and Scarlet Fu. Greenspan, who led the Federal Reserve from 1987 until 2006, memorably used the phrase to describe asset values during the 1990’s dot-com bubble.
Greenspan’s comments come as stock indexes remain near record highs, despite selling off in recent days, and as the yields on government notes and bonds hover not far from historic lows. Interest rates are expected to move up in coming years as the Fed continues with a campaign to gradually tighten monetary policy.
“At the end of the day, the bond market bubble will eventually be the critical issue, but for the short term it’s not too bad,” Greenspan said. “But we’re working, obviously, toward a major increase in long-term interest rates, and that has a very important impact, as you know, on the whole structure of the economy.”

The Fed on Wednesday opted to leave rates unchanged and markets are pricing in an increase at the central bank’s March meeting.
Greenspan sounded an alarm on forecasts that the U.S. government deficit will continue to climb as a share of gross domestic product. He said he was “surprised” that President Donald Trump didn’t specify how he would fund new government initiatives in Tuesday’s State of the Union speech. The president last month signed into law about $1.5 trillion in tax cuts that critics say will further balloon the budget gap.

U.S. Raises Longer-Term Debt Sales as Budget Deficit Worsens
Greenspan blamed the growing fiscal shortfall for his bond call.
“What’s behind the bubble? Well the fact, that, essentially, we’re beginning to run an ever-larger government deficit,” Greenspan said. As a share of GDP, “debt has been rising very significantly” and “we’re just not paying enough attention to that.”
End
Editors Note
Greenspan laughed when asked “what is behind the bubble” and explained that the deteriorating U.S. budget deficits are not sustainable and his comments in this regard are important to note:
“Essentially, we are beginning to run ever larger government deficits. Remember, that we are talking about deficits going to a trillion dollars.
But, debt has been rising very significantly and we are in fact – if you want to take the Congressional budget office figures at face value – we are going to run through the peaks of where we were during World War II on the ratio of federal debt to GDP which is extraordinarily high.
I think that we are not paying enough attention to that.”
As we noted in our recent podcasts, the total debt position of the U.S. is completely unsustainable and Trump’s irresponsible fiscal policies may speed up the slow bankruptcy of the U.S.
Last February, Greenspan said that gold is the “ultimate insurance policy” and “the primary global currency.”
He warned that “the eurozone isn’t working” and has “grave concerns about the euro.”
“Investment in gold now is insurance…”
Related reading
Greenspan Says Gold “Ultimate Insurance Policy” as has “Grave Concerns About Euro”
Greenspan Warns Stagflation Like 1970s “Not Good For Asset Prices”
News and Commentary
Gold likely to trade in an average of $1,410 by Q4 2018 (ScrapRegister.com)
Asia Stocks Slide; Rising Yields Spur BOJ to Act (Bloomberg.com)
Tech Selloff Accelerates as Treasury Rout Deepens (Bloomberg.com)
Chinese gold demand returns to growth as appetite for jewellery soars (SCMP.com)
China’s Gold Buying Rises 9.41% in 2017 (Xinhuanet.com)
Perth Mint’s Jan gold sales surges 38 pct m/m, silver jumps 22 pct (Reuters.com)
Source: SoundingLine
Gold Price To Rise Nearly 5% in 2018 – LBMA Forecast (LMBA.org)
Russian banks increase gold purchases at record pace (RT.com)
These are 5 finance terms you might be using incorrectly (StansBerryChurcHouse.com)
Bitcoin Is Just the Latest in the Trend Toward Decentralization (GoldSeek.com)
This Isn’t a Drill Mortgage Rates Hit Highest Level Since May 2014 (TheMaven.net)
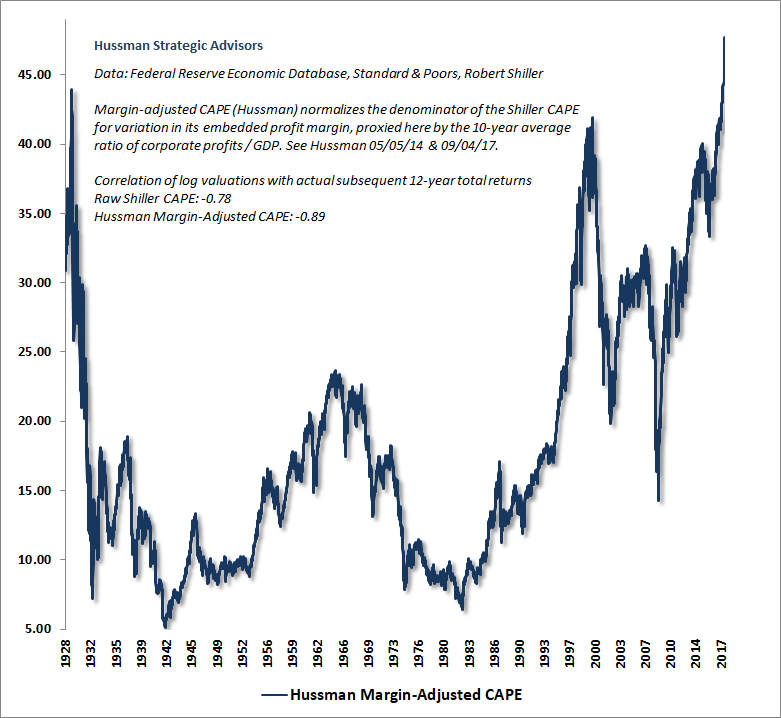
Crash ‘Risk’ Is Soaring: “This Is Where They Lost Their Minds” Hussman (ZeroHedge.com)
Gold Prices (LBMA AM)
02 Feb: USD 1,345.00, GBP 946.48 & EUR 1,077.61 per ounce
01 Feb: USD 1,341.10, GBP 941.99 & EUR 1,077.98 per ounce
31 Jan: USD 1,343.35, GBP 950.29 & EUR 1,078.98 per ounce
30 Jan: USD 1,345.70, GBP 954.37 & EUR 1,083.56 per ounce
29 Jan: USD 1,348.40, GBP 955.07 & EUR 1,085.46 per ounce
26 Jan: USD 1,354.35, GBP 950.21 & EUR 1,087.41 per ounce
25 Jan: USD 1,360.25, GBP 954.35 & EUR 1,095.27 per ounce
Silver Prices (LBMA)
02 Feb: USD 17.14, GBP 12.05 & EUR 13.72 per ounce
01 Feb: USD 17.19, GBP 12.09 & EUR 13.82 per ounce
31 Jan: USD 17.23, GBP 12.17 & EUR 13.84 per ounce
30 Jan: USD 17.30, GBP 12.24 & EUR 13.91 per ounce
29 Jan: USD 17.34, GBP 12.33 & EUR 13.99 per ounce
26 Jan: USD 17.40, GBP 12.21 & EUR 13.99 per ounce
25 Jan: USD 17.52, GBP 12.29 & EUR 14.12 per ounce
Gold & Silver Hammered As BLS Jobs Report Hits Tape
Nearly $2,000,000,000 of gold “sold” in two minutes, and silver hammered under $17. Here’s an update…
Today is one of the cartel’s favorite days to smash.
Gold & silver were hit hard as soon as the jobs report hit the tape:

In the first two minutes, 14,000 gold contracts were “sold” into the “news”.
For anybody doing the math, that’s $1,890,000,000 notional value of gold sold in two minutes, and it created less than a $10 move in the price of gold.
Silver was hit too as you can see. Right now, they have even managed to get silver under $17.
As to no surprise, the dollar shot straight up like a rocket ship.
Russian banks increase gold purchases at record pace
Submitted by cpowell on Thu, 2018-02-01 20:51. Section: Daily Dispatches
From Russia Today, Moscow
Thursday, February 1, 2018
The Russian government has purchased two-thirds of all the gold mined in country, buying it from local banks to add to reserves as the Kremlin sees the precious metal as a safe haven at a time of geopolitical turbulence.
“For banks this is good business. They credit mining companies, which return the loan with the gold they extracted. Then banks sell it to the central bank,” according to the Russian Finance Ministry, quoted by the Prime news agency.
Russia is the largest gold buyer in the world, and purchases by Russian banks have increased substantially in recent years.
Last year Russian banks bought 205.155 tons of gold, which is 4.7 percent more than in 2016 (195.89 tons), and approximately 67 percent of all gold produced in Russia. This is also a 13 percent increase compared to 2013.
The biggest buyers are VTB24, Sberbank, and Gazprombank. All three banks have registered at the Shanghai precious metals exchange. In April VTB announced plans to sell up to 100 tons of gold to China annually. …
… For the remainder of the report:
https://www.rt.com/business/417592-russian-banks-gold-purchases
END
LBMA always promises transparency but it never delivers upon that promise
(courtesy Ronan Manly/Bullionstar/GATA)
Ronan Manly: LBMA promises transparency but never delivers
Submitted by cpowell on Thu, 2018-02-01 21:21. Section: Daily Dispatches
4:23p ET Thursday, February 1, 2018
Dear Friend of GATA and Gold:
Gold researcher Ronan Manly today examines the years-long racket of the London Bullion Market Association’s promising greater transparency in the gold market while always failing to deliver. Manly’s analysis is headlined “What’s Happening (or Not) at the LBMA: Some Updates” and it’s posted at Bullion Star here:
https://www.bullionstar.com/blogs/ronan-manly/whats-happening-not-lbma-u…
CHRIS POWELL, Secretary/Treasurer
Gold Anti-Trust Action Committee Inc.
CPowell@GATA.org
END
Ted Butler has been banging the table, screaming at the CFTC as they allow JPMorgan to acquire huge amounts of silver and now gold. JPMorgan is now up to 700 million oz of silver and they still are the largest silver short on the planet.
Two commentaries: Chris Powell on Ted Butler/Ted Butler GATA)
Ted Butler: CFTC’s long silver investigation missed what the agency just fined
Submitted by cpowell on Thu, 2018-02-01 21:47. Section: Daily Dispatches
4:48p ET Thursday, February 1, 2018
Dear Friend of GATA and Gold:
Rather than congratulate the U.S. Commodity Futures Trading Commission for taking note last week of the manipulation of the monetary metals futures markets, silver market rigging whistleblower Ted Butler today notes acerbically that the violations just cited by the commission took place during its interminable investigation of the silver market, which found … nothing at all!
Now, Butler writes, what about JPMorganChase’s domination of the silver market? Will the CFTC examine that?
Butler’s commentary is headlined “Unfinished Business” and it’s posted at GoldSeek’s companion site, SilverSeek, here —
http://silverseek.com/commentary/unfinished-business-17082
— and at 24hGold here:
http://www.24hgold.com/english/news-gold-silver-unfinished-business.aspx…
CHRIS POWELL, Secretary/Treasurer
Gold Anti-Trust Action Committee Inc.
CPowell@GATA.org
Unfinished Business
|
February 1, 2018 – 11:23am
The big news this week was the filing of charges and settlements for price manipulation and “spoofing” brought by the CFTC, in conjunction with the DOJ and FBI, against three banks and a half dozen individual traders; mostly involving illegal trading activities in COMEX gold and silver futures. The announcement set off a debate about whether the filing proved the allegations that gold and silver prices were manipulated as many, certainly including me, have maintained.
http://www.cftc.gov/PressRoom/PressReleases/pr7682-18
Put simply, the filings do not prove that silver and gold have been manipulated lower in price over the years. But then again, neither do the filings show that prices have not been manipulated in the manner I contend. What the charges do prove is that spoofing is a corrupt and illegal practice that should not exist in any form and on that basis. My immediate reaction is what the heck took the CFTC this long to act? Regular readers know I have railed against spoofing for many years as being completely devoid of any redeeming or legitimate features while the CFTC stood by. The practice of placing phony orders to influence price should have been outlawed from day one.
That said, I suppose it is good that the agency finally took action, under the kindest interpretation of the cliché of it’s better late than never. Certainly, those banks and traders accused of the practice will likely not do so in the future. And seeing the CFTC actually use the word manipulation in connection with COMEX gold and silver can’t be considered bad. Beyond that, unfortunately, the charges and settlements are troubling in that they only scratch the surface of whether silver and gold prices are manipulated.
Truth be told, if the regulators were out to clean up what ails silver and gold pricing, then they didn’t come close with these filings. If the CFTC was intending that this week’s announcements showed that it was truly cracking down on bad actors in silver and gold, then it failed. I would remind you that many of the violations announced took place while the CFTC was in the midst of its infamous five year silver “investigation”.
Think I’m being too hard on the CFTC? Then try explaining how the agency has managed to ignore the activities of the most prominent gold and silver market crook of all – JPMorgan. It’s not as if the agency hasn’t been given ample evidence of JPMorgan’s dominant role in manipulating prices ever since the bank took over Bear Stearns in 2008. I know because I’ve done nothing but make the case against JPMorgan for nearly all that time.
And I must say, I am disappointed in the actions, or lack thereof, of the Enforcement Director, James McDonald. Privately, I’m still assured that McDonald is a straight arrow, although lately the question has come up whether what JPMorgan is doing is really illegal if higher ups in the government pecking order have ordered McDonald to keep off JPM’s case. To that I say balderdash – in matters silver and gold, JPMorgan is a stone cold crook and no order from above supersedes McDonald’s oath to uphold the Constitution and the law of the land. It’s disturbing that the agency seems to be going after the little fish, while the biggest market crook of them all, JPMorgan, gets a pass.
It’s not as if I haven’t gone out of my way to present the case against JPMorgan to McDonald, starting on his first day on the job last April 10. I spelled out in great detail how JPMorgan had never taken a loss on any short position it ever added in COMEX silver in nearly 10 years; a trading record that would be impossible if JPMorgan wasn’t rigging prices. And get this – since I wrote to McDonald last year, JPMorgan has added and bought back silver shorts on four separate occasions for more than 10,000 net contracts on each occasions, making close to $500 million in total trading profits. As a reminder, I base all my calculations on the data published by the agency.
http://silverseek.com/commentary/another-opportunity-16489
In that public letter last year, I even spelled out the rationale for why JPMorgan was manipulating silver (and gold) prices, namely, to allow this crooked bank in acquiring as much physical metal as it could get at the lowest prices it could rig. This is the means, motive, opportunity and intent behind JPMorgan’s manipulation – to pick up as much cheap metal as it possibly could. In the last 10 months, in addition to racking up massive profits in paper COMEX trading, JPMorgan has added another 100 million oz of silver to a hoard now measuring nearly 700 million oz. And as I have written recently, JPMorgan has been doing the exact same thing in gold, namely, making enormous paper profits by being the largest short in COMEX gold, while picking up boatloads of physical gold on the cheap – at least 20 million oz over the past 5 years.
You can lead a horse to water but you can’t force it to drink. I can lay out the crimes of JPMorgan, using the agency’s data and taking the risk of publicly accusing the nation’s largest bank of criminality, but I can’t force to the CFTC to do its job. After all, the easiest way to dismiss these very serious allegations would be to openly address them. To be fair, should the CFTC ever get around to cracking down on the crooks at JPMorgan, I will happily eat my words and sing the regulators’ praises.
Ted Butler
February 1, 2018
Questions or comments? info@butlerresearch.com
END
Almost 1000 miners trapped in an underground mine, Sibanye in South Africa
(courtesy Business Day/J’berg/GATA)
Nearly a thousand gold miners trapped underground in South Africa
Submitted by cpowell on Thu, 2018-02-01 22:08. Section: Daily Dispatches
Central banks and bullion banks are working hard to keep them trapped.
* * *
By Allan Seccombe
Business Day, Johannesburg
Thursday, February 1, 2018
About 950 workers are trapped underground at Sibanye-Stillwater’s Beatrix gold mine in the Free State, after an overnight power failure cause by a lightning strike.
Rescue efforts are under way, the Association of Mineworkers and Construction Union (AMCU) said this afternoon.
At least 40 workers had been brought back to the surface at the gold mine, with 950 miners still below ground at 3 Shaft at Beatrix, the union said.
Sibanye said a power pylon had been knocked over during a storm Wednesday night, cutting power to 4 Shaft and the main Beatrix operations of 2 and 3 Shafts. Power had since been restored to 4 Shaft and people hauled to surface.
Power was restored to 2 Shaft and workers were hoisted to the surface there today.
Sibanye wanted 950 workers at 3 Shaft to wait there until the winder serving the shaft was back in working order, rather than have hundreds of people walking for four hours to 2 Shaft, company spokesperson James Wellsted said.
No one had been injured, he said, and the company was supplying food and water to the workers trapped underground at 3 Shaft by deploying a capsule down the shaft, he said. The professional rescue team was with the trapped miners, he said.
There was no immediate timeline of when the workers would be returned to surface, he said. …
… For the remainder of the report:
https://www.businesslive.co.za/bd/companies/mining/2018-02-01-at-least-9…
* * *
END
All miners rescued
News 24 J’Berg/GATA)
All trapped gold miners in S. Africa rescued unhurt
Submitted by cpowell on Fri, 2018-02-02 12:11. Section: Daily Dispatches
By Jeanette Chabalala
News24, Johannesburg
Friday, February 2, 2018
WELKOM, South Africa — The National Union of Mineworkers confirmed today that all 955 Sibanye Gold mine workers who were trapped underground have been resurfaced.
“The mine workers were rescued at around 6:30 this morning,” the union’s national spokesperson, Livhuwani Mammburu, confirmed to News24.
“They are currently getting medical checkups. No injuries were sustained. They are just exhausted.”
A meeting was set to be held later at the mine’s training centre with management after all the workers had been attended to medically.
Sibanye Gold spokesperson James Wellsted also confirmed that the miners had been brought to the surface and that there were no serious injuries. …
… For the remainder of the report:
https://www.news24.com/SouthAfrica/News/rescued-sibanye-gold-miners-rece…
Bitcoin crashes
(courtesy zerohedge)
Bitcoin Bounces Hard But Cryptocarnage Remains
Update 0815ET: Just as we saw at yesterday’s US stock market close, dip-buyers just stepped in to Bitcoin in a significant way, lifting the crypto currency over $1000 off the lows and back above $8000…

But the carnage remains… for now…

Notably, another exchange – BitMEX is down…

* * *
It seemed like just yesterday that every cryptocurrency bloodbath would be promptly bought, often sending the price of bitcoin and its peers to new record highs. Those days appear to be over, at least for now.
So far this year, cryptocurrencies have been beset with bad news: Bitfinex, by some accounts the world’s largest exchange, was recently subpoenaed by the CFTC, along with Tether, a separate corporate entity that involves many of the same people from Bitfinex, as questions mount about the authenticity of its tether token. Tethers, which are widely used by crypto traders to quickly move in and out of different crypto pairs, are supposed to be backed by dollars, with one tether = one dollar. But Tether’s decision to fire its auditor appears to validate the concerns of the exchange’s critics.
Raising fears about another massive, Mt. Gox-like hack, Coincheck, a mid-sized Japanese exchange, reported this month that it suffered “the biggest crypto theft in its history” when hackers made off with $400 million worth of NEM tokens. On Friday, Bloomberg reported that Japan’s Financial Services Agency raided Coincheck’s offices a week after the hack, hauling out documents and computers as evidence.
The inspection was conducted to ensure security for users, Finance Minister Taro Aso said. On Friday morning, 10 FSA officials entered Coincheck’s premises to gain a better understanding of how the exchange is operating in light of the regulator’s business improvement order imposed earlier this week, an agency official told reporters in Tokyo. The exchange has until Feb. 13 to produce a report detailing the causes of the incident.
And as if the threat of cybertheft wasn’t enough to scare off the marginal buyer, the threat of regulators trying to ban crypto – much like China did – has become a major concern. Regulators in India said explicitly declared yesterday that bitcoin is not legal tender and said it would take “all measures to eliminate their use,”foreshadowing a coming crackdown in a market that many hoped would one day grow to one of bitcoin’s largest. After a weekslong will-they-won’t-they back and forth, South Korea‘s Ministry of Justice announced revealed that it had abandoned a proposal to ban crypto outright, but instead seek to regulate it, requiring exchanges to obtain details about customer identities.
After bitcoin’s worst month in years, it dipped below $8,000 Friday morning in the US to levels it hasn’t seen since November while Ethereum, Ripple and Litecoin all took double-digit beatings.

Meanwhile, as Bloomberg points out, bitcoin’s rough month was even worse in South Korea. As of Friday morning ET, bitcoin has dropped more than 60% from its January high in Korea as South Korea struggles with how to prevent money laundering and tax evasion without throttling the ecosystem.
The selloff has many Korea traders fearing the worst.
“The bubble in cryptocurrencies has burst” in Korea, said Yeol-mae Kim, an analyst at Eugene Investment & Securities Co. in Seoul. Because of the intense demand from retail buyers, bitcoin trades at what’s called “the kimchi premium” on SK exchanges. In January, the premium stretched to its widest level on record when bitcoin traded at $22,525 in Korea, $7,500 higher than the composite price at the time.

Bank Of America, JP Morgan Bar Crypto Purchases On Credit Card
The latest crackdown against cryptos was unveiled on Thursday when the largest US bitcoin exchange, Coinbase, sent out notices to clients, informing them that purchasing cryptocurrencies on credit would now be prohibitively expensive, if not impossible, as banks have started to process payments for bitcoin et al as “cash advances”, which tend to come with extremely high interest rates:
Dear Coinbase Customer
We’re writing because you have a credit card on file and want to inform you of a recent change that may increase the cost of purchasing digital currency with a credit card.
Recently, the MCC code for digital currency purchases was changed by a number of the major credit card networks. The new code will allow banks and card issuers to charge additional “cash advance” fees. These fees are not charged or collected by Coinbase. These additional fees will show up as a separate line item on your card statement.
The move came as a number of bank and card issuers announced that they would be reviewing changes to their policies around the purchases of crypto assets using credit cards.
Then, last Thursday the Wall Street Journal reported that Capital One banned customers from using credit cards to purchase bitcoin or coins on the Ethereum blockchain, citing “limiting mainstream acceptance and the elevated risks of fraud, loss and volatility.” Discover Financial announced it would likewise block bitcoin transactions.
Then yesterday, MarketWatch reported that Bank of America and other major lenders are assessing the use of credit cards to purchase bitcoin and other virtual currencies, which could result in restrictions or limits.
Today that was confirmed when Bank of America became the largest U.S. lender yet to bar customers from using their credit cards to buy cryptocurrencies.
According to an internal memo to employees obtained by Bloomberg, the second largest US bank said it “will begin declining credit card transactions with known cryptocurrency exchanges” starting today. It said the policy will apply to all personal and business credit cards issued by the bank.
Betty Riess, a spokeswoman for the Charlotte, North Carolina-based bank, confirmed the bank will no longer allow the transactions.
And then, moments later, JPM joined the fray too:
- JPMORGAN TO HALT CRYPTO PURCHASES ON SATURDAY, SPOKESWOMAN SAYS
As a reminder, a recent LendEdu survey revealed that just over 18% of bitcoin purchases were made using a credit card.

The good news: 82% of all crypto purhcases were not made using a credit card.
Your early FRIDAY morning currency, Asian stock market results, important USA/Asian currency crosses, gold/silver pricing overnight along with the price of oil Major stories overnight/9 AM EST
i) Chinese yuan vs USA dollar/CLOSED UP AT 6.2844 /shanghai bourse CLOSED UP AT 15.10 POINTS 0.44% / HANG SANG CLOSED DOWN 40.31 POINTS OR 0.12%
2. Nikkei closed DOWN 211.58 POINTS OR 0.90% /USA: YEN RISES TO 109.88
3. Europe stocks OPENED RED /USA dollar index RISES TO 88.85/Euro FALLS TO 1.2490
3b Japan 10 year bond yield: RISES TO . +.085/ (CENTRAL BANK INTERVENTION THIS MORNING) GOVERNMENT INTERVENTION !!!!(Japan buying 100% of bond issuance)/Japanese yen vs usa cross now at 109.88/ THIS IS TROUBLESOME AS BANK OF JAPAN IS RUNNING OUT OF BONDS TO BUY./JAPAN 10 YR YIELD FINALLY IN THE POSITIVE/BANK OF JAPAN LOSING CONTROL OF THEIR YIELD CURVE AS THEY PURCHASE ALL BONDS TO GET TO ZERO RATE!!
3c Nikkei now JUST BELOW 17,000
3d USA/Yen rate now well below the important 120 barrier this morning
3e WTI:: 65.76 and Brent: 69.31
3f Gold UP/Yen DOWN
3g Japan is to buy the equivalent of 108 billion uSA dollars worth of bond per month or $1.3 trillion. Japan’s GDP equals 5 trillion usa./“HELICOPTER MONEY” OFF THE TABLE FOR NOW /REVERSE OPERATION TWIST ON THE BONDS: PURCHASE OF LONG BONDS AND SELLING THE SHORT END
Japan to buy 100% of all new Japanese debt and by 2018 they will have 25% of all Japanese debt. Fifty percent of Japanese budget financed with debt.
3h Oil UP for WTI and UP FOR Brent this morning
3i European bond buying continues to push yields lower on all fronts in the EMU. German 10yr bund RISES TO +.734%/Italian 10 yr bond yield DOWN to 2.002`% /SPAIN 10 YR BOND YIELD UP TO 1.433%
3j Greek 10 year bond yield FALLS TO : 3.668?????????????????
3k Gold at $1346.30 silver at:17.18: 7 am est) SILVER NEXT RESISTANCE LEVEL AT $18.50
3l USA vs Russian rouble; (Russian rouble DOWN 35/100 in roubles/dollar) 56.31
3m oil into the 65 dollar handle for WTI and 69 handle for Brent/
3n Higher foreign deposits out of China sees huge risk of outflows and a currency depreciation. This can spell financial disaster for the rest of the world/
JAPAN ON JAN 29.2016 INITIATES NIRP. THIS MORNING THEY SIGNAL THEY MAY END NIRP. TODAY THE USA/YEN TRADES TO 109.88 DESTROYING JAPANESE CITIZENS WITH HIGHER FOOD INFLATION
30 SNB (Swiss National Bank) still intervening again in the markets driving down the SF. It is not working: USA/SF this morning 0.9245 as the Swiss Franc is still rising against most currencies. Euro vs SF is 1.1597 well above the floor set by the Swiss Finance Minister. Thomas Jordan, chief of the Swiss National Bank continues to purchase euros trying to lower value of the Swiss Franc.
3p BRITAIN VOTES AFFIRMATIVE BREXIT/LOWER PARLIAMENT APPROVES BREXIT COMMENCEMENT/ARTICLE 50 COMMENCES MARCH 29/2017
3r the 10 Year German bund now POSITIVE territory with the 10 year RISING to +0.734%
The bank withdrawals were causing massive hardship to the Greek bank. the Greek referendum voted overwhelming “NO”. Next step for Greece will be the recapitalization of the banks and that will be difficult.
4. USA 10 year treasury bond at 2.7844% early this morning (THIS IS DEADLY TO ALL MARKETS). Thirty year rate at 3.032% /
5. Details Ransquawk, Bloomberg, Deutsche bank/Jim Reid.
(courtesy Jim Reid/Bloomberg/Deutsche bank/zero hedge)
“Sea Of Red”: Stocks, Futures Plunge Amid Soaring Yields
The last day of an already tumultuous week is shaping up as a bloodbath for investors across the globe as the following market snapshot of global stocks and futures shows.

European equity markets and U.S. equity futures sold off sharply, however as Bloomberg notes, the traditional pre-NFP lack of market activity has so far mitigated large cross-asset reaction. S&P futures were down as much as 20 points and flirting with the 2,800 level.

Equities were tested by the surge in bond yields, with some fund managers saying anything between 2.7% and 3% on the 10Y TSY would signal a bond bear market. The level is seen by many stock-watchers as a potential trigger for a correction in equities.
To be sure, the correlation between higher yields and lower equities continued overnight in a particularly aggressive manner. The silver lining is that as the US 10y tests 2.80% and the US 30y at 3.04%, the USD at least appears to have found a bottom, for now. Overnight German Bund yields also reached a two-year high as core European bonds fell along with gilts.

As we pointed out last night, the risk off sentiment took shape in Asia, with Chinese stocks continuing their recent plunge…

… as core yields weighed on the EM FX space as a whole. “Markets are increasingly choppy and price action increasingly unpredictable” Citi’s FX desk notes.
There was nothing obvious to trigger the move: some attributed the risk off mode to a report that 18 people were injured when a van intentionally hit pedestrians in central Shanghai, China. Additionally, WSJ reports, “Chinese stocks had their worst week since 2016, with fresh concerns about Beijing’s campaign to cut financial risk and predictions of a slowing economy…” The BoJ also knocked JPY back after it took action against the rising JGB 10y yield by announcing it would buy unlimited amounts of 10y JGBs at 11bps.
Meanwhile, Europe was a bloodbath largely due to to the previously discussed poor result from Deutsche Bank which sent the German lender’s stock tumbling. The weakness quickly spread to German stocks with the DAX turning negative for 2018, giving up an advance that had reached 5%, as the DAX slides for a fifth straight day. This was the worst weekly drop for the DAX since November 2016, down 3.5%

The DAX weakness sent the broader Eurostoxx Index dropped for a 5th day, the longest losing streak since November, and sliding below its 200-DMA.
In FX, the USD/JPY rallied further toward 110 after BOJ acted to control the yield curve by placing a cap on yields as it offered to buy an unlimited amount in 10yr JGBs at a yield of 0.110%. The BoJ also announced to buy JPY 450bln in 5yr-10yr, more than the prior JPY 410bln operation.
The Bloomberg Dollar Spot Index snapped a three-day decline and headed for its biggest gain since November as stretched short positioning called for caution ahead of the U.S. payrolls report. The yen was set for its worst week in 3 1/2 months as the BOJ further damped speculation about normalizing its policy anytime soon. Monetary policy prospects weighed on Antipodean currencies as well, while the euro and the pound also came under pressure. European bonds and equities traded in the red. USD strength was particularly evident against EMFX, with USD/ZAR trading back above 12.00.
Elsewhere, core yields edge higher but without much momentum, while credit spreads widen, iTraxx Crossover through 200-DMA. As Bloomberg highlights, a hawkish Euribor put trade targeting ~80bps of ECB hikes by end-2019 caught attention; crude and metals weighed by USD move, another bitcoin selloff of more than 10%.
Looking at today’s busy calendar, the highlight will obviously be the employment report. Average hourly earnings have taken over from the headline number as the key focus of the report at the moment. And while economists are strongly of the view that wages are going up this will not be seen in today’s report, where monthly income growth is expected to tick down a tenth (+0.2% vs. +0.3%) but the year-over-year trend may round up a tenth to 2.6%. For the headline number consensus expects a gain in payrolls (+180k vs. +148k) which should keep the unemployment rate steady at 4.1%. So far this week the employment and wages data has generally been positive. The latest evidence was 4Q unit labour costs yesterday which were above market at 2% (vs. 0.9% expected).
Elsewhere, oil traded near its highest level since 2015 in New York as forecasters paint a rosier picture for supply and demand. WTI and Brent crude futures have modestly extended on the prior day’s gains, albeit off best levels with WTI back below USD 66/bbl and Brent retreating from USD 70/bbl with energy newsflow otherwise relatively light ahead of the Baker Hughes rig count and earnings from Exxon and Chevron (keep an eye out for CAPEX plans). In metals markets, Gold has traded relatively sideways ahead of NFP, whilst Chinese steel futures were seen higher overnight amid ongoing speculation over further extensions to domestic steel production curbs.
Finally, Bitcoin continues to slide after a miserable January, dropping below $8,000 in early trading.
Market Snapshot
- S&P 500 futures down 0.7% to 2,803.75
- STOXX Europe 600 down 0.8% to 390.55
- MSCI Asia Pacific down 0.7% to 183.03
- MSCI Asia Pacific ex Japan down 0.7% to 599.58
- Nikkei down 0.9% to 23,274.53
- Topix down 0.3% to 1,864.20
- Hang Seng Index down 0.1% to 32,601.78
- Shanghai Composite up 0.4% to 3,462.08
- Sensex down 2.3% to 35,099.20
- Australia S&P/ASX 200 up 0.5% to 6,121.39
- Kospi down 1.7% to 2,525.39
- German 10Y yield rose 2.0 bps to 0.741%
- Euro down 0.2% to $1.2484
- Italian 10Y yield fell 6.3 bps to 1.697%
- Spanish 10Y yield rose 1.4 bps to 1.423%
- Brent futures up 0.2% to $69.78/bbl
- Gold spot down 0.2% to $1,346.44
- U.S. Dollar Index up 0.2% to 88.87
Top Overnight News
- Chancellor Angela Merkel’s bloc and Germany’s Social Democrats secured an agreement on education even as “large” policy differences remain, a top party official said as parties near a self-imposed weekend deadline
- The U.K. must not enter into a new customs union with the European Union after it leaves the bloc, Trade Secretary Liam Fox said, setting a new red line for Theresa May’s negotiations with Brussels and her own party on Brexit
- Riksbank Deputy Governor Martin Floden says “there are risks to the rate path, inflation in particular is unusually uncertain,” according to an interview with Market News International
- Japan’s government will likely present to Parliament its nominees of BOJ governor and deputy governors around mid- to late February at the earliest, Reuters reports, citing unidentified people familiar with the matter
- BofAML says “massive” equity inflows last week helped trigger a sell signal triggered Jan 30th via record equity inflows, bullish hedge fund risk appetite indicator and global equity index breadth measure
- U.K. Jan. Construction PMI 50.2 vs 52.2 est; housing activity lowest since Jul. 2016
- BOJ took action today after large increase in JGB yields: senior official
- Strong chance that BOJ’s Kuroda will be reappointed, according to people familiar, Reuters reports
- China to allow overseas investors to trade iron ore futures on Dalian exchange
Asia equity markets traded broadly lower with sentiment in the region dampened amid a lack of catalysts and following the indecisive lead from Wall St. where most major indices finished negative and the Nasdaq 100 underperformed. ASX 200 (+0.5%) and Nikkei 225 (-0.8%) were mixed with Australia kept afloat by financials and energy, while the Japanese benchmark was the laggard and saw nearly all the prior day’s gains wiped out. Elsewhere, Shanghai Comp. (-0.4%) and Hang Seng (-0.1%) were downbeat amid Shenzhen volatility, while continued inaction by the PBoC also resulted to a weekly net liquidity drain of CNY 760bln. Finally, 10yr JGBs reversed the initial spill-over selling from US, with support from a risk averse tone and after the BoJ Rinban announcement in which it increased purchases in the 5yr-10yr range. Furthermore, the BoJ also effectively placed a cap on yields as it offered to buy an unlimited amount in 10yr JGBs at a yield of 0.110%. BoJ announced to buy JPY 450bln in 5yr-10yr (Prev. JPY 410bln), JPY 190bln in 10yr-25yr and JPY 80bln in 25yr+ JGBs, while it also announced a special bond operation to buy an unlimited amount of 10yr JGBs at a yield of 0.110%. However, there were no takers for the fixed rate operation and the BoJ stated it took the steps after a surge in yields and that it is adhering to policy of keeping 10yr yield near 0%. PBoC skipped open market operations for a net weekly drain of JPY 760bln vs. Prev. JPY 320bln drain W/W.
Top Asia News
- Dollar Slide Spurs Yuan Forecast Revisions, Worry on Speed
- Foreign Funds Poured $13 Billion Into Chinese Shares in January
- Fosun’s $1.5 Billion Biotech Arm Is Said to Mull Hong Kong IPO
- HNA-Like Debt Pileups Raise Risk of Forced Asset Sales in China
- What’s on the Block in China’s Potential Sale of the Century?
- World’s Biggest Pension Fund Gains $55 Billion as Stocks Climb
- Mitsui & Co Surges to Highest Since 2008 on Share Buyback
European equities (Eurostoxx 50 -0.6%) are trading lower across the board following a downbeat session overnight in Asia-Pac and the US. Underperformance has been seen in the DAX (-1.1%) with the index dragged lower by Deutsche Bank (-6.1%) after reporting a larger than expected quarterly loss; Commerzbank (-1.5%) also seen lower but little contagion seen in the broader European banking sector. Elsewhere, energy names are the only sector trading higher in Europe alongside firmer energy prices, telecoms underperform with BT (-5.5%) at the bottom of the FSTE 100 following their latest earnings update.
Top European News
- Germany DAX Gives Up Year’s Gain in Worst Selloff Since 2016
- ECB Official Warns Markets Are Unprepared for Inflation Bogeyman
- Czechs Signal Pause in Rate Hikes and Bet on Currency Gains
- Wereldhave Slumps On 2018 Profit Guidance Miss, Dividend Cut
In FX, the DXY remains weak overall as its 2018 (and late 2017) bear trend continues, but the index is holding in above 88.500 and some key support levels ahead of the 88.000 level. In fact, the Dollar is firmer vs all G10 rivals as US Treasury yields continue their ascent and some benchmark maturities hit key or psychological levels (long bond over 3% for example). EUR/USD is pivoting around 1.2500, Cable still finding it tough on advances beyond 1.4200, USD/Cad sticky circa 1.2300 and similarly USD/CHF bouncing back towards 0.9300 after forays below. USD/JPY is still gradually firming within a wide 109.00-110.00 range, and sniffing out layered offers up to the top of that band, with a 50% Fib at 109.88 also providing some resistance. JPY undermined by more aggressive BoJ buying of JGBs overnight, NZD by weak building permits and the AUD extending recent losses/underperformance on disappointing data and rolled out RBA rate expectations. Ahead, NFP the main Friday focus.
In commodities, WTI and Brent crude futures have modestly extended on the prior day’s gains, albeit off best levels with WTI back below USD 66/bbl and Brent retreating from USD 70/bbl with energy newsflow otherwise relatively light ahead of the Baker Hughes rig count and earnings from Exxon and Chevron (keep an eye out for CAPEX plans). In metals markets, Gold has traded relatively sideways ahead of NFP, whilst Chinese steel futures were seen higher overnight amid ongoing speculation over further extensions to domestic steel production curbs.
US Event Calendar
- 8:30am: Change in Nonfarm Payrolls, est. 180,000, prior 148,000
- Unemployment Rate, est. 4.1%, prior 4.1%
- Average Hourly Earnings MoM, est. 0.2%, prior 0.3%; Average Hourly Earnings YoY, est. 2.6%, prior 2.5%
- 10am: U. of Mich. Sentiment, est. 95, prior 94.4; Current Conditions, prior 109.2; Expectations, prior 84.8
- 5%
- 10am: Factory Orders, est. 1.5%, prior 1.3%; Factory Orders Ex Trans, prior 0.8%
- 10am: Durable Goods Orders, prior 2.9%; Durables Ex Transportation, prior 0.6%
- 10am: Cap Goods Orders Nondef Ex Air, prior -0.3%
DB’s Jim Reid concludes the overnight wrap
Today’s highlight will obviously be the employment report. Average hourly earnings have taken over from the headline number as the key focus of the report at the moment. DB are strongly of the view that wages are going up but we are not convinced you’ll see that in this report. They expect the number to tick down a tenth (+0.2% vs. +0.3% – consensus 0.2%) but the year-over-year trend may round up a tenth to 2.6%. For the headline number they expect a healthy gain in payrolls (+210k vs. +148k – consensus 180k) which should keep the unemployment rate steady at 4.1%. So far this week the employment and wages data has generally been positive. The latest evidence was 4Q unit labour costs yesterday which were above market at 2% (vs. 0.9% expected).
The employment report comes at a time of a continued sell off in US treasuries. UST 10y yields jumped the most in 12 months, rising 8.5bp to 2.791% and making a fresh high since April 2014. The UST 30y also closed above 3% for the first time since May 17 (3.025%) while the 2s10s steepened 6.5bp back to the highest since mid-December. The weakness seemed to have several contributing factors, such as a perception of it being a hawkish FOMC statement the night before, more data that supports the view that inflation is firming (the highest ISM prices paid reading since May 2011), and the UCL data discussed above. Over in Europe, changes in core 10y bond yields were more modest, with Bunds and Gilts up c2bp and OATs up 0.8bp. Peripherals actually outperformed, with yields down 2-6bp, in part supported by successful debt auctions in Spain.
Staying with US equities, the S&P 500 initially traded higher yesterday post Facebook’s results (shares +3.3%) but pared back gains to be marginally lower (-0.06%) while other bourses were mixed (Dow +0.14%; Nasdaq -0.35%). European markets were broadly lower, with the Stoxx 600 (-0.50%), FTSE (-0.57%) and DAX (-1.41%) down to a c4 week low. The pull back in the DAX was broad based with all sectors in the red, particularly industrials, real estate and healthcare stocks. The VIX was little changed at 13.47 (-0.5%).
After the bell, Amazon’s share price jumped c6% after reporting the strongest holiday quarter sales growth in eight years, while Apple’s shares recovered to be up c3%, in part as the CFO guided to >10% growth in iphone sales for the current quarter and investors took note of Apple’s higher average selling price for iPhone (+14% on pcp) as a potential sign of solid demand for its iPhone X after earlier reports to the contrary. Elsewhere, Alphabet is down c2% after its 4Q results missed estimates.
This morning in Asia, markets are broadly lower. The Nikkei (-0.85%), Kospi (-1.62%) and China’s CSI300 (-0.20%) are all down while the Hang Seng is up modestly (+0.13%) as we type. Elsewhere, the BOJ has announced its first unlimited fixed rate bond purchase operation since July, while also offering to buy more (40bn Yen; $365m) 5-10 year bonds at its regular operation this morning.
The yield on 10y JGBs fell from yesterday’s 9.4bp to c8bp this morning. Now turning to the ECB, Bloomberg has reported a group of unnamed ECB members had urged Mr Draghi in last week’s ECB meeting to be more specific than its current expectation that it will keep rates on hold “well past” the end of QE, but Draghi resisted a change on the wording. Elsewhere the ECB’s Praet seemed a tad dovish. On inflation, he noted “…we’re still some distance away from meeting the council’s criteria for a sustained adjustment in the path of inflation” and that “monetary policy will evolve in a data dependent and time consistent manner”.
Over in Germany, Ms Merkel noted that based on mid-term growth estimates, she expects the new government will “have additional scope” to spend beyond the EUR46bn agreed to in the exploratory talks with the SPD. The additional funds could be spent on digital transformation, development and foreign policy objectives. Elsewhere, when asked if the self-imposed Sunday deadline for coalition talks would hold, the SPD premier of the state of Mecklenburg said “we need to take the time that we need so that we can do good things for the people”.
Turning to currencies performance from yesterday, the US dollar index fell for the third consecutive day (-0.52%), while the Euro and Sterling jumped 0.77% and 0.51% respectively, with the Euro now at 1.251 – a fresh high since December 2014. In commodities, WTI oil edged up 0.4%. Precious metals were mixed but little changed (Gold +0.27%; Silver -0.62%) while other base metals advanced (Copper flat; Aluminium +0.14%; Zinc +0.71%).
Away from the markets, the ECB’s Nowotny has added to the debate on bitcoins, he noted “for a long time, I had the view that investment in Bitcoin should be a private matter, but I got the feeling that a legal provision is needed” and that “I like what the Chinese PBOC governor has said – bitcoins…are a matter for the police”. As a reminder, bitcoin fell c9% yesterday and is c54% down from its December highs. Elsewhere, he also noted “in my view, we should end the bond buying program” and that “this will also then lead to an increase in long term interest rates”.
Over in the UK, the BOE has begun simulating stresses in “stretched” bond markets to assess potential financial stability risks, in part as companies issued more bonds for funding than they did before the GFC. A key focus will be on liquidity mismatch in times of stressed markets. Across the pond, 38 US banks will have to report back to the Fed by 5 April in their annual stress test. Some of the downside assumptions include a jump in unemployment rate to 10%. Staying in the UK, the FT has reported that Brexit advisers to PM May are in “live” discussions on whether Britain can achieve a customs union deal covering trade in goods with the EU post a two year transition period.
Before we take a look at today’s calendar, we wrap up with other data releases from yesterday. In the US, the January ISM manufacturing index was above market at 59.1 (vs. 58.6) and the ISM prices paid rose to the highest since May 2011 (72.7 vs. 68.8 expected), which likely adds to the argument of higher inflation going forward. The 4Q nonfarm productivity fell for the first time in seven quarters (-0.1% vs. 0.7% expected) while unit labour costs was above market at 2% (vs. 0.9%). The December construction spending was up 0.7% mom (vs. 0.4%). Elsewhere, the final reading of the January manufacturing PMI was confirmed at 55.5. Finally, the weekly initial jobless claims was below expectations (230k vs. 235k) while continuing claims was above (1,953k vs. 1,929k). Factoring in the above, the Atlanta Fed now estimate 1Q GDP growth to be a whopping 5.4% (vs. 4.2% previous).
In Europe, the final readings for January manufacturing PMIs were broadly unchanged with the Euro area confirmed at 59.6 – 1pt below last month’s 20 year high, while Germany’s PMI was revised 0.1 lower to 61.1 and France 0.3 higher to 58.4. Elsewhere, the flash PMI for Italy was above market at 59 (vs. 57.4) but the UK PMI fell to the lowest since June 2017 at 55.3 (vs. 56.5), although still above its long run average of 51.7. Finally, the UK’s January Nationwide House price index was above expectations at 3.2% yoy (vs. 2.5%).
Looking at the day ahead, as discussed at the top it’s another payrolls Friday in the US and as usual keep an eye on other components of the January report including average hourly earnings and the unemployment rate. Also due in the US will be December factory orders, the final January University of Michigan consumer sentiment report and final December durable and capital goods orders.
3. ASIAN AFFAIRS
i)Late THURSDAY night/FRIDAY morning: Shanghai closed UP 15.10 points or 0.44% /Hang Sang CLOSED DOWN 40.31 or 0.12% / The Nikkei closed DOWN 2111.58 POINTS OR 0.90%/Australia’s all ordinaires CLOSED UP 0.50%/Chinese yuan (ONSHORE) closed UP at 6.2870/Oil UP to 65.76 dollars per barrel for WTI and 69.31 for Brent. Stocks in Europe OPENED RED . ONSHORE YUAN CLOSED DOWN AGAINST THE DOLLAR AT 6.2870. OFFSHORE YUAN CLOSED UP AGAINST THE ONSHORE YUAN AT 6.2922//ONSHORE YUAN MUCH STRONGER AGAINST THE DOLLAR/OFF SHORE MUCH STRONGEER TO THE DOLLAR/. THE DOLLAR (INDEX) IS MUCH STRONGER AGAINST ALL MAJOR CURRENCIES. CHINA IS HAPPY TODAY.(WEAKER CURRENCY BUT STRONG MARKETS )
3 a NORTH KOREA/USA
/NORTH KOREA
3 b JAPAN AFFAIRS
The Bank of Japan realized yesterday that they were in trouble as their long 10 yr bond yield hit .10%. They announced another round of QE buying. This time they are buying any bond any time the yield hits .11% on an unlimited basis as well as boosting POMO in a panic response to its surging rates
(courtesy zerohedge)
BoJ Offers To Buy Unlimited Debt, Boosts POMO In Panic Response To Surging Rates
Kuroda is losing kontrol
After unexpectedly boosting its bond-buying in the 3-5Y segment of the JGB curve on Tuesday, as global bond yields break ever higher, it appears The Bank of Japan is realizing it is losing control of its yield curve and today unleashed a double-whammy to stifle the bond bears...
Whammy 1 – BoJ offers to buy unlimited 10Y notes at 11bps.
Result – a 0.5bps drop in the JGB yield!!

Let’s hold back on the ‘mission accomplished’ celebration for now, because in a rerun of the failed attempt from Tuesday, when the BOJ boosted its 3-to-5 year bond purchase operation (aka POMO) from 300BN to 330BN yen, today it proceeded with…
Whammy 2 – BoJ increases its usual POMO to 450 billion yen from 410 billion in the 5Y and 10Y range of the curve.
Result: a very brief weakening of the JPY followed by a ‘policy error-like’ drop in USDJPY as the Yen spiked now that the market demands even more.

This is not the result Kuroda and his cronies were hoping for.

As Barclays’ rates strategist predicted, similar operations are likely in future if yields rise, warning that while the BOJ’s action can offer some relief to markets but the real cause of yield rise is higher U.S. yields, where prospects are unclear.
He is right, because the USDJPY is already back to unchanged. If and when the 10Y resumes blowing out, the BOJ will be forced to get even more aggressively involved as the spillover effects from rising US yields are finally appreciated by the rest of the world.
But the last words belong to Yasutoshi Nagai, chief economist at Daiwa Securities, who said that “it’s a clear message from the Bank of Japan,” after the central bank announced a fixed-rate bond purchasing operation and offered to buy more of 5-to-10 year bonds at their regular operation Friday.
“The message is they’ll absolutely make sure that long-term yields don’t go above 0.11 percent.”
And the punchline: “Right now the BOJ is nearing major personnel changes, so it doesn’t want the market to disintegrate.”
And that, ladies and gents, is your price stability.
END
c) REPORT ON CHINA
Chinese stocks tumble especially the Hang Sang. Hong Kong officials are now monitoring a surge in ATM withdrawals a citizens expect a big devaluation
(courtesy zerohedge)
Chinese Stocks Tumble As Hong Kong Officials Monitor Surge In ATM Withdrawals
Chinese stocks are down for the fifth day in a row (something that hasn’t happened since May 2017) with the tech-heavy Shenzhen Composite is now down 5% YTD and the Shanghai Composite is tumbling back towards unchanged.

The decline is happening at the same time as Bitcoin is in freefall…

And chatter about bankers using WeChat to ask for Deposits.
In other words – a liquidity crisis.
And that anxiety is only increased by the latest report from Reuters that cash withdrawals at Hong Kong ATMs have surged, prompting scrutiny from monetary authorities, the banking industry, and police amid media reports that mainland Chinese are withdrawing hundreds of thousands of dollars using up to 50 cards at a time.

China has battled to curb capital outflows for years. A move that took effect on Jan. 1 caps overseas withdrawals using domestic Chinese bank cards.
The gambling hub of Macau last year introduced facial recognition technology at ATMs to target illicit outflows from mainland China, a move that Hong Kong’s central bank told Reuters could increase cash withdrawals in the financial center.
“The HKMA is aware of media reports about people using multiple mainland cards to withdraw cash at ATMs in Hong Kong,” the central bank said in a statement, adding that it was “monitoring the situation and is in discussion with the banking industry and the police about this issue”.
A local banker said some commercial banks have stepped up monitoring of cash withdrawals.
Hong Kong police said they were working closely with the HKMA and banking industry to respond to any changes in financial crime trends.
While this is as much to do with money-laundering and capital flight, the liquidation of stocks, cryptocurrencies, and now amss ATM withdrawals suggests more is going on that the usual pre-new-year liquidity hording.
The bigger question is – when will China devalue again? it’s already got the capital outflows anticipating it…

end
Same story as above: a huge Chinese liquidity crunch begins as stocks sink. Chinese bankers are begging friends for deposits
(courtesy Investing In Chinese Stocks blog)
Chinese Liquidity Crunch Begins As Stocks Sink: Bankers Begging Friends For Deposits On WeChat
Via ‘Investing In Chinese Stocks’ blog,
Another cyclical slowdown in China looks to be underway…
December’s FAI went negative yoy and now an anecdote pointing to another cash crunch in the banking system.

Every year ahead of Spring Festival (February 16 this year) cash gets tight, but during the prior tightening cycle from 2013-2015 the cash crunch almost became a quarterly event. There is no spike in SHIBOR as there was in 2014 yet, but there are other similarities. The yuan rose ahead of the crunch (it was in the middle of a bull market from 2010 to the start of 2014) and the first sign of the crunch came in the first quarter-end following the Taper Tantrum and U.S. interest rate spike. The yuan is rising again versus the dollar, the Fed began shrinking its balance sheet in October and U.S. interest rates have spiked.
The result: Begging for money in friend groups, Deposit war guns blazing!
The annual deposit war is particularly fierce this year. The last day of January in the [WeChat] friend groups, bankers “beg” for deposits one after another.
“There are more than 20 banks looking, every one is asking for deposits.” a listed company’s small partner told reporters that he had been too busy to reply, however. The banker’s nickname is “Guixie.” [a combination of beg and thanks]
“Perhaps because the New Year approached, company payments are more numerous, bank account capital is less, bank competition for deposits is even more intense.” A banking source told reporters bluntly, these days are quite difficult.
“Early this year, due to the strong demand for credit, debt problems continue to simmer, more banks seek deposits, especially regulatory assessment, have the resources available.” Minsheng Bank Wang, director of Center for Financial Research Fellow a peak, told reporters that the banking system liabilities is difficult, debt problem has been going on for some time, mainly due to foreign exchange increment is not enough, shadow banking is inhibited. In 2017, the banking system credit growth significantly faster than deposit growth, resulting in rising loan-deposit ratio, sounding the alarm over the assets and liabilities, liquidity management pressures.
On the one hand, the news suggests credit growth was solid in January, but is also suggests the financial system is hitting some hard limits as credit growth outpaces deposits. The highlighted portion confirms Jeffrey Snider’s description of the current state of affairs as a “dollar” or eurodollar problem. The Chinese banking system is starved for dollars.
Alhambra: The Chinese Appear To Be Rushed
While the Western world was off for Christmas and New Year’s, the Chinese appeared to have taken advantage of what was a pretty clear buildup of “dollars” in Hong Kong. Going back to early November, HKD had resumed its downward trend indicative of (strained) funding moving again in that direction (if it was more normal funding, HKD wouldn’t move let alone as much as it has). China’s currency, however, was curiously restrained during that time.
No more. Since the middle of last week, CNY has been sharply higher. All those “dollar” balances that were surely sitting in Hong Kong perhaps just waiting for year-end were moved almost all at once.
Why the rush?
Maybe there were some government concerns for those end-of-year activities in eurodollar markets that were clearly pushed askew by what’s going on over there across the Pacific. I’m not aware of any official deadlines or regulatory requirements that would have condensed the “dollar” flow into such a tight calendar space. It looks instead to have been related to market conditions, particularly since CNY wasn’t the only big mover during that time.
The news at the end of January tells us whatever stress sent the Chinese rushing at year end is still pressuring the financial system.
The picture from 50,000 ft shows that despite a slowdown in M2 growth:

The Chinese financial system’s growth is still outstripping the implicit reserves backing it:

The above chart doesn’t matter until it does, such as in August 2015 when the PBoC threw in towel and allowed the yuan to devalue. This time around, the dollar is weakening and the yuan is rising along with the euro, further weakening the yuan’s long-term position. China will be forced to devalue sooner than last time, when it took 18 months from the problem emerging in early 2014 to devaluation.
As for the rising yuan, Chinese exporters are already squealing.
SCMP: In China, yuan’s rapid gains make exporters uneasy as US dollar weakens
Its rapid gains are instead fuelling unease and fears over the negative impact on Chinese exporters, and it has even fanned theories that China is falling victim to a new type of “currency war” started by the US to cut the trade imbalance.
The yuan is a problem at USDCNY 6.3 and USDCNY 6.9 because China has a massive credit bubble.
At one end, the deflationary impact of a rising yuan and at the other, the risk of a major devaluation.
In the middle is the Goldilocks exchange rate, not to strong to trigger debt default, not to weak to trigger outflows.
USDCNY 6.3 in the current environment is too strong. The PBoC is also pinned in this range. Loosen capital controls to let the yuan weaken, exacerbate the liquidity crunch in the banking system and risk uncontrolled depreciation/capital flight. Let the yuan strengthen and risk a credit crisis. Further reverse yuan internationalization and set the yuan price, but risk an economic response from the United States.
Takeaway
China bought two years with its 2016 reflation, aborting a global slowdown stemming from its last decision to slow credit growth. This growth cycle has completed and is turning down again.
The fallout from the prior slowdown started showing up after Spring Festival in 2014. From February 23, 2014: China Real Estate Rage Is Back; Ghost Cities Everywhere; Offshore Yuan Plunges; Talk of Falling Real Estate Prices Across China. Regarding the dip in the yuan, I wrote:
If this keeps up, we may soon hear about a dollar shortage in China, which happened last time the yuan spiked. Also, after the 2011 drop, forex reserves fell.
It will only take a small marginal change in the economic trends to create a hurricane force in the financial markets. Once the market moves the other way, the shift will be swift and brutal because everyone is on the other side of the trade. How many people out there have puts on the yuan and expect China’s reserves to start falling?
If history rhymes, there’s going to be some significant negative news out of China in March. If that happens, the clock will start ticking on the next global deflationary wave.
The conventional wisdom about equities, interest rates, inflation and emerging markets is wrong again, just as it was in 2011 and 2014.
end
4. EUROPEAN AFFAIRS
Italy
Italian banks are dumping Italian sovereign bond debt by the bucketful. The only buyer: the ECB
(courtesy zerohedge)
Italian Banks Are Dumping Italian Sovereign Debt To The ECB Ahead Of The Election
At the turn of the year, and just over 2 months ahead of the Italian elections on March 4, we presented a stunning observation from Citi, one suggesting that even before any potential political risk emerges in March, private investors had long ago fallen out of love with Italian BTPs and had taken to the hills.
As illustrated in the chart below, just about every other major investor type has become a net seller (to the ECB) or a non-buyer of BTPs over the last couple of years. Said differently, for well over a year, the only marginal buyer of Italian bonds has been the ECB (dark blue).

Then, overnight, Jefferies was kind enough to collate the latest ECB sovereign debt flows data, and revealed another stunning finding: one of the biggest sellers to the ECB has been none other than Italian banks themselves!
Here is Jefferies analyst David Owen:
The breakdown below shows significant moves by the banks in all four largest euro area economies. However, the Italian banks are again in the spotlight; they reduced their domestic sovereign debt holdings by a hefty €12.6bn in December, and by €40bn (10.5% of outstanding stock) in Q4 as a whole. There is strong seasonality in the data, as banks book trading profits and dress-up their balance sheets for year-end; but even by previous standards, this move in recent months is unprecedented.
It is indeed, and as a side note, since the start of European QE, some €100 billion in Italian bonds have changed ownership: from Italian banks to the European Central Bank .

On one hand, this is good news as it suggests that Europe’s “doom loop” is finally breaking. Recall that the biggest risk facing Europe in the 2011-2013 period was the surging purchases of their own sovereign debt by local banks, which were too afraid to put money into other non-backstopped assets. And, according to some, the resultant record holdings is one of the reasons why the ECB launched QE: to send the prices of European sovereign bonds soaring, unblocking European bank balance sheets and allowing the traditional credit machinery to work again.
The flip side is that while European banks have been selling sovereign bonds, they have been shifting the proceeds into other, far riskier assets, assets which will tumble the moment the market prices in the departure of the ECB as Europe’s buyer of last resort.
And while it is unclear how long until that moment of epiphany occurs, keep an eye on Italian banks and their BTP holdings: once the reduction reverses, and banks start bidding up, it’s safe to assume that Draghi’s next QE program can’t be too far behind.
As for the political risk, and potential fallout from the upcoming Italian elections, fear not: by now the ECB is surely one of the biggest owners of Italian bonds, and if something unexpected happens, well Draghi will always pull something out of his sleeve, “whatever it takes.”
END
Germany/Deutsche Bank)
Our good friends over at Deutsche Bank, who are subject to criminal investigations on manipulation on both gold and silver have suffered another loss in this latest quarter to the tune of 1.3 billion Euros
(courtesy zerohedge)
“There’s No Silver Lining”: Deutsche Bank Tumbles On Abysmal Earnings
It is safe to say that after years of disappointment, investor expectations were low ahead of today’s Deutsche Bank earnings report. Yet somehow, the biggest German lender failed to beat even the most pessimistic one.
Deutsche Bank, which had already guided for a slump, shocked markets when revenue that missed the lowest estimate and fell to the lowest in seven years amid declines at businesses from transaction banking to equity derivatives, and pretty much everything else. Even cost control – supposedly a key feature of CEO John Cryan’s tenure – was worse than expected. The company also reported a €1.3 billion loss for Q4, which while better than the company’s disastrous report last year, was €100mm worse than the lowest forecast and far worse than the consensus loss of €478mm.
“The results are disappointing again and we don’t see anything encouraging in them, reinforcing our doubts in the bank’s strategy and management,” said Michael Huenseler at Assenagon. “There’s no silver lining.”
In line with its US peers, revenues in the all important fixed income and currencies trading group fell 29% year-on-year, and combined FIC and FIC-related financing were 20% lower. Echoing JPM and Goldman, Deutsche said the division suffered from “low volatility, low institutional client activity and difficult trading conditions in certain areas“, Deutsche said in a statement.
Overall trading revenue at the investment bank, excluding financing, declined 27 percent, Deutsche Bank said.
Meanwhile, Q4 result in Deutsche’s investment banking division, which accounts for more than half of overall revenues, were also at the low end of analyst expectations: at €2.7bn, revenues were 16% lower than a year ago and 13 per cent below analyst expectations. The division reported a fourth-quarter loss before income taxes of €733m, more than two-thirds higher than a year ago.
Some more details from the abysmal quarter, via Bloomberg:
- Full-year net revenue of 26.4 billion euros; est. 27.26 billion euros
- 4Q net revenue EU5.71 billion, lowest since 2010
- 4Q sales and trading revenue EU886 million, down 27 percent
- 4Q loss 2.18 billion euros; estimate was for loss 2.24 billion euros
- 4Q common equity Tier 1 ratio 14 percent
- 4Q equity trading revenue 332 million euros
- 4Q debt trading revenue 554 million euros
- FY loss after tax 512 million euros
As Bloomberg notes, Deutsche Bank’s revenue has fallen in 8 out of the 10 quarters since Cryan took over as CEO.

To be fair, Deutsche did warn in early January that combined revenues in fixed income and equities trading and financing will be down by up to 22% – the five largest US investment banks reported an average drop of 19 per cent, according to data by Autonomous Research – but clearly the market was not prepared for it.
Deutsche shares tumbled more than 5% as a result, the biggest drop in 6 months, and the lowest since September.

Always keeping the faith, even as calls for his resignation have never been louder, Cryan again expressed the bank’s dissatisfaction with the results while holding out hope for a return to growth in 2018, saying that he expects higher returns with sustained discipline on costs and risks.
“We have made progress, but we are not yet satisfied with our results”, said chief executive John Cryan. For the full year, Deutsche reported a net loss of €500m, the third annual loss in a row. It was triggered by a €1.4bn non-cash charge caused by the US tax reform, which dented the value of deferred tax assets in the US.
Maybe there was a little silver lining: Cryan said that client activity picked up in January and he pointed to good economic growth in all major global markets. The bank is paying a one-off bonus to its corporate and investment bank as it seeks to strengthen the business, a move that is sure to stir the activist investors with demands for Cryan’s scalp.
Looking ahead, The lender also scrapped its 2018 target of lowering total adjusted costs to about €22bn this year and said total costs will be about €1bn higher, as business disposals that were supposed to reduce costs by €900m have been delayed or suspended.
Meanwhile Cryan is running out of time to show he can lead Europe’s largest investment bank back to strength. The Brit has defended his strategy, saying two weeks ago that his turnaround plan had entered a “third phase” in which growth should finally be restored and on a conference call on Friday that client activity picked up in January.
“What must frustrate investors, in the stock in particular, is the lack of positive news,” said Gildas Surry, a portfolio manager at Axiom Alternative Investments in London which manages about $1.3 billion, including Deutsche Bank bonds. “FICC down, financing down, costs up, loan provisions down.”
While it is unclear what if anything will help Deutsche Bank get out of its 3 year-long funk, it is increasingly obvious that one more quarter as bad as this one may be Cryan’s last.
END
5. RUSSIAN AND MIDDLE EASTERN AFFAIRS
Israel/Palestine/USA
Trump plans to present a middle east peace plan with our without the Palestinians. The reason that the Palestinian leaders do not want a peace plan is because they are pocketing themselves, the USA money sent as aid. Now Trump states that no money will be sent unless the Palestinians engage in meaningful dialogue
(courtesy zerohedge)
Trump To Present Mideast Peace Plan “With Or Without The Palestinians”
A ‘post hoc’ attempt to present the US as a sincere broker in the peace process?
Axios reports that amidst the current complete disconnect in relations between the White House and the Palestinian Authority there is serious consideration underway of moving forward with President Trump’s Middle East peace plan with or without the Palestinians at the negotiating table.
A senior administration official told the diplomatic correspondent for Israel’s Channel 10 news Barak Ravid that Trump may simply place his plan before the world “so the parties and international community can judge it at face value.” As quoted in Axios, the senior official elaborated on the plan as follows:
“Since it’s not done, we haven’t decided yet how we are going to put it forward and what happens if one of the sides isn’t ready to come to the table. We are not there yet. But we are very optimistic that all relevant countries who want to support a peace agreement between the two sides are still waiting for our plan, want to work with us and realize we cannot be replaced. Despite all of the false reports about our plan, we are confident it will be beneficial to both sides and both peoples.”

Israeli PM Benjamin Netanyahu with President Trump in Jerusalem during a May 2017 visit. Image source: AP via Politico
As recently as a week ago Trump repeated his threat of cutting US aid to the Palestinian territories, telling reporters at the World Economic Forum in Davos that he could cut $700 million in annual U.S. aid “unless they sit down and negotiate peace.”
Trump has frequently visited the subject following the fierce international reaction to the early December move which gave formal US recognition of Jerusalem as the capital of Israel, which includes plans to relocate the US embassy from Tel Aviv to Jerusalem by the end of 2019. At Davos, just before a planned meeting held on the sidelines of the economic summit with Israel’s prime minister, Trump heightened his rhetoric, saying of the Palestinian side represented by Mahmoud Abbas, “They’re going to have to want to make peace, or we’re going to have nothing to do with them any longer.”
Trump added further, “We give them tremendous amounts, hundreds of millions of dollars. That money is on the table, because why should we do that as a country if they’re doing nothing for us?” And concluded by saying he simply wants “peace” and “to save lives”: “And what we want to do is help them. We want to create peace and save lives. And we’ll see what happens. We’ll see what happens. But the money is on the table.”
The December 6th announcement unleashed a wave of protest among Palestinians in the West Bank, Gaza, and Jerusalem which resulted in multiple deaths during clashes with Israel security forces. Dozens of rockets were also launched out of Gaza, with Hamas leadership calling for a new ‘intifada’ – or mass uprising against Israeli occupation – soon after Trump’s announcement. In addition, Vice President Mike Pence was twice forced to push back plans to visit Jerusalem and the West Bank town of Bethlehem, the latter which was canceled altogether as Palestinian officials declared their intent to snub the vice president during this visit.
Pence finally made the trip less than two weeks ago but failed to meet with Palestinian leadership, and gave a speech before Israel’s Knesset wherein he reaffirmed Trump’s commitment taking the next steps necessary to making the US recognition of Jerusalem a reality on the ground, saying “In the weeks ahead, our administration will advance its plan to open the United States Embassy in Jerusalem, and that United States Embassy will open before the end of next year [2019].” He further said, “Our president made his decision in the best interest of the United States,” and added, “The United States has chosen fact over fiction” while peppering his speech heavily with Old Testament references throughout while pledging to “stand with Israel because we believe in right over wrong, in good over evil, and in liberty over tyranny.”

The @WhiteHouse just tweeted this picture out as an ad for Trump’s State of the Union speech tonight. Regardless of how you feel about the state of Israel…does this make any sense at all?
Palestinian officials have claimed that the US under Trump has fully abandoned its role as an “honest broker” – however its unlikely that the Palestinians ever genuinely perceived the Americans in that role to begin with, as US aid to Israel – the bulk of it in the form of military support – has for years been in the billions per year. In 2016 the US signed off on a record $38 billion military aid package to Israel over the next decade. Abbas recently summarized the Palestinian Authority’s reaction to the Jerusalem move by slamming the decision as the “slap of the century” .
And CNN reported the Palestinian Authority’s reaction to Trump’s Davos comments, as well as its view of the future prospect of a peace plan, as follows:
“If Jerusalem is off the table, then America is off the table as well,” President Mahmoud Abbas’ official spokesman Nabil Abu Rudeineh said in a phone call with CNN, reiterating that Palestinians no longer recognize the US as a mediator in any peace negotiations with Israel.
There will be no negotiations, Abu Rudeineh said, until the current American administration abides by international law and agrees to work toward a two-state solution, which would see a state of Palestine created along 1967 lines with East Jerusalem as its capital.
Per the Axios report, should the White House move ahead to present a Trump peace plan before the international community it will likely be a mere post hoc attempt to present Trump as a sincere broker in the peace process. A December 21 United Nations vote to condemn the US Jerusalem recognition was dubbed a “stunning rebuke” of the US President’s decision after 128 countries voted against the US and Israel, and with 35 abstaining.
While Palestinian officials saw the move as a final nail in the coffin concerning the peace process, Trump ironically presented it as “the beginning of a new approach to conflict between Israel and Palestinians.”
He said during the December 6 speech rolling out of the plan, “This is a long overdue step to advance the peace process and work towards a lasting agreement.” Trump generally framed the decision as a way to put his own stamp on one of history’s oldest conflicts. “The record is in: after more than two decades of waivers, we are no closer to a lasting peace agreement between Israel and the Palestinians,” the president said at the time. “It would be folly to assume that repeating the exact same formula would now produce a different or better result.”
According to Axios’ report today, “Israeli Prime Minister Netanyahu said he will react to the Trump plan after he sees it but stressed he is ready to renew peace talks.” No doubt, the Israelis now see the US as firmly in their corner after the Jerusalem recognition, in line with the long-running Jewish claim on the contested capital.
* * *
Meanwhile, Axios summarizes the latest developments as follows:
- U.S. special envoy Jason Greenblatt held a series of meetings with Netanyahu, his advisers and several ministers over the last two weeks. Greenblatt also met with opposition leader Hertzog and briefed EU member states representatives in Tel-Aviv and East Jerusalem. He did not meet with any Palestinian officials but met with Palestinian students and private sector executives.
- On Wednesday, Greenblatt participated in an emergency meeting of the donor countries to the Palestinian Authority. The meeting focused on the crisis in the peace process and on the humanitarian situation in Gaza. The Palestinian Prime Minister Rami Hamdallah also participated in the meeting. It was the first time senior Palestinian and U.S. officials were around the same table since the Jerusalem announcement. Greenblatt and Hamdallah shook hands but didn’t hold a meeting.
- In his speech during the plenary meeting, Greenblatt referred to Hamdallah and said he hopes that the fact he is participating shows the Palestinians are still committed to the efforts to renew the peace process. Greenblatt also said President Trump’s announcement was just a recognition of reality and the connection of Israel and the Jewish people to Jerusalem. Greenblatt also said in his speech: “Did the President’s decision prejudge any final status issues? No. We have not taken a position on borders”.
- Greenblatt stressed that the Trump administration continues drafting its peace plan and called on the Palestinians to return to the peace talks: “Peace will not be achieved by walking away from negotiations. It is easy to walk away from the table. But that helps no one, and it reduces or perhaps eliminates the chances of achieving a comprehensive peace agreement. And that would be terrible for the Palestinian people”.
Will Washington’s Chess Game In Syria Lead To War With NATO Ally Turkey?
Authored by Darius Shatahmasebi via TheAntiMedia.org,
It’s not clear if the United States knows what it is doing in Syria anymore. Having successfully toppled the Libyan government in 2011, former President Barack Obama subsequently spent a good three years attempting to bring about the fall of the Syrian government, under the guise of humanitarianism, that embroiled the region in chaos and civil strife.
Incessant calls for Syrian President Bashar al-Assad to formally step down, combined with the billions of dollars in arms and funding for radical Sunni jihadists who sowed the seeds of sectarianism and a bloody civil war in order to divide and conquer Syria, plagued Obama’s foreign policy for years. And let’s not forget the extensive strike plan Obama drew up in 2013, which would have almost certainly extinguished Assad’s presidency.
Unfortunately for the establishment, Obama’s strike plan didn’t have the approval of America’s warmongering partner in crime, the United Kingdom; and was strongly opposed by Russia. Most importantly, there was significant disapproval among the general public and military, and the U.S. knew it would never garner the support needed to carry out such an intervention.
Then in 2014, the U.S. military found backdoor access by riding the international outrage and horror provoked by the radical group ISIS, which had attained huge swaths of territory in both Iraq and Syria. Anyone who had been paying attention knew deep-down that the focus on ISIS was essentially just a façade to pave the way for the U.S. military to take on Assad directly — though this scenario proved much harder than expected, after Russia’s formal intervention in 2015. With Russia backing the Syrian government directly, there was little the U.S. could do but direct most of its energy towards ISIS, with some minor, albeit noticeable, exceptions.
And then came Donald Trump, the alleged Russian stooge and lackey, who was going to focus on making America great again and who had proposed instead to work with Assad and Russia. Whether or not Trump has any say in the matter is unclear, but it became quickly apparent that the war-hawks in his administration are just as schizophrenic as their predecessors.
Working Through the Plan Alphabet and Back Around to Plan A

Secretary of State Rex Tillerson, right, waves after speaking to the Hoover Institution at Stanford University with former Secretary of State Condoleeza Rice, left, in Stanford, Calif., Wednesday, Jan. 17, 2018. In a speech at Stanford University, Tillerson signaled a deeper American commitment to the Mideast nation of Syria, saying the U.S. military will remain there for the foreseeable future. (AP Photo/Jeff Chiu)
Secretary of State Rex Tillerson initially maintained that Assad had to leave, but then appeared to change his mind. Trump’s ambassador to the UN, Nikki Haley, only added to the confusion. Barely days after this flip-flop, a chemical weapons attack in April last year immediately brought us back to another strike plan on the Syrian government; and the go-to mantra ever since appears to renew the longstanding call for Assad’s departure.
But why did the U.S. want to remove Assad so badly that it justified manufacturing an entire bombing campaign against another force? There are many competing theories, but Assad as a stalwart Iranian and Russian ally poses a major threat to the U.S. empire, as well as to adversarial states such as Israel and Saudi Arabia.
In 2009, Qatar put forward a proposal to run a pipeline through Syria and Turkey and into Europe to export gas from Saudi Arabia. The Assad government instead forged an agreement with Iran and Iraq to run a pipeline into Europe — leaving out Saudi Arabia, Qatar and Turkey completely. If these kinds of deals can be arranged under the cover of Russian air power, the United States risks losing out much of the region and its spoils to Russia and Iran.
Now that ISIS has been successfully (more or less) “defeated,” the U.S. is openly staying in Syria indefinitely to counter both Assad and Iran’s alleged expanding influence. Tillerson put it bluntly in mid-January this year:
“Continued strategic threats to the U.S. other than ISIS persist. I am referring principally to Iran. Iran has dramatically strengthened its presence in Syria by deploying Iranian Revolutionary Guard troops; supporting Lebanese Hezbollah; and importing proxy forces from Iraq, Afghanistan, Pakistan and elsewhere. Through its position in Syria, Iran is in a stronger position to extend its track record of attacking U.S. interests, allies and personnel in the region.”
“Syria remains a source of severe strategic problems and a major challenge for our diplomacy,” Tillerson added. “But the United States will continue to remain engaged.”
The U.S.-Turkey Debacle

Turkish troops take control of Bursayah hill, which separates the Kurdish-held enclave of Afrin from the Turkey-controlled town of Azaz, Syria, Sunday, Jan. 28, 2018. Turkish troops and allied Syrian fighters captured the strategic hill in northwestern Syria after intense fighting on Sunday as their offensive to root out Kurdish fighters enters its second week, Turkey’s military and Syrian war monitor reported. (DHA-Depo Photos via AP)
As reports began to emerge of Washington’s plan to build a 30,000-strong Kurdish and Arab force on Turkey’s border in Syria, it became quite clear that Turkey itself was days away from invading Syria directly. To no one’s great surprise, the Turkish military intervened in the days that followed, most notably in the city of Afrin, before announcing it would extend its operations right up to the border with Iraq.
The U.S. surely knew this would happen, yet continued to antagonize both parties to the fullest extent possible. Neither the U.S. nor Turkey has the legal basis to conduct military operations in Syria, yet the two of them believe they have the right to call the shots as to the best way of handling the situation. First, Turkey urged the U.S. to leave the area of Manbij because that is where the Turks have set their sights, getting closer to the border with Iraq. A top U.S. general immediately responded by saying the U.S. had no intention of leaving Manbij at all, further aggravating the situation.
The only consistent strategy employed by the U.S. that can be ascertained (to a point) is that of maximizing the chaos in Syria. Even as we speak, Russia has begun a peace process of its own in Sochi. Why did the U.S. decide to announce its unlimited troop presence in Syria days before the peace talks were to commence; and do they genuinely believe their presence in Syria contributes to any meaningful peace for that country?
Just as disturbing is America’s unrivaled ability to commit itself to wars left, right and center without any domestic democratic accountability or approval from the international community. As The New York Timesnotes, this new Syria strategy is “illegal under both the Constitution and international law.” It was illegal when Barack Obama began a covert war of aggression to topple the Syrian government as far back as 2011; it was illegal right up until he began bombing Syrian territory in 2014; and everything the United States has done right through the Trump administration until today is equally illegal.
The Times’ assessment that allows for the U.S. to be in Syria solely to defeat ISIS is questionable at best; but it proves one thing: not even the warmongering mainstream media can put a positive legal spin on the plan to stay in Syria to confront Assad and Iran: because there is no legal basis to do so.
As it stands, the U.S.’ strategy in Syria is beginning to make less sense by the day. Turkey, a longstanding opponent of the Assad government, now might be working to establish a formal dialogue with Assad himself, to counter what it deems to be the principal threat: the U.S.-backed Kurds.
According to Robert Fisk, reporting from on the ground in Syria, the city of Afrin hasn’t even been bombed by Turkey yet, while Turkey has been continuously threatening a grand offensive to retake the city. That’s because it’s Russia, not the U.S., that controls the airspace over the city of Afrin, and any incursion into Afrin would most likely need Russian approval. By Fisk’s research, if Turkey’s army wanted to take Afrin, it could do so in less than half an hour. So far, there have been signs of violence around Afrin, but not in Afrin itself. Indications are that Turkey is relying on its newfound proxy force instead, in the hopes of re-establishing a sizeable anti-Assad force of its own — one that can continue to fight for Turkey’s interests without compromising its position on the Kurdish question.
There’s a reason that Turkey is arresting journalists and critics of the invasion by the hundreds even as I type. With Western media relying on state-approved Turkish correspondents without the capacity for dissent, it is unlikely that those of us on the outside are getting the full picture. Fisk is most likely the only journalist on the ground who won’t be simply echoing Erdogan’s narrative, and already he has alleged that Turkey is conducting outright civilian massacres, not “surgical” strikes on “terrorists.”
Turkey is a member of NATO. It has invaded Syria just as the U.S. has, but with what appear to be polar-opposite interests.
According to Haaretz, the real reason Turkey is involving itself in the region is not to stop an independent Kurdish state, but to stop Assad from incorporating the current Kurdish political infrastructure into his own future Syrian state. Haaretz explains:
“Russia knows the survival of Assad’s regime and his control of the entire country depends to a large extent on his ability to assimilate the Kurdish districts into Syria, with the ideal scenario being one that allows the Kurds to run their federation as part of the Syrian state under Assad’s rule. The United States also sees the Kurdish federal system in Syria and the principles of the Kurdish constitution as being no less worthy of defending than the Kurdish region in Iraq.”
The media won’t admit it outright, but this too is a deal-breaker for the U.S., and hanging the Kurds out to dry and drawing Turkey into a direct confrontation might be the principal way in which the U.S. can continue to dismantle any hopes for a unified Syria in the not-too-distant future.
Where Are We Headed?

A U.S.-backed anti-government fighter mans a heavy automatic machine gun, left, next to an American soldier as they take their positions at Tanf, a border crossing between Syria and Iraq (Hammurabi’s Justice News/AP)
Clearly, Washington’s distaste for Assad lies in his geopolitical proximity to Iran and Russia. This should be no secret, as the U.S. has maintained its view of both countries as American arch-rivals right through the previous administrations.
As The Washington Postnoted just days ago, the U.S. has finally admitted its true intention in Syria:
“After months of incoherence, the Trump administration has taken a step toward a clear policy on Syria and its civil war. In a speech last week, Secretary of State Rex Tillerson bluntly recognized a truth that both President Trump and President Barack Obama attempted to dodge: that ‘it is crucial to our national defense to maintain a military and diplomatic presence in Syria, to help bring an end to that conflict, and assist the Syrian people . . . to achieve a new political future.’
To do that, the United States will continue to deploy several thousand personnel in the country and help allied Syrian forces maintain control over enclaves in the southwest, near Israel and Jordan, and the northeast, on the border with Iraq and Turkey.” [emphasis added]
Yet as long as Russia maintains a military presence in Syria, with the capability of establishing a no-fly zone of its own in much of the country, there is little the U.S. can do regarding Assad without taking on Russia directly. In the meantime, however, it clearly can do its utmost to put a dent in Iran’s expanding influence. By allowing its proxy forces to take over the strategic areas of al-Tanf and parts of Deir ez-Zor, the United States will put a major hole in Iran’s ability to link itself to Iraq, Syria and Lebanon as directly as it otherwise could. This bridge of Iran-allied nations, known as the Shia Crescent, is Saudi Arabia’s worst nightmare.
In that context, however, the current stand-off will remain a stalemate for some time, as Iranian-backed troops will continue to render America’s military bases all but useless — as they have more or less taken control of the areas that surround the bases, cutting the U.S. military off from using the bases effectively.
Whether or not the U.S. is prepared to launch a direct strike on these forces and go further than merely cutting them off is unclear, but it seems unlikely at this stage. Given that the U.S. knows Israel is itching to bomb Syria and Lebanon to confront Iran’s growing military presence, it seems more likely that the U.S. will instead rely on Israel to kickstart such a war. At the same time, Washington can continue to rely on its proxy forces to take on the so-called Iranian threat, without fighting Iran directly.
Either way, America’s schizophrenic approach to the conflict and its desire to prolong the war as long as possible does nothing to ease the suffering of ordinary Syrians. It should be clear that the U.S. has no desire to bring peace to Syria, as it continues to violate international law and aggravate other major players in the region, all of whom have conflicting and contradictory visions for the future of Syria.
America’s current Syria strategy opens up the door for a war with Turkey and a potential war with Iran and Syria. All the while the U.S. loses its status as the so-called global leader, with Russia emerging unscathed from the conflict as the region’s major power broker.

The corporate media would do well to follow the footsteps of The New York Times and call this strategy what it is: illegal — not to mention chaotic and maniacal. There is no happy ending to this story; but the least Washington could do is allow Syria to resolve its problems on its own, without further igniting a regional bloodbath.
* * *
Independent media is under attack — and we need your help to save it! Click here to become an Anti-Media patron.
Erdogan Chief Advisor Threatens To “Break The Legs” Of Greece’s PM
Yigit Bulut, chief advisor to Turkish President Erdogan, has threatened Greece over the disputed islet of Imia in the Eastern Aegean Sea.

“Athens will face the wrath of Turkey worse than that in Afrin,” Bulut said in a Television show of a private network.
“We will break the arms and legs of officials, of the Prime Minister and any Minister, who dares to step on the Kardak/Imia islet in the Aegean,” he claimed.

Yes, the video is in Turkish but who cares to translate full 40 seconds of a delirium talk?
As KeepTalkingGreece reports, Bultu’s threats come just a couple of days after Defense Minister Panos Kammenos sailed to Imia and threw a wreath into the sea to honor the three fallen soldiers during the Imia conflict in 1996.

Ankara does not miss a chance to challenge Greece’s sovereignty in the islets and islands of the Aegean Sea, escalate tension around Imia, and risk an ugly incident that could bring the two neighboring countries at the verge of an armed conflict as two decades ago.
6 .GLOBAL ISSUES
END
7. OIL ISSUES
8. EMERGING MARKET
Your early morning currency/gold and silver pricing/Asian and European bourse movements/ and interest rate settings FRIDAY morning 7:00 am
Euro/USA 1.2490 DOWN .0020/ REACTING TO MERKEL’S FAILED COALITION/ SPAIN VS CATALONIA/REACTING TO +GERMAN ELECTION WHERE ALT RIGHT PARTY ENTERS THE BUNDESTAG/ huge Deutsche bank problems + USA election:/TRUMP HEALTH CARE DEFEAT//ITALIAN REFERENDUM DEFEAT/AND NOW ECB TAPERING BOND PURCHASES/JAPAN TAPERING BOND PURCHASES /USA FALLING INTEREST RATES AGAIN/HOUSTON FLOODING/EUROPE BOURSES RED
USA/JAPAN YEN 109.88 UP 0.486 (Abe’s new negative interest rate (NIRP), a total DISASTER/SIGNALS U TURN WITH INCREASED NEGATIVITY IN NIRP/JAPAN OUT OF WEAPONS TO FIGHT ECONOMIC DISASTER/
GBP/USA 1.4221 DOWN .0044 (Brexit March 29/ 2017/ARTICLE 50 SIGNED
THERESA MAY FORMS A NEW GOVERNMENT/STARTS BREXIT TALKS/MAY IN TROUBLE WITH HER OWN PARTY/
USA/CAN 1.2318 UP .0061 (CANADA WORRIED ABOUT TRADE WITH THE USA WITH TRUMP ELECTION/ITALIAN EXIT AND GREXIT FROM EU/(TRUMP INITIATES LUMBER TARIFFS ON CANADA)
Early THIS FRIDAY morning in Europe, the Euro FELL by 20 basis points, trading now ABOVE the important 1.08 level RISING to 1.2457; / Last night Shanghai composite CLOSED UP 15.10 POINTS PR 0.44 % / Hang Sang CLOSED DOWN 40.31 POINTS OR 0.12% /AUSTRALIA CLOSED UP 0.50% / EUROPEAN BOURSES RED
The NIKKEI: this FRIDAY morning CLOSED DOWN 211.58 POINTS OR 0.90%
Trading from Europe and Asia:
1. Europe stocks OPENED RED
2/ CHINESE BOURSES / : Hang Sang CLOSED DOWN 40.31 POINTS OR 0.12% / SHANGHAI CLOSED UP 15.10 POINTS OR 0.44% /
Australia BOURSE CLOSED UP 0.50% /
Nikkei (Japan)CLOSED DOWN 211.58 POINTS OR 0.90%
INDIA’S SENSEX IN THE RED
Gold very early morning trading: 1345.30
silver:$17.14
Early FRIDAY morning USA 10 year bond yield: 2.7844% !!! UP 0 IN POINTS from THURSDAY night in basis points and it is trading WELL ABOVE resistance at 2.27-2.32%. (POLICY FED ERROR)/ALSO PAST THE KEY 2.70%
The 30 yr bond yield 3.302 UP 1 IN BASIS POINTS from THURSDAY night. (POLICY FED ERROR)
USA dollar index early FRIDAY morning: 88.85 UP 18 CENT(S) from THURSDAY’s close.
This ends early morning numbers FRIDAY MORNING
xxxxxxxxxxxxxxxxxxxxxxxxxxxxxxxxxxxxxxxxxxxxxxxxxxxxxxxxxxxxxxxxxxxxxxxxxxxxxxxxxxxxxxxxxxxxxxxxxxxxxxxxxxxxxxx
And now your closing FRIDAY NUMBERS \1 PM
Portuguese 10 year bond yield: 2.017% UP 7 in basis point(s) yield from THURSDAY/
JAPANESE BOND YIELD: +.0.086% DOWN 1 & 1/2 in basis points yield from THURSDAY/JAPAN losing control of its yield curve/
SPANISH 10 YR BOND YIELD: 1.472% UP 7 IN basis point yield from THURSDAY/
ITALIAN 10 YR BOND YIELD: 2.050 UP 9 POINTS in basis point yield from THURSDAY/
the Italian 10 yr bond yield is trading 58 points HIGHER than Spain.
GERMAN 10 YR BOND YIELD: +.767% UP 5 IN BASIS POINTS ON THE DAY
END
xxxxxxxxxxxxxxxxxxxxxxxxxxxxxxxxxxxxxxxxxxxxxxxxxxxxxxxxxxxxxxxxxxxxxxxxxxxxxxxxxxxxxxxxxxxxxxxxxxxxxxxxxxxxxxxxxxxxxxxxxxxxxxxxxxxxx
IMPORTANT CURRENCY CLOSES FOR FRIDAY
Closing currency crosses for FRIDAY night/USA DOLLAR INDEX/USA 10 YR BOND YIELD/1:00 PM
Euro/USA 1.2447 DOWN.0063 (Euro DOWN 63 Basis points/ represents to DRAGHI A COMPLETE POLICY FAILURE/
USA/Japan: 110.39 UP 1.001 Yen DOWN 101 basis points/
Great Britain/USA 1.4128 DOWN .0138( POUND DOWN 138 BASIS POINTS)
USA/Canada 1.2391 UP .0131 Canadian dollar DOWN 131 Basis points AS OIL FELL TO $64.78
xxxxxxxxxxxxxxxxxxxxxxxxxxxxxxxxxxxxxxxxxxxxxxxxxxxxxxxxxxxxxxxxxxxxxxxxxxxxxxxx
This afternoon, the Euro was DOWN 63 to trade at 1.2447
The Yen FELL to 110.39 for a LOSS of 101 Basis points as NIRP is STILL a big failure for the Japanese central bank/HELICOPTER MONEY IS NOW DELAYED/BANK OF JAPAN NOW WORRIED AS AS THEY ARE RUNNING OUT OF BONDS TO BUY AS BOND YIELDS RISE
The POUND FELL BY 138 basis points, trading at 1.4128/
The Canadian dollar FELL by 131 basis points to 1.2391/ WITH WTI OIL FALLING TO : $64.78
The USA/Yuan closed AT 6.3008
the 10 yr Japanese bond yield closed at +.086% DOWN 1 & 1/2 BASIS POINTS / yield/
Your closing 10 yr USA bond yield UP 6 IN basis points from THURSDAY at 2.845% //trading well ABOVE the resistance level of 2.27-2.32%) very problematic USA 30 yr bond yield: 3.084 UP 110 in basis points on the day /
THE RISE IN BOTH THE 10 YR AND THE 30 YR ARE VERY PROBLEMATIC FOR VALUATIONS
Your closing USA dollar index, 89.21 UP 54 CENT(S) ON THE DAY/1.00 PM/
Your closing bourses for Europe and the Dow along with the USA dollar index closing and interest rates for FRIDAY: 1:00 PM EST
London: CLOSED DOWN 46.96 POINTS OR 0.63%
German Dax :CLOSED DOWN 218.74 POINTS OR 1.68%
Paris Cac CLOSED DOWN 89.57 POINTS OR 1.64%
Spain IBEX CLOSED DOWN 187,90 POINTS OR 1.81%
Italian MIB: CLOSED DOWN 338.50 POINTS OR 1.44%
The Dow closed DOWN 665.75 POINTS OR 2.54%
NASDAQ WAS DOWN 144.92 Points OR 1.96% 4.00 PM EST
WTI Oil price; 64.78 1:00 pm;
Brent Oil: 68.09 1:00 EST
USA /RUSSIAN ROUBLE CROSS: 56.40 UP 44/100 ROUBLES/DOLLAR (ROUBLE LOWER BY 44 BASIS PTS)
TODAY THE GERMAN YIELD RISES TO +.767% FOR THE 10 YR BOND 1.00 PM EST EST
END
This ends the stock indices, oil price, currency crosses and interest rate closes for today 4:30 PM
Closing Price for Oil, 4:30 pm/and 10 year USA interest rate:
WTI CRUDE OIL PRICE 4:30 PM:$65.45
BRENT: $68.25
USA 10 YR BOND YIELD: 2.8411% THIS RAPID ASSENT IN YIELD IS VERY DANGEROUS/DERIVATIVES START TO BLOW UP
USA 30 YR BOND YIELD: 3.081%/BROKE GUNDLACH’S KEY 3.00% WHERE ALL VALUATIONS ON STOCKS BLOW UP/
EURO/USA DOLLAR CROSS: 1.2452 DOWN.0055 OR 55 BASIS POINTS
USA/JAPANESE YEN:110.14 UP 0.741/ YEN DOWN 74 BASIS POINTS
USA DOLLAR INDEX: 89.20 UP 52 cent(s)/
The British pound at 5 pm: Great Britain Pound/USA: 1.4109 : DOWN 155 POINTS FROM LAST NIGHT
Canadian dollar: 1.2421 DOWN 163 BASIS pts
German 10 yr bond yield at 5 pm: +0.767%
END
And now your more important USA stories which will influence the price of gold/silver
TRADING IN GRAPH FORM FOR THE DAY
Turmoil: Dow’s Biggest Point Rout Since Lehman; Bonds, Bitcoin Crash
This week for Bitcoin, Bonds, and Bullish stockholders…
Today, and this week, saw some extremes:
- This week was the worst for bonds & stocks combined since Feb 2009

- Dow’s biggest single-day drop since Brexit (June 2016)
- Dow’s biggest point drop since Lehman (Oct 2008!)
- Dow’s worst week since Jan 2016
- VIX’s biggest spike since Aug 2015 China Deval / Flash-Crash
- China’s Shanghai Comp worst week since Dec 2016
- China’s Shenzhen Comp worst week since Jan 2016
- Germany’s DAX worst week since Feb 2016
- 30Y UST Bond’s worst weekly drop since the election (Nov 2016)
- UST Yield Curve (2s30s) biggest steepening week since election (Nov 2016)
- High Yield Bond’s worst week since March 2017
- Dollar Index first weekly gain in two months
- Dollar Index biggest daily gain since Jan 2017
- Gold’s worst week in two months
- Silver’s worst week since July 2017
- Bitcoin’s worst week since Jan 2015
Where were the dip-buyers?!

China ugly..

Europe dumped into the red…

And US Stocks were crushed…

Futures show the chaos a little better – Friday’s melt-up, numerous v-shaped recoveries this week as dip-buyers crambled back in… and then today!

And today was a bloodbath for stocks…

The Dow ended down 670 Points – the biggest point decline since Lehman in Oct 2008…

Year-to-Date, Trannies and Small Caps have given up most of their gains…

Retailers and Energy stocks were the big laggards but everything was whacked with banks tumbling today despite soaring rates and steepening curves…

VIX spiked to its highest since the election today…

Risk-Parity fund deleveraging was triggered again (with bonds and stocks down hard)…

Risk-Parity funds had their worst day since May 2017 today…

It appears the bond spike has spooked stocks…

In fact this is the worst day for aggregate losses in bonds and stocks since September 2016…

Bonds bloodbath’d on the day and week…

30Y Yields were within a tick or two of 3.10% this week…

The yield curve steepened notably on the week

And debt ceiling anxiety is back as the Bill curve inverts…

The Dollar Index managed its first weekly gain of the year, but remains well below the Trump rescue highs…

In commodity-land, everything was red on the week with silver getting monkey-hammered today…

Silver is back at 6-week lows..

Finally, there was carnage in cryptocurrencies this week, with a modest rescue today.

This was the worst week for Bitcoin since January 2015, back below $9,000…

And finally… remember, you are here…

end
The jobs report: payrolls jump 200,000 and earnings soar along with wage growth
(courtesy zerohedge)
Payrolls Jump 200K, Beating Expectations As Earnings Soar Most Since 2009
While Wall Street did expect a whisper number above the consensus forecast of 180K, the big question for today’s payrolls report was what would average hourly earnings – that critical leading indicator for inflation – do. Well, according to the BLS, while January payrolls did indeed beat, rising by 200K, above consensus…

… it was the average hourly earnings that slammed expectations, rising by 2.9% Y/Y (and up 0.3% M/M, exp. 0.2%) well above the 2.6% expected, and the highest print since Jun 2009.

However, it important to note that the only reason hourly earnings rose as much as they did is because the average weekly hours worked dropped sharply from 34.5 to 34.3. Meanwhile the average weekly earnings actually declined from 2.9% to 2.6%, with the number dropping from $919.43 in December to $917.18.

Elsewhere, the unemployment rate kept constant at 4.1%, as expected.

Going back to payrolls, the change in total nonfarm payroll employment for November was revised down from +252,000 to +216,000, and the change for December was revised up from +148,000 to +160,000. With these revisions, employment gains in November and December combined were 24,000 less than previously reported. After revisions, job gains have averaged 192,000 over the last 3 months.
In kneejerk response, Bill Gross just said that the jobs report “should send the 10Y yield to 3%”, and the report ensures the “Fed will continues to hike.”
Summarizing the report’s key details:
- U.S. Jan. Nonfarm Payrolls Rose 200k;
- Avg. hourly earnings Y/y 2.9%, prior 2.7% est. 2.6%
- U.S. Nonfarm private payrolls rose 196k vs prior 166k; est. 181k
- Manufacturing payrolls rose 15k after rising 21k in the prior month; economists estimated 20k, range 10k to 30k from 19 economists surveyed
- Unemployment Rate at 4.1%
- Unemployment rate 4.1% vs prior 4.1%; est. 4.1%
- Participation rate 62.7% vs prior 62.7%
- Avg. hourly earnings 0.3% m/m, est. 0.2%, prior 0.4%
- Underemployment rate 8.2% vs prior 8.1%
- Change in household employment 409k vs prior 104k
Some additional details:
Total nonfarm payroll employment rose by 200,000 in January. Employment continued to trend up in construction, food services and drinking places, health care, and manufacturing.
Construction added 36,000 jobs in January, with most of the increase occurring among specialty trade contractors (+26,000). Employment in residential building construction continued to trend up over the month (+5,000). Over the year, construction employment has increased by 226,000.
Employment in food services and drinking places continued to trend up in January (+31,000). The industry has added 255,000 jobs over the past 12 months.
Employment in health care continued to trend up in January (+21,000), with a gain of 13,000 in hospitals. In 2017, health care added an average of 24,000 jobs per month.
In January, employment in manufacturing remained on an upward trend (+15,000). Durable goods industries added 18,000 jobs. Manufacturing has added 186,000 jobs over the past 12 months.
Employment in other major industries, including mining, wholesale trade, retail trade, transportation and warehousing, information, financial activities, professional and business services, and government, changed little over the month.
The average workweek for all employees on private nonfarm payrolls declined by 0.2 hour to 34.3 hours in January. In manufacturing, the workweek declined by 0.2 hour to 40.6 hours, while overtime remained at 3.5 hours. The average workweek for production and nonsupervisory employees on private nonfarm payrolls edged down by 0.1 hour to 33.6
hours. (See tables B-2 and B-7.)
end
Initial reaction to the jobs growth:
Bond yields skyrocket (bond prices fall) stocks and gold drop. The yield on the 10 yr USA bond rises to 2.82% and that about kills off valuations on just about everything
(courtesy zerohedge)
Bonds, Stocks, Gold Drop After Wages Pop, Dollar Jumps
The dollar is spiking, along with Treasury yields as stocks and gold are slammed following the hotter-than-expected wage growth data from BLS…

Gold is suffering the most for now…

Stocks initially dropped, then algo-ramped, and are now back in the red post-payrolls…

Treasury yields spiked 5bps on the print…

The dollar spiked back towards Trump’s “rescue” highs…

And gold is down…

end
Not So Fast: Here’s The Full Story About Those “Surging Hourly Earnings”
With attention firmly fixated on today’s wage print earnings, economists – not to mention the Trump administration – were delighted to see a 2.9% spike in average hourly earnings, the biggest jump since June 2009, suggesting inflation is about to make a roaring comeback, and prompted the likes of Bill Gross to predict that the 10Y would hit 3.0% in the very near future.
Well, not so fast, because as a closer look at the data reveals, the only reason why average hourly earnings rose, is because the total weekly hours worked posted a relatively steep decline, dropping from 34.5 in December to 34.3 in January, a 2.9% drop from the 34.4 last January.

Meanwhile, average weekly earnings actually declined from December, dropping from $919.43 to $917.18 from December to January…

… which in turn meant no breakout in the average weekly earnings, which rose a far more modest 2.6%, and in fact declined from recent prints above 3.0%.

Finally, looking at the broadest segment of the labor force, the production and non-supervisory workers, average hourly earnings rose only 2.4%, indicating that the bulk of wage gains once again accrued to managers and supervisors.

So before dumping that 10Y or buying the dollar on the surge in “hourly” wages, maybe a question worth asking first is why did the average workweek decline by 2.9%, because if it had kept constantly, average hourly earnings would have barely increased, and the market’s reaction would be vastly different.
Where The Jobs Were In January: Who’s Hiring And Who Isn’t
January was expected to be a far stronger month for payrolls than December with adverse weather conditions gone, and that’s precisely what the BLS unveiled as employers added 200,000 jobs in January, while more importantly the average hourly earnings for workers rose 2.9% from a year earlier, to $26.74 from $25.99, even if this was largely the result of a sharp drop in hours worked.
So which sectors were responsible for the rebound in January employment?

As SouthBay Research summarizes, solid payroll strength was observed in Durable Goods Manufacturing (+18K) reflecting the generally stronger manufacturing environment.
Meanwhile, services was hit by weakness in Accounting and Education. Accountant hiring typically picks up in January but this year Accounting payrolls were softer than normal.

As a result, Accounting payrolls (seasonally adjusted) actually fell (-10K) in January. This development is particularly strange in light of the recent tax law changes that always boosts demand for accounting and bookkeeping support.
Also contributing to the softness was deeper-than-normal seasonal layoffs in Education payrolls (Winter break).

Pointing to underlying consumer spending is the boost in Construction (+36K) and Leisure/Hospitality (+35K). Businesses appear to be responding to continued strong consumer spending and hiring accordingly.
Meanwhile, Retail was soft (+15K) but that’s to be expected in light of the ongoing brick-and-mortar problems (i.e. the long-running debate if it’s a channel issue – Amazon – or consumer spending issue – record low savings).

Employment in food services and drinking places continued to trend up in January (+31,000); the industry has added 255,000 jobs over the past 12 months. Meanwhile, employment in manufacturing remained on an upward trend (+15,000) with Durable goods mfg industries adding 18,000 jobs.

Finally, as , below are the industries with the highest and lowest rates of employment growth for the most recent month: monthly growth rates are shown for the prior year.
18,000 jobs.
Black Unemployment Surges By The Most In 12 Years
Trump’s SOTU claim that black unemployment was at all time lows came perfectly timed, because if he had waited just 2 more days, the story would be very different.
According to the latest BLS data, while black unemployment in December was indeed the lowest on record, at 6.8%, something snapped in January and the unemployment rate for blacks snapped higher to 7.7%, the biggest monthly jump since November 2005, and the highest since April 2017!

That was one part of the racial divide. The other part is that while blacks clearly got the short end of the unemployment stick in January, whites were happy as the unemployment rate for White workers dropped to 3.5%, the lowest since January 2000, although we doubt that Trump will parade vocally with that particular statistic.

end
With a “strong” jobs report, why does the University of Michigan report that its economic confidence indicator has tumbled to its lowest levels since the election
(courtesy zerohedge)
UMich Economic Confidence Tumbles To Lowest Since Election
Following The Conference Board’s better-than-expected higher print (driven by ‘hope’), UMich saw confidence drop to its lowest since September as current economic conditions slumped to weakest since the election.
While ‘hope’ rose modestly from 84.3 to 86.3, current economic conditions slumped to the lowest since Nov 2016…

As UMich chief economist Richard Curtin notes, consumers continued to expect growth in jobs and incomes, but anticipated a slightly higher inflation rate.
Importantly, the motivating force behind purchase decisions has shifted from discounts on prices and interest rates to increased confidence in future job security and growth in wages as well as financial assets. This renewed sense of confidence was responsible for the recent declines in savings rates.
The tax cuts will increase discretionary spending once higher energy bills due to the unusually cold weather are paid. Monetary policy will need to tighten in the year ahead, but given consumers’ decade long experience with record low interest rates, only modest increases in interest rates will be sufficient to curb any excesses. Overall, the data signal an expected gain of 2.8% in real personal consumption expenditures during 2018.
Stock price increases and the passage of tax reforms were mentioned by all-time record numbers of consumers.
As a reminder, the yawning gap between exuberant confidence and desperately low savings rates has not ended well in the past…

Core Capital Goods Orders Tumble Most Since Sept 2016
Core capital expenditures tumbled twice as much as initially expected in December, dropping 0.6% MoM – the biggest drop since September 2016.
The preliminary print for December was 0.3% drop but final came in at an ugly 0.6% drop (which dragged the headline durable goods print down from 2.9% to 2.8%)

However, on the bright side, Factory Orders grew for the 5th straight month (rising a better than expected 1.7% MoM in December)…

Which means an 8.4% YoY rise in new manufacturing orders.
All USA companies report a slump in January car sales
(courtesy zerohedge)
US Auto Sales Slump In January As Car-Buyers ‘Turn Japanese’
2018 started off with a disappointment for the auto industry with total sales at 17.07mm SAAR (missing expectations and down from 17.76mm in Dec).

Domestic auto sales dropped notably to 13.10mm in January – that is the biggest Dec-to-Jan drop since 2010…

US automakers suffered the most (Ford sales -6.3%) but Japanese makers surged (Toyota, Nissan up double-figures).

As Bloomberg reports, General Motors, Ford, and Fiat Chrysler all posted U.S. sales that fell short of analysts’ estimates for last month, as demand plunged for domestic sedans including the Chevrolet Cruze and Ford Fusion. Toyota Motor, and Nissan Motor, meanwhile, boosted deliveries thanks to RAV4 and Rogue crossover models.
The Detroit Three are coming off the first annual sales drop in their home market since the recession and are having a harder time coping with consumers abandoning passenger cars. Some automakers also may have endured a bit of a hangover — the industry ended 2017 with its best showings of the year, thanks in part to heavy discounting.
“This is a bumpier start to the year than we expected,” Jeff Schuster, an analyst with LMC Automotive, said by phone. “Payback plays a role here after the robust fourth quarter of last year and the heightened level of incentives.”
To be sure, January wasn’t a slam dunk for the Japanese automakers. Honda reported a surprise decline. And Barclays Plc analysts who predicted the big jump for Toyota said in an email that the company boosted sales to fleets during the month.
About 29 percent of Nissan’s U.S. deliveries were to fleet customers — including its own dealers — during the first 11 months of last year, according to Autotrader.
“It is safe to assume that Nissan will still rely heavily on rental sales to start 2018 to gain market share,” said Zohaib Rahim, an analyst for the car-shopping website.
And there’s a downside to automakers having managed to keep sales more or less steady: use of heavy discounts.
“In the face of very high consumer confidence, low interest rates, low gas prices, longer and longer loan terms, we’re still seeing the pedal through the floorboards on incentives,” said Mark Wakefield, head of the auto practice at consultant AlixPartners.“You’re training consumers to look for the deal.”
end
My goodness: NEWSWEEK publisher caught defrauding the Government Agency in an ad revenue scheme
(courtesy zerohedge)
Newsweek Publisher Caught Defrauding Gov Agency In Ad Revenue Scheme
A scheme by the publisher of Newsweek and the International Business Times to buy fraudulent traffic in order to help secure a major ad contract from a US government agency has come to light in a new report released by independent ad fraud researchers.
According to the report, IBTimes.com won a major video and display advertising contract from the Consumer Financial Protection Bureau (CFPB) – a federal oversight agency created six years ago as the brainchild of Senator Elizabeth Warren. Social Puncher, a consulting firm that investigates online ad fraud, notes in its report that “ads purchased by the CFPB were displayed to an audience that includes a significant amount of “cheap junk traffic with a share of bots“ – effectively defrauding the agency.


When it comes to IBT’s fraudulent traffic practices, Social Puncher’s findings align with reporting from BuzzFeed News on IBT India, and with separate data gathered by Pixalate, an ad fraud detection company, and DoubleVerify, a digital media measurement company. (Social Puncher and BuzzFeed News previously collaborated on ad fraud investigations, but worked separately in this case.)
Based on what it described as a detailed investigation, DoubleVerify this week classified IBT’s US, UK, India, and Singapore sites as “as having fraud or sophisticated invalid traffic,” according COO Matt McLaughlin. DoubleVerify is now blocking all ad impressions on these sites on behalf of customers.
In response to questions from BuzzFeed News, Newsweek Media Group, the parent company of IBT, acknowledged it purchases audiences from ad networks that sell pop-up and pop-under traffic. It said this traffic represents a “small percentage of traffic on our sites” and denied any fraudulent activity. –Buzzfeed
“We use third-party platforms to verify and filter this traffic to ensure it is of the highest quality. This verification process prevents poor-quality traffic being redirected to our sites and we consistently score highly on various third-party ad verification platforms,” the company said. It declined to name the third-party verification partners it works with.
The CFPB, now headed by Trump appointee Mick Mulvaney, told BuzzFeed News that the bureau is looking into the allegations.
“We take allegations of fraud very seriously. Acting Director Mulvaney is actively looking into the work done by GMMB, and these allegations [of ad fraud by IBTimes.com] will be investigated as part of that process,” the spokesperson said.


The CFPB has come under fire in recent months after it was discovered that the agency established a “secret slush fund” to funnel penalties collected from defendants to Democrat causes.
A consultant who worked with the highly politicized Consumer Financial Protection Bureau (CFPB) claims the organization funneled a large portion of over $5 billion in collected penalties to “community organizers aligned with Democrats” as part of a giant slush fund, the Post reported in early December.
[The CFPB] Funneled a large portion of the more than $5 billion in penalties collected from defendants to community organizers aligned with Democrats — “a slush fund by another name,” said a consultant who worked with CFPB on its Civil Penalty Fund and requested anonymity.

Created six years ago as the brainchild of Senator Elizabeth Warren and slipped into the Dodd Frank bill before it was passed by Congressional Democrats, the CFPB became one of the most powerful agencies in D.C., with the ability to exercise enormous power over the U.S. economy while its budget remained unencumbered by congressional oversight. As one Hill writer put it:
The problem is that this agency and its director were set up to be free from the control of the Congress. Congress’s fundamental obligation to oversee and fund such bureaus or agencies is short-circuited when it comes to the CFPB. In structuring it in the manner written by now-Sen. Warren (D-Mass.), the law abrogated the idea of a government by the people, for the people and of the people.
Instead, it established an autocratic and unaccountable power center for people of Warren’s ideological persuasion — those who view our market economy as an enemy that must be managed by a chosen few. The creation of the CFPB as a rogue agency with a dictatorial leader is one of the most significant acts of malfeasance perpetrated on the American constitutional system since the Sedition Acts of 1798.
The Consumer Financial Protection Bureau, or CFPB, has been a total disaster as run by the previous Administrations pick. Financial Institutions have been devastated and unable to properly serve the public. We will bring it back to life!
With the reins of the CPFB handed over to Mick Mulvaney in December following the resignation of Obama-era Director Richard Cordray, it appears that IBTimes.com’s government-funed gravy train has just been derailed.
END
FISA Frivolity: FBI Warns Memo Could Undermine Faith In Massive, Unaccountable Secret Agencies
With the moment of truth – over-hyped dud or Democratic-establishment-crushing dream – looming in less than 24 hours, the headlines, finger-pointing, pettiness, and back-stabbing has reached 11 on the Spinal Tap amplifier of debacle… to the point where some humor in this FISA farce may help everyone get through the weekend.

The following is the latest to cross the wires…
Stressing that such an action would be highly reckless, FBI Director Christopher Wray warned Thursday that releasing the “Nunes Memo” could potentially undermine faith in the massive, unaccountable government secret agencies of the United States.
“Making this memo public will almost certainly impede our ability to conduct clandestine activities operating outside any legal or judicial system on an international scale,” said Wray, noting that it was essential that mutual trust exist between the American people and the vast, mysterious cabal given free rein to use any tactics necessary to conduct surveillance on U.S. citizens or subvert religious and political groups.
“If we take away the people’s faith in this shadowy monolith exempt from any consequences, all that’s left is an extensive network of rogue, unelected intelligence officers carrying out extrajudicial missions for a variety of subjective, and occasionally personal, reasons.”
At press time, Wray confirmed the massive, unaccountable government secret agencies were unaware of any wrongdoing for violating constitutional rights.
end
The memo is released and everything that we speculated on has proven to be true
I outlined the key points in red.
(courtesy zerohedge)
FISA Memo Released: Here’s What It Says
Moments ago, the House Intel “FISA” memo authored by Devin Nunes was officially declassified, and according to the Washington Examiner’s Byron York who has access to an early released version, a key point is that the salacious and still unproven Steele dossier formed the essential part of the initial and all three renewal applications against Carter Page, in line with what as previously leaked.
As York also explicitly highlights, “The FBI’s Andrew McCabe confirmed to the committee that no FISA warrant would have been sought from the FISA Court without the Steele dossier information.“
This, as Fox News confirms, means that absent the dossier, at least one of the surveillance warrants in the case would not have been obtained, and – by implication – the entire Mueller probe is thus on shaky legal ground.
Back to the memo, which as York adds, “the political origins of the Steele dossier were known to senior DOJ and FBI officials, but excluded from the FISA applications.”
More House Intel memo key point: The political origins of the Steele dossier were known to senior DOJ and FBI officials, but excluded from the FISA applications. http://ow.ly/QCag30iaosG
House Intel memo released: What it says
The House Intelligence Committee has released its controversial memo outlining alleged abuses of secret surveillance by the FBI and Justi…
washingtonexaminer.com

As Dow Jones confirms, DOJ officials knew Steele was being paid by democrats, and that officials at the DOJ and FBI signed one warrant, and three renewals against Carter Page.
York also notes that DOJ official Bruce Ohr was relayed information about Christopher Steele’s bias. Steele told Ohr that he, Steele, was desperate that Donald Trump not get elected president and was passionate about him not becoming president.
All else equal, sounds like a clear case of bias, and when extended, it would imply that the entire Mueller probe is base on grounds that could be overturned in court.
* *
To recap, here are the key points disclosed in the memo, as summarized by the Washington Exmainer which has an early unclassified version of the memo:
- The Steele dossier formed an essential part of the intial and all three renewal FISA applications against Carter Page.
- Andrew McCabe confirmed that no FISA warrant would have been sought from the FISA Court without the Steele dossier information.
- The political origins of the Steele dossier were known to senior DOJ and FBI officials, but excluded from the FISA applications.
- DOJ official Bruce Ohr met with Steele beginning in the summer of 2016 and relayed to DOJ information about Steele’s bias. Steele told Ohr that he, Steele, was desperate that Donald Trump not get elected president and was passionate about him not becoming president.
As a reminder, the FBI and Justice Department mounted a months-long effort to keep the information outlined in the memo out of the House Intelligence Committee’s hands. Only the threat of contempt charges and other forms of pressure forced the FBI and Justice to give up the material.
Once Intelligence Committee leaders and staff compiled some of that information into the memo, the FBI and Justice Department, supported by Capitol Hill Democrats, mounted a ferocious campaign of opposition, saying release of the memo would endanger national security and the rule of law.
But Intelligence Committee chairman Devin Nunes never wavered in his determination to make the information available to the public. President Trump agreed, and, as required by House rules, gave his approval for release.
Finally, the memo released today does not represent the sum total of what House investigators have learned in their review of the FBI and Justice Department Trump-Russia investigation. That means the fight over the memo could be replayed in the future when the Intelligence Committee decides to release more information.
Moments after the announcement that the memo was declassified, Trump spoke to reporters and was asked if the memo makes it more likely that he will fire Deputy AG Rod Rosenstein, to which Trump responded.

When asked if the memo makes it more likely he will fire Deputy Attorney General Rod Rosenstein, Trump responds: “You figure that one out.”
Full memo below (pdf link):
Stocks Slump, VIX Spikes On Memo Release
While US equity markets were already fading from payrolls, the headlines of what is alleged within ‘the memo’ appears to have spooked stocks, legging The Dow to new lows, down 400pts…

With The Dow back at 2-week lows…

And VIX spiked above 15.00…

Democrats Warn Trump Not To Use FISA Memo As Pretext To Fire Mueller, Rosenstein
Now that it has become clear why the FBI and DOJ (together “the Deep State”), the media, and Democrats did not want the FISA memo released – as it indicates that Mueller’s entire probe may be based on a memo that was the result of explicit political bias, it was only a matter of time before Democrats took the next logical step, which of course is, to warn Trump not to use the memo exposing transgressions at the FBI in obtaining the FISA warrant, to fire Mueller and Rosenstein.
Sure enough, the first official statement by top House and Senate Democrats after the memo dropped, was to write a letter to Pres. Trump warning that use of the newly-released memo as a pretext to fire either Special Counsel Bob Mueller or Deputy Attorney General Rod Rosenstein could spark a constitutional crisis.
“We are alarmed by reports that you may intend to use this misleading document as a pretext to fire Deputy Attorney General Rod Rosenstein, in an effort to corruptly influence or impede Special Counsel Bob Mueller’s investigation.
“We write to inform you that we would consider such an unwarranted action as an attempt to obstruct justice in the Russia investigation. Firing Rod Rosenstein, DOJ Leadership, or Bob Mueller could result in a constitutional crisis of the kind not seen since the Saturday Night Massacre!’
Letter from top House, Senate Democrats.
Whether Trump intends to fire Mueller or Rosenstein is still unknown: commenting on this during a meeting with reporters at the White House, when asked if the memo makes it more likely he will fire Deputy AG Rosenstein, Trump redponded cryptically: “You figure that one out.”
When asked if the memo makes it more likely he will fire Deputy Attorney General Rod Rosenstein, Trump responds: “You figure that one out.”
end
then the Dow crashes over 500 points
Dow Crashes 500 Points, VIX Tops 16
“No brainer?”
The Dow is down over 500 points…

And VIX is back above 16…

end
New text messages between our love birds discussed evading new security and monitoring issues and legal discovery
(courtesy zero hedge)
New Strzok/Page Texts Discuss Evading “Security/Monitoring Issues,” Legal Discovery
A new batch of text messages between anti-Trump FBI officials Peter Strzok and Lisa Page show that they wanted to “get around” technologically cumbersome data retention requirements to retain text messages.

The August 2016 messages discuss “piloting” a new program to “get around our security/monitoring issues,” noting that “Dd” (thought to be Deputy Director Andrew McCabe) “had a terrible time with his phone [redacted] which made him concerned for our folks all over the place.”
In a later portion of the exchange, Strzok notes that if he wanted to copy or take classified information, he “sure as hell” wouldn’t do it on his FBI issued phone.
The texts, detailed in a Wednesday letter from HSGAC Chairman Sen. Ron Johnson, read in part:
Ms. Page: Have a meeting with turgal about getting iphone in a day or so
Mr. Strzok: Oh hot damn. I’m happy to pilot that . . . We get around our security/monitoring issues?
Ms. Page:No, he’s proposing that we just stop following them. Apparently the requirement to capture texts came from omb, but we’re the only org (I’m told) who is following that rule. His point is, if no one else is doing it why should we.
Ms. Page: Helps that Dd had a terrible time with his phone [redacted] which made him concerned for our folks all over the place.
Ms. Page: These phones suck as much as they do because of the program we use to capture texts, full stop.
Mr. Strzok: No doubt.
Mr. Strzok: I’m not convinced short of OPR, that text capture capability really deters anything.
Mr. Strzok: If I want to copy/take classified, I’m sure as hell not going to do it on this phone.
Ms. Page: I thought it was more from a discovery perspective.
Mr. Strzok: Probably. So just make a rule no texts of a discoverable nature. Like you said, what are CBP, DEA, others doing?
Sen. Johnson requests “additional communications including texts, emails, memos, and voicemails relating to the FBI’s investigation of former Secretary of State Hillary Clinton, and candidates for the 2016 presidential election for 16 F.B.I. and DOJ officials.”
The letter also points to Deputy Director Andrew McCabe’s sudden resignation following a meeting with FBI Director Christopher Wray, who reportedly expressed concerns over the findings of FBI internal watchdog, Inspector General Michael Horowitz.
Johnson’s letter then requests answers to several questions along with requests for documents and communications from a variety of individuals.
On January 29, 2018 FBI Deputy Director Andrew McCabe reportedly resigned following “a private meeting with FBI Director Christopher A. Wray during which Wray expressed concern about the findings of an investigation by the Justice Department’s Inspector General.”
Accordingly, I respectfully request that the Department produce all text messages newly recovered sent or received by Peter Strzok and Lisa Page for the period December 14, 2016, to May 17, 2017. In addition, to ensure the Committee has a complete understanding of the FBI’s investigation, I respectfully request the following information and material:
1. Please produce all documents and communications, including but not limited to emails, memoranda, notes, text messages, iPhone instant messages, and voicemails, for the period January 1, 2015, to the present referring or relating to the FBI’s Midyear Exam investigation, the presence of classified information on Secretary of State Clinton’s private email server, or candidates for the 2016 presidential electionfor the following custodians:
- James Comey;
- James Rybicki;
- Andrew McCabe;
- John Giaclone
- James Turgal;
- David Bowdich;
- Jonathan Moffa;
- Peter Strzok;
- Lisa Page;
- Trisha Anderson;
- E.W. Priestap;
- George Toscas;
- Randy Coleman;
- Brian Brooks;
- Michael Kortan; and
- James Baker.
2. Please explain whether any of the individuals identified in question 1 have been affected by the apparent Samsung device software glitch that lost the text messages of Mr. Strzok and Ms. Page.
3. Please provide the calendars of the individuals named in question 1 from January 1, 2015 to the present.
4. Please explain how and when the Department of Justice became aware that the FBI failed to retain communications of FBI employees between approximately December 14, 2016 and May 17, 2017.
5. Has the FBI experienced similar failures to retain communications on other employee issued-devices?
6. Did the FBI issue iPhones for any individual on the midyear exam team? Please explain.
7. Please provide the email(s) Secretary Clinton sent President Obama while she was located in the “territory of a sophisticated adversary.”
Strzok was removed from Robert Mueller’s probe after the DOJ’s Inspector General Michael Horowitz discovered the trove of anti-Trump / pro-Clinton text messages between the two – who were having an extramarital affair. Stzok was shuffled into the HR department – where “problem employees” go, and Page is also still employed by the FBI.
The FBI agents investigating Hillary Clinton for mishandling classified info/Bleachbit, etc with a non-secure home brew server were discussing evasion of message archiving of their own messages. It’s insane…and they STILL WORK THERE.https://saraacarter.com/new-strzok-page-emails-discuss-evasion-message-archiving/ …pic.twitter.com/GuvLT2PJ0m
end
Trump blasts the FBI leadership in their roll with respect to the issuing of FISA warrants, illegally spying on USA citizens
(courtesy zerohedge)
Trump Blasts FBI Leadership For “Politicizing The Sacred Investigative Process”
After a week of intense speculation, Speaker Paul Ryan has backed President Trump’s wish to release the infamous “FISA Memo” on Friday (despite Nancy Pelosi’s demands that its main architect, House Intel Committee Chair Devin Nunes, be moved from his position), the president pushed back against accusations that he’s politicized federal law enforcement, claiming that the FBI’s leadership is truly to blame.
“The top Leadership and Investigators of the FBI and the Justice Department have politicized the sacred investigative process in favor of Democrats and against Republicans – something which would have been unthinkable just a short time ago. Rank & File are great people!,” the president said in the first of two tweets.
In the second, he included a quote from Judicial Watch head Tom Fitton about the Democratic skullduggery that was involved in the creation and funding of the memo, which may have been used improperly by the FBI to secure a FISA warrant against Trump campaign adviser Carter Page.
“‘You had Hillary Clinton and the Democratic Party try to hide the fact that they gave money to GPS Fusion to create a Dossier which was used by their allies in the Obama Administration to convince a Court misleadingly, by all accounts, to spy on the Trump Team.’ Tom Fitton, JW”
The top Leadership and Investigators of the FBI and the Justice Department have politicized the sacred investigative process in favor of Democrats and against Republicans – something which would have been unthinkable just a short time ago. Rank & File are great people!
“You had Hillary Clinton and the Democratic Party try to hide the fact that they gave money to GPS Fusion to create a Dossier which was used by their allies in the Obama Administration to convince a Court misleadingly, by all accounts, to spy on the Trump Team.” Tom Fitton, JW
Republican leaders have pushed back against Democrats’ objections by calling for increased transparency at the law enforcement agencies.
As reported on Thursday, Trump reportedly has viewed the memo and been briefed on its contents. Once he signs off, it will be up to Nunes and his peers to deliver the final OK.
Meanwhile, the FBI has promised to release a rebuttal of the four-page memo that it says provides crucial details and context for the information compiled by Nunes, while also warning that the bureau has “grave concerns” about the memo’s release. Meanwhile, one Republican lawmaker said the FBI is right to be concerned – because the revelations in the memo will “shake the FBI to its core”…
Some of Trump’s critics have warned about the national security implications of releasing the memo over the FBI’s objections. Former CIA Director Leon Panetta even went so far as to say the release could even trigger “a constitutional crisis,” during an interview with NBC’s Chuck Todd.
Nunes has said the memo contains evidence of “egregious abuses” of the FISA power by the FBI during the Obama era.
On Thursday, Rep. Jeff Duncan said that “Having read “The Memo,” the FBI is right to have “grave concerns” – as it will shake the organization down to its core – showing Americans just how the agency was weaponized by the Obama officials/DNC/HRC to target political adversaries.”
Having read “The Memo,” the FBI is right to have “grave concerns” – as it will shake the organization down to its core – showing Americans just how the agency was weaponized by the Obama officials/DNC/HRC to target political adversaries. #ReleaseTheMemo
END
The Obama State department under the stewardship of John Kerry secretly distributed its own
“dossier” leaking it to Sen Cardin, a democrat from Maryland in an attempt to undermine Trump once he assumed the Presidency. This is according to new Freedom of Information documents
(courtesy zero hedge)
Obama State Dept Secretly Distributed Its Own “Dossier” To Undermine Trump, FOIA Docs Reveal
Watchdog group Judicial Watch released 42 pages of heavily redacted State Department documents obtained through the Freedom of Information Act (FOIA), which reveal that the Obama State Department provided Senator Ben Cardin (D-MD) a “dossier of classified information on Russia” in order to undermine President Trump, according to Judicial Watch President Tom Fitton.
“These documents show the Obama State Department under John Kerry gathered and sent its own dossier of classified information on Russia to Senator Ben Cardin, a political ally in the U.S. Senate, to undermine President Trump,” said Judicial Watch President Tom Fitton. “Judicial Watch will pursue information on who pulled this classified information, who authorized its release, and why was it evidently dumped just days before President Trump’s inauguration.”

The documents show Russian political interference in elections and politics in countries across Europe.
According to a March 2017 report in the Baltimore Sun: “Maryland Sen. Ben Cardin received classified information about Russia’s involvement in elections when the Obama administration was attempting to disseminate that material widely across the government in order to aid in future investigations, according to a report Wednesday … Obama officials were concerned, according to the report [in The New York Times], that the Trump administration would cover up intelligence once power changed hands.” –Judicial Watch
In March 2017, Former Obama Deputy Assistant Secretary of Defense, Evelyn Farkas, made some stunning admissions during an interview with MSNBC’s Mika Brzezinski.

While discussing the mad scramble by the Obama administration to collect and preserve intelligence on alleged Russian election hacking before Obama left office, it appears that Farkas accidentally implicated the Obama White House in the surveillance of Trump’s campaign staff:
The Trump folks, if they found out how we knew what we knew about the Trump staff dealing with Russians, that they would try to compromise those sources and methods, meaning we would not longer have access to that intelligence. –Evelyn Farkas
Furthermore, Farkas effectively corroborated the March New York Times article which cited “Former American officials” as their anonymous source regarding efforts to leak this surveillance on the Trump team to Democrats across Washington DC.
I became very worried because not enough was coming out into the open and I knew that there was more. We have very good intelligence on Russia. So then I had talked to some of my former colleagues and I knew they were trying to also get information to the hill.
That’s why you have the leaking. –Evelyn Farkas
Farkas resigned from the Obama administration in September of 2015 – begging the question as to how she knew so much about what the previous administration and intelligence community was up to.
Trump Tower
A section of the documents obtained by Judicial Watch is titled “Pro-Kremlin NGOs and Think Tanks,” refers to “the Russian government funded Caucasus Research Network, which helped to spread anti-EU and NATO reports throughout the region. Also discussed is the Human Rights Accountability Global Initiative, which was founded by Natalia Veselnitskaya. The Initiative was reportedly “working to erode support for the Magnitsky Act (which imposes sanctions on … gross human rights violations). The organization screened an anti-Magnitsky film at Washington’s Newseum in June.”
Veselnitskaya infamously obtained a meeting with Donald Trump Jr. through associates of opposition research firm Fusion GPS, wherein she attempted to discuss the Magnitsky act before Trump Jr. shut down the meeting.
The Magnitsky Act attracted public attention earlier this year when it was reported Veselnitskaya obtained a meeting with Donald Trump Jr. with the purpose of seeking to undermine the act. It was reported that Russian President Vladimir Putin wanted to repeal the act at least in part because it targeted top Russian officials who had committed human rights violations and were the beneficiaries of a $230-million tax fraud that Magnitsky exposed. –Judicial Watch
END
HARVEY


