
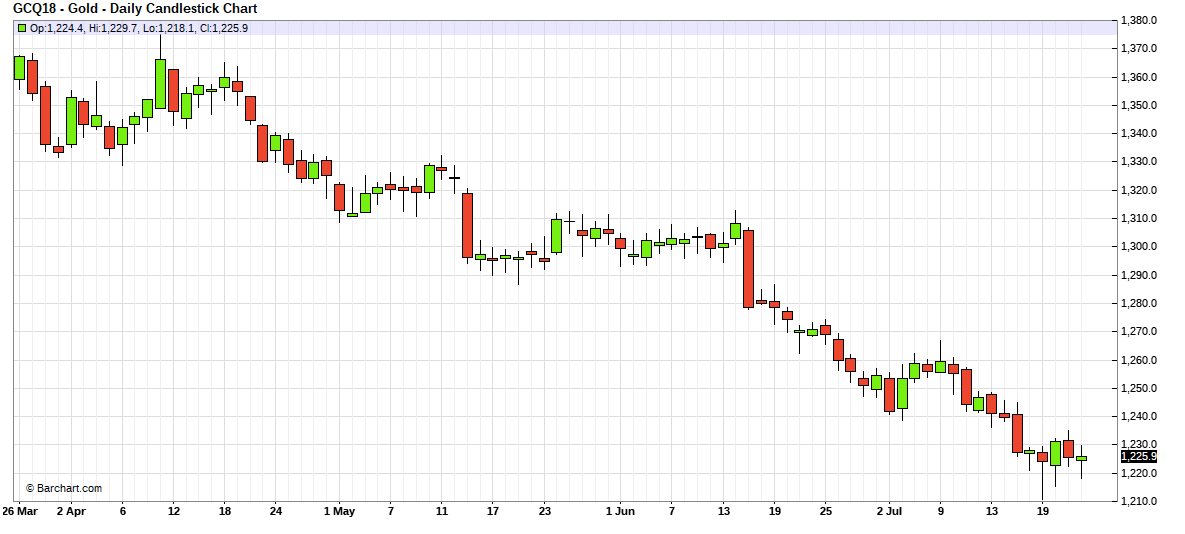
GOLD: $1224.65 UP $2.05 (COMEX TO COMEX CLOSINGS)
Silver: $15.56 UP 5 CENTS (COMEX TO COMEX CLOSINGS)
Closing access prices:
Gold $1224.10
silver: $15.53
For comex gold:
JULY/
NUMBER OF NOTICES FILED TODAY FOR AUGUST CONTRACT:37 NOTICE(S) FOR 3700 oz
TOTAL NOTICES SO FAR 37 FOR 3700 OZ (0.1150 tonnes)
For silver:
JULY
255 NOTICE(S) FILED TODAY FOR
1,275,000 OZ/
Total number of notices filed so far this month: 255 for 1,275,000 oz
XXXXXXXXXXXXXXXXXXXXXXXXXXXXXX
XXXXXXXXXXXXXXXXXXXXXXXXXXXXXX
Bitcoin: BID $7919/OFFER $8003: DOWN $198(morning)
Bitcoin: BID/ $7661/offer $7746: DOWN $457 (CLOSING/5 PM)
end
First Shanghai gold fix comes at 10 pm est
The second Shanghai gold fix: 2:15 pm
First Shanghai gold fix gold: 10 pm est: $1225.59
NY price at the same time:1220.70
PREMIUM TO NY SPOT: $4,89
XX
Second gold fix early this morning: $1225.69
USA gold at the exact same time:$1221.95
PREMIUM TO NY SPOT: $3.74
China is controlling the gold market
WE WILL NOT PROVIDE LONDON FIXES AS THEY ARE NOT ACCURATE AS TO WHAT IS GOING ON AT THE SAME TIME FRAME.
Let us have a look at the data for today
xxxxxxxxxxxxxxxxxxxxxxxxxxxxxxxxxxxxxxxxxxxxxxxxxxxxxxxxxxxxxxxxxxxxxxxxxx
In silver, the total OPEN INTEREST ROSE BY A CONSIDERABLE SIZED 2461 CONTRACTS FROM 218,477 UP TO 220,908 DESPITE YESTERDAY’S TINY 3 CENT GAIN IN SILVER PRICING AT THE COMEX. WE HAVE NOW WITNESSED A SLOW COMEX ACCUMULATION THESE PAST SEVERAL DAYS. ON TOP OF THIS WE HAVE ALSO WITNESSED A LARGE AMOUNT OF PHYSICAL METAL STAND FOR COMEX DELIVERY(WELL OVER 30 MILLION OZ AT THE COMEX) AS WELL AS CONSIDERABLE LONGS PACKING THEIR BAGS AND MIGRATING OVER TO LONDON IN GREATER NUMBERS IN THE FORM OF EFP’S. WE WERE NOTIFIED THAT WE HAD A SMALL SIZED NUMBER OF COMEX LONGS TRANSFERRING THEIR CONTRACTS TO LONDON THROUGH THE EFP: 617 EFP’S FOR SEPT. , 0 EFP’S FOR DECEMBER AND ZERO FOR ALL OTHER MONTHS AND THEREFORE TOTAL ISSUANCE: OF 617 CONTRACTS. WITH THE TRANSFER OF 800 CONTRACTS, WHAT THE CME IS STATING IS THAT THERE IS NO SILVER (OR GOLD) TO BE DELIVERED UPON AT THE COMEX AS THEY MUST EXPORT THEIR OBLIGATION TO LONDON. ALSO KEEP IN MIND THAT THERE CAN BE A DELAY OF 24-48 HRS IN THE ISSUING OF EFP’S. THE 617 EFP CONTRACTS TRANSLATES INTO 3.085 MILLION OZ AND ACCOMPANYING:
1.THE 3 CENT GAIN IN SILVER PRICE AT THE COMEX AND
2. THE STRONG AMOUNT OF SILVER OUNCES WHICH STOOD FOR THE JUNE/2018 COMEX DELIVERY MONTH. (5.420 MILLION OZ) 30.370 MILLION OZ FINALLY STANDING FOR DELIVERY IN JULY, AND NOW 3.260 MILLION OZ FOR AUGUST.
ACCUMULATION FOR EFP’S/SILVER/J.P.MORGAN’S HOUSE OF BRIBES, / STARTING FROM FIRST DAY NOTICE/FOR MONTH OF JULY:
34,568 CONTRACTS (FOR 21 TRADING DAYS TOTAL 34,568 CONTRACTS) OR 172.84 MILLION OZ: (AVERAGE PER DAY: 1646 CONTRACTS OR 8.230 MILLION OZ/DAY)
TO GIVE YOU AN IDEA AS TO THE HUGE SUPPLY THIS MONTH IN SILVER: SO FAR THIS MONTH OF JULY: 172.84 MILLION PAPER OZ HAVE MORPHED OVER TO LONDON. THIS REPRESENTS AROUND 24.25% OF ANNUAL GLOBAL PRODUCTION (EX CHINA EX RUSSIA)* JUNE’S 345.43 MILLION OZ IS THE SECOND HIGHEST RECORDED ISSUANCE OF EFP’S AND IT FOLLOWED THE RECORD SET IN APRIL 2018 OF 385.75 MILLION OZ.
ACCUMULATION IN YEAR 2018 TO DATE SILVER EFP’S: 1,832.57 MILLION OZ.
ACCUMULATION FOR JAN 2018: 236.879 MILLION OZ
ACCUMULATION FOR FEB 2018: 244.95 MILLION OZ
ACCUMULATION FOR MARCH 2018: 236.67 MILLION OZ
ACCUMULATION FOR APRIL 2018: 385.75 MILLION OZ
ACCUMULATION FOR MAY 2018: 210.05 MILLION OZ
ACCUMULATION FOR JUNE 2018: 345.43 MILLION OZ
ACCUMULATION FOR JULY 2018: 172.84 MILLION OZ
RESULT: WE HAD A CONSIDERABLE SIZED INCREASE IN COMEX OI SILVER COMEX CONTRACTS OF 2461 DESPITE THE TINY 3 CENT GAIN IN SILVER PRICING AT THE COMEX YESTERDAY. THE CME NOTIFIED US THAT WE HAD A SMALL SIZED EFP ISSUANCE OF 617 CONTRACTS WHICH EXITED OUT OF THE SILVER COMEX AND TRANSFERRED THEIR OI TO LONDON AS FORWARDS. SPECULATORS CONTINUED THEIR INTEREST IN ATTACKING THE SILVER COMEX FOR PHYSICAL SILVER (SEE COMEX DATA) . FROM THE CME DATA: 617 EFP’S FOR SEPT, 0 EFP’S FOR DECEMBER AND ZERO FOR ALL OVER MONTHS FOR A DELIVERABLE FORWARD CONTRACT OVER IN LONDON WITH A FIAT BONUS (TOTAL: 617). TODAY WE GAINED A GOOD SIZED: 3078 TOTAL OI CONTRACTS ON THE TWO EXCHANGES:
i.e 617 OPEN INTEREST CONTRACTS HEADED FOR LONDON (EFP’s) TOGETHER WITH AN INCREASE OF 2461 OI COMEX CONTRACTS. AND ALL OF THIS DEMAND HAPPENED WITH A 3 CENT GAIN IN PRICE OF SILVER AND A CLOSING PRICE OF $15.51 WITH RESPECT TO YESTERDAY’S TRADING. YET WE HAD A GIGANTIC AMOUNT OF SILVER STANDING AT THE COMEX FOR DELIVERY IN THE BIG JULY DELIVERY MONTH OF SLIGHTLY OVER 30 MILLION OZ AND NOW IN AUGUST ANOTHER BIG 3.620 MILLION OZ IN A NON ACTIVE MONTH. IT SURE LOOKS LIKE ANOTHER FAILED BANKER SHORT COVERING EXERCISE AS BANKERS ARE SCRAMBLING TO COVER THEIR HUGE SHORTFALL.
In ounces AT THE COMEX, the OI is still represented by OVER 1 BILLION oz i.e. 1.106 MILLION OZ TO BE EXACT or 157% of annual global silver production (ex Russia & ex China).
FOR THE NEW FRONT JULY MONTH/ THEY FILED AT THE COMEX: 255 NOTICE(S) FOR 1,275,000 OZ OF SILVER
IN SILVER, WE SET THE NEW RECORD OF OPEN INTEREST AT 243,411 CONTRACTS ON APRIL 9.2018. AND AGAIN THIS HAS BEEN SET WITH A LOW PRICE OF $16.51
ON THE DEMAND SIDE WE HAVE THE FOLLOWING:
- HUGE AMOUNTS OF SILVER STANDING FOR DELIVERY (MARCH/2018: 27 MILLION OZ , APRIL/2018 : 2.485 MILLION OZ MAY: 36.285 MILLION OZ ; JUNE/2018 (5.420 MILLION OZ) AND JULY 2018 AMOUNT FINALLY STANDING: 30.370 MILLION OZ ) AND NOW FOR AUGUST 3.260 MILLION OZ.
- HUGE RECORD OPEN INTEREST IN SILVER 243,411 CONTRACTS (OR 1.217 BILLION OZ/ SET APRIL 9/2018
- HUGE ANNUAL EFP’S ISSUANCE EQUAL TO 2.9 BILLION OZ OR 400% OF SILVER ANNUAL PRODUCTION/2017
- RECORD SETTING EFP ISSUANCE FOR ANY MONTH IN SILVER; APRIL/2018/ 385.75 MILLION OZ/ AND THE SECOND HIGHEST RECORDED EFP ISSUANCE JUNE 2018 345.43 MILLION OZ
AND YET, WITH THE EXTREMELY HIGH EFP ISSUANCE, WE HAVE A CONTINUAL LOW PRICE OF SILVER DESPITE THE ABOVE HUGE DEMAND. TO ME THE ONLY ANSWER IS THAT WE HAVE SOVEREIGN (CHINA) WHO IS ENDEAVOURING TO GOBBLE UP ALL AVAILABLE PHYSICAL SILVER NO MATTER WHERE, EXACTLY WHAT J.P.MORGAN IS DOING. AND IT IS MY BELIEF THAT J.P.MORGAN IS HOLDING ITS SILVER FOR ITS BENEFICIAL OWNER..THE USA GOVERNMENT WHO IN TURN IS HOLDING THAT SILVER FOR CHINA.(FOR A SILVER LOAN REPAYMENT).
IN GOLD, THE OPEN INTEREST FELL BY ANOTHER HUMONGOUS SIZED 13,577 CONTRACTS DOWN TO 449,871 DESPITE THE SMALL FALL IN THE COMEX GOLD PRICE/YESTERDAY’S TRADING (A LOSS IN PRICE OF $0.95). GENERALLY WE SEE COMEX LIQUIDATION WHEN WE ARE ENTERING THE LAST DAYS IN THIS ACTIVE DELIVERY MONTH OF JULY AND IT SURELY HAPPENED ON FRIDAY. WE GENERALLY SEE THE BOYS CASHING IN THEIR COMEX LONGS TO BEGIN THE PROCESS TO MOVE INTO LONDON FORWARDS. THIS PROCEDURE HAS BEEN GOING ON NOW FOR OVER 2 AND 1/2 YEARS. THE CME RELEASED THE DATA FOR EFP ISSUANCE AND IT TOTALED A FAIR SIZED 4,238 CONTRACTS:
AUGUST SAW THE ISSUANCE OF: 0 CONTRACTS, OCTOBER SAW THE ISSUANCE OF 0 CONTRACTS AND DECEMBER HAD AN ISSUANCE OF 4238 CONTACTS AND THEN ALL OTHER MONTHS ZERO. The new COMEX OI for the gold complex rests at 449,871. ALSO REMEMBER THAT THERE WILL BE A DELAY IN THE ISSUANCE OF EFP’S. THE BANKERS REMOVE LONG POSITIONS OF COMEX GOLD IMMEDIATELY. THEN THEY ORCHESTRATE THEIR PRIVATE EFP DEAL WITH THE LONGS AND THAT COULD TAKE AN ADDITIONAL 48 HRS SO WE GENERALLY DO NOT GET A MATCH WITH RESPECT TO DEPARTING COMEX LONGS AND NEW EFP LONG TRANSFERS. . EVEN THOUGH THE BANKERS ISSUED THESE MONSTROUS EFPS, THE OBLIGATION STILL RESTS WITH THE BANKERS TO SUPPLY METAL BUT IT TRANSFERS THE RISK TO A LONDON BANKER OBLIGATION AND NOT A NEW YORK COMEX OBLIGATION. LONGS RECEIVE A FIAT BONUS TOGETHER WITH A LONG LONDON FORWARD. THUS, BY THESE ACTIONS, THE BANKERS AT THE COMEX HAVE JUST STATED THAT THEY HAVE NO APPRECIABLE METAL!! THIS IS A MASSIVE FRAUD: THEY CANNOT SUPPLY ANY METAL TO OUR COMEX LONGS BUT THEY ARE QUITE WILLING TO SUPPLY MASSIVE NON BACKED GOLD (AND SILVER) PAPER KNOWING THAT THEY HAVE NO METAL TO SATISFY OUR LONGS. LONDON IS NOW SEVERELY BACKWARD IN BOTH GOLD AND SILVER AND WE ARE WITNESSING DELAYS IN ACTUAL DELIVERIES.
IN ESSENCE WE HAVE ANOTHER STRONG OI LOSS IN TOTAL CONTRACTS ON THE TWO EXCHANGES OF 9339 CONTRACTS: 13,577 OI CONTRACTS DECREASED AT THE COMEX AND 4,238 EFP OI CONTRACTS WHICH NAVIGATED OVER TO LONDON. THUS TOTAL OI LOSS: 9339 CONTRACTS OR 933900 OZ = 29.04 TONNES. AND ALL OF THIS MONSTROUS LOSS IN DEMAND OCCURRED WITH THE TINY FALL IN THE PRICE OF GOLD/ YESTERDAY TO THE TUNE OF $0.95.
YESTERDAY, WE HAD 11,249 EFP’S ISSUED.
ACCUMULATION OF EFP’S GOLD AT J.P. MORGAN’S HOUSE OF BRIBES: (EXCHANGE FOR PHYSICAL) FOR THE MONTH OF JUNE : 194,658 CONTRACTS OR 19,465,800 OZ OR 605.468 TONNES (21 TRADING DAYS AND THUS AVERAGING: 9269 EFP CONTRACTS PER TRADING DAY OR 926,900 OZ/ TRADING DAY),,
TO GIVE YOU AN IDEA AS TO THE HUGE SIZE OF THESE EFP TRANSFERS : THIS MONTH IN 21 TRADING DAYS IN TONNES: 605.468 TONNES
TOTAL ANNUAL GOLD PRODUCTION, 2017, THROUGHOUT THE WORLD EX CHINA EX RUSSIA: 2555 TONNES
THUS EFP TRANSFERS REPRESENTS 605.468/2550 x 100% TONNES = 23.74% OF GLOBAL ANNUAL PRODUCTION SO FAR IN JULY ALONE.***
ACCUMULATION OF GOLD EFP’S YEAR 2018 TO DATE: 4,708.41* TONNES *SURPASSED ANNUAL PROD’N
ACCUMULATION OF GOLD EFP’S FOR JANUARY 2018: 653.22 TONNES (21 TRADING DAYS)
ACCUMULATION OF GOLD EFP’S FOR FEBRUARY 2018: 649.45 TONNES (20 TRADING DAYS)
ACCUMULATION OF GOLD EFP’S FOR MARCH 2018: 741.89 TONNES (22 TRADING DAYS)
ACCUMULATION OF GOLD EFP’S FOR APRIL 2018: 713.84 TONNES (21 TRADING DAYS)
ACCUMULATION OF GOLD EFP’S FOR MAY 2018: 693.80 TONNES ( 22 TRADING DAYS)
ACCUMULATION OF GOLD EFP FOR JUNE 2018 650.71 TONNES (21 TRADING DAYS)
ACCUMULATION OF GOLD EFP FOR JULY 2018 605.5 TONNES (21 TRADING DAYS)
WHAT IS ALARMING TO ME, ACCORDING TO OUR LONDON EXPERT ANDREW MAGUIRE IS THAT THESE EFP’S ARE BEING TRANSFERRED TO WHAT ARE CALLED SERIAL FORWARD CONTRACT OBLIGATIONS AND THESE CONTRACTS ARE LESS THAN 14 DAYS. ANYTHING GREATER THAN 14 DAYS, THESE MUST BE RECORDED AND SENT TO THE COMPTROLLER, GREAT BRITAIN TO MONITOR RISK TO THE BANKING SYSTEM. IF THIS IS INDEED TRUE, THEN THIS IS A MASSIVE CONSPIRACY TO DEFRAUD AS WE NOW WITNESS A MONSTROUS TOTAL EFP’S ISSUANCE AS IT HEADS INTO THE STRATOSPHERE.
Result: A HUMONGOUS SIZED DECREASE IN OI AT THE COMEX OF 13,577 DESPITE THE SMALL LOSS IN PRICING ($0.95 THAT GOLD UNDERTOOK ON YESTERDAY) // . WE ALSO HAD A FAIR SIZED NUMBER OF COMEX LONG TRANSFERRING TO LONDON THROUGH THE EFP ROUTE: 4238 CONTRACTS AS THESE HAVE ALREADY BEEN NEGOTIATED AND CONFIRMED. THERE OBVIOUSLY DOES NOT SEEM TO BE MUCH PHYSICAL GOLD AT THE COMEX. I GUESS IT EXPLAINS THE HUGE ISSUANCE OF EFP’S…THERE IS HARDLY ANY GOLD PRESENT AT THE GOLD COMEX FOR DELIVERY PURPOSES. IF YOU TAKE INTO ACCOUNT THE 4,238 EFP CONTRACTS ISSUED, WE HAD A VERY STRONG NET LOSS OF 9339 CONTRACTS IN TOTAL OPEN INTEREST ON THE TWO EXCHANGES:
4238 CONTRACTS MOVE TO LONDON AND 13,577 CONTRACTS DECREASED AT THE COMEX. (in tonnes, the LOSS in total oi equates to 26.80 TONNES). ..AND THIS LOSS IN DEMAND OCCURRED WITH A TINY LOSS OF $0.95 IN YESTERDAY’S TRADING AT THE COMEX!!!.
we had: 37 notice(s) filed upon for 3700 oz of gold at the comex.
xxxxxxxxxxxxxxxxxxxxxxxxxxxxxxxxxxxxxxxxxxxxxxxxxxxxxxxxxxx
With respect to our two criminal funds, the GLD and the SLV:
GLD...
WITH GOLD UP $2.05 TODAY: /
NO CHANGES IN GOLD INVENTORY AT THE GLD
/GLD INVENTORY 800.20 TONNES
Inventory rests tonight: 800.20 tonnes.
TO ALL INVESTORS THINKING OF BUYING GOLD THROUGH THE GLD ROUTE: YOU ARE MAKING A TERRIBLE MISTAKE AS THE CROOKS ARE USING WHATEVER GOLD COMES IN TO ATTACK BY SELLING THAT GOLD. IT SURE SEEMS TO ME THAT THE GOLD OBLIGATIONS AT THE GLD EXCEED THEIR INVENTORY
SLV/
WITH SILVER UP 5 CENTS TODAY :
NO CHANGE IN SILVER INVENTORY TONIGHT
/INVENTORY RESTS AT 329.433 MILLION OZ/
NOTE THE DIFFERENCE BETWEEN THE GLD AND SLV: THE CROOKS CAN RAID GOLD BECAUSE THEY DO HAVE SOME PHYSICAL. THEY DO NOT RAID SILVER PROBABLY BECAUSE THERE IS NO REAL SILVER INVENTORIES BEHIND THEM
end
First, here is an outline of what will be discussed tonight:
1. Today, we had the open interest in SILVER ROSE BY A CONSIDERABLE SIZED 2461 CONTRACTS from 218,477 UP TO 220,908 (AND CLOSER T0 THE NEW COMEX RECORD SET /APRIL 9/2017 AT 243,411/SILVER PRICE AT THAT DAY: $16.53). THE PREVIOUS RECORD OTHER THAN WAS ESTABLISHED AT: 234,787, SET ON APRIL 21.2017 OVER ONE YEAR AGO. THE PRICE OF SILVER ON THAT DAY: $17.89. OUR CUSTOMARY MIGRATION OF COMEX LONGS MORPH INTO LONDON FORWARDS CONTINUES AS OUR BANKERS USED THEIR EMERGENCY PROCEDURE TO ISSUE:
617 EFP CONTRACTS FOR SEPT., 0 EFP CONTRACTS FOR DECEMBER AND ALL OTHER MONTHS: ZERO. TOTAL EFP ISSUANCE: 617 CONTRACTS . EFP’S GIVE OUR COMEX LONGS A FIAT BONUS PLUS A DELIVERABLE PRODUCT OVER IN LONDON. IF WE TAKE THE OI GAIN AT THE COMEX OF 2461 CONTRACTS TO THE 617 OI TRANSFERRED TO LONDON THROUGH EFP’S, WE OBTAIN A GOOD NET GAIN OF 3197OPEN INTEREST CONTRACTS. THUS IN OUNCES, THE GAIN ON THE TWO EXCHANGES: 15.39 MILLION OZ!!! AND YET WE ALSO HAVE A STRONG DEMAND FOR PHYSICAL AS WE WITNESSED A FINAL STANDING OF GREATER THAN 30 MILLION OZ FOR JULY AND NOW ANOTHER STRONG 3,260 MILLION OZ FOR AUGUST... AND YET ALL OF THIS DEMAND OCCURRED DESPITE A 3 CENT PRICING GAIN AT THE SILVER COMEX.
RESULT: A SMALL SIZED INCREASE IN SILVER OI AT THE COMEX DESPITE THE 3 CENT PRICING GAIN THAT SILVER UNDERTOOK IN PRICING YESTERDAY. BUT WE ALSO HAD A SMALL SIZED 652EFP’S ISSUED TRANSFERRING COMEX LONGS OVER TO LONDON. TOGETHER WITH THE STRONG SIZED AMOUNT OF SILVER OUNCES STANDING FOR JULY, DEMAND FOR PHYSICAL SILVER CONTINUES TO INTENSIFY AS WE WITNESS SEVERE BACKWARDATION IN SILVER IN LONDON AS WELL AS THE STRONG AMOUNT OF PHYSICAL STANDING FOR METAL AT THE COMEX.
(report Harvey)
.
2.a) The Shanghai and London gold fix report
(Harvey)
2 b) Gold/silver trading overnight Europe, Goldcore
(Mark O’Byrne/zerohedge
and in NY: Bloomberg
3. ASIAN AFFAIRS
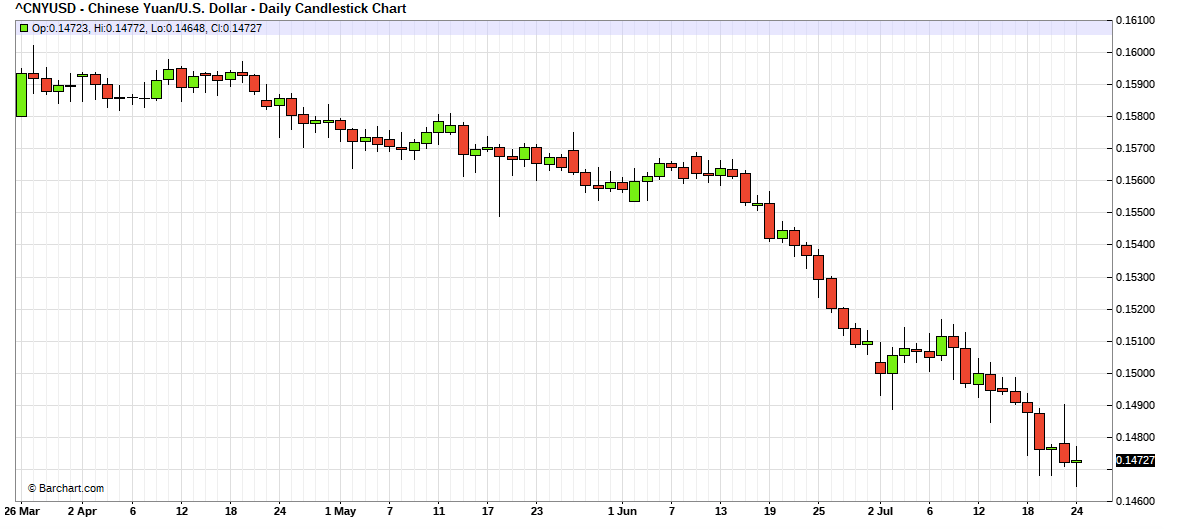
i)TUESDAY MORNING/MONDAY NIGHT: Shanghai closed UP 7.35 POINTS OR 0.26% /Hang Sang CLOSED DOWN 150.12 POINTS OR 0.52%/ / The Nikkei closed UP 8.88 POINTS OR 0.04%/Australia’s all ordinaires CLOSED DOWN 0.04% /Chinese yuan (ONSHORE) closed DOWN at 6.8329 AS POBC RESUMES ITS HUGE DEVALUATION /Oil UP to 69.69 dollars per barrel for WTI and 75.33 for Brent. Stocks in Europe OPENED GREEN//. ONSHORE YUAN CLOSED WELL DOWN AT 6.8329 AGAINST THE DOLLAR. OFFSHORE YUAN CLOSED DOWN ON THE DOLLAR AT 6.8391: HUGE DEVALUATION/PAST SEVERAL DAYS RESUMES : /ONSHORE YUAN TRADING STRONGER AGAINST OFFSHORE YUAN/ONSHORE YUAN TRADING WEAKER AGAINST USA DOLLAR/OFFSHORE YUAN TRADING WEAKER AGAINST THE DOLLAR /CHINA RETALIATES WITH TARIFFS/ TRUMP RESPONDS TO NEW TARIFFS AND IT NOW A FULL TRADE WAR COMMENCED
/NORTH KOREA/SOUTH KOREA
i)North Korea/South Korea/USA/Russia
b) REPORT ON JAPAN
i)As expected, Japan’s economy is shrinking because it is aging. The bank of Japan shifts to a more flexible bond buying plan trying to steepen the yield curve. Japan will continue with its stealth tapering and if need be, they will increase purchases of bonds to keep the yield below .11% It did not work
( zerohedge)
b)Discussion of the latest Kuroda policy: Kuroda tried to steepen the curve but he failed. Deflation is still ripping Japan apart and Kuroda’s attempt to help the banks was off themark
( zerohedge)
c)The following is an excerpt from Graham Summers’ weekly investment service, Private Wealth Advisory.
Is Japan about to blow up?
( Graham Summers)
3 c CHINA
Stocks and the yuan rise as it was stated that trade talks are resuming. This will not last.
( zero hedge)
4. EUROPEAN AFFAIRS
i)Salvini is accused of creating a climate of hate because of his refusal to allow any more migrants into Italy
( zerohedge)
ii)GREECE
5. RUSSIAN AND MIDDLE EASTERN AFFAIRS
i)Russia/Syria/USA
We have highlighted to you on several occasions, the fact that Russia can engage in electronic warfare against USA troops by jamming their equipment. There has been a few reports of naval ships being disabled with the Russian jamming equipment. It is now entering a dangerous phase in Syria
( zerohedge)
ii)The Turkish lira plunges to 4.92%, inflation is running rampant at almost 14% and the 10 yr Turkish bond is yielding close to 19%. The court rejects an appeal to release USA Pastor Brunson..trouble ahead on this one…
6 .GLOBAL ISSUES
My goodness!! The loonie tumbles after Canada is excluded from NAFTA talks. All Canada has to do is refuse to sell fresh water to the States as this will become a big issue
( zerohedge)
7. OIL ISSUES
Nicholas to me on the huge volume of Shanghai oil priced in yuan.
As you know these contacts can be converted into gold once the seller of that oil receives his yuan.
(courtesy Nicholas Biezanek)
8. EMERGING MARKET
9. PHYSICAL MARKETS
i)The following is a must read. Rep Mooney asks some tough questions to the Fed and Treasury with respect to the surreptitious trading in gold
( Chris Powell/GATA Stef. Gleeson)
ii)I promised you that gold imports into India would approach 1000 tonnes. I am close
( scrapregister.com)
10. USA stories which will influence the price of gold/silver)
i)Market trading /GOLD/MARKET MOVERS:
Spending outpaces income for the 5th straight month
( zerohedge)
a)uSA home appreciation records its slowest pace since January as the big affordability issue looms
( zerohedge)
b)Your most important passage of the year!! As we have been pounding the table following David Stockman’s lead, we can now state that everything that we told you is coming to fruition. We warned you that the USA budget deficit will climb to just over 800 billion dollars. It is now pegged for 833 billion dollars. However you must also include student loans and auto loans which are not part of the deficit. So the true funding needs exceeds 1.33 trillion dollars. Also remember that the Fed’s balance sheet roll offs will also add to the treasuries huge borrowings. By mid 2019, the total amount of borrowing will be in excess of 1.8 trillion dollars and that will cause the 10 yr yield to skyrocket.
(courtesy zerohedge)
a)The left is going to be very upset with this: Trump is considering a 100 billion USA tax cut for the very wealthy
( zerohedge)
b)Trump declares war on Republican Koch brothers saying they are a total “joke”
(courtesy zerohedge)
c)the trade war will force Americans to pay 4% more for diapers, tissues and toilet paper
(courtesy zerohedge)
iv)SWAMP STORIES
Trading Volumes on the COMEX
PRELIMINARY COMEX VOLUME FOR TODAY: 293,231 contracts
CONFIRMED COMEX VOL. FOR YESTERDAY: 272,396 contracts
xxxxxxxxxxxxxxxxxxxxxxxxxxxxxxxxxxxxxxxxxxxxxxxxxxxxxxxxxxxxxxxxxxxx
And now for the wild silver comex results.
Total silver OI ROSE BY A CONSIDERABLE SIZED 2461CONTRACTS FROM 218,477 UP TO 220,908 (AND A LITTLE CLOSER TO THE THE NEW RECORD OI FOR SILVER SET APRIL 9.2018/ 243,411 CONTRACTS)DESPITE THE TINY 3 CENT GAIN IN PRICING THAT SILVER UNDERTOOK YESTERDAY. SINCE WE ARE NOW INTO THE ACTIVE DELIVERY MONTH OF JULY, WE WERE INFORMED THAT WE HAD A SMALL SIZED 617 EFP CONTRACTS FOR SEPT., 0 EFP CONTRACTS FOR DECEMBER AND ZERO FOR ALL OTHER MONTHS. THESE EFPS WERE ISSUED TO COMEX LONGS WHO RECEIVED A FIAT BONUS PLUS A DELIVERABLE PRODUCT OVER IN LONDON. THE TOTAL EFP’S ISSUED: 617. ON A NET BASIS WE GAINED 3078 SILVER OPEN INTEREST CONTRACTS AS WE OBTAINED 2461 CONTRACT GAINAT THE COMEX COMBINING WITH THE ADDITION OF 617 OI CONTRACTS NAVIGATING OVER TO LONDON.
NET GAIN ON THE TWO EXCHANGES: 3078CONTRACTS
AMOUNT STANDING FOR SILVER AT THE COMEX
We had 652 open interest contracts stand for delivery and thus by definition the amount standing for delivery in August for silver is as follows:
652 contracts x 5000 oz per contract = 3,260,000 oz
The next active delivery month after August for silver is September and here the OI ROSE by 565 contracts UP to 156,010
After September, the next big delivery month is December and here the OI rose by 1780 contracts up to 53,420 contracts.
We had 255 notice(s) filed for 1,275,000 OZ for the AUGUST 2018 COMEX contract for silver
AND NOW COMPARISON VS AUGUST LAST YR:
ON FIRST DAY NOTICE JULY 31/2017: 1,965,000 OZ STOOD FOR DELIVERY
THE FINAL AMOUNT OF SILVER STANDING: AUGUST 30.2017: 6,245,000 OZ AS WE HAD CONSIDERABLE QUEUE JUMPING.
INITIAL standings for AUGUST/GOLD
JULY 31/2018.
| Gold | Ounces |
| Withdrawals from Dealers Inventory in oz | nil oz |
| Withdrawals from Customer Inventory in oz |
NIL OZ
|
| Deposits to the Dealer Inventory in oz | NIL oz |
| Deposits to the Customer Inventory, in oz |
nil oz
|
| No of oz served (contracts) today |
37 notice(s)
3.700 OZ
|
| No of oz to be served (notices) |
4728 contracts
(472,800 oz)
|
| Total monthly oz gold served (contracts) so far this month |
37 notices
3700 OZ
.1150TONNES
|
| Total accumulative withdrawals of gold from the Dealers inventory this month | NIL oz |
| Total accumulative withdrawal of gold from the Customer inventory this month | xxx oz |
we have a NO pulse today, AND zero gold enters the comex
For AUGUST:
Today, 0 notice(s) were issued from JPMorgan dealer account and 0 notices were issued from their client or customer account. The total of all issuance by all participants equates to 37 contract(s) of which 0 notices were stopped (received) by j.P. Morgan dealer and 0 notice(s) was (were) stopped/ Received) by j.P.Morgan customer account.
xxxxxxxxxxxxxxxxxxxxxxxxxxxxxxxxxxxxxxxxxxxxxxxxxxxxxxxxxxxxxxxxxxxxxxxxxx
To calculate the INITIAL total number of gold ounces standing for the AUGUST. contract month, we take the total number of notices filed so far for the month (37) x 100 oz or 3700 oz, to which we add the difference between the open interest for the front month of AUGUST. (4765 contracts) minus the number of notices served upon today (37 x 100 oz per contract) equals 476,500 OZ OR 14.82 TONNES) the number of ounces standing in this non active month of AUGUST
Thus the INITIAL standings for gold for the AUGUST contract month:
No of notices served (37 x 100 oz) + {(4765)OI for the front month minus the number of notices served upon today (37 x 100 oz )which equals 476,500 oz standing OR 14.82 TONNES in this active delivery month of AUGUST.
We generally see liquidation on the final day equal to around 60-75% of total oi.
For example, last year at this time, on the day prior to first day notice: 33,000 contracts.
Final OI = 8700 contracts. Liquidation percentage; loss of contracts: 24,300 contracts /33000 = 73%
I have never seen it exceed 75%
Today: loss of OI contracts : 33,938
total oi prior to reading: 38,703
percentage loss: 87.8%
We will no doubt see many EFP issuance as these guys will morph into London forwards and receive a huge fiat bonus.
THERE ARE ONLY 7.8648 TONNES OF REGISTERED COMEX GOLD AVAILABLE FOR DELIVERY AGAINST 14.82 TONNES STANDING FOR JULY
IN THE LAST 24 MONTHS 85 NET TONNES HAS LEFT THE COMEX.
end
And now for silver
AND NOW THE AUGUST DELIVERY MONTH
AUGUST INITIAL standings/SILVER
| Silver | Ounces |
| Withdrawals from Dealers Inventory | nil oz |
| Withdrawals from Customer Inventory |
168,649.506 oz
brinks
CNT
HSBC
Scotia
|
| Deposits to the Dealer Inventory |
nil oz
|
| Deposits to the Customer Inventory |
1,391,745.936
Brinks
Scotia
CNT
|
| No of oz served today (contracts) |
255
CONTRACT(S)
(1,250,000 OZ)
|
| No of oz to be served (notices) |
397 contracts
(1,985,000 oz)
|
| Total monthly oz silver served (contracts) | 255 contracts
(1,250,000 oz) |
| Total accumulative withdrawal of silver from the Dealers inventory this month | NIL oz |
| Total accumulative withdrawal of silver from the Customer inventory this month |
we had 0 inventory movement at the dealer side of things
total dealer deposits: nil oz
total dealer withdrawals: nil oz
we had 3 deposit into the customer account
i) Into JPMorgan: nil oz
*** JPMorgan for most of 2017 and in 2018 has adding to its inventory almost every single day.
JPMorgan now has 144 million oz of total silver inventory or 51.0% of all official comex silver. (144 million/283 million)
iii) into Brinks: 328,000.38 oz
iv) Into CNT: 870,554.856 oz
v) Into Scotia: 193,190.700 oz
total customer deposits today: 1,391,745.936 oz
we had 4 withdrawals from the customer account;
i) out of Scotia; 25,240,630 oz
ii) out of Brinks: 2087.610 oz
iii) out of CNT: 121,179.086 oz
iv) out of HSBC: 20,192.180 oz
total withdrawals: 168,649.506 oz
we had 2 adjustment/
i) Out of CNT:
768,030.054 oz was adjusted out of the dealer and this landed into the customer account of CNT
and this most likely is a settlement
ii) Out of Brinks:
646,132.150 oz was adjusted out of the customer and this landed into the dealer account of Brinks
total dealer silver: 79.453 million
total dealer + customer silver: 284.779 million oz
The total number of notices filed today for the AUGUST. contract month is represented by 255 contract(s) FOR 1,275,000 oz. To calculate the number of silver ounces that will stand for delivery in AUGUST., we take the total number of notices filed for the month so far at 255 x 5,000 oz = 1,275,000 oz to which we add the difference between the open interest for the front month of AUGUST. (652) and the number of notices served upon today (255 x 5000 oz) equals the number of ounces standing.
.
Thus the INITIAL standings for silver for the AUGUST/2018 contract month: 255(notices served so far)x 5000 oz + OI for front month of AUGUST(652) -number of notices served upon today (255)x 5000 oz equals 3,260,000 oz of silver standing for the AUGUST contract month
xxxxxxxxxxxxxxxxxxxxxxxxxxxxxxxxxxxxxxxxxxxxxxxxxxxxxxxxxxx
ESTIMATED VOLUME FOR TODAY:80,183 CONTRACTS
CONFIRMED VOLUME FOR YESTERDAY: 48,095 CONTRACTS absolutely criminal
YESTERDAY’S CONFIRMED VOLUME OF 48,095 CONTRACTS EQUATES TO 140 million OZ OR 34.3% OF ANNUAL GLOBAL PRODUCTION OF SILVER
COMMODITY LAW SUGGESTS THAT OPEN INTEREST SHOULD NOT BE MORE THAN 3% OF ANNUAL GLOBAL PRODUCTION. THE CROOKS ARE SUPPLYING MASSIVE PAPER TRYING TO KEEP SILVER IN CHECK.
The record level of silver open interest is 234,787 contracts set on April 21./2017 with the price at that day at $18.42
The previous record was 224,540 contracts with the price at that time of $20.44
end
NPV for Sprott
1. Sprott silver fund (PSLV): NAV FALLS TO -2.66% (JULY 31/2018)
2. Sprott gold fund (PHYS): premium to NAV FALLS TO -0.86% to NAV (JULY 31/2018 )
Note: Sprott silver trust back into NEGATIVE territory at -2.66%-/Sprott physical gold trust is back into NEGATIVE/
(courtesy Sprott/GATA)
3.SPROTT CEF.A FUND (FORMERLY CENTRAL FUND OF CANADA):
NAV 12.69/TRADING 12.25//DISCOUNT 3.48.
END
And now the Gold inventory at the GLD/
JULY 31/WITH GOLD UP $2.05/NO CHANGE IN GOLD INVENTORY AT THE GLD/INVENTORY RESTS AT 800.20
JULY 30/WITH GOLD DOWN $0.95/NO CHANGE IN GOLD INVENTORY AT THE GLD/INVENTORY RESTS AT 800.20 TONNES
july 27/WITH GOLD DOWN $2.85 TODAY, NO CHANGE IN GOLD INVENTORY AT THE GLD/INVENTORY RESTS AT 800.20 TONNES
JULY 26./WITH GOLD DOWN $5.65: A WITHDRAWAL OF 2.35 TONNES OF GOLD FROM THE GLD/INVENTORY RESTS AT 800.20 TONNES
JULY 25/WITH GOLD UP $6.45; NO CHANGE IN GOLD INVENTORY AT THE GLD/INVENTORY RESTS AT 802.55 TONNES
JULY 24/ WITH GOLD DOWN 10 CENTS: A HUGE DEPOSIT OF 4.42 TONNES INTO THE GLD/INVENTORY RESTS AT 802.55 TONNES
JULY 23/WITH GOLD DOWN $5.55: NO CHANGES IN GOLD INVENTORY AT THE GLD/INVENTORY RESTS AT 798.13 TONNES
JULY 20/WITH GOLD UP $4.15 A HUGE DEPOSIT OF 4.12 TONNES OF GOLD INTO THE GLD.INVENTORY RESTS AT 798.13 TONNES
JULY 19./WITH GOLD DOWN $1.00: NO CHANGES IN GOLD INVENTORY AT THE GLD/INVENTORY RESTS AT 794.01 TONNES
JULY 18/WITH GOLD UP 0.40: NO CHANGES IN GOLD INVENTORY AT THE GLD/INVENTORY RESTS AT 794.01 TONNES
JULY 17/WITH GOLD DOWN $12.40, WE HAD A BIG WITHDRAWAL OF 1.18 TONNES FROM THE GLD/INVENTORY RESTS AT 794.01 TONNES
JULY 16/WITH GOLD DOWN $1.55/NO CHANGE IN GOLD INVENTORY AT THE GLD/INVENTORY RESTS AT 795.19 TONNES
JULY 13/WITH GOLD DOWN $5.35 THE CROOKS RAID THE COOKIE JAR AGAIN TO THE TUNE OF 3.83 TONNES/INVENTORY RESTS AT 795.19 TONNES
JULY 12/WITH GOLD UP $2.30: NO CHANGE IN GOLD INVENTORY AT THE GLD/INVENTORY RESTS AT 799.02 TONNES
JULY 11/WITH GOLD DOWN $10.75 THE CROOKS RAIDED THE COOKIE JAR AGAIN TO THE TUNE OF 1.75 TONNES/INVENTORY RESTS AT 799.02 TONNES
JULY 10/WITH GOLD DOWN $3.85: NO CHANGES IN GOLD INVENTORY AT THE GLD/INVENTORY RESTS AT 800.77 TONNES
july 9/WITH GOLD UP $4.00/ANOTHER RAID ON THE GOLD COOKIE JAR: TWO WITHDRAWALS OF 1.18 TONNES THIS MORNING AND 1.47 TONNES THIS AFTERNOON/INVENTORY RESTS AT 800.77 TONNES
JULY 6/WITH GOLD DOWN $2.45: NO CHANGE IN GOLD INVENTORY AT THE GLD/INVENTORY RESTS AT 803.42 TONNES
JULY 5/WITH GOLD UP ANOTHER $5.15, THE CROOKS RAIDED THE COOKIE JAR AGAIN TO THE TUNE OF 5.89 TONNES/INVENTORY RESTS AT 803.42 TONNES IN THE LAST 10 TRADING DAYS GLD HAS LOST A HUGE 25.34 TONNES WITH A LOSS OF ONLY $15.25 IN PRICE
July 3/WITH GOLD UP $11.15/THE CROOKS RAIDED THE GLD INVENTORY AGAIN TO THE TUNE OF 9.73 TONNES/INVENTORY RESTS AT 809.31 TONNES
JULY 2/WITH GOLD DOWN $12.15, THE CROOKS RAIDED THE GLD INVENTORY AGAIN BY 1.47 TONNES DOWN./INVENTORY RESTS AT 819.04 TONNES
JUNE 29/WITH GOLD UP $3.70/A WITHDRAWAL OF 1.18 TONNES OF GOLD FROM THE GLD/INVENTORY RESTS AT 820.51 TONNES
JUNE 28/WITH GOLD DOWN $5.15/NO CHANGES IN GOLD INVENTORY AT THE GLD/INVENTORY RESTS AT 821.69 TONNES
June 27/WITH GOLD DOWN $3.60// TWO ENTRIES:/STRANGELY THE CROOKS RETURNED THE WITHDRAWAL OF 4.42 TONNES LAST NIGHT (THUS WE HAD A DEPOSIT OF 4.42 TONNES/INVENTORY RESTS AT 824.63 TONNES. /THEN LATE THIS AFTERNOON A WITHDRAWAL OF 2.94 TONNES
INVENTORY RESTS AT 821.69 TONNES/THIS VEHICLE IS AN OUTRIGHT FRAUD.
june 26/LATE LAST NIGHT, WITH GOLD DOWN $9.10 WE HAD A HUGE WITHDRAWAL OF 4.42 TONNES OF GOLD/INVENTORY RESTS AT 820.21 TONES
JUNE 25/WITH GOLD DOWN $1.45/NO CHANGE IN GOLD INVENTORY AT THE GLD.INVENTORY RESTS AT 824.63 TONNES
JUNE 22/WITH GOLD UP 25 CENTS TODAY, THE CROOKS WITHDREW A MASSIVE 4.13 TONNES OF GOLD/INVENTORY RESTS AT 824.63 TONNES
JUNE 21/WITH GOLD DOWN $4.00/NO CHANGES IN GOLD INVENTORY AT THE GLD/INVENTORY RESTS AT 828.76 TONNES
JUNE 20/WITH GOLD DOWN $3.55/NO CHANGES IN GOLD INVENTORY AT THE GLD/INVENTORY RESTS AT 828.76 TONNES
JUNE 19/WITH GOLD DOWN $1.50/NO CHANGES IN GOLD INVENTORY AT THE GLD/INVENTORY RESTS AT 828.76 TONES
JUNE 18/WITH GOLD UP $1.90/NO CHANGES IN GOLD INVENTORY AT THE GLD/INVENTORY RESTS AT 828.76 TONNES
JUNE 15/WITH GOLD DOWN $28.90/NO CHANGE IN GOLD INVENTORY AT THE GLD/INVENTORY RESTS AT 828.76 TONNES
JUNE 14/WITH GOLD UP $7.10/NO CHANGE IN GOLD INVENTORY AT THE GLD/INVENTORY RESTS AT 828.76 TONNES/
JUNE 13/WITH GOLD UP $2.20/NO CHANGE IN GOLD INVENTORY AT THE GLD/INVENTORY RESTS AT 828.76 TONNES
xxxxxxxxxxxxxxxxxxxxxxxxxxxxxxxxxx
JULY 31/2018/ Inventory rests tonight at 800.20 tonnes
*IN LAST 420 TRADING DAYS: 130.73 NET TONNES HAVE BEEN REMOVED FROM THE GLD
*LAST 370 TRADING DAYS: A NET 25,81 TONNES HAVE NOW BEEN ADDED INTO GLD INVENTORY.
end
Now the SLV Inventory/
JULY 31/WITH SILVER UP 5 CENTS/NO CHANGE IN SILVER INVENTORY AT THE SLV/INVENTORY RESTS AT 329.433 MILLION OZ/
JULY 30/WITH SILVER UP 3 CENTS TODAY; NO CHANGE IN SILVER INVENTORY AT THE SLV/INVENTORY RESTS AT 329.433 MILLION OZ.
JULY 27/WITH SILVER FLAT TODAY, NO CHANGE IN SILVER INVENTORY AT THE SLV/INVENTORY RESTS AT 329.433 MILLION OZ/
JULY 26/WITH SILVER DOWN 10 CENTS: STRANGE: A BIG CHANGES IN SILVER INVENTORY AT THE SLV: A DEPOSIT OF 1.046 MILLION OZ OF SILVER/INVENTORY RESTS AT 329.433 MILLION OZ
JULY 25: WITH SILVER UP 8 CENTS TODAY: A SMALL CHANGE IN SILVER INVENTORY AT THE SLV/ A WITHDRAWAL OF 658,000 INVENTORY RESTS AT 328.304 MILLION OZ/
JULY 24/WITH SILVER UP 8 CENTS TODAY: NO CHANGE IN SILVER INVENTORY AT THE SLV/INVENTORY RESTS AT 328.962 MILLION OZ/
JULY 23/WITH SILVER DOWN 11 CENTS/NO CHANGES IN SILVER INVENTORY INTO THE SLV/INVENTORY RESTS AT 328.962 MILLION OZ/
JULY 20/WITH SILVER UP 10 CENTS TODAY: A HUGE CHANGE IN SILVER INVENTORY AT THE SLV: A DEPOSIT OF 1.411 MILLION OZ INTO THE SLV INVENTORY
INVENTORY RESTS AT 328.962 MILLION OZ
JULY 19/WITH SILVER DOWN 17 CENTS TODAY; A HUGE CHANGE IN SILVER INVENTORY AT THE SLV: A DEPOSIT OF 752,000 OZ INTO THE SLV INVENTORY/INVENTORY RESTS AT 327.551 MILLION OZ/
JULY 18/WITH SILVER DOWN 3 CENTS TODAY: NO CHANGES IN SILVER INVENTORY AT THE SLV/INVENTORY RESTS AT 326.799 MILLION OZ/
JULY 17/WITH SILVER DOWN 20 CENTS TODAY: A CHANGE IN SILVER INVENTORY A WITHDRAWAL OF 1.001 MILLION OZ FROM THE SLV: INVENTORY RESTS AT 326.799 MILLION OZ/
JULY 16/WITH SILVER FLAT TODAY, A HUGE CHANGE IN SILVER INVENTORY AT THE SLV: A DEPOSIT OF 1.128 MILLION OZ//INVENTORY RESTS AT 327.880 MILLION OZ
JULY 13/WITH SILVER DOWN 16 CENTS TODAY/NO CHANGE IN SILVER INVENTORY AT THE SLV/INVENTORY RESTS AT 326.752 MILLION OZ.
JULY 12/WITH SILVER UP 12 CENTS TODAY: ANOTHER BIG CHANGE IN SILVER INVENTORY AT THE SLV: A DEPOSIT OF 1.035 MILLION OZ/INVENTORY RESTS AT 326.752 MILLION OZ/
JULY 11/WITH SILVER DOWN 22 CENTS TODAY: ANOTHER HUGE CHANGES IN SILVER INVENTORY AT THE SLV: A DEPOSIT OF 565,000/INVENTORY RESTS AT 325.717 MILLION OZ
JULY 10/WITH SILVER DOWN 3 CENTS TODAY: NO CHANGES IN SILVER INVENTORY AT THE SLV/INVENTORY RESTS AT 325.151 MILLION OZ
july 9/WITH SILVER UP 5 CENTS: ANOTHER BIG CHANGE IN SILVER INVENTORY AT THE SLV: A DEPOSIT OF 847,000 OZ ADDED TO INVENTORY/INVENTORY RESTS AT 825.151 MILLION OZ/
JULY 6/WITH SILVER DOWN 2 CENTS/NO CHANGE IN SILVER INVENTORY AT THE SLV/INVENTORY RESTS AT 324.305 MILLION OZ/
JULY 5/WITH SILVER UP 6 CENTS, A GOOD CHANGE IN SILVER INVENTORY AT THE SLV: A DEPOSIT OF 470,000 OZ/INVENTORY RESTS AT 324.305 MILLION OZ/ FOR THE PAST 10 TRADING DAYS, SILVER INVENTORY HAS ADVANCED BY 4.945 MILLION OZ WITH A LOSS OF 33 CENTS/PLEASE COMPARE THIS WITH THE GLD.
JULY 3/WITH SILVER UP 17 CENTS, A HUGE DEPOSIT OF 1.37 MILLION OZ ADDED TO THE SLV/INVENTORY RESTS AT 323.835 MILLION OZ.
JULY 2/WITH SILVER DOWN 31 CENTS/A HUGE 2.070 MILLION OZ DEPOSIT AT THE SLV/INVENTORY RESTS AT 322.465 MILLION OZ/
JUNE 29/WITH SILVER UP 14 CENTS TODAY, NO CHANGES IN SILVER INVENTORY AT THE SLV/INVENTORY RESTS THIS WEEKEND AT 320.395 MILLION OZ/
JUNE 28/WITH SILVER DOWN 18 CENTS, THE CROOKS ADDED 1.035 MILLION OZ OF SILVER INTO THE SLV/INVENTORY RESTS AT 320.395 MILLION OZ
JUNE 27.2018/WITH SILVER DOWN 8 CENTS/NO CHANGE IN SILVER INVENTORY/INVENTORY RESTS AT 819.360 MILLION OZ/
june 26./2018/WITH SILVER DOWN 8 CENTS, THE CROOKS WITHDREW THE DEPOSIT OF TWO DAYS AGO; 941,000 OZ OUT OF INVENTORY/INVENTORY RESTS AT 819.360 OZ
JUNE 25/WITH SILVER DOWN 12 CENTS/NO CHANGES IN SILVER INVENTORY AT THE SLV/INVENTORY RESTS AT 320.301 MILLION OZ/
JUNE 22/WITH SILVER UP 12 CENTS TODAY,ANOTHER BIG CHANGE IN SILVER INVENTORY AT THE SLV” A DEPOSIT OF 941,000 OZ INTO INVENTORY/INVENTORY RESTS THIS WEEKEND AT 320.301 MILLION OZ/
JUNE 21/WITH SILVER UP ONE CENT/ANOTHER CHANGE IN SILVER INVENTORY AT THE SLV/: A DEPOSIT OF 2.918 MILLION OZ/INVENTORY RESTS AT 319.360 MILLION OZ/ THUS FOR TWO STRAIGHT DAYS A TOTAL OF 5.26 MILLION OZ OF SILVER HAS BEEN ADDED WITH NO CHANGE IN PRICE.
JUNE 20/WITH SILVER DOWN ONE CENT/A HUGE CHANGE IN SILVER INVENTORY AT THE SLV/INVENTORY / A DEPOSIT OF 2.35 MILLION OZ/INVENTORY RESTS AT 316.442 MILLION OZ/
JUNE 19/2018/WITH SILVER DOWN 11 CENTS/NO CHANGE IN SILVER INVENTORY AT THE SLV/INVENTORY RESTS AT 314.090 MILLION OZ/
JUNE 18/WITH SILVER DOWN 6 CENTS TODAY/NO CHANGE IN SILVER INVENTORY/INVENTORY RESTS AT 314.090 MILLION OZ/
JUNE 15/WITH SILVER DOWN 75 CENTS/A BIG CHANGE IN SILVER INVENTORY AT THE SLV: A WITHDRAWAL OF 1.788 MILLION OZ//INVENTORY RESTS AT 314.090 MILLION OZ
JUNE 14/WITH SILVER UP 30 CENTS, THE CROOKS DECIDED THAT THEY NEEDED SILVER INVENTORY BADLY SO THEY RAID THE SLV OF 1.412 MILLION OZ/INVENTORY RESTS AT 315.878 MILLION OZ/
JUNE 13/WITH SILVER UP 11 CENTS TODAY/NO CHANGES IN SILVER INVENTORY AT THE SLV/INVENTORY RESTS AT 317.290 MILLION OZ/
JULY 31/2018:
Inventory 329.433 MILLION OZ
6 Month MM GOFO 1.93/ and libor 6 month duration 2.53
Indicative gold forward offer rate for a 6 month duration/calculation:
G0FO+ 1.93%
libor 2.53 FOR 6 MONTHS/
GOLD LENDING RATE: .60%
XXXXXXXX
12 Month MM GOFO
+ 2.82%
LIBOR FOR 12 MONTH DURATION: 2.40
GOFO = LIBOR – GOLD LENDING RATE
GOLD LENDING RATE = +.42
end
Major gold/silver trading /commentaries for TUESDAY
GOLDCORE/BLOG/MARK O’BYRNE.
House prices aren’t just slipping in the UK – this is global
It’s very easy to become parochial when it comes to thinking about property markets.
We focus on the slowdown in the UK market and we ponder what’s causing it. Could it be new rules on landlords? Could it be the crackdown on overseas investors? Could it be Brexit?
But this really is less than half the picture.
Because the residential property slowdown isn’t just happening in the UK – it’s happening pretty much everywhere.

Why residential property matters
We talk about property a fair bit in Money Morning. There are a few reasons for that. Firstly, everyone’s obsessed with it. So it’s fair game as a topic.
Secondly, it’s an important asset class. Stockmarket crashes grab headlines, but the truth is the market can slide hard without ever really scratching the sides of the economy. But if the housing market crashes, you tend to know about it, because typically there’s a lot of debt involved.
Thirdly, it’s usually a pretty big item on the household balance sheet. I think it’s fair to say that the majority of us aspire to owning a home and clearing the mortgage. And those who already have might be keen to use it to fund other things – retirement, deposits for offspring, or even an inheritance (although my advice on this latter point is spend the lot, your kids want you to have fun – and if they don’t, they don’t deserve it anyway).
Anyway – so that’s why we go on about property. But as I said in the intro, it’s easy to get a bit too fixated with what’s going on locally. That can lead you to the wrong conclusions. After all, there are a lot of legislative changes that are affecting the UK housing market right now, for example.
But it’s not just the UK. House prices are hitting a wall almost everywhere.
Take Australia. The land down under has long had one of the most expensive property markets in the world. It barely winced during the 2008 financial crisis, despite carnage everywhere else.
And yet now, it finally appears to be losing steam. Prices in Sydney fell by 4.5% in the second quarter, while prices in Melbourne slipped too.
Australia is far from alone. Hot global markets everywhere are slowing down. Canada is another good example.
And now we’re seeing it happen in the US as well. As Bloomberg reports: “The US housing market – particularly in cutthroat areas like Seattle, Silicon Valley and Austin, Texas – appears to be headed for the broadest slowdown in years.”
The number of home sales (of existing homes as opposed to new builds) fell in June for the third month in a row. New builds are selling at the slowest pace in eight months.
Meanwhile, the inventory of unsold homes – the amount of supply on the sidelines – is rising again. Prices in May were up by 6.4% year-on-year (so a lot stronger than in the UK, for example), but that’s the smallest annual gain since 2017 – and over the last three months, prices have risen at their slowest rate since 2012.
What’s interesting about the US housing market is that historically, despite the fact that it bore so much responsibility for the 2008 crash, it has been a relatively well-behaved property market. Over the very long run, US house prices have only risen in line with inflation. You can’t say the same for the UK.
So the fact that it, too, is starting to struggle, suggests that this isn’t purely a bubble market phenomenon.
Why are housing markets around the world slowing down?
Why is this? What do all of these markets have in common? Because clearly, it’s not Brexit. Nor is it cracking down on buy-to-let landlords. And while most countries have grown a little more hostile to foreign investors (most Canadian cities have imposed strict rules, for example), it’s not the most obvious answer.
Let’s go back to basics for a moment. You buy property with debt. Usually a fair chunk of it. Property can be very lucrative as an investment precisely because of this debt (or “leverage”).
Put down £25,000 deposit. Buy a £100,000 house, using a £75,000 mortgage. Sell it in two years’ time for £125,000. Pay the £75,000 back to the bank. Pocket £50,000. The price went up by 25%, but you’ve doubled your money. Rinse and repeat until you’re a millionaire.
But what makes prices go up in the first place? The rational value of a property (as opposed to the “bubble” value) is dependent on the expected rental income it will generate, and what other people are willing to pay for that income stream. It’s just like a bond in many ways, only riskier, and with plumbing involved.
So if you can get 5% from your bank account, you’ll want a lot more from your property – say 10%. But if you can only get 1% from your bank account, you’ll take a lower yield on your property – say 5%.
Let’s assume that the annual rental is £10,000 and it stays there. So with interest rates at 5%, you’ll happily pay £100,000 for that rental income. But with rates at 1%, you’ll happily pay £200,000. (I’m keeping the examples simple here).
You see what’s happened? The price of the property is basically contingent on interest rates.
And what’s happening around the world now? That’s right. Interest rates have stopped going down. And in some cases (notably the US) they are rising. As a result, there’s not much fuel for prices to go higher (rents are as high as they can go without a real boost in wages), and if borrowing costs rise, that will drive prices down.
As Bloomberg notes of the US, affordability is a huge issue in many of these areas, while prices nationwide are still rising “twice as fast as incomes”. Yet the bigger issues is that “buyers are getting squeezed by rising mortgage rates.”
In short, property (alongside bonds) is one of the asset classes that has benefited most from the decline of interest rates in recent decades. And now that’s reversing.
For “normal” people, that has imposed a ceiling on the amount of borrowing they can arrange – they simply can’t afford to buy at the prices sellers still hope to get. For global investors, they’ve realised not only that the world is becoming more hostile to the free flow of footloose capital, but that, quite simply, in a rising rate environment, property is not a good investment.
What happens next? That all depends on rates.
• From free daily investment email Money Morning
Trump Trade and Currency Wars With China – Goldnomics Podcast

Hedge Funds’ Big Short Could Be Fool’s Gold (Bloomerg.com)
PRECIOUS-Gold prices buoyed by weaker dollar vs yen (Reuters.com)
A third straight bludgeoning for tech stocks drives Nasdaq to 3-week closing low (MarketWatch.com)
Gold is having an ugly year, but ‘this bloodbath is leading to a buying opportunity’ (CNBC.com)
Gold Prices Slip Despite Slightly Weaker Dollar (Investing.com)
 Source: Bloomberg
Gold Review: Flirts with an important horizontal support, near $1218 level (FXStreet.com)
Commodities Weekly: No traction for commodities as the dollar softens (MarketPulse.com)
Gold Prices May Fall on Hawkish Fed, US Bond Supply Boost (DailyFX.com)
Ed Steer: When JP Morgan Decides to Stop Shorting Silver, Prices Will Shock You (SilverSeek.com)
Listen on SoundCloud , Blubrry & iTunes. Watch on YouTube below

Gold Prices (LBMA AM)
30 Jul: USD 1,222.05, GBP 931.20 & EUR 1,045.95 per ounce
27 Jul: USD 1,219.15, GBP 931.06 & EUR 1,048.10 per ounce
26 Jul: USD 1,228.35, GBP 931.46 & EUR 1,049.13 per ounce
25 Jul: USD 1,230.55, GBP 935.09 & EUR 1,051.75 per ounce
24 Jul: USD 1,224.30, GBP 933.77 & EUR 1,047.63 per ounce
23 Jul: USD 1,229.45, GBP 937.21 & EUR 1,050.93 per ounce
20 Jul: USD 1,224.85, GBP 940.56 & EUR 1,050.80 per ounce
Silver Prices (LBMA)
30 Jul: USD 15.49, GBP 11.81 & EUR 13.25 per ounce
27 Jul: USD 15.36, GBP 11.72 & EUR 13.20 per ounce
26 Jul: USD 15.54, GBP 11.79 & EUR 13.27 per ounce
25 Jul: USD 15.57, GBP 11.83 & EUR 13.31 per ounce
24 Jul: USD 15.51, GBP 11.81 & EUR 13.24 per ounce
23 Jul: USD 15.49, GBP 11.78 & EUR 13.22 per ounce
20 Jul: USD 15.37, GBP 11.79 & EUR 13.19 per ounce
Recent Market Updates
– Russia Sells 80% Of Its US Treasuries
– Are China’s Gold Reserves Slowly Rising?
– Gold Outlook In H2 2018
– Gold Production In South Africa Continues To Collapse – Plummets 85% From Peak In 1970 (VIDEO)
– Physical Gold Is The “Best Defence” Against “Escalating Currency Wars”
– Trump and War With China? Goldnomics Podcast
– Weekly Digest – News, Market Updates and Videos You May Have Missed
– Financial Terrorism In The UK – Collusion between Government, Regulators & Two Bailed-Out UK Banks
– “Biggest Bubble in the History of Mankind” Is “Going To Burst” – Ron Paul
– Global Debt Time Bomb Surges To Nearly $250,000,000,000,000 – GoldCore Video
– Trump, Russia, Brexit and the Demand For Gold and Silver – GoldCore Video Interview
– Trump Is Serious About A Global Trade War
– Ponzi Economy Will Lead To Next Global Financial Crisis
– World Cup Is 200 Ounces Of Gold Worth £140,000 – 30% Less Than Harry Kane’s Weekly Wage
– Chaotic BREXIT More Likely: Risk To London, While Frankfurt, Luxembourg, Paris and Dublin Benefit
– VIDEO: Italy €2.4 Trillion Debt To Create Eurozone Contagion and Global Debt Crisis?
– U.S. China Trade War Escalates as Russia and China Accumulate Gold


Andrew Maguire’s Kinesis money which is a “bitcoin” but backed 100% by allocated gold and silver is set to go.
it think it would be a great idea to look at this!
please read at: https://kinesis.money/#/
(Andrew Maguire)
|
|
Dear Harvey Organ,
Thank you for your participation in our webinar on June 7th with our host and CEO of Kinesis, Thomas Coughlin.
The response we received has been incredible, we appreciate you taking the time to join us and hope you found it to be beneficial.
Due to such a high influx of questions we received we were unable to have them all answered. Nevertheless, if there was anything which requires more clarification, or you have a query which needs to be rectified, we invite you to join our telegram group:
We apologize for the technical issues we incurred during the webinar which resulted in it running a little over schedule, we hope that the next one we host will run seamlessly.
A video has been put together and uploaded onto our YouTube channel which can be found here:
Please share and subscribe to our YouTube channel to be notified of all the latest videos as they become available.
The rapid growth that we are currently experiencing has been incredible and with your support, is only going to get better.
We are working behind the scenes very hard to create a better experience for everyone involved! Stay tuned in as we have many more announcements to be released in the upcoming days.
Kind Regards,
 |
Kinesis Money
a:C/O ILS Fiduciaries (IOM) Limited, First Floor,Millennium House, Victoria Road, Douglas, Isle of Man IM2 4RW
   |
The following is self explanatory
(courtesy GATA/Chris Powell and Harvey Organ)
GATA asks bank regulator to check risks of gold
futures maneuver
Submitted by cpowell on Sun, 2018-06-10 16:17. Section: Daily Dispatches
12:21p ET Sunday, June 10, 2018
Dear Friend of GATA and Gold:
GATA has appealed to the U.S. comptroller of the currency, who has regulatory authority over banks, to review financial risks certain banks may have incurred through derivatives in the monetary metals markets, particularly through the recent heavy use of the “exchange for physicals” mechanism of settling gold and silver futures contracts on the New York Commodities Exchange.
The appeal was made in a letter sent May 5 to the comptroller, Joseph M. Otting, whose office is part of the U.S. Treasury Department, by your secretary/treasurer and GATA futures market consultant Harvey Organ.
“Exchange for physical” settlements of futures contracts long were considered emergency procedures when a seller was not able to deliver metal from an exchange-approved warehouse and wanted to settle with delivery elsewhere. But now such settlements appear to constitute most gold and silver futures settlements on the Comex. It is a strange development that appears to have been necessitated by the increasing difficulties of central banking’s gold and silver price suppression policy.
GATA has received no acknowledgment of the letter. Its text is below and a PDF copy of it is here:
http://www.gata.org/files/ComptrollerOfCurrencyLetter.pdf
CHRIS POWELL, Secretary/Treasurer
Gold Anti-Trust Action Committee Inc.
CPowell@GATA.org
* * *
May 5, 2018
Joseph M. Otting, Comptroller of the Currency
U.S. Treasury Department
400 7th Street, SW
Washington DC 20219
Dear Comptroller Otting:
Please let us bring to your attention financial risks to major banks involving their possibly unreported exposure to derivatives in the monetary metals markets.
In recent months gold and silver future contracts issued by U.S. banks on the New York Commodities Exchange have been moved off-exchange for delivery through a mechanism known as “exchange for physical” (EFP) contracts. Until recently use of this mechanism was considered an emergency procedure when a seller did not have access to metal for delivery through Comex warehouses. Now the mechanism seems to be in use for a large share of front-month contracts for which delivery is sought.
Here is an example that is happening at the Comex in the front active month of April for gold and the inactive delivery month of April for silver.
In gold, there were 229,436 EFP contracts for 713.64 tonnes, an average of 10,925 contracts and 1,092,500 ounces per trading day.
In silver, there were 77,150 EFP contracts for 385,750,000 ounces, an average of 3,673 contracts and 18,369,000 ounces per trading day.
London Bullion Market Association rules suggest that these contracts may not be reported to regulators. The LBMA’s bylaws say:
“Figures above exclude any contracts not subject to risk-based capital requirements, such as FX contracts with an original maturity of 14 days or less, futures contracts, written options, and basis swaps. Therefore, the total notional amount of derivatives by maturity will not add to the total derivatives figure in this table.”
We are told that these EFP contracts are transferred from the Comex to London as what are called “serial forwards” and their duration is always less than 14 days, which exempts them from being reported.
It is our understanding that in each quarter your office prepares a report detailing risk undertaken by the banks under the comptroller’s supervision.
These risks include derivatives undertaken by U.S. banks and other obligations that may cause a bank to fail. Our concern is that your office may not be aware of large unreported derivative exposure by banks.
Could you review this matter and let us know your conclusions?
Sincerely,
CHRIS POWELL
Secretary/Treasurer
HARVEY ORGAN
Consultant
Gold Anti-Trust Action Committee Inc.
7 Villa Louisa Road
Manchester, Connecticut 06043-7541
end
This is our letter to the CFTC it is quite explanatory: is a foreign power controlling the comex gold prices:
(courtesy Chris Powell, Harvey Organ)
An open letter to the CFTC: Is a foreign power controlling Comex gold prices?
Submitted by cpowell on Sun, 2018-07-29 02:21. Section: Daily Dispatches
July 28, 2018
J. Christopher Giancarlo, Chairman
Brian Quintenz, Commissioner
Rostin Behnam, Commissioner
U.S. Commodity Futures Trading Commission
3 Lafayette Centre
1155 21st Street, NW
Washington, D.C. 20581
Dear Chairman Giancarlo:
We would like to bring to attention four issues that need to be addressed in gold and silver futures trading.
1. For the second straight month, there has been a huge discrepancy between the preliminary gold open interest and the final number recorded on particular trading days.
Let us examine the one that just happened: July 26.
There was a preliminary Comex gold open interest gain of 3,349 contracts to 503,493. But there was a final Comex gold open interest loss of 14,443 contacts to 485,701 — a discrepancy of 27,792 contracts.
The open interest here is already 24 hours old. Our understanding is that these contracts are canceled for nonpayment. It would be almost impossible for such a large number of voided contracts not to have influenced the price of gold, especially when there was a raid on the Comex by the banks.
2. The huge issuance of “exchange for physical” settlements.
For quite some time we have been told by a CFTC official, Deputy Enforcement Director Matthew Hunter, that this was quite legal as these settlements were deliverable. But in our last email exchange with Hunter he wrote that these EFPs were not deliverable. The CFTC really should provide a thorough accounting of EFPs and explain how they settle contracts.
3. The gold Comex shows a huge open interest of 43,000 contracts remaining with one day before first notice day. So there likely will be a huge amount of gold contracts standing for deliver for the August contract month — probably 31 to 62 tonnes — with only 7.8 tonnes of registered gold at the Comex and with no gold having entered the Comex for some time. How could the banks throughout the last month have depressed the price of gold amid such huge physical demand and a tiny registered gold inventory available to settle?
4. For the past month there has been a direct correlation between the value of the Chinese yuan and the price of gold. That is, the higher the yuan, the higher the price of gold and especially vice-versa.
The value of the Chinese yuan is essentially controlled by China’s central bank.
The Comex is generally considered the primary authority in pricing gold.
Here is recent commentary by monetary metals market analyst Craig Hemke on the recent perfect correlation between the yuan and gold:
https://www.sprottmoney.com/Blog/potential-impacts-of-the-yuan-gold-peg-…
* * *
Hemke writes:
“Though the People’s Bank of China has long maintained a ‘peg’ in the relative valuation of the yuan versus the dollar, the past 90 days have seen a steady devaluation of this peg to the tune of nearly 8 percent. See this chart:
“Over the period in this chart the price of Comex gold has fallen by more than 10 percent:
“To make this correlation clearer, let’s plot the two prices together. This correlation has become extraordinarily tight over the past month, as you can see below where the CNY/USD exchange rate is displayed in candlesticks and Comex gold is a blue line:
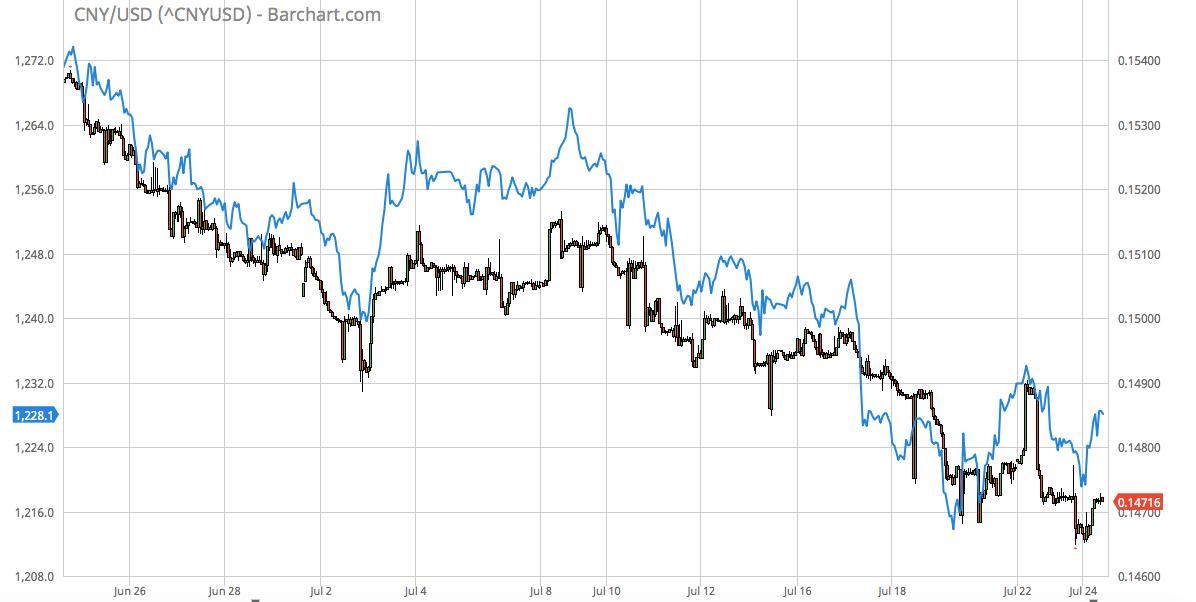
“And when you draw it down to just the past five days, the two prices react to each other almost simultaneously:

“This is not a correlation searching for a cause, nor is it a simple act of ‘traders’ reacting to a falling yuan by selling digital gold. No, in a market the size of global gold, this immediate correlation can be accomplished only through massive interventions, the size and scope of which are possible only at the state/sovereign level. And which state/sovereign would have a direct interest in linking the dollar price of gold to the yuan? China, of course.”
* * *
So how does the CFTC allow a foreign government or entity to control the price of this important commodity and currency by trading in U.S. markets?
Or is market manipulation by a foreign power happening with the authorization of the U.S. government?
HARVEY B. ORGAN, Consultant
CHRIS POWELL, Secretary/Treasurer
Gold Anti-Trust Action Committee Inc.
Manchester, Connecticut
CPowell@GATA.org
end
The following is a must read. Rep Mooney asks some tough questions to the Fed and Treasury with respect to the surreptitious trading in gold
(courtesy Chris Powell/GATA Stef. Gleeson)
Treasury, Fed evade congressman’s gold questions so he presses them again, and more
Submitted by cpowell on Tue, 2018-07-31 15:53. Section: Daily Dispatches
12:05p ET Tuesday, July 31, 2018
Dear Friend of GATA and Gold:
The U.S. Treasury Department and Federal Reserve responded incompletely and evasively this month to the questions about their involvement in the gold market that were posed in April by U.S. Rep. Alex X. Mooney, R-West Virginia.
So Mooney last week wrote back to Treasury Secretary Steven Mnuchin and Federal Reserve Board Chairman Jerome Powell, repeating his questions and adding a few others about surreptitious U.S. government intervention in financial markets.
..
In doing so Mooney has drawn from GATA’s documentation of such intervention.
Mooney’s first inquiries to the Treasury and the Fed are described in a GATA dispatch here:
http://www.gata.org/node/18210
Mooney’s letter containing those inquiries is here:
http://gata.org/files/MooneyLetter-04-24-2018.pdf
Mooney originally asked Mnuchin and Powell to describe the U.S. government’s policy on gold and cited documentation from the U.S. State Department archive showing that this policy has been to drive gold out of the world financial system.
Mnuchin, whose response was written by Treasury’s acting assistant secretary, Brad Bailey, and Powell did not address this question at all. Mooney has posed it again.
The Treasury’s reply denied that the department trades gold through the Bank for International Settlements, Bank of England, and other central banks or governments. But Mooney now asks if the Treasury trades gold through its Exchange Stabilization Fund or through any other government agency or through commercial banks and brokers.
Powell’s reply denied any involvement by the Fed with gold swaps. (Harvey: a lie) But Mooney’s new inquiry calls attention to minutes of the Fed’s Federal Open Market Committee from 1995, wherein Fed General Counsel Virgil Mattingly says the Exchange Stabilization Fund has engaged in gold swaps.
Mooney also calls attention to the 2009 admission to GATA by Fed Governor Kevin M. Warsh that the Fed has gold swap arrangements with foreign banks and will not disclose them.
Mooney asks Powell for an explanation of what seem like contradictions of his denial.
In his new letter Mooney notes that the auditing of the U.S. gold reserve that is described in Bailey’s letter on behalf of the Treasury is not really auditing at all, and the congressman asks: “When was the last time, if ever, that there was a complete inventory conducted of U.S. government-owned gold? What were the results of the most recent inventory?”
Mooney adds: “A true audit would also review any encumbrances placed upon the metals owned by the United States.Has there been an accounting for any such encumbrances, as part of any audit, inventory, or other review? If so, when did this last occur and what were the results?”
Mooney’s new letter notes the recent close correlation of the gold price with the price of the Chinese yuan and the valuation of the International Monetary Fund’s Special Drawing Rights, and he asks, “Do these correlations reflect surreptitious intervention in U.S. currency markets by China and currency manipulation by China? What do the Fed and Treasury think of these correlations?”
GATA’s open letter to the U.S. Commodity Futures Trading Commission, published Sunday, pressed that issue as well:
http://www.gata.org/node/18405
Perhaps most satisfying for believers in free markets and limited and transparent government, Mooney now asks the Treasury and Fed to come clean about everything. He writes: “What markets, if any, are the Federal Reserve and Treasury trading in, and through what mechanisms? If the Federal Reserve and Treasury are engaged in trading, what is the objective?”
Stefan Gleason, president of the Sound Money Defense League and coin and bullion dealer Money Metals Exchange, who has supported Mooney’s inquiries, today welcomed the congressmen’s persistence.
“This obfuscation by the Fed and the Treasury is unacceptable,” Gleason said, “and we are encouraged Congressman Mooney is calling them out on their game playing. The American people are entitled to transparency and accountability when it comes to the status and use of America’s gold reserves.”
Gleason’s statement is posted at the Money Metals Exchange internet site here:
https://www.moneymetals.com/news/2018/07/31/china-gold-market-interventi…
The replies to Mooney from the Treasury and Fed are posted at GATA’s internet site here:
http://www.gata.org/files/Treasury&FedResponsesToMooney-07-2018.pdf
Mooney’s new letters of inquiry to the Treasury and Fed are posted at GATA’s internet site here:
http://www.gata.org/files/MooneyToTreasury&Fed-07-27-2018.pdf
With his detailed questioning of the Treasury and Fed and his persistence, the congressmen is essentially conducting both the sort of serious policy review Congress seldom does anymore as well as investigative journalism that most mainstream financial news organizations prohibit about gold and market rigging by government.
On the whole the monetary metals mining industry and metals market analysts are too timid to pursue these questions. But ordinary U.S. citizens and investors can help immensely here simply by calling Mooney’s inquiries to the attention of their U.S. senators and representatives and asking them to make and publicize their own similar inquiries.
It’s easily done: Just print this dispatch and send it with a covering note to your members of Congress. If enough members of Congress support Mooney’s inquiries, market rigging will get much more difficult for the government.
CHRIS POWELL, Secretary/Treasurer
Gold Anti-Trust Action Committee Inc.
CPowell@GATA.org
END
I promised you that gold imports into India would approach 1000 tonnes. I am close
(courtesy scrapregister.com)
India Gold imports shoot up to 955.16 tons during FY 2018
NEW DELHI (Scrap Register): As per the information passed to the parliament, Gold import in volume terms has increased by 22.43 per cent to 955.16 tons during the fiscal year 2017-18.
In 2016-17, the imports stood at 780.14 tons, according to the data shared by Minister of State for Commerce and Industry.
The demand of gold in the country in 2017-18 has increased during first and second quarters and declined in third and fourth quarters as compared to corresponding period in 2016-17.
The overall import of gold in 2017-18 has increased by 22.43 per cent as compared with imports in 2016-17.
https://www.scrapregister.com/news/44939/india-gold- imports-shoot-up-to-955.16-tons-during-fy-2018
-END-
Your early TUESDAY morning currency, Asian stock market results, important USA/Asian currency crosses, gold/silver pricing overnight along with the price of oil Major stories overnight/9 AM EST
i) Chinese yuan vs USA dollar/CLOSED DOWN TO 6.8329/HUGE DEVALUATION FOR THE PAST TWO WEEKS RESUMES /shanghai bourse CLOSED UP 7.35 POINTS OR 0,26% /HANG SANG CLOSED DOWN 150,12 POINTS OR 0.52%
2. Nikkei closed UP 8.88 POINTS OR 0.04%/USA: YEN RISES TO 111.54/
3. Europe stocks OPENED GREEN /
USA dollar index FALLS TO 94.29/Euro RISES TO 1.1737
3b Japan 10 year bond yield: FALLS TO . +.06/ !!!!(Japan buying 100% of bond issuance)/Japanese yen vs usa cross now at 111.54/ THIS IS TROUBLESOME AS BANK OF JAPAN IS RUNNING OUT OF BONDS TO BUY./JAPAN 10 YR YIELD IS NOW TARGETED AT .11%/JAPAN LOSING CONTROL OF THEIR BOND MARKET
3c Nikkei now JUST BELOW 17,000
3d USA/Yen rate now well below the important 120 barrier this morning
3e WTI:: 69.69 and Brent: 75.33
3f Gold DOWN/Yen DOWN
3g Japan is to buy the equivalent of 108 billion uSA dollars worth of bond per month or $1.3 trillion. Japan’s GDP equals 5 trillion usa./“HELICOPTER MONEY” OFF THE TABLE FOR NOW /REVERSE OPERATION TWIST ON THE BONDS: PURCHASE OF LONG BONDS AND SELLING THE SHORT END
Japan to buy 100% of all new Japanese debt and by 2018 they will have 25% of all Japanese debt. Fifty percent of Japanese budget financed with debt.
3h Oil UP for WTI and UP FOR Brent this morning
3i European bond buying continues to push yields lower on all fronts in the EMU. German 10yr bund RISES TO +.450%/Italian 10 yr bond yield DOWN to 2.77% /SPAIN 10 YR BOND YIELD UP TO 1.41%
3j Greek 10 year bond yield RISES TO : 3.96
3k Gold at $1220.30 silver at:15.47 7 am est) SILVER NEXT RESISTANCE LEVEL AT $18.50
3l USA vs Russian rouble; (Russian rouble DOWN 19/100 in roubles/dollar) 62.42
3m oil into the 69 dollar handle for WTI and 74 handle for Brent/
3n Higher foreign deposits out of China sees huge risk of outflows and a currency depreciation. This can spell financial disaster for the rest of the world/
JAPAN ON JAN 29.2016 INITIATES NIRP. THIS MORNING THEY SIGNAL THEY MAY END NIRP. TODAY THE USA/YEN TRADES TO 111.54 DESTROYING JAPANESE CITIZENS WITH HIGHER FOOD INFLATION
30 SNB (Swiss National Bank) still intervening again in the markets driving down the SF. It is not working: USA/SF this morning 0.9877 as the Swiss Franc is still rising against most currencies. Euro vs SF is 1.1594 well above the floor set by the Swiss Finance Minister. Thomas Jordan, chief of the Swiss National Bank continues to purchase euros trying to lower value of the Swiss Franc.
3p BRITAIN VOTES AFFIRMATIVE BREXIT/LOWER PARLIAMENT APPROVES BREXIT COMMENCEMENT/ARTICLE 50 COMMENCES MARCH 29/2017
3r the 10 Year German bund now POSITIVE territory with the 10 year RISING to +0.45%
The bank withdrawals were causing massive hardship to the Greek bank. the Greek referendum voted overwhelming “NO”. Next step for Greece will be the recapitalization of the banks and that will be difficult.
4. USA 10 year treasury bond at 2.95% early this morning (THIS IS DEADLY TO ALL MARKETS). Thirty year rate at 3.08%
5. Details Ransquawk, Bloomberg, Deutsche bank/Jim Reid.
(courtesy Jim Reid/Bloomberg/Deutsche bank/zero hedge)
Futures Rise As Traders Digest Data Deluge After
Tech Rout; Fed Looms
It has been another relatively quiet session, as traders remain on the sidelines spooked by the sudden reversal in the growth/value trade following a sharp drop in tech stocks while keeping an eye on yields and currencies in the aftermath of the BOJ’s half-hearted attempt to steepen the JGB yield curve even as the central bank “forward guided” to years of easy policy to come as it slashed inflation expectations for FY19 (1.5% from 1.8%) and FY20 (1.6% from 1.8%). Meanwhile, the Eurozone added even more confusion after it reported that GDP unexpectedly slowed coming below expectations while inflation beat consensus, printing above 2.0% for the first time since 2012.
As a result, markets and futures are largely in the green, if only modestly so.

It all started with the BOJ, which took its time to announce just after 1pm local time that it is introducing forward guidance signaling that interest rates will stay low for an “extended period of time”, even as it tweaked Yield Curve Control parameters, which however were not adjusted in same manner as sources had previously hinted, disappointing markets and leading to a sharp drop in JGB yields.

As discussed earlier, in his best attempt to imitate Draghi, BOJ governor Kuroda left the key interest rates unchanged, saying he sees no need for additional easing for now while announcing policy tweaks, including reducing the amount of bank reserves subject to its negative interest rate and forward guidance for policy rates. The BoJ said the decision on asset purchases was unanimous and decision on YCC was made by 7-2 vote with Kataoka and Harada the dissenters, while it added it will permit upward and downward moves in 10yr yields but will buy JGBs promptly in the event of a rapid increase in yields. Furthermore, the BoJ adjusted its ETF allocation to include more TOPIX inclusion and lowered the balance of reserves for which NIRP is applied.
Kuroda also kept YCC mostly unchanged, reiterating that the BOJ will keep the 10-year yield at about zero percent even as the “tolerance band” of the 10Y around 0% would be doubled from 0.1% to 0.2%. For the market, this was not enough.
In sympathy, treasuries advanced and most European government debt nudged upward, although the JGB driven rally was faded through the European morning with respective curves off the flattest levels, in part after above consensus Eurozone CPI pressured bunds and euribors further.

Meanwhile, concerns about the ongoing tech rout kept equities under pressure, with Europe’s Stoxx 600 Index drifting lower even after BP and Credit Suisse reported positive earnings.
Futures on the S&P 500 and Nasdaq pointed to a slightly higher open before Apple’s results. Meanwhile, the euro climbed on positive inflation data from France and Germany, even as European GDP unexpectedly slowed and missed expectations.
- EU HICP Flash YY Jul 2.1% vs. Exp. 2.0% (Prev. 2.0%)
- EU CPI ex-Food, Energy, Alcohol & Tobacco Flash YY 1.1% vs. Exp. 1.0% (Prev. 0.9%)

Europe’s softer economic data was the latest to confirm that global uncertainty over the threat of a trade war is starting to weigh on sentiment and the economy; ECB President Mario Draghi last week singled out protectionism as a key risk to the region’s otherwise encouraging outlook. Europe’s GDP numbers followed data earlier showing Spain’s economy expanded 0.6 percent in the second quarter, slightly below forecasts. In France, growth also fell short of predictions.

There was more economic weakness, this time from China, whose manufacturing PMI dropped again in July, with slower credit growth this year denting demand and the imposition of the first round of U.S. tariffs taking a toll, and pressuring most commodities lower.
In FX, aside from a sharp move in the Yen as longs unwound positions, it was also relatively quiet: the Bloomberg Dollar Spot Index was little changed, set for its first monthly decline (-0.7%) since March, before the Fed starts its own 2-day policy meeting later Tuesday. The euro rose a third day as inflation accelerated further in July, despite a miss in GDP. Treasuries advanced along with euro-area bonds, while the yen weakened, after the Bank of Japan kept its 10-year yield target unchanged and introduced forward guidance to keep rates very low for an “extended period of time.”
Emerging-market shares slipped, while their currencies were steady even as Turkey’s lira extended losses.
Hungry for more? You won’t have long to wait as the next big monetary policy events this week include decisions from the Federal Reserve and Bank of England. After last week’s whopper of a GDP report, Markets are looking for confirmation of at least two more interest-rate hikes before the end of the year, while their British counterparts are also widely expected to increase borrowing costs, although some wonder if this may be a “one and done” affair.
WTI (-0.5%) and Brent (-0.6%) prices are ebbing lower in early European trade with oil prices set for their biggest monthly loss in 2 years. News flow remains light for the complex while Iranian President Rouhani continues to defend the nation’s “rights” to export oil. Meanwhile, spot gold (-0.2%) prices are relatively uneventful in recent trade while the DXY remains rangebound ahead of a few key risk events this week. Elsewhere, Shanghai rebar steel posted its best month in eight amid output curbs in China tightening supply.
Economic data include personal income and spending. Pfizer, P&G, Apple, and Cheesecake Factory are among companies reporting earnings.
Market Snapshot
- S&P 500 futures up 0.1% to 2,806.75
- STOXX Europe 600 down 0.1% to 390.51
- MXAP down 0.6% to 167.15
- MXAPJ down 0.2% to 541.91
- Nikkei up 0.04% to 22,553.72
- Topix down 0.8% to 1,753.29
- Hang Seng Index down 0.5% to 28,583.01
- Shanghai Composite up 0.3% to 2,876.40
- Sensex down 0.2% to 37,425.19
- Australia S&P/ASX 200 up 0.03% to 6,280.20
- Kospi up 0.08% to 2,295.26
- German 10Y yield fell 1.2 bps to 0.434%
- Euro up 0.2% to $1.1725
- Italian 10Y yield rose 19.6 bps to 2.672%
- Spanish 10Y yield fell 0.9 bps to 1.417%
- Brent futures down 0.3% to $74.78/bbl
- Gold spot down 0.2% to $1,219.15
- U.S. Dollar Index little changed 94.28
Top Overnight News
- Bank of Japan Governor Haruhiko Kuroda pushed through changes to his radical monetary stimulus program as the central bank prepares for a longer struggle to stoke inflation. While keeping unchanged its two major benchmarks — the negative interest rate and 10-year yield target — the BOJ took a number of steps to alleviate the strain on banks and the market distortions stemming from its policy
- A bumper day of euro-area economic releases showed the region’s vital signs remain good, but are slowing:
- Eurozone July CPI Estimate y/y: 2.1% vs 2.0% est (unrounded 2.149%); Core CPI 1.1% vs 1.0% est.
- While the region’s economic expansion entered a sixth year in the second quarter, growth unexpectedly slowed to just 0.3 percent, the weakest in two years
- WSJ: Trump has privately agreed to delay a potential shutdown or a fight over border wall funding until after the midterm elections, according to people familiar
- Canada’s bid to take part in senior-level NAFTA talks between the U.S. & Mexico later this week has been rejected, according to people familiar: National Post
- NYT: Trump administration is considering going around Congress and granting a $100b tax cut via tweaking capital gains calculations, according to people familiar
- Inflation accelerated further above the European Central Bank’s goal in July, though that was largely driven by stronger energy prices
- Unemployment in the euro region remained at the lowest since 2008
- Iran’s Revolutionary Guards, in unusually pointed language, called on President Hassan Rouhani to do more to prop up the rial after the currency fell to a historic low this week in anticipation of renewed U.S. sanctions.
Asian equity markets traded mostly subdued after the continued tech sell-off in US where all majors declined and the Nasdaq posted its worst 3-day performance in 4 months, while disappointing Chinese PMI data and tightening concerns heading into the BoJ policy announcement added to the cautiousness. ASX 200 (+0.1%) and Nikkei 225 (-0.1%) were mixed with Australia just about kept afloat amid outperformance in telecoms and gains in commodity-related sectors, while the Japanese benchmark was weighed alongside widespread uncertainty regarding potential BoJ policy tweaks which proved to be less hawkish than some had feared as the central bank maintained its long-term yield target at 0% and provided forward guidance that rates will be maintained at very low levels for an extended period. Elsewhere, Hang Seng (-0.5%) and Shanghai Comp. (+0.3%.) were downbeat after the PBoC skipped repo operations for an 8th consecutive occasion and as participants digested Chinese Official Manufacturing and Non-Manufacturing PMI missed expectations in which the latter fell to its weakest in nearly a year. The Shanghai Comp., however, rebounded into positive territory before the close. Finally, 10yr JGBs initially began on the back-foot as yields continued to gain heading into the BoJ but then recovered after the central bank kept its long-term yield at 0.0% and although it announced more flexibility in allowing yields to move higher and lower, it also signalled to act if there is a rapid increase in yields
Top Asian News
- BOJ to Allow Flexibility in Bond Operations, Adjusts ETF Buying
- China Sovereign Bonds Head for First Monthly Decline in Six
- Coal Goes From Summer Boom to Bust on Ample Supply in China
- Mizuho Profit Rises 36%, Led by Share Sale Gains and Fee Income
European equities are trading with no firm direction (Eurostoxx 50 +0.1%) in the aftermath of a slew of pre-market earnings. Italy’s FTSE MIB outperforms its peers as Leonardo (+8.8%) lifted the index after a guidance upgrade, local banks are also supporting the Italian benchmark. Sector-wise, Energy names are fuelled amid oil giant BP (+0.8%) reporting strong numbers, while Financials are boosted by optimistic earnings from Credit Suisse (+1.2%) in-turn lifting its peers with Deutsche Bank (+2.0%), SocGen (+1.3%) Commerzbank (+0.8%), UBS (+1.0%) all higher in sympathy. Looking ahead, FTSE 100 giant Shire are to report around mid-day, while major auto-producing countries are meeting in Geneva today to discuss US Auto tariffs.
Top European News
- EDF Raises Low End of 2018 Profit Target as Earnings Climb
- Elementis Rethinks $600 Million Deal Amid Investor Revolt
- StanChart’s Surging Costs Hinder Profit Growth for CEO Winters
- Sanofi Narrows Profit Outlook as New Drugs Seen Delivering
- Lufthansa Sees Fare Gains Lifting Profit, Offsetting Fuel Costs
In FX, although the Dollar has benefited from yet another bout of Yuan weakness on fixed and free-floating grounds, ‘strong’ sell signals from end of July portfolio rebalancing models are still weighing overall. AUD/JPY Flanking the G10 spectrum into month end, with the Aud boosted by much stronger than expected Aussie building approvals overnight and forming a firmer foothold above 0.7400 vs the Usd, but possibly hampered by hefty option expiry interest between 0.7410-25. Conversely, the Jpy is underperforming after the BoJ policy meeting and more flexible or technical changes to its QE framework rather than any real hawkish shift, not to mention the addition of very dovish rate guidance. Hence, Usd/Jpy is back over 111.00 and testing 111.50+ close to 10 and 21 DMA convergence around 111.47 plus a Fib at 111.51, while Japanese exporters were reportedly on the offer from 111.30-50 for month end. Note, however, Aud/Jpy has rallied through 82.50. CAD/NZD – Also bucking the firmer overall trend and down vs their US peer, albeit not as weak as the Jpy. The Loonie has been undermined by Canada’s exclusion from high level NAFTA talks between the US and Mexico, although off worst levels approaching 1.3100 and back near the middle of a 1.3020-95 range ahead of a raft of data, including May GDP, June PPI and raw materials prices. Meanwhile, the Kiwi is still hovering above the 0.6800 handle, but not helped by a deterioration in NZ business sentiment or activity outlook.
In commodities, WTI (-0.5%) and Brent (-0.6%) prices are ebbing lower in early European trade with oil prices set for their biggest monthly loss in 2 years. News flow remains light for the complex while Iranian President Rouhani continues to defend the nation’s “rights” to export oil. Meanwhile, spot gold (-0.2%) prices are relatively uneventful in recent trade while the DXY remains rangebound ahead of a few key risk events this week. Elsewhere, Shanghai rebar steel posted its best month in eight amid output curbs in China tightening supply.
Looking at the day ahead, we’ll get the June PCE and the Q2 ECI data should be the main focus, while the July Chicago PMI and July consumer confidence data are also slated for release. Along with the Apple numbers, Procter & Gamble, Pfizer, BP and Credit Suisse earnings are also due.
US Event Calendar
- 8:30am: Personal Income, est. 0.4%, prior 0.4%; Personal Spending, est. 0.4%, prior 0.2%
- PCE Deflator MoM, est. 0.1%, prior 0.2%; PCE Deflator YoY, est. 2.3%, prior 2.3%
- PCE Core MoM, est. 0.1%, prior 0.2%; PCE Core YoY, est. 2.0%, prior 2.0%
- 8:30am: Employment Cost Index, est. 0.7%, prior 0.8%
- 9am: S&P CoreLogic CS 20-City MoM SA, est. 0.2%, prior 0.2%; CS 20-City YoY NSA, est. 6.4%, prior 6.56%
- 9:45am: Chicago Purchasing Manager, est. 62, prior 64.1
- 10am: Conf. Board Consumer Confidence, est. 126, prior 126.4; Present Situation, prior 161.1; Expectations, prior 103.2
DB’s Craig Nicol concludes the overnight wrap
Only one place to start this morning and that’s with the BoJ, where overnight the central bank has kept its policy rates unchanged as widely expected by a majority vote of 7-2. The statement itself has included only very minor tweaks including a vague reference to allowing upward and downward movement in the 10y JGB yield, as well as the introduction of forward guidance. As expected inflation forecasts have been cut for FY19 (1.5% from 1.8%) and FY20 (1.6% from 1.8%) while the BoJ has also shifted ETF purchases from tracking the Nikkei to the Topix. A reference to reducing the size of financial institutions’ balances at the BoJ subject to negative rates was also introduced.
Governor Kuroda is due to speak at 3.30pm local time (7.30am BST) which should help clarify some of the language in the statement. The main question mark appears to centre around that addition of allowing JGB yields to move “upward and downward to some extent mainly depending on developments in economic activity and prices” but also responding “promptly” to a rapid increase in yields. The forward guidance reference refers to the BoJ’s intention to “maintain the currently extremely low levels of short and long-term interest rates for an extended period of time” so this could also be a talking point.
The early take is that the statement is probably slightly dovish however and that appears to be how markets are interpreting it with 10y and 30y JGB yields down -3.2bps and -4.7bps respectively to 0.059% and 0.775%. The Yen has whipsawed a bit but is back to little changed as we type while the Nikkei pared early losses of around -0.75% and is now up +0.24%. Other markets in Asia are flat to slightly down.
Also having their say this morning are China’s July PMIs which came in slightly softer than expected. The manufacturing PMI was the lowest since February after falling 0.3pts to 51.2 (vs. 51.3 expected) with the new orders and new export orders components both down (the latter below 50 for the second consecutive month). The bigger move was in the non-manufacturing PMI which fell a full point to 54.0 (vs. 54.9 expected), leaving the composite at 53.6 and down 0.8pts from June.
Going into the BoJ this morning markets yesterday were hardly waiting around with a decent rise in bond yields and curves bear steepening certainly the main macro story. Indeed 10y yields across Europe finished broadly +4bps to +6bps higher with Bunds in particular ending +4.2bps higher at 0.444% – the highest yield since June 13th. The 2s10s curve ended +2.8bps wider too while Treasuries, although ending off their yield highs, saw 10y yields (+1.9bps) test last week’s nine-week highs again, although they have rallied all the way back this morning.
The 2s10s curve also nudged back up to around 30bps and 2s30s up to 44bps. It wasn’t much better for US equity markets meanwhile in what was a bit of a copy and paste from Friday’s session. The NASDAQ closed down -1.39% last night for what was the third consecutive daily loss for the index of at least 1% – the first time that has happened since August 2015. The heavyweight FANG names led the way with the NYSE FANG Index (-2.83%) also notching up a third consecutive daily loss – the cumulative three-day decline of -8.95% also the biggest in three years. The market cap of that index has also lost $244bn in those three days – roughly equivalent to the GDP of Egypt. It’s worth noting that Apple results are out after the close tonight so expect the market to be fully tuned in given all the turmoil in the tech sector at the moment. The S&P 500 and DOW also closed down -0.58% and -0.57% respectively yesterday although Banks (+0.43%) did benefit from the yield move.
That backdrop for US equities came despite global growth proxy Caterpillar reporting better than expected results yesterday. As a reminder it was back in Q1 that management spooked markets with that “high water mark” comment during the Q1 earnings call which had markets questioning whether or not we’d seen the peak. However yesterday the company talked about “continued strength in many of our end markets” and also “strong demand” for orders well into 2019. Indeed a deeper look at their results showed that revenues were up across all geographic regions as well as the big three business segments. The company also added that it will be offsetting up to $200m in tariff costs in the second half of this year through raising prices and cutting costs.
In other news, while bonds were well offered yesterday the inflation data in Europe didn’t particularly move the dial. Germany’s flash July CPI reading printed in line at +0.4% mom, helping to keep the annual rate unchanged at +2.1% yoy. Spain however was a little bit on the softer side with the -1.2% mom reading one-tenth below expectations. As a reminder this afternoon we’ll get the June PCE and Q2 employment cost index prints in the US. Consensus for the core PCE reading is +0.1% mom while the ECI is expected to come in at +0.7% qoq. Our US economists also expect a relatively soft +0.1% mom core PCE reading which could push the annual rate down one-tenth to +1.9% yoy. However, our colleagues make the point that these forecasts should be taken with a grain of salt given the BEA’s benchmark revisions. Recent quarters’ core inflation data were revised upwards, with Q1’s year-on-year rate increasing by about 15bps to
1.75%, potentially signifying a firmer inflation trend.
As for the other data yesterday. In the US, the July Dallas Fed index was above expectations at 32.3 (vs. 31.0 expected) while the prices paid and prices received indices both moderated from last month’s 7-year high. Elsewhere the June pending homes print rose for the first time in three months to an above market print of +0.9% mom (vs. +0.1% expected), but the lack of available homes for sale still contributed to an annual fall of -4.0% yoy on an unadjusted basis. Meanwhile the Euro area’s July economic confidence (112.1 vs. 112.0 expected) and business climate index (1.29 vs. 1.35 expected) were broadly in line, while the final reading for consumer confidence was confirmed at -0.6 and unchanged from June. Back in the UK, June mortgage approvals edged up to a 5-month high of 65.6k (vs. 65.5k expected) while the June consumer credit was also above market at £1.6bn (vs. £1.4bn expected). So fairly solid credit data in the UK.
Aside from that, the only other point to note were some fairly hardline comments from US Commerce Secretary Ross. He noted that it makes more sense to take an “aggressive stance” with China while the US economy is doing well, in part because “there’s more ability for the economy to absorb whatever short-term problems may come”. He used the analogy of going into a diet, where “it’s no fun in the beginning…maybe a bit painful…but at the end of the day, you’re kind of happy with the end result”. In contrast China’s Foreign Minister Wang Yi noted yesterday that “China’s door of dialogue and negotiations remains open, but any dialogue must be based on equality and mutual respect”. Elsewhere on NAFTA, Mr Ross noted that “our most close-to-completion negotiations are with NAFTA, particularly with Mexico” and “there’s a pretty good chance that we could be on a pretty rapid track with the Mexican talks”. That helped the Mexican Peso rally +0.49% versus the dollar yesterday meaning it is now up over +11% since mid-June.
Looking at the day ahead, attention will turn to the aforementioned BoJ press conference which kicks off after we go to print. Datawise, we’ll get the preliminary July CPI prints for France, Italy and the Euro area this morning along with the advance Q2 GDP release for the Euro area. In the US, as noted above June PCE and the Q2 ECI data should be the main focus, while the July Chicago PMI and July consumer confidence data are also slated for release. Along with the Apple numbers, Procter & Gamble, Pfizer, BP and Credit Suisse earnings are also due.
3. ASIAN AFFAIRS
i)TUESDAY MORNING/MONDAY NIGHT: Shanghai closed UP 7.35 POINTS OR 0.26% /Hang Sang CLOSED DOWN 150.12 POINTS OR 0.52%/ / The Nikkei closed UP 8.88 POINTS OR 0.04%/Australia’s all ordinaires CLOSED DOWN 0.04% /Chinese yuan (ONSHORE) closed DOWN at 6.8329 AS POBC RESUMES ITS HUGE DEVALUATION /Oil UP to 69.69 dollars per barrel for WTI and 75.33 for Brent. Stocks in Europe OPENED GREEN//. ONSHORE YUAN CLOSED WELL DOWN AT 6.8329 AGAINST THE DOLLAR. OFFSHORE YUAN CLOSED DOWN ON THE DOLLAR AT 6.8391: HUGE DEVALUATION/PAST SEVERAL DAYS RESUMES : /ONSHORE YUAN TRADING STRONGER AGAINST OFFSHORE YUAN/ONSHORE YUAN TRADING WEAKER AGAINST USA DOLLAR/OFFSHORE YUAN TRADING WEAKER AGAINST THE DOLLAR /CHINA RETALIATES WITH TARIFFS/ TRUMP RESPONDS TO NEW TARIFFS AND IT NOW A FULL TRADE WAR COMMENCED
3 a NORTH KOREA/USA
North Korea/South Korea/USA/China
3 b JAPAN AFFAIRS
As expected, Japan’s economy is shrinking because it is aging. The bank of Japan shifts to a more flexible bond buying plan trying to steepen the yield curve. Japan will continue with its stealth tapering and if need be, they will increase purchases of bonds to keep the yield below .11% It did not work
(courtesy zerohedge)
US Treasuries, JGBs Rally As Bank Of Japan Shifts To “More Flexible” Bond-Buying Plan
After a few years of relative apathy, today’s Bank of Japan statement is greeted with considerable anticipation as it may well have some significant impacts on global markets, judging by the last two weeks’ action after hints at BoJ policy shifts.
Background:
Japan’s economy is shrinking once again…

Industrial Production is plunging…

As a reminder, The BoJ cut its inflation forecast at the last meeting…

But the most-watched item in today’s statement will be with regard Yield Curve Control (YCC) as recent source articles have suggested that the BoJ will discuss potential policy changes to its YCC framework on the basis of sustainability, not tightening, of monetary policy which could lead to an adjustment of the yield curve target – where the 10Y JGB trades – to allow a long-term natural rise. This is said to be the cause due to the central bank’s admission that it may take even longer to hit the 2% price target, and therefore would need to ensure its policy measures can be sustained, while a policy tweak could also help alleviate some of the side-effects from its prolonged ultra-loose policy which has squeezed banks’ profits.

And yet, few expect that the BOJ will make an explicit YCC determination today, as an increase in the JGB yield target appears unlikely at a time when it is expected to revise downward its inflation forecast; instead in consideration of the adverse side effects of its policy, the BoJ will likely declare at the end of its statement that, based on its analysis in its quarterly Outlook Report, that it will maintain its easing policy for an extended period but will conduct financial market operations and asset purchasing operations to address the mounting cumulative side effects.
And in case there is a negative reaction to this apparent ‘tightening’, one likely easing measure to deal with such side effects will include an overhaul of its JPY6 billion ETF purchasing operations, a shift from Nikkei 225-linked ETF to Topix-linked ETF, which would likely spur investors to follow suit in rebalancing their portfolios should this materialize.
And finally, while ‘officially’ The Bank of Japan has not shifted its bond-buying program’s scope, in practice it has been tapering dramatically… forced by liquidity constraints in the market.

And it is this forced tapering that confirms the lack of sustainability of its bond-buying program that The BoJ has expressed concern about.
“Market players have come to realize that the bond-purchase operations aren’t directly linked to monetary policy,” said Mari Iwashita, chief market economist at Daiwa Securities Co. in Tokyo. “Their action is dependent on conditions and does not indicate anything special in store.”

As a reminder, introduction of yield-curve control: 1:18pm (0018ET) on Sept. 21, 2016, meaning today’s announcement is the latest since then.

Having kept investors waiting for the longest time since Sept 2016’s yield curve control announcement, The Bank of Japan – desperate to avoid a repeat of 2013’s Fed-driven taper-tantrum – kept policy the same aside from a nuanced shift in language around the bond operations.
- BOJ Maintains Policy Balance Rate at -0.100%
- BOJ Maintains 10-Year JGB Yield Target at About 0.000%
But here’s the twist:
- BOJ to Allow More Flexibility in Bond Operations – allowing upward and downward movement in yields
- BOJ to Act Promptly in Case of Rapid Increase in Yield
And as we suspected:
- BOJ Shifts ETF Allocation Further to Topix From Nikkei
- BOJ: ETF Puchases Amount May Change on Market Conditions
Additionally, BoJ cut its inflation outlook for FY18, 19, and 20.
The BOJ repeats that it remains committed to QQE with YCC (ensuring a dovish perspective).
Finally BoJ confirmed it intends to keep very low rates for “extended period of time.”
And the reaction in USDJPY and JGBs was very clear… (USDJPY has been glued to 111 the figure for the last 48 hours or so). Bonds are bid (unwinding the yield spike from last week’s rumors, but Yen is weaker)…

And Treasuries are bid too on modest relief that The BoJ did not go full taper tantrum…

Kuroda tried to use powerful language but the BOJ statement itself underscores that this isn’t a policy change– “Strengthening the Framework for Continuous Powerful Monetary Easing.”
The bottom line is this allows The BoJ to continue its stealth tapering and be flexible enough to act if yields suddenly spike (or back away when there’s no liquidity and not make it a spectacle).
end
Discussion of the latest Kuroda policy: Kuroda tried to steepen the curve but he failed. Deflation is still ripping Japan apart and Kuroda’s attempt to help the banks was off themark
(courtesy zerohedge)
Kuroda Tries To Pull Off A “Draghi” As He Tweaks Monetary Policy, Fails
In the end, BOJ governor Haruhiko Kuroda tried his best to pull off a Mario Draghi – introducing a tightening event while smothering it in “easy” forward guidance – and failed.
While Kuroda was not faced with anything nearly as dramatic as announcing the end of QE as Draghi did last month, the BOJ head still tried having his monetary easing cake while somehow modestly steepening yield curves to give Japanese banks a little extra support now that the BOJ has been forced to admit that its inflation targeting timeframe has been a disaster, and QE will continue indefinitely, or at least until it runs out of bonds to buy. For now, it is unclear if he will succeed, especially since the market’s reaction was not what Kuroda had expected, and for good reason: the “market” knows well that even the smallest gambit to reverse policy would blow up in Kuroda’s face. But that doesn’t mean he won’t try.
As a reminder, here is what happened overnight: as previously leaked to the press, the BOJ took – or at least tried to take – several steps to alleviate the strain on banks and the market distortions stemming from its policy while keeping unchanged its two major benchmarks – negative interest rate and the 10-year yield target of 0%. The central bank added modest flexibility on rates while keeping the 10Y anchored at 10%, it also pulled a page out of the ECB’s playbook and added forward guidance on rates, while making small superficial changes to its ETF buying program.
The initial response was underwhelming, with JGB yields sliding after the announcement was released just minutes after 1pm local time, as the market realized that contrary to the leaks, the BOJ would keep its Yield Curve Control in its current form.
For those who missed our initial report, here are the key highlights from the most anticipated BOJ statement in 2 years:
- Negative interest rate of -0.1 percent maintained, but will apply to fewer reserves to cushion the impact on commercial banks
- Target yield for 10-year bonds remains 0%
- The BOJ added language stating that “the yields may move upward and downward to some extent mainly depending on developments in economic activity and prices.”
- Just like the ECB, the BOJ added forward guidance to its policy rates, with a commitment to keep the current extremely low levels for short- and long-term interest rates for an “extended period of time”
- Overall purchases of exchange-traded funds are kept at 6 trillion yen ($54 billion) but those linked to the Topix will increase to 4.2 trillion yen, from 2.7 trillion yen, further reducing the weighting of the narrower Nikkei 225
Perhaps in an attempt to reverse the market’s initial disappointment, during the press conference that followed a few hours later, Kuroda indicated that the BOJ will tolerate 10-year yields deviating as much as 0.2% from zero, compared with 0.1% now as the decline in JGB trading meant market function has been declining. However, even here Kuroda was afraid to go too far, and said he doesn’t think there is a need to keep expanding the range.
In other words, instead of blowing out as far as 0.1%, the 10Y JGB may now hit as much as 0.2% before the central bank steps in with one of its fixed-rate operations.
Meanwhile, the main reason why Kuroda was unable to indicate tightening is that also today the BOJ sharply cut its inflation forecasts, suggesting it’s preparing for an even lengthier battle to generate 2% price gains, and further widening the gap with central bank peers who are moving away from crisis-era policies. The headline of the BOJ’s statement underscored the goal: “Strengthening the Framework for Continuous Powerful Monetary Easing.”
“The BOJ is now more engaged and prepared to fight a long-run battle against deflation or disinflation,” said Shigeto Nagai, Head of Japan Economics at Oxford Economics.
Meanwhile, “Putting forward guidance in the statement just merely acknowledges what the BOJ has been implementing, and it just means the bank will continue to carry on YCC without changing the framework” said Akio Kato, trader at Mitsubishi UFJ Kokusai Asset Management.
As a result, Japan’s 10-year JGB sank 4 points to 0.062%, the lowest in more than a week…

… while the Japanese yen decreased 0.4 percent to 111.50 per dollar, the weakest in more than a week.

The Topix stock index sank 0.8% to the lowest in a week on the biggest decrease in almost four weeks, dragged lower by banks as hopes of even a modest sustainable steepening in the yield curve proved false.
Perhaps the most important datapoint in the entire announcement was Kuroda’s implicit admission he has failed on the bank’s stated goal of hitting 2% inflation. The central bank now sees core consumer prices rising just 1.1% in the current fiscal year through March, down from 1.3% projected previously. The estimate for fiscal 2019 was cut to 1.5%, from 1.8%, while fiscal 2020 was trimmed to 1.6%, from 1.8%.
“Prices and wages are both rising, but the central bank’s previous forecast that 2 percent inflation would be reached in the 2019 fiscal year has been delayed” Kuroda said, and the BOJ head also admitted what we predicted all the way back in 2012, in why QQE would fail: “Inflation did rise to 1.5% a fast acceleration, but wages didn’t rise, stopping consumption” Kuroda said, and conceded that he “does’t have a calendar for reaching 2% inflation, but believe prices will gradually rise.”
Maybe. Just not in the near term, which is why for all the leaks of rumors tightening, the BOJ just extended its easy policy runway by another 2 years to give inflation one final chance to hit its target.
“They tried their best to avoid the perception of tapering or normalization by introducing the forward guidance,” said Nagai, confirming that the most recent topic of dinner conversation at the Basel Tower was how Kuroda can successfully imitate what Draghi pulled off recently.
“The guidance is vague but gives some assurance that the current easing measures will continue at least into fiscal 2020, after checking the side effects of the planned consumption tax hike.”
Which is great: nobody expected Kuroda to be able to hypnotize the market like Draghi; he does however have a far bigger problem – whether he wants to admit it or not, Draghi is tightening and tapering for one simple reason: the central bank is running out of bonds to buy. And when the downward sloping curve below hits 0, it’s game over.

July 31, 2018
The following is an excerpt from Graham Summers’ weekly investment service, Private Wealth Advisory.
Is Japan about to blow up?
(courtesy Graham Summers)
Did Japan Just Signal the Start of the Next Crisis?
Is the Bank of Japan Finally Losing Control?
While we like to focus on the US Federal Reserve (the Fed) because it controls the global reserve currency (the US dollar) and therefore is the most important Central Bank in the world… the fact is that it is Japan’s Central Bank, the Bank of Japan (BoJ), that has been leading the current course of Central Bank insanity for the better part of two decades.
The Fed first cut rates to ZERO in 2008. The BoJ did this back in 1999. Similarly, the Fed first launched QE in 2008. The BoJ did this back in2000.
Put simply, everything the Fed has been trying, the BoJ has got over 16 years’ experience with. As crazy as Fed monetary policy has been, the BoJ surpassed it by many multiples years ago.
To whit, the BoJ has bought so many assets via QE that today:
- The BoJ’s balance sheet is roughly the size of Japan’s GDP.
- The BoJ is a top-10 shareholder in 40% of Japan’s companies.
- The BoJ buys more Japanese stocks than the rest of the world does.
Put simply, the BoJ and its policies are beyond insane. We’re talking about a Central Bank that has essentially monetized Japan’s bond market and stock markets to a degree few thought was possible.
This has lead many to ask… when does this gigantic mess finally start to blow up?
The answer is that it might be happening now.
end
c) REPORT ON CHINA/HONG KONG
Stocks and the yuan rise as it was stated that trade talks are resuming. This will not last.
(courtesy zero hedge)
Stocks, Yuan Surge After US, China Said To Seek Restart Of Trade Talks
With the next wave of US tariffs set to hit as soon as Wednesday, and with trade negotiations stalled for weeks, Beijing and Washington are said to be eager to trying talks in order to avert a full-blown trade war, according to Bloomberg, citing two people familiar with the effort.
According to Bloomberg sources, representatives of Steven Mnuchin and Chinese Vice Premier Liu He are having private conversations as they look for ways to reengage in negotiations. However, they have cautioned that a specific timetable, the issues to be discussed and the format for talks aren’t finalized, but at least there is agreement among the principals that more talks need to take place.
After some early success, negotiations have been stalled for weeks, with both sides in a standoff. Meanwhile, high-level US talks on trade posture with China are ongoing. Complicating matters, however, is a harder line approach taken by US trade representatitve Robert Lightizer, who is in charge of the US’s “301 investigation” that resulted in the tariffs, and which concluded that China has been stealing US technology.
The next wave of tariffs is set to kick in as soon as Wednesday, with the possible imposition of $16 billion of duties on Chinese imports – a move Beijing has vowed to respond to with the same level of tariffs on US products.
Predictably, both stocks…

… and the Yuan…

… have surged following this report that war de-escalation may be coming.
Then again, we’ve been here before. As a reminder, this latest renewed “peace” effort is being led by Mnuchin and Chinese Vice Premier Liu He – the same two allegedly brokered a truce in May, which was promptly shattered last days later by more hawkish members within the Trump administration, and the president himself.
4. EUROPEAN AFFAIRS
Salvini is accused of creating a climate of hate because of his refusal to allow any more migrants into Italy
(courtesy zerohedge)
6 .GLOBAL ISSUES
Canada
My goodness!! The loonie tumbles after Canada is excluded from NAFTA talks. All Canada has to do is refuse to sell fresh water to the States as this will become a big issue
(courtesy zerohedge)
Loonie Tumbles After Report Canada Excluded From NAFTA Talks
The Canadian Dollar legged 0.5% lower this evening after The National Post reported that the U.S. rejected attempts by Canada to take part in trade talks between the U.S. and Mexico.
American officials have taken the “highly unusual” step of rejecting Canada’s bid to take part in senior-level NAFTA talks between the U.S. and Mexico later this week, sources familiar with the trade negotiations said Monday.
One person said attempts by Foreign Affairs Minister Chrystia Freeland to get a seat at the table in Washington Thursday were either ignored, or spurned outright by the office of U.S. Trade Representative Robert Lighthizer.
Another source said the request to be at the meeting was made in a low-key fashion “so as not to spark a diplomatic incident” and was followed by “a retreat to diplomatic silence.”
And the Loonie dumped…


The Mexican peso limped very modestly lower on the headlines.
7. OIL ISSUES
Nicholas to me on the huge volume of Shanghai oil priced in yuan.
As you know these contacts can be converted into gold once the seller of that oil receives his yuan.
(courtesy Nicholas Biezanek)
8. EMERGING MARKET
VENEZUELA
Your early morning currency/gold and silver pricing/Asian and European bourse movements/ and interest rate settings TUESDAY morning 7:00 am
Euro/USA 1.1737 UP .0030/ REACTING TO MERKEL’S FAILED COALITION/ REACTING TO +GERMAN ELECTION WHERE ALT RIGHT PARTY ENTERS THE BUNDESTAG/ huge Deutsche bank problems + USA election:///ITALIAN CHAOS /AND NOW ECB TAPERING BOND PURCHASES/JAPAN TAPERING BOND PURCHASES /USA RISING INTEREST RATES /FLOODING/EUROPE BOURSES ALL GREEN
USA/JAPAN YEN 111.54 UP 0.538 (Abe’s new negative interest rate (NIRP), a total DISASTER/NOW TARGETS INTEREST RATE AT .11% AS IT WILL BUY UNLIMITED BONDS TO GETS TO THAT LEVEL
GBP/USA 1.3165 UP 0.0029 (Brexit March 29/ 2017/ARTICLE 50 SIGNED/BREXIT FEES WILL BE CAPPED
USA/CAN 1.3044 UP .0017 (CANADA WORRIED ABOUT TRADE WITH THE USA WITH TRUMP ELECTION/ITALIAN EXIT AND GREXIT FROM EU/(TRUMP INITIATES LUMBER TARIFFS ON CANADA/CANADA HAS A HUGE HOUSEHOLD DEBT/GDP PROBLEM)
Early THIS TUESDAY morning in Europe, the Euro ROSE by 30 basis points, trading now ABOVE the important 1.08 level RISING to 1.1686; / Last night Shanghai composite CLOSED UP 7.35 POINTS OR 0.26% /Hang Sang CLOSED DOWN 150.12 POINTS OR 0.52% /AUSTRALIA CLOSED DOWN 0.04% / EUROPEAN BOURSES ALL GREEN
The NIKKEI: this TUESDAY morning CLOSED UP 8.88 POINTS OR 0.04%
Trading from Europe and Asia
1/EUROPE OPENED ALL GREEN
2/ CHINESE BOURSES / :Hang Sang DOWN 150.12 POINTS OR 0.52% /SHANGHAI CLOSED UP 7.35 POINTS OR 0.26%
Australia BOURSE CLOSED DOWN 0.04%
Nikkei (Japan) CLOSED UP 8.88 POINTS OR 0.04%
INDIA’S SENSEX IN THE RED
Gold very early morning trading: 1219.50
silver:$15.45
Early TUESDAY morning USA 10 year bond yield: 2.95% !!! DOWN 3 IN POINTS from FRIDAY night in basis points and it is trading WELL ABOVE resistance at 2.27-2.32%. (POLICY FED ERROR)/
The 30 yr bond yield 3.08 DOWN 3 IN BASIS POINTS from MONDAY night. (POLICY FED ERROR)/
USA dollar index early TUESDAY morning: 94.29 DOWN 6 CENT(S) from MONDAY’s close.
This ends early morning numbers TUESDAY MORNING
xxxxxxxxxxxxxxxxxxxxxxxxxxxxxxxxxxxxxxxxxxxxxxxxxxxxxxxxxxxxxxxxxxxxxxxxxxxxxxxxxxxxxxxxxxxxxxxxxxxxxxxxxxxxxxx
And now your closing TUESDAY NUMBERS \1: 00 PM
Portuguese 10 year bond yield: 1.74% DOWN 3 in basis point(s) yield from MONDAY/
JAPANESE BOND YIELD: +.06% DOWN 4 in basis points yield from MONDAY/JAPAN losing control of its yield curve/
SPANISH 10 YR BOND YIELD: 1.400% DOWN 3 IN basis point yield from MONDAY/
ITALIAN 10 YR BOND YIELD: 2.746 DOWN 4 POINTS in basis point yield from MONDAY/
the Italian 10 yr bond yield is trading 135 points HIGHER than Spain.
GERMAN 10 YR BOND YIELD: FALLS TO +.440% IN BASIS POINTS ON THE DAY
END
xxxxxxxxxxxxxxxxxxxxxxxxxxxxxxxxxxxxxxxxxxxxxxxxxxxxxxxxxxxxxxxxxxxxxxxxxxxxxxxxxxxxxxxxxxxxxxxxxxxxxxxxxxxxxxxxxxxxxxxxxxxxxxxxxxxxx
IMPORTANT CURRENCY CLOSES FOR TUESDAY
Closing currency crosses for TUESDAY night/USA DOLLAR INDEX/USA 10 YR BOND YIELD/1:00 PM
Euro/USA 1.1705 DOWN .0003(Euro DOWN 3 Basis points/ represents to DRAGHI A COMPLETE POLICY FAILURE/
USA/Japan: 111.89 UP 0.893 Yen DOWN 89 basis points/
Great Britain/USA 1.3123 DOWN .0012( POUND DOWN 12 BASIS POINTS)
USA/Canada 1.3018 DOWN 9 Canadian dollar UP 9 Basis points AS OIL FELL TO $68.98
xxxxxxxxxxxxxxxxxxxxxxxxxxxxxxxxxxxxxxxxxxxxxxxxxxxxxxxxxxxxxxxxxxxxxxxxxxxxxxxx
This afternoon, the Euro was DOWN 3 to trade at 1.1705
The Yen FELL to 111.89 for a LOSS of 89 Basis points as NIRP is STILL a big failure for the Japanese central bank/HELICOPTER MONEY IS NOW DELAYED/BANK OF JAPAN NOW WORRIED AS AS THEY ARE RUNNING OUT OF BONDS TO BUY AS BOND YIELDS RISE
The POUND LOST 12 basis points, trading at 1.3123/
The Canadian dollar GAINED 9 basis points to 1.3018./ WITH WTI OIL FALLING TO 68.98
The USA/Yuan closed AT 6.8167 ON SHORE
THE USA/YUAN OFFSHORE: 6.7923
the 10 yr Japanese bond yield closed at +.06% DOWN 4 BASIS POINTS.
Your closing 10 yr USA bond yield DOWN DOWN 1 IN basis points from MONDAY at 2.96 % //trading well ABOVE the resistance level of 2.27-2.32%) very problematic USA 30 yr bond yield: 3.08 DOWN 2 in basis points on the day /
THE RISE IN BOTH THE 10 YR AND THE 30 YR ARE VERY PROBLEMATIC FOR VALUATIONS
Your closing USA dollar index, 94.47 UP 12 CENT(S) ON THE DAY/1.00 PM/
Your closing bourses for Europe and the Dow along with the USA dollar index closing and interest rates for TUESDAY: 1:00 PM
London: CLOSED UP 47.91 POINTS OR 0.62%
German Dax :CLOSED UP 7.30 OR 0.06%
Paris Cac CLOSED UP 20.08 POINTS OR 0.37%
Spain IBEX CLOSED UP 16.80 POINTS OR 0.17%
Italian MIB: CLOSED DOWN 274,68 POINTS OR 1.25%
The Dow closed UP 108.36 POINTS OR 0.43%
NASDAQ closed UP 41.79 points or 0.55% 4.00 PM EST
WTI Oil price; 68.97 1:00 pm;
Brent Oil: 74.74 1:00 EST
USA /RUSSIAN ROUBLE CROSS: 62.35 DOWN 9/100 ROUBLES/DOLLAR (ROUBLE HIGHER BY 9 BASIS PTS)
TODAY THE GERMAN YIELD FALLS TO +.440% FOR THE 10 YR BOND 1.00 PM EST EST
END
This ends the stock indices, oil price, currency crosses and interest rate closes for today 4:30 PM
Closing Price for Oil, 4:00 pm/and 10 year USA interest rate:
WTI CRUDE OIL PRICE 4:30 PM:$68.36
BRENT: $74.03
USA 10 YR BOND YIELD: 2.96% the dropping yields signify markets are in turmoil
USA 30 YR BOND YIELD: 3.08%/
EURO/USA DOLLAR CROSS: 1.1691 DOWN .0016 ( DOWN 16 BASIS POINTS)
USA/JAPANESE YEN:111.79 UP 0.795 (YEN DOWN 80 BASIS POINTS/ .
USA DOLLAR INDEX: 94.49 UP 15 cent(s)/
The British pound at 5 pm: Great Britain Pound/USA: 1.3118 DOWN 17 POINTS FROM YESTERDAY
Canadian dollar: 1.3011 UP 11 BASIS pts
USA/CHINESE YUAN (CNY) : 6.8167 (ONSHORE)
USA/CHINESE YUAN(CNH): 6.8053 (OFFSHORE)
German 10 yr bond yield at 5 pm: ,0.440%
VOLATILITY INDEX: 12.83 CLOSED UP 1.43
LIBOR 3 MONTH DURATION: 2.343% .
And now your more important USA stories which will influence the price of gold/silver
TRADING IN GRAPH FORM FOR THE DAY
Stocks Soar In July Despite FANGover, Crude
Carnage, Yield Curve Collapse
This seemed to sum up the month rather well…
July high- (and low-) lights
- China CHINEXT down for 4th straight month to lowest since Jan 2015
- Shanghai Composite best month since Jan 2018
- DAX best month since Sept 2017
- Trannies best month since Nov 2016 (US election)
- Dow, S&P’s best month since January 2018
- Small Caps up for 5th month in a row
- Nasdaq up for 4th month in a row
- FANG Stocks worst month since Nov 2016 (US election)
- TWTR worst month…ever
- FB worst month since Aug 2012
- NFLX worst month since Jan 2016
- TSLA worst month since March
- UST Yield Curve flattened for 5th straight month to Aug 2007 flats
- The Dollar Index fell on the month – first drop in 4 months
- Offshore Yuan dumped for 4th straight month to 13-month lows
- Emerging Market FX had first monthly gain since Jan 2018
- Bitcoin’s best month since April
- Gold fell for the 4th month in a row (lowest monthly close since Jan 2017)
- Copper’s worst month since Dec 2016
- WTI Crude’s worst month since July 2016
* * *
China stocks were mixed for the month with CHINEXT (China ‘Nasdaq’) worst…

All major European indices green for July…

All major US equity indices ended July in the green…

On the day we saw stocks soar early on after headlines noted the potential for improved trade talks with China but late on those hopes were dashed as officials saw no progress and stocks dipped for a millisecond…

FAANG stocks were mixed on the month with FB and NFLX crashing…

Semiconductor stocks continue to be a bright spot in an earnings season that has taken its toll on technology investors.
KLA-Tencor Corp. led the group higher Tuesday, climbing as much as 15 percent for the biggest gain in almost three years, after its fourth-quarter results topped the highest expectations. The report echoed a theme of strong demand just days after heavyweights like Advanced Micro Devices Inc. and Xilinx Inc. crushed expectations.

The strength in chip stocks has been magnified as tech investors slammed the sell button for tech darlings in the FANG bloc. The megacap group has stumbled through a rocky earnings season that pushed the FANG Index down 9.3 percent over a three-day slump following Facebook Inc.’s record meltdown. The Philadelphia Semiconductor Index jumped 1.9 percent Thursday, defying the Facebook-led rout, and added another 1.3 percent on Tuesday.
Value stocks outperformed growth for the first month since March

Global bond prices fell on the month thanks to BoJ rumors (but barely bounced back on BoJ non-news)…

Yields were higher across the entire curve in July (spooked by BoJ but not retracing as much overnight on disappointment)…

The Yield curve flattened for the 5th month in a row (and 14th of last 16) to its lowest monthly close since Aug 07…

All eyes were on The BoJ last night – who disappointed – sending the yield curve tumbling back to pre-rumor levels (and for now, bank stocks haven’t caught all the way down)…

The Dollar had its first monthly drop in 4 months..

The Loonie rallied on the day after headlines about being rejected from NAFTA talks spooked the currency overnight…

On the month, the Mexican Peso was the strongest against the dollar, Turkish Lira the weakest…

And the Offshore Yuan plunged for the 4th straight month – its longest losing streak on record…

Notably though, Yuan spiked today after headlines implied some potential progress on the US-China trade waR…
And the Dollar also spiked at the same time…

Emerging Markets FX managed its first monthly gain since January

Despite Dollar weakness, commodities lower across the board in July with Crude down most since July 2016…

Crypto extended their losses today leaving only Bitcoin and Bitcoin Cash green for the month…notice the major divergence between bitcoin and the rest of crypto after the 18th

The divergence has sent the price of Ethereum relative to Bitcoin back to unchanged on the year…

MARKET TRADING
Spending outpaces income for the 5th straight month
(courtesy zerohedge)
Dollar Drops As Fed’s Favorite Inflation Indicator
Disappoints
Americans spending outpaced their income for the 5th month in a row (after massive revisions), and thanks to those revisions, spending is up even greater than we were told previously…
After revisions, spending growth is its highest since Oct 2014…

Both spending and income growth MoM printed as expected +0.4% MoM, but May spending was revised from +0.2% MoM to +0.5% MoM…

Real personal spending missed expectations, rising just 0.3% MoM vs expectation sof a 0.4% rise (but May was revised notably higher).
Income growth was relatively stable (after revisions)…

As the Employment Cost Index rose by 2.8% YoY in Q2 – the highest since Q3 2008…

Leaving the savings rate hovering at a ‘healthy’ 6.8%…

Thanks to the magic of upward revisions…

But, most interesting is the miss on Core PCE growth, rising 1.9% YoY (below expectations of a 2.0% YoY gain), the same growth as in May…

While we highly doubt this will do anything to shift Powell from his path of “1 hike/quarter until the world implodes”, it has sparked some dollar weakness.

uSA home appreciation records its slowest pace since January as the big affordability issue looms
(courtesy zerohedge)
US Home Price Appreciation Slowest Since January As “Affordability” Issues Loom
Following April’s modest slowdown in home price appreciation (albeit still at record highs), Case-Shiller’s 20-City Composite continued to decelerate (modestly) in May, rising 6.51% YoY (weakest since Jan 2018).

A deluge of dismal housing data recently is modestly confirmed by the always lagged Case-Shiller price index which hit a new record high…

But is seeing annual growth rates slowing (weakest since January 2018)…
Recent reports have shown the weakest pace of housing starts in nine months, fewer construction permits and the slowest rate of new-home sales since October.
After seasonal adjustment, Seattle had the biggest month-over-month rise at 1.4 percent, followed by Phoenix with a 0.8 percent increase, however, home prices fell in New York and Detroit from the prior month.
“Affordability — a measure based on income, mortgage rates and home prices — has gotten consistently worse over the last 18 months,” David Blitzer, chairman of the S&P index committee, said in a statement.
“All these indicators suggest that the combination of rising home prices and rising mortgage rates are beginning to affect the housing market.”
Seattle, Las Vegas and San Francisco led gains, with all cities posting an advance on-year.

Market DATA
Your most important passage of the year!! As we have been pounding the table following David Stockman’s lead, we can now state that everything that we told you is coming to fruition. We warned you that the USA budget deficit will climb to just over 800 billion dollars. It is now pegged for 833 billion dollars. However you must also include student loans and auto loans which are not part of the deficit. So the true funding needs exceeds 1.33 trillion dollars. Also remember that the Fed’s balance sheet roll offs will also add to the treasuries huge borrowings. By mid 2019, the total amount of borrowing will be in excess of 1.8 trillion dollars and that will cause the 10 yr yield to skyrocket.
(courtesy zerohedge)
US Debt Sales To Surge: Treasury Raises 2018 Borrowing Need To $1.33 Trillion
America’s funding needs are starting to grow at a dangerous pace.
Even before the NYT reported of Trump’s startling suggestion of a further $100 billion tax cut in the form of an inflation-adjusted capital gains tax cost basis which mostly benefits the wealthy, earlier today the U.S. Treasury said it expects to borrow $56 billion more during the third quarter than previously estimated, while market participants expect shorter-dated Treasuries to absorb the brunt of the new supply as the Trump administration grapples with a mushrooming budget deficit.
In the Treasury’s latest quarterly Sources and Uses table, it revealed that it expects to issue $329 billion in net marketable debt from July through September, and $56 billion more than the $273 billion estimated three months ago, in April. assuming an end-of-September cash balance of $350 billion, matching its previous estimate. It also forecast $440 billion of borrowing in the final three months of the year, with a $390 billion cash balance on December 31.

The borrowing estimate for the third quarter is the highest since the same period in 2010 and the fourth largest on record for the July-September quarter, according to Reuters. In the second quarter, net borrowing totaled $72 billion, slightly below the earlier prediction of $75 billion.
The US fiscal picture continues to darken as a result of rising social security costs, military spending and debt service expenses while corporate tax income is declining after last year’s tax reforms. As a result, the federal budget deficit is expected to reach $833 billion this year, up from $666 billion in the budget year ended last September, a number that is well below the net funding demands for the US Treasury.
The new projections put total net borrowing at $769 billion for the second half of 2018 and a whopping $1.33 trillion for the whole year. The federal budget deficit totaled $607 billion through the first nine months of the fiscal year that ends Sept. 30, up 16% compared with $523 billion from the same period a year earlier. In late June, the CBO forecast that total government spending would exceed revenue by $1 trillion in 2020. That would suggest that the net financing need of the US in two years could be as high as $1.5 trillion.
Yields on 10-year Treasurys rose to session highs of almost 2.98% following the release of the borrowing outlook according to Bloomberg data, although the bulk of today’s move was in anticipation of a surprise announcement by the BOJ. Meanwhile, the 2-year yield was steady around 2.67%, near the lows for the day.
“Because of surprising declines in corporate tax revenues, the federal deficit is constantly under discussion this month,” FTN rates strategist Jim Vogel told Reuters. Adding to the supply of bonds hitting the market, the Fed is also trimming its vast holdings of Treasury debt as part of Quantitative Tightening, with some $40BN in monthly reductions in the third quarter.
* * *
On Wednesday, as part of its quarterly refunding announcement, the Treasury will detail how it expects to spread the new supply across bond maturities ranging from one month to 30 years. As we discussed over the weekend, bond analysts expect faster increases in maturities out to five years, which could push their yields up at a quicker pace than those for longer-dated securities, resulting in further flattening of the yield curve.
According to Reuters, the Treasury is expected to increase sales of 2 and 3 Year notes by $1 billion a month, similar to its increases in the second quarter. Securities maturing in 7 to 30 years should increase at a rate of $1 billion per quarter, resulting in ever increasing supply to fund Trump’s fiscal program. Some estimate that five-year note sales could also ramp up by $1 billion more per month compared with the same amount for the whole of the second quarter.
While one outcome of emphasizing short-dated supply will be further bond flattening, short- and intermediate-dated debt is seen as having strong demand and relatively attractive rates. Avoiding a similar sharp boost in supply of long-term rates avoids a large increases in yields that could create an economic drag.
The market, however, is bearish on all Treasuries across the curve and as we showed over the weekend, the latest CFTC data showed that speculators last week have put on record aggregate Treasury short positions in five-year, 10-year and 30-year Treasuries futures, while also expanded to their short two-year note position.

Finally, investors will be looking for clues when the Treasury plans to introduce new two-month bills and five-year Treasury inflation-protected securities, as both have been discussed recently by the Treasury Borrowing Advisory Committee, even if many don’t see these as being introduced this quarter.
Source: US Treasury
USA ECONOMIC /GENERAL STORIES
The left is going to be very upset with this: Trump is considering a 100 billion USA tax cut for the very wealthy
(courtesy zerohedge)
SWAMP STORIES
WE WILL SEE YOU ON WEDNESDAY NIGHT.
HARVEY


You are a smart observer: the change in open interest in AUG 18 is indeed bigger than 50% of the total volume!
LikeLike
The preliminary gold volume for Tuesday is many hours late. COMEX seems to have trouble to fix the mess they created yesterday.
LikeLike