
GOLD: $1214.90 UP $3.10 (COMEX TO COMEX CLOSINGS)
Silver: $15.45 UP 7 CENTS (COMEX TO COMEX CLOSINGS)
Closing access prices:
Gold $1213.50
silver: $15.43
For comex gold:
AUGUST/
NUMBER OF NOTICES FILED TODAY FOR AUGUST CONTRACT: 2 NOTICE(S) FOR 200 oz
TOTAL NOTICES SO FAR 108 FOR 10800 OZ (0.3359 tonnes)
For silver:
AUGUST
62 NOTICE(S) FILED TODAY FOR
310,000 OZ/
Total number of notices filed so far this month: 618 for 3,0900,000 oz
XXXXXXXXXXXXXXXXXXXXXXXXXXXXXX
XXXXXXXXXXXXXXXXXXXXXXXXXXXXXX
Bitcoin: BID $7526/OFFER $7611: DOWN $19(morning)
Bitcoin: BID/ $7332/offer $7417: DOWN $179 (CLOSING/5 PM)
end
First Shanghai gold fix comes at 10 pm est
The second Shanghai gold fix: 2:15 pm
First Shanghai gold fix gold: 10 pm est: $1211.29
NY price at the same time:1206,85
PREMIUM TO NY SPOT: $4.44
XX
Second gold fix early this morning: $1210.95
USA gold at the exact same time:$1206.50
PREMIUM TO NY SPOT: $4.45
China is controlling the gold market
WE WILL NOT PROVIDE LONDON FIXES AS THEY ARE NOT ACCURATE AS TO WHAT IS GOING ON AT THE SAME TIME FRAME.
Let us have a look at the data for today
xxxxxxxxxxxxxxxxxxxxxxxxxxxxxxxxxxxxxxxxxxxxxxxxxxxxxxxxxxxxxxxxxxxxxxxxxx
In silver, the total OPEN INTEREST ROSE BY A CONSIDERABLE SIZED 2570 CONTRACTS FROM 224,431 UP TO 227,001 DESPITE YESTERDAY’S 6 CENT LOSS IN SILVER PRICING AT THE COMEX. WE HAVE NOW WITNESSED A SLOW COMEX ACCUMULATION THESE PAST SEVERAL DAYS. ON TOP OF THIS WE HAVE ALSO WITNESSED A LARGE AMOUNT OF PHYSICAL METAL STAND FOR COMEX DELIVERY(WELL OVER 30 MILLION OZ AT THE COMEX FOR JULY AND OVER 4 MILLION OZ FOR AUGUST) AS WELL AS CONSIDERABLE LONGS PACKING THEIR BAGS AND MIGRATING OVER TO LONDON IN GREATER NUMBERS IN THE FORM OF EFP’S. WE WERE NOTIFIED THAT WE HAD A SMALL SIZED NUMBER OF COMEX LONGS TRANSFERRING THEIR CONTRACTS TO LONDON THROUGH THE EFP: 120 EFP’S FOR AUGUST, 502 EFP’S FOR SEPT. , 800 EFP’S FOR DECEMBER AND ZERO FOR ALL OTHER MONTHS AND THEREFORE TOTAL ISSUANCE: OF 1422 CONTRACTS. WITH THE TRANSFER OF 1422 CONTRACTS, WHAT THE CME IS STATING IS THAT THERE IS NO SILVER (OR GOLD) TO BE DELIVERED UPON AT THE COMEX AS THEY MUST EXPORT THEIR OBLIGATION TO LONDON. ALSO KEEP IN MIND THAT THERE CAN BE A DELAY OF 24-48 HRS IN THE ISSUING OF EFP’S. THE 1422 EFP CONTRACTS TRANSLATES INTO 20.955 MILLION OZ AND ACCOMPANYING:
1.THE 6 CENT LOSS IN SILVER PRICE AT THE COMEX AND
2. THE STRONG AMOUNT OF SILVER OUNCES WHICH STOOD FOR THE JUNE/2018 COMEX DELIVERY MONTH. (5.420 MILLION OZ) 30.370 MILLION OZ FINALLY STANDING FOR DELIVERY IN JULY, AND NOW 4.395 MILLION OZ FOR AUGUST.
ACCUMULATION FOR EFP’S/SILVER/J.P.MORGAN’S HOUSE OF BRIBES, / STARTING FROM FIRST DAY NOTICE/FOR MONTH OF JULY:
2857 CONTRACTS (FOR 3 TRADING DAYS TOTAL 2857 CONTRACTS) OR 14.285 MILLION OZ: (AVERAGE PER DAY: 952 CONTRACTS OR 4.761 MILLION OZ/DAY)
TO GIVE YOU AN IDEA AS TO THE HUGE SUPPLY THIS MONTH IN SILVER: SO FAR THIS MONTH OF JULY: 14.285 MILLION PAPER OZ HAVE MORPHED OVER TO LONDON. THIS REPRESENTS AROUND 2.04% OF ANNUAL GLOBAL PRODUCTION (EX CHINA EX RUSSIA)* JUNE’S 345.43 MILLION OZ IS THE SECOND HIGHEST RECORDED ISSUANCE OF EFP’S AND IT FOLLOWED THE RECORD SET IN APRIL 2018 OF 385.75 MILLION OZ.
ACCUMULATION IN YEAR 2018 TO DATE SILVER EFP’S: 1,846.85 MILLION OZ.
ACCUMULATION FOR JAN 2018: 236.879 MILLION OZ
ACCUMULATION FOR FEB 2018: 244.95 MILLION OZ
ACCUMULATION FOR MARCH 2018: 236.67 MILLION OZ
ACCUMULATION FOR APRIL 2018: 385.75 MILLION OZ
ACCUMULATION FOR MAY 2018: 210.05 MILLION OZ
ACCUMULATION FOR JUNE 2018: 345.43 MILLION OZ
ACCUMULATION FOR JULY 2018: 172.84 MILLION OZ
RESULT: WE HAD A CONSIDERABLE SIZED INCREASE IN COMEX OI SILVER COMEX CONTRACTS OF 2570 DESPITE THE 6 CENT LOSS IN SILVER PRICING AT THE COMEX YESTERDAY. THE CME NOTIFIED US THAT WE HAD A STRONG SIZED EFP ISSUANCE OF 1422 CONTRACTS WHICH EXITED OUT OF THE SILVER COMEX AND TRANSFERRED THEIR OI TO LONDON AS FORWARDS. SPECULATORS CONTINUED THEIR INTEREST IN ATTACKING THE SILVER COMEX FOR PHYSICAL SILVER (SEE COMEX DATA) .
TODAY WE GAINED A STRONG SIZED: 3992 TOTAL OI CONTRACTS ON THE TWO EXCHANGES:
i.e 1422 OPEN INTEREST CONTRACTS HEADED FOR LONDON (EFP’s) TOGETHER WITH A INCREASE OF 2570 OI COMEX CONTRACTS. AND ALL OF THIS DEMAND HAPPENED WITH A 6 CENT LOSS IN PRICE OF SILVER AND A CLOSING PRICE OF $15.38 WITH RESPECT TO YESTERDAY’S TRADING. YET WE HAD A GIGANTIC AMOUNT OF SILVER STANDING AT THE COMEX FOR DELIVERY IN THE BIG JULY DELIVERY MONTH OF SLIGHTLY OVER 30 MILLION OZ AND NOW IN AUGUST ANOTHER BIG 4.395 MILLION OZ IN A NON ACTIVE MONTH. IT SURE LOOKS LIKE ANOTHER FAILED BANKER SHORT COVERING EXERCISE AS BANKERS ARE SCRAMBLING TO COVER THEIR HUGE SHORTFALL IN SILVER.
In ounces AT THE COMEX, the OI is still represented by OVER 1 BILLION oz i.e. 1.136 MILLION OZ TO BE EXACT or 162% of annual global silver production (ex Russia & ex China).
FOR THE NEW FRONT JULY MONTH/ THEY FILED AT THE COMEX: 62 NOTICE(S) FOR 310,000 OZ OF SILVER
IN SILVER, WE SET THE NEW RECORD OF OPEN INTEREST AT 243,411 CONTRACTS ON APRIL 9.2018. AND AGAIN THIS HAS BEEN SET WITH A LOW PRICE OF $16.51
ON THE DEMAND SIDE WE HAVE THE FOLLOWING:
- HUGE AMOUNTS OF SILVER STANDING FOR DELIVERY (MARCH/2018: 27 MILLION OZ , APRIL/2018 : 2.485 MILLION OZ MAY: 36.285 MILLION OZ ; JUNE/2018 (5.420 MILLION OZ) AND JULY 2018 AMOUNT FINALLY STANDING: 30.370 MILLION OZ ) AND NOW FOR AUGUST 4.395 MILLION OZ.
- HUGE RECORD OPEN INTEREST IN SILVER 243,411 CONTRACTS (OR 1.217 BILLION OZ/ SET APRIL 9/2018
- HUGE ANNUAL EFP’S ISSUANCE EQUAL TO 2.9 BILLION OZ OR 400% OF SILVER ANNUAL PRODUCTION/2017
- RECORD SETTING EFP ISSUANCE FOR ANY MONTH IN SILVER; APRIL/2018/ 385.75 MILLION OZ/ AND THE SECOND HIGHEST RECORDED EFP ISSUANCE JUNE 2018 345.43 MILLION OZ
AND YET, WITH THE EXTREMELY HIGH EFP ISSUANCE, WE HAVE A CONTINUAL LOW PRICE OF SILVER DESPITE THE ABOVE HUGE DEMAND. TO ME THE ONLY ANSWER IS THAT WE HAVE SOVEREIGN (CHINA) WHO IS ENDEAVOURING TO GOBBLE UP ALL AVAILABLE PHYSICAL SILVER NO MATTER WHERE, EXACTLY WHAT J.P.MORGAN IS DOING. AND IT IS MY BELIEF THAT J.P.MORGAN IS HOLDING ITS SILVER FOR ITS BENEFICIAL OWNER..THE USA GOVERNMENT WHO IN TURN IS HOLDING THAT SILVER FOR CHINA.(FOR A SILVER LOAN REPAYMENT).
IN GOLD, THE OPEN INTEREST ROSE BY A STRONG SIZED 5487 CONTRACTS UP TO 458,919 DESPITE THE FALL IN THE COMEX GOLD PRICE/YESTERDAY’S TRADING (A LOSS IN PRICE OF $7.20). THE CME RELEASED THE DATA FOR EFP ISSUANCE AND IT TOTALED A GOOD SIZED 6348 CONTRACTS:
AUGUST HAD AN ISSUANCE OF 0 CONTRACTS, OCTOBER HAD 168 EFP’S ISSUED AND, DECEMBER HAD AN ISSUANCE OF 6180 CONTACTS AND ALL OTHER MONTHS ZERO. The NEW COMEX OI for the gold complex rests at 458,919. ALSO REMEMBER THAT THERE WILL BE A DELAY IN THE ISSUANCE OF EFP’S. THE BANKERS REMOVE LONG POSITIONS OF COMEX GOLD IMMEDIATELY. THEN THEY ORCHESTRATE THEIR PRIVATE EFP DEAL WITH THE LONGS AND THAT COULD TAKE AN ADDITIONAL 48 HRS SO WE GENERALLY DO NOT GET A MATCH WITH RESPECT TO DEPARTING COMEX LONGS AND NEW EFP LONG TRANSFERS. . EVEN THOUGH THE BANKERS ISSUED THESE MONSTROUS EFPS, THE OBLIGATION STILL RESTS WITH THE BANKERS TO SUPPLY METAL BUT IT TRANSFERS THE RISK TO A LONDON BANKER OBLIGATION AND NOT A NEW YORK COMEX OBLIGATION. LONGS RECEIVE A FIAT BONUS TOGETHER WITH A LONG LONDON FORWARD. THUS, BY THESE ACTIONS, THE BANKERS AT THE COMEX HAVE JUST STATED THAT THEY HAVE NO APPRECIABLE METAL!! THIS IS A MASSIVE FRAUD: THEY CANNOT SUPPLY ANY METAL TO OUR COMEX LONGS BUT THEY ARE QUITE WILLING TO SUPPLY MASSIVE NON BACKED GOLD (AND SILVER) PAPER KNOWING THAT THEY HAVE NO METAL TO SATISFY OUR LONGS. LONDON IS NOW SEVERELY BACKWARD IN BOTH GOLD AND SILVER AND WE ARE WITNESSING DELAYS IN ACTUAL DELIVERIES.
IN ESSENCE WE HAVE AN EXTREMELY STRONG OI GAIN IN TOTAL CONTRACTS ON THE TWO EXCHANGES OF 11,835 CONTRACTS: 5487 OI CONTRACTS INCREASED AT THE COMEX AND 6348 EFP OI CONTRACTS WHICH NAVIGATED OVER TO LONDON. THUS TOTAL OI GAIN: 11,835 CONTRACTS OR 1,183,500 OZ = 36.81 TONNES. AND ALL OF THIS STRONG DEMAND OCCURRED DESPITE THE RAID AND THE FALL IN THE PRICE OF GOLD/ YESTERDAY TO THE TUNE OF $7.20.
YESTERDAY, WE HAD 7943 EFP’S ISSUED.
ACCUMULATION OF EFP’S GOLD AT J.P. MORGAN’S HOUSE OF BRIBES: (EXCHANGE FOR PHYSICAL) FOR THE MONTH OF JUNE : 22,777 CONTRACTS OR 2,277,700 OZ OR 70.84 TONNES (3 TRADING DAYS AND THUS AVERAGING: 7952 EFP CONTRACTS PER TRADING DAY OR 795,200 OZ/ TRADING DAY),,
TO GIVE YOU AN IDEA AS TO THE HUGE SIZE OF THESE EFP TRANSFERS : THIS MONTH IN 2 TRADING DAYS IN TONNES: 70,84 TONNES
TOTAL ANNUAL GOLD PRODUCTION, 2017, THROUGHOUT THE WORLD EX CHINA EX RUSSIA: 2555 TONNES
THUS EFP TRANSFERS REPRESENTS 70.84/2550 x 100% TONNES = 2.77% OF GLOBAL ANNUAL PRODUCTION SO FAR IN JULY ALONE.***
ACCUMULATION OF GOLD EFP’S YEAR 2018 TO DATE: 4,780.89* TONNES *SURPASSED ANNUAL PROD’N
ACCUMULATION OF GOLD EFP’S FOR JANUARY 2018: 653.22 TONNES (21 TRADING DAYS)
ACCUMULATION OF GOLD EFP’S FOR FEBRUARY 2018: 649.45 TONNES (20 TRADING DAYS)
ACCUMULATION OF GOLD EFP’S FOR MARCH 2018: 741.89 TONNES (22 TRADING DAYS)
ACCUMULATION OF GOLD EFP’S FOR APRIL 2018: 713.84 TONNES (21 TRADING DAYS)
ACCUMULATION OF GOLD EFP’S FOR MAY 2018: 693.80 TONNES ( 22 TRADING DAYS)
ACCUMULATION OF GOLD EFP FOR JUNE 2018 650.71 TONNES (21 TRADING DAYS)
ACCUMULATION OF GOLD EFP FOR JULY 2018 605.5 TONNES (21 TRADING DAYS)
WHAT IS ALARMING TO ME, ACCORDING TO OUR LONDON EXPERT ANDREW MAGUIRE IS THAT THESE EFP’S ARE BEING TRANSFERRED TO WHAT ARE CALLED SERIAL FORWARD CONTRACT OBLIGATIONS AND THESE CONTRACTS ARE LESS THAN 14 DAYS. ANYTHING GREATER THAN 14 DAYS, THESE MUST BE RECORDED AND SENT TO THE COMPTROLLER, GREAT BRITAIN TO MONITOR RISK TO THE BANKING SYSTEM. IF THIS IS INDEED TRUE, THEN THIS IS A MASSIVE CONSPIRACY TO DEFRAUD AS WE NOW WITNESS A MONSTROUS TOTAL EFP’S ISSUANCE AS IT HEADS INTO THE STRATOSPHERE.
Result: A STRONG SIZED INCREASE IN OI AT THE COMEX OF 7023 DESPITE THE LOSS IN PRICING ($7.20 THAT GOLD UNDERTOOK ON YESTERDAY) // . WE ALSO HAD A GOOD SIZED NUMBER OF COMEX LONG TRANSFERRING TO LONDON THROUGH THE EFP ROUTE: 6348 CONTRACTS AS THESE HAVE ALREADY BEEN NEGOTIATED AND CONFIRMED. THERE OBVIOUSLY DOES NOT SEEM TO BE MUCH PHYSICAL GOLD AT THE COMEX. I GUESS IT EXPLAINS THE HUGE ISSUANCE OF EFP’S…THERE IS HARDLY ANY GOLD PRESENT AT THE GOLD COMEX FOR DELIVERY PURPOSES. IF YOU TAKE INTO ACCOUNT THE 6348 EFP CONTRACTS ISSUED, WE HAD A VERY STRONG NET GAIN OF 11,835 CONTRACTS IN TOTAL OPEN INTEREST ON THE TWO EXCHANGES:
6348 CONTRACTS MOVE TO LONDON AND 5487 CONTRACTS INCREASED AT THE COMEX. (in tonnes, the GAIN in total oi equates to 36.81 TONNES). ..AND THIS STRONG DEMAND OCCURRED DESPITE THE LOSS OF $7.20 IN YESTERDAY’S TRADING AT THE COMEX!!!.
we had: 2 notice(s) filed upon for 200 oz of gold at the comex.
xxxxxxxxxxxxxxxxxxxxxxxxxxxxxxxxxxxxxxxxxxxxxxxxxxxxxxxxxxx
With respect to our two criminal funds, the GLD and the SLV:
GLD...
WITH GOLD UP $3.10 TODAY: /
NO CHANGES IN GOLD INVENTORY AT THE GLD/
.
/GLD INVENTORY 796.96 TONNES
Inventory rests tonight: 796.96 tonnes.
TO ALL INVESTORS THINKING OF BUYING GOLD THROUGH THE GLD ROUTE: YOU ARE MAKING A TERRIBLE MISTAKE AS THE CROOKS ARE USING WHATEVER GOLD COMES IN TO ATTACK BY SELLING THAT GOLD. IT SURE SEEMS TO ME THAT THE GOLD OBLIGATIONS AT THE GLD EXCEED THEIR INVENTORY
SLV/
WITH SILVER UP 7 CENTS TODAY :
NO CHANGE IN SILVER INVENTORY TONIGHT:
/INVENTORY RESTS AT 329.292 MILLION OZ/
NOTE THE DIFFERENCE BETWEEN THE GLD AND SLV: THE CROOKS CAN RAID GOLD BECAUSE THEY DO HAVE SOME PHYSICAL. THEY DO NOT RAID SILVER PROBABLY BECAUSE THERE IS NO REAL SILVER INVENTORIES BEHIND THEM
end
First, here is an outline of what will be discussed tonight:
1. Today, we had the open interest in SILVER ROSE BY A CONSIDERABLE SIZED 2570 CONTRACTS from 224,431 UP TO 227,001 (AND MUCH CLOSER TO THE NEW COMEX RECORD SET /APRIL 9/2017 AT 243,411/SILVER PRICE AT THAT DAY: $16.53). THE PREVIOUS RECORD OTHER THAN WAS ESTABLISHED AT: 234,787, SET ON APRIL 21.2017 OVER ONE YEAR AGO. THE PRICE OF SILVER ON THAT DAY: $17.89. OUR CUSTOMARY MIGRATION OF COMEX LONGS MORPH INTO LONDON FORWARDS CONTINUES AS OUR BANKERS USED THEIR EMERGENCY PROCEDURE TO ISSUE:
120 EFP’S ISSUED FOR AUGUST, 502 EFP CONTRACTS FOR SEPT., 800 EFP CONTRACTS FOR DECEMBER AND ALL OTHER MONTHS: ZERO. TOTAL EFP ISSUANCE: 1422 CONTRACTS . EFP’S GIVE OUR COMEX LONGS A FIAT BONUS PLUS A DELIVERABLE PRODUCT OVER IN LONDON. IF WE TAKE THE OI GAIN AT THE COMEX OF 2570 CONTRACTS TO THE 1422 OI TRANSFERRED TO LONDON THROUGH EFP’S, WE OBTAIN A NET GAIN OF 3992 OPEN INTEREST CONTRACTS. THUS IN OUNCES, THE GAIN ON THE TWO EXCHANGES: 19.96 MILLION OZ!!! AND YET WE ALSO HAVE A STRONG DEMAND FOR PHYSICAL AS WE WITNESSED A FINAL STANDING OF GREATER THAN 30 MILLION OZ FOR JULY AND NOW ANOTHER STRONG 4.395 MILLION OZ FOR AUGUST... AND YET ALL OF THIS HUGE DEMAND OCCURRED DESPITE A 6 CENT PRICING LOSS AT THE SILVER COMEX.
RESULT: A CONSIDERABLE SIZED INCREASE IN SILVER OI AT THE COMEX DESPITE THE 6 CENT PRICING LOSS THAT SILVER UNDERTOOK IN PRICING YESTERDAY. BUT WE ALSO HAD A STRONG SIZED 1422 EFP’S ISSUED TRANSFERRING COMEX LONGS OVER TO LONDON. TOGETHER WITH THE STRONG SIZED AMOUNT OF SILVER OUNCES STANDING FOR AUGUST, DEMAND FOR PHYSICAL SILVER CONTINUES TO INTENSIFY AS WE WITNESS SEVERE BACKWARDATION IN SILVER IN LONDON.
(report Harvey)
.
2.a) The Shanghai and London gold fix report
(Harvey)
2 b) Gold/silver trading overnight Europe, Goldcore
(Mark O’Byrne/zerohedge
and in NY: Bloomberg
3. ASIAN AFFAIRS
i)FRIDAY MORNING/THURSDAY NIGHT: Shanghai closed DOWN 27.58 POINTS OR 1.00% /Hang Sang CLOSED DOWN 38.24 POINTS OR 0.14%/ / The Nikkei closed UP 12,65 POINTS OR 0.06%/Australia’s all ordinaires CLOSED DOWN 0.02% /Chinese yuan (ONSHORE) closed DOWN at 6.8554 AS POBC RESUMES ITS HUGE DEVALUATION /Oil DOWN to 69.06 dollars per barrel for WTI and 73.56 for Brent. Stocks in Europe OPENED DEEPLY IN THE GREEN//. ONSHORE YUAN CLOSED WELL DOWN AT 6.8554 AGAINST THE DOLLAR. OFFSHORE YUAN CLOSED DOWN ON THE DOLLAR AT 6.8611: HUGE DEVALUATION/PAST SEVERAL DAYS RESUMES : /ONSHORE YUAN TRADING STRONGER AGAINST OFFSHORE YUAN/ONSHORE YUAN TRADING WEAKER AGAINST USA DOLLAR/OFFSHORE YUAN TRADING WEAKER AGAINST THE DOLLAR /CHINA RETALIATES WITH TARIFFS/ TRUMP RESPONDS TO NEW TARIFFS AND IT NOW A FULL TRADE WAR COMMENCED
/NORTH KOREA/SOUTH KOREA
i)North Korea/South Korea/USA/Russia
b) REPORT ON JAPAN
3 c CHINA
i)China/USA
The markets were not happy with this; Wilbur Ross states that Trump will put on more pressure on China such that they “modify their behaviour”
( zerohedge)
ii)A big story: the Chinese threw an olive branch for the USA as they basically nuked the yuan shorts by sending the yuan higher and dollar lower as they raised fx forward reserve requirements to 20%
( zerohedge)
iib)Zero hedge again talks about this morning’s currency invention causing yuan shorts to cry uncle.
( zerohedge)
iii)China releases its retaliation list to the big USA tariffs and they will levy a tax on 60 billion on USA goods entering China. Trump will react negatively to the news even though the Chinese threw an olive branch at the USA with the above nuking of yuan shorts.
( zerohedge)
4. EUROPEAN AFFAIRS
i)EU/USA/Kidney Beans
Just take a look at the mess tariffs are creating in the kidney bean market. The 25% tariffs is making USA kidney beans unaffordable in Europe. Juncker is a liar: there has been no agreement whatsoever in a deal with the EU to reduce their tariffs on USA goods
( Mish Shedlock/Mishtalk)
5. RUSSIAN AND MIDDLE EASTERN AFFAIRS
6 .GLOBAL ISSUES
7. OIL ISSUES
8. EMERGING MARKET
9. PHYSICAL MARKETS
i)What goes on in socialist and totally bankrupt Venezuela
( Washington post/GATA)
ii)Because of the weak Australian dollar, Aussie gold producers are outperforming North American miners. Now investors want these Australian producers to buy out some of their USA rivals
( Bloomberg/GATA)
iii)A sensational article written by David Brady as he outlines why the price of gold mirrors the value of the yuan
a must read…
( David Brady/Sprott Money
10. USA stories which will influence the price of gold/silver)
i)Market trading /GOLD/MARKET MOVERS:
b)special thanks to Gijsbert Groenewegen for sending this to us
G’s comment to me is accurate:
“You have to look at the avg hourly pay chart because this will accelerate further and combine that with the huge debt levels! There is no room to increase interest rates when inflation takes off. Debt implosion will follow!!!”
c)Two reasons for the job losses:
1. the bankruptcy of Toys R Us
2. teachers for the summer recess.
(courtesy zerohedge)
(courtesy zerohedge)
e)In the report, we note the following:
g)wow!! this is a change: for the first time in 4 months the USA trade deficit widened as exports fell and imports grew. Not a good sign in a strong growth economy
A good look at how student debt is hitting pretty hard in the following 10 USA states
( zerohedge)
iv)SWAMP STORIES
Trading Volumes on the COMEX
PRELIMINARY COMEX VOLUME FOR TODAY: 270,600 contracts
CONFIRMED COMEX VOL. FOR YESTERDAY: 247,717 contracts
xxxxxxxxxxxxxxxxxxxxxxxxxxxxxxxxxxxxxxxxxxxxxxxxxxxxxxxxxxxxxxxxxxxx
And now for the wild silver comex results.
Total silver OI ROSE BY A CONSIDERABLE SIZED 2570 CONTRACTS FROM 224,431 DOWN TO 227,001 (AND A LITTLE CLOSER TO THE THE NEW RECORD OI FOR SILVER SET APRIL 9.2018/ 243,411 CONTRACTS)WITH THE 6 CENT GAIN IN PRICING THAT SILVER UNDERTOOK YESTERDAY. SINCE WE ARE NOW INTO THE NON – ACTIVE DELIVERY MONTH OF AUGUST, WE WERE INFORMED THAT WE HAD A STRONG SIZED 1422 EFP CONTRACTS: FOR AUGUST: 120 EFP’S ISSUED; FOR SEPT: 502 EFP CONTRACTS AND FOR DECEMBER: 800 CONTRACTS AND ZERO FOR ALL OTHER MONTHS. THESE EFPS WERE ISSUED TO COMEX LONGS WHO RECEIVED A FIAT BONUS PLUS A DELIVERABLE PRODUCT OVER IN LONDON. THE TOTAL EFP’S ISSUED: 1422. ON A NET BASIS WE GAINED 3992 SILVER OPEN INTEREST CONTRACTS AS WE OBTAINED 2570 CONTRACT GAIN AT THE COMEX COMBINING WITH THE ADDITION OF 1422 OI CONTRACTS NAVIGATING OVER TO LONDON.
NET GAIN ON THE TWO EXCHANGES: 3992 CONTRACTS
FOR THE FRONT MONTH OF AUGUST WE HAD A NET GAIN OF 40 CONTRACTS. WE HAD 20 NOTICES FILED YESTERDAY SO WE CONTINUE WHERE WE LEFT OFF LAST MONTH IN THAT WE GAINED 60 CONTRACTS STANDING OR AN ADDITIONAL 300,000 OZ WILL STAND AT THE COMEX AS THESE GUYS REFUSED TO MORPH INTO LONDON BASED FORWARDS AND RECEIVE A FIAT BONUS. QUEUE JUMPING AT THE SILVER COMEX IS THE NORM AS THERE IS CONSIDERABLE AMOUNT OF PHYSICAL LOCATED HERE. THERE IS NO QUEUE JUMPING AT THE GOLD COMEX FOR THE SIMPLE REASON THAT THERE IS NO GOLD THERE.
The next active delivery month after August for silver is September and here the OI ROSE by 625 contracts UP to 156,051. October received another 24 contracts to stand at 51
After October, the next big delivery month is December and here the OI rose by 1342 contracts up to 58,749 contracts.
We had 62 notice(s) filed for 310,000 OZ for the AUGUST 2018 COMEX contract for silver
AND NOW COMPARISON VS AUGUST LAST YR:
ON FIRST DAY NOTICE JULY 31/2017: 1,965,000 OZ STOOD FOR DELIVERY
THE FINAL AMOUNT OF SILVER STANDING: AUGUST 30.2017: 6,245,000 OZ AS WE HAD CONSIDERABLE QUEUE JUMPING.
INITIAL standings for AUGUST/GOLD
AUGUST 3/2018.
| Gold | Ounces |
| Withdrawals from Dealers Inventory in oz | nil oz |
| Withdrawals from Customer Inventory in oz |
NIL OZ
|
| Deposits to the Dealer Inventory in oz | NIL oz |
| Deposits to the Customer Inventory, in oz |
nil oz
|
| No of oz served (contracts) today |
2 notice(s)
200 OZ
|
| No of oz to be served (notices) |
3323 contracts
(332,300 oz)
|
| Total monthly oz gold served (contracts) so far this month |
108 notices
10800 OZ
.3359 TONNES
|
| Total accumulative withdrawals of gold from the Dealers inventory this month | NIL oz |
| Total accumulative withdrawal of gold from the Customer inventory this month | xxx oz |
we have a TINY pulse today, BUT zero gold enters the comex
For AUGUST:
Today, 0 notice(s) were issued from JPMorgan dealer account and 0 notices were issued from their client or customer account. The total of all issuance by all participants equates to 2 contract(s) of which 0 notices were stopped (received) by j.P. Morgan dealer and 2 notice(s) was (were) stopped/ Received) by j.P.Morgan customer account.
xxxxxxxxxxxxxxxxxxxxxxxxxxxxxxxxxxxxxxxxxxxxxxxxxxxxxxxxxxxxxxxxxxxxxxxxxx
To calculate the INITIAL total number of gold ounces standing for the AUGUST. contract month, we take the total number of notices filed so far for the month (108) x 100 oz or 10600 oz, to which we add the difference between the open interest for the front month of AUGUST. (3325 contracts) minus the number of notices served upon today (2 x 100 oz per contract) equals 343,100 OZ OR 10.672 TONNES) the number of ounces standing in this non active month of AUGUST
Thus the INITIAL standings for gold for the AUGUST contract month:
No of notices served (108 x 100 oz) + {(3325)OI for the front month minus the number of notices served upon today (2 x 100 oz )which equals 343,100 oz standing OR 10.672 TONNES in this active delivery month of AUGUST.
WE LOST 433 COMEX CONTRACTS OR AN ADDITIONAL 43300 OZ WILL NOT STAND AND THESE GUYS MORPHED INTO LONDON BASED FORWARDS. THERE WAS NO REASON TO HANG AROUND THE COMEX AS THERE IS NO GOLD THERE TO SETTLE UPON.
THERE ARE ONLY 11.542 TONNES OF REGISTERED COMEX GOLD AVAILABLE FOR DELIVERY AGAINST 10.672 TONNES STANDING FOR JULY
IN THE LAST 24 MONTHS 85 NET TONNES HAS LEFT THE COMEX.
end
And now for silver
AND NOW THE AUGUST DELIVERY MONTH
AUGUST INITIAL standings/SILVER
| Silver | Ounces |
| Withdrawals from Dealers Inventory | nil oz |
| Withdrawals from Customer Inventory |
82,095.910 oz
DELAWARE
SCOTIA
|
| Deposits to the Dealer Inventory |
nil oz
|
| Deposits to the Customer Inventory |
2,574,865.940 oz
BRINKS
CNT
HSBC
JPM
SCOTIA
|
| No of oz served today (contracts) |
62
CONTRACT(S)
(310,000 OZ)
|
| No of oz to be served (notices) |
261 contracts
(1,305,000 oz)
|
| Total monthly oz silver served (contracts) | 618 contracts
(3,090,000 oz) |
| Total accumulative withdrawal of silver from the Dealers inventory this month | NIL oz |
| Total accumulative withdrawal of silver from the Customer inventory this month |
we had 0 inventory movement at the dealer side of things
total dealer deposits: nil oz
total dealer withdrawals: nil oz
we had 5 deposit into the customer account
i) Into JPMorgan: 590,884.400 oz
*** JPMorgan for most of 2017 and in 2018 has adding to its inventory almost every single day.
JPMorgan now has 144 million oz of total silver inventory or 50.3% of all official comex silver. (144 million/286 million)
iii) Into CNT; 29.802.200 oz
iv) Into HSBS: 501,313.610 oz
v) Into Scotia: 1,451,817.380 oz
total customer deposits today: 2,574,865.940 oz
we had 2 withdrawals from the customer account;
i) out of Delaware: 1895.900 OZ
ii) out of Scotia: 80,190.010 oz
total withdrawals: 82,095.910 oz
we had 1 adjustment/
i) Out of Brinks:
1,184,984.950 oz was adjusted out of the customer and this landed into the dealer account of Brinks
total dealer silver: 81.294 million
total dealer + customer silver: 286.101 million oz
The total number of notices filed today for the AUGUST. contract month is represented by 62 contract(s) FOR 310,000 oz. To calculate the number of silver ounces that will stand for delivery in AUGUST., we take the total number of notices filed for the month so far at 618 x 5,000 oz = 3,090,000 oz to which we add the difference between the open interest for the front month of AUGUST. (323) and the number of notices served upon today (62 x 5000 oz) equals the number of ounces standing.
.
Thus the INITIAL standings for silver for the AUGUST/2018 contract month: 618(notices served so far)x 5000 oz + OI for front month of AUGUST(323) -number of notices served upon today (62)x 5000 oz equals 4,395,000 oz of silver standing for the AUGUST contract month
WE GAINED 60 CONTRACTS OR AN ADDITIONAL 300,000 OZ WILL STAND FOR DELIVERY AT THE COMEX AND THESE GUYS REFUSED TO MORPH INTO A LONDON BASED FORWARDS AND THUS THEY WILL NOT TAKE THE FIAT BONUS.
xxxxxxxxxxxxxxxxxxxxxxxxxxxxxxxxxxxxxxxxxxxxxxxxxxxxxxxxxxx
ESTIMATED VOLUME FOR TODAY:78,218 CONTRACTS
CONFIRMED VOLUME FOR YESTERDAY: 73,806 CONTRACTS absolutely criminal
YESTERDAY’S CONFIRMED VOLUME OF 73,806 CONTRACTS EQUATES TO 369 million OZ OR 52.71% OF ANNUAL GLOBAL PRODUCTION OF SILVER
COMMODITY LAW SUGGESTS THAT OPEN INTEREST SHOULD NOT BE MORE THAN 3% OF ANNUAL GLOBAL PRODUCTION. THE CROOKS ARE SUPPLYING MASSIVE PAPER TRYING TO KEEP SILVER IN CHECK.
The record level of silver open interest is 234,787 contracts set on April 21./2017 with the price at that day at $18.42
The previous record was 224,540 contracts with the price at that time of $20.44
end
NPV for Sprott
1. Sprott silver fund (PSLV): NAV FALLS TO -3.00% (AUGUST 3/2018)
2. Sprott gold fund (PHYS): premium to NAV FALLS TO -1.16% to NAV (AUGUST 3/2018 )
Note: Sprott silver trust back into NEGATIVE territory at -3.00%-/Sprott physical gold trust is back into NEGATIVE/
(courtesy Sprott/GATA)
3.SPROTT CEF.A FUND (FORMERLY CENTRAL FUND OF CANADA):
NAV 12.58/TRADING 12.11//DISCOUNT 3.69.
END
And now the Gold inventory at the GLD/
AUGUST 3/WITH GOLD UP $3.10/NO CHANGES IN GOLD INVENTORY AT THE GLD/INVENTORY RESTS AT 796.96 TONNES
AUGUST 2/WITH GOLD DOWN $7.20/A HUGE WITHDRAWAL OF 3.24 TONNES FROM THE GLD WHICH NO DOUBT WAS USED IN THE RAID TODAY/INVENTORY RESTS AT 796.96 TONNES
AUGUST 1/WITH GOLD DOWN $4.65/NO CHANGE IN GOLD INVENTORY AT THE GLD.INVENTORY RESTS AT 800.20 TONNES
JULY 31/WITH GOLD UP $2.05/NO CHANGE IN GOLD INVENTORY AT THE GLD/INVENTORY RESTS AT 800.20
JULY 30/WITH GOLD DOWN $0.95/NO CHANGE IN GOLD INVENTORY AT THE GLD/INVENTORY RESTS AT 800.20 TONNES
july 27/WITH GOLD DOWN $2.85 TODAY, NO CHANGE IN GOLD INVENTORY AT THE GLD/INVENTORY RESTS AT 800.20 TONNES
JULY 26./WITH GOLD DOWN $5.65: A WITHDRAWAL OF 2.35 TONNES OF GOLD FROM THE GLD/INVENTORY RESTS AT 800.20 TONNES
JULY 25/WITH GOLD UP $6.45; NO CHANGE IN GOLD INVENTORY AT THE GLD/INVENTORY RESTS AT 802.55 TONNES
JULY 24/ WITH GOLD DOWN 10 CENTS: A HUGE DEPOSIT OF 4.42 TONNES INTO THE GLD/INVENTORY RESTS AT 802.55 TONNES
JULY 23/WITH GOLD DOWN $5.55: NO CHANGES IN GOLD INVENTORY AT THE GLD/INVENTORY RESTS AT 798.13 TONNES
JULY 20/WITH GOLD UP $4.15 A HUGE DEPOSIT OF 4.12 TONNES OF GOLD INTO THE GLD.INVENTORY RESTS AT 798.13 TONNES
JULY 19./WITH GOLD DOWN $1.00: NO CHANGES IN GOLD INVENTORY AT THE GLD/INVENTORY RESTS AT 794.01 TONNES
JULY 18/WITH GOLD UP 0.40: NO CHANGES IN GOLD INVENTORY AT THE GLD/INVENTORY RESTS AT 794.01 TONNES
JULY 17/WITH GOLD DOWN $12.40, WE HAD A BIG WITHDRAWAL OF 1.18 TONNES FROM THE GLD/INVENTORY RESTS AT 794.01 TONNES
JULY 16/WITH GOLD DOWN $1.55/NO CHANGE IN GOLD INVENTORY AT THE GLD/INVENTORY RESTS AT 795.19 TONNES
JULY 13/WITH GOLD DOWN $5.35 THE CROOKS RAID THE COOKIE JAR AGAIN TO THE TUNE OF 3.83 TONNES/INVENTORY RESTS AT 795.19 TONNES
JULY 12/WITH GOLD UP $2.30: NO CHANGE IN GOLD INVENTORY AT THE GLD/INVENTORY RESTS AT 799.02 TONNES
JULY 11/WITH GOLD DOWN $10.75 THE CROOKS RAIDED THE COOKIE JAR AGAIN TO THE TUNE OF 1.75 TONNES/INVENTORY RESTS AT 799.02 TONNES
JULY 10/WITH GOLD DOWN $3.85: NO CHANGES IN GOLD INVENTORY AT THE GLD/INVENTORY RESTS AT 800.77 TONNES
july 9/WITH GOLD UP $4.00/ANOTHER RAID ON THE GOLD COOKIE JAR: TWO WITHDRAWALS OF 1.18 TONNES THIS MORNING AND 1.47 TONNES THIS AFTERNOON/INVENTORY RESTS AT 800.77 TONNES
JULY 6/WITH GOLD DOWN $2.45: NO CHANGE IN GOLD INVENTORY AT THE GLD/INVENTORY RESTS AT 803.42 TONNES
JULY 5/WITH GOLD UP ANOTHER $5.15, THE CROOKS RAIDED THE COOKIE JAR AGAIN TO THE TUNE OF 5.89 TONNES/INVENTORY RESTS AT 803.42 TONNES IN THE LAST 10 TRADING DAYS GLD HAS LOST A HUGE 25.34 TONNES WITH A LOSS OF ONLY $15.25 IN PRICE
July 3/WITH GOLD UP $11.15/THE CROOKS RAIDED THE GLD INVENTORY AGAIN TO THE TUNE OF 9.73 TONNES/INVENTORY RESTS AT 809.31 TONNES
J
xxxxxxxxxxxxxxxxxxxxxxxxxxxxxxxxxx
AUGUST 3/2018/ Inventory rests tonight at 796.96 tonnes
*IN LAST 424 TRADING DAYS: 133.97 NET TONNES HAVE BEEN REMOVED FROM THE GLD
*LAST 374 TRADING DAYS: A NET 22.57 TONNES HAVE NOW BEEN ADDED INTO GLD INVENTORY.
end
Now the SLV Inventory/
AUGUST 3/WITH SILVER UP 7 CENTS TODAY/NO CHANGES IN SILVER INVENTORY AT THE SLV/INVENTORY RESTS AT 329.292 MILLION OZ/.
AUGUST 2 WITH SILVER DOWN 6 CENTS TODAY/A SMALL CHANGE IN SILVER INVENTORY AT THE SLV/ A WITHDRAWAL OF 141,000 OZ FOR THEIR MONTHLY STORAGE AND INSURANCE FEES:INVENTORY RESTS AT 329.292 MILLION OZ/
AUGUST 1/WITH SILVER DOWN 12 CENTS TODAY, NO CHANGE IN SILVER INVENTORY AT THE SLV/INVENTORY RESTS AT 329.433 MILLION OZ/
JULY 31/WITH SILVER UP 5 CENTS/NO CHANGE IN SILVER INVENTORY AT THE SLV/INVENTORY RESTS AT 329.433 MILLION OZ/
JULY 30/WITH SILVER UP 3 CENTS TODAY; NO CHANGE IN SILVER INVENTORY AT THE SLV/INVENTORY RESTS AT 329.433 MILLION OZ.
JULY 27/WITH SILVER FLAT TODAY, NO CHANGE IN SILVER INVENTORY AT THE SLV/INVENTORY RESTS AT 329.433 MILLION OZ/
JULY 26/WITH SILVER DOWN 10 CENTS: STRANGE: A BIG CHANGES IN SILVER INVENTORY AT THE SLV: A DEPOSIT OF 1.046 MILLION OZ OF SILVER/INVENTORY RESTS AT 329.433 MILLION OZ
JULY 25: WITH SILVER UP 8 CENTS TODAY: A SMALL CHANGE IN SILVER INVENTORY AT THE SLV/ A WITHDRAWAL OF 658,000 INVENTORY RESTS AT 328.304 MILLION OZ/
JULY 24/WITH SILVER UP 8 CENTS TODAY: NO CHANGE IN SILVER INVENTORY AT THE SLV/INVENTORY RESTS AT 328.962 MILLION OZ/
JULY 23/WITH SILVER DOWN 11 CENTS/NO CHANGES IN SILVER INVENTORY INTO THE SLV/INVENTORY RESTS AT 328.962 MILLION OZ/
JULY 20/WITH SILVER UP 10 CENTS TODAY: A HUGE CHANGE IN SILVER INVENTORY AT THE SLV: A DEPOSIT OF 1.411 MILLION OZ INTO THE SLV INVENTORY
INVENTORY RESTS AT 328.962 MILLION OZ
JULY 19/WITH SILVER DOWN 17 CENTS TODAY; A HUGE CHANGE IN SILVER INVENTORY AT THE SLV: A DEPOSIT OF 752,000 OZ INTO THE SLV INVENTORY/INVENTORY RESTS AT 327.551 MILLION OZ/
JULY 18/WITH SILVER DOWN 3 CENTS TODAY: NO CHANGES IN SILVER INVENTORY AT THE SLV/INVENTORY RESTS AT 326.799 MILLION OZ/
JULY 17/WITH SILVER DOWN 20 CENTS TODAY: A CHANGE IN SILVER INVENTORY A WITHDRAWAL OF 1.001 MILLION OZ FROM THE SLV: INVENTORY RESTS AT 326.799 MILLION OZ/
JULY 16/WITH SILVER FLAT TODAY, A HUGE CHANGE IN SILVER INVENTORY AT THE SLV: A DEPOSIT OF 1.128 MILLION OZ//INVENTORY RESTS AT 327.880 MILLION OZ
JULY 13/WITH SILVER DOWN 16 CENTS TODAY/NO CHANGE IN SILVER INVENTORY AT THE SLV/INVENTORY RESTS AT 326.752 MILLION OZ.
JULY 12/WITH SILVER UP 12 CENTS TODAY: ANOTHER BIG CHANGE IN SILVER INVENTORY AT THE SLV: A DEPOSIT OF 1.035 MILLION OZ/INVENTORY RESTS AT 326.752 MILLION OZ/
JULY 11/WITH SILVER DOWN 22 CENTS TODAY: ANOTHER HUGE CHANGES IN SILVER INVENTORY AT THE SLV: A DEPOSIT OF 565,000/INVENTORY RESTS AT 325.717 MILLION OZ
JULY 10/WITH SILVER DOWN 3 CENTS TODAY: NO CHANGES IN SILVER INVENTORY AT THE SLV/INVENTORY RESTS AT 325.151 MILLION OZ
july 9/WITH SILVER UP 5 CENTS: ANOTHER BIG CHANGE IN SILVER INVENTORY AT THE SLV: A DEPOSIT OF 847,000 OZ ADDED TO INVENTORY/INVENTORY RESTS AT 825.151 MILLION OZ/
JULY 6/WITH SILVER DOWN 2 CENTS/NO CHANGE IN SILVER INVENTORY AT THE SLV/INVENTORY RESTS AT 324.305 MILLION OZ/
JULY 5/WITH SILVER UP 6 CENTS, A GOOD CHANGE IN SILVER INVENTORY AT THE SLV: A DEPOSIT OF 470,000 OZ/INVENTORY RESTS AT 324.305 MILLION OZ/ FOR THE PAST 10 TRADING DAYS, SILVER INVENTORY HAS ADVANCED BY 4.945 MILLION OZ WITH A LOSS OF 33 CENTS/PLEASE COMPARE THIS WITH THE GLD.
JULY 3/WITH SILVER UP 17 CENTS, A HUGE DEPOSIT OF 1.37 MILLION OZ ADDED TO THE SLV/INVENTORY RESTS AT 323.835 MILLION OZ.
JULY 2/WITH SILVER DOWN 31 CENTS/A HUGE 2.070 MILLION OZ DEPOSIT AT THE SLV/INVENTORY RESTS AT 322.465 MILLION OZ/
AUGUST 3/2018:
Inventory 329.292 MILLION OZ
6 Month MM GOFO 1.92/ and libor 6 month duration 2.53
Indicative gold forward offer rate for a 6 month duration/calculation:
G0FO+ 1.92%
libor 2.53 FOR 6 MONTHS/
GOLD LENDING RATE: .61%
XXXXXXXX
12 Month MM GOFO
+ 2.83%
LIBOR FOR 12 MONTH DURATION: 2.42
GOFO = LIBOR – GOLD LENDING RATE
GOLD LENDING RATE = +.41
end
At 3:30 pm the CME releases the COT report which shows position levels of our major players.
However it does not show has moved to London through the EFP’s and thus makes this report totally useless.
However I shall report on it and let you decide upon what you can glean from it:
First the Gold COT
| COT Gold, Silver and US Dollar Index Report – August 3, 2018 |
— Published: Friday, 3 August 2018 | Print | Comment – New!
|
|||||||||||||||||||||||||||||||||||||||||||||||||||||||||||||||||||||||||||||||||||||||||||||||||||||||||
Our large speculators
those large speculators who have been long in gold pitched (transferred) a large 11,365 contracts from their long side
those large specs who have been short in gold added a net 1895 contracts to their short side
Our commercials
those commercials who have been long in gold pitched (transferred) a huge 17,386 contracts from their long side.
those commercials who have been short in gold covered (transferred) a massive 35,136 contracts from their short side.
Our small speculators
those small specs who have been long in gold pitched (transferred) 4724 contracts from their long side
those small specs who have been short in gold covered (transferred) 234 contracts from their short side.
Conclusions:
not worth the paper it is printed on.
and now your silver COT
| Silver COT Report: Futures | |||||
| Large Speculators | Commercial | ||||
| Long | Short | Spreading | Long | Short | |
| 89,616 | 83,752 | 24,373 | 77,534 | 101,683 | |
| 1,591 | -735 | 7,456 | 1,446 | 5,570 | |
| Traders | |||||
| 106 | 58 | 45 | 41 | 37 | |
| Small Speculators | Open Interest | Total | |||
| Long | Short | 226,512 | Long | Short | |
| 34,989 | 16,704 | 191,523 | 209,808 | ||
| 1,423 | -375 | 11,916 | 10,493 | 12,291 | |
| non reportable positions | Positions as of: | 173 | |||
Our large speculators
those large specs who have been long in silver added a net 2496 contracts to their long side
those large specs who have been short in silver covered (transferred) 441 contracts from their short side
Our commercials
those commercials who have been long in silver pitched (transferred) a net 21 contacts from their long side
those commercials who have been short in silver added 3994 contracts to their short side
Our small speculators
those small specs who have been long in silver added 497 contacts to their long side
those small specs who have been short in silver covered (transferred) 580 contracts from their short side.
Major gold/silver trading /commentaries for FRIDAY
GOLDCORE/BLOG/MARK O’BYRNE.
This Week’s Golden Nuggets
Charts of the Week
Today’s News and Commentary
Gold and Silver Fall Again (Silverseek.com)
Gold holds steady near 1-year low (Reuters.com)
Gold demand in India down around 7% in Q1 to 187 tonnes, says WGC (Business-Standard.com)
Platinum Price Jumps as Nymex Bears Wake Up to Mining Output Cut(24HGold.com.com)
Iran’s Gold Demand at Four-Year High Days Before Sanctions (Bloomberg.com)
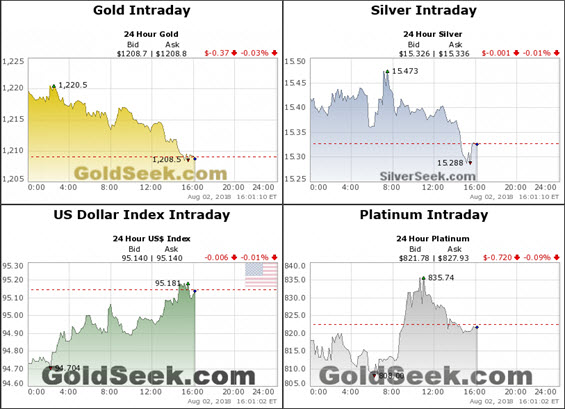
Source: GoldSeek.com
Warren Buffet’s Favorite Stock Market Metric Is Signaling Huge Downside Ahead (Zerohedge.com)
In socialist Venezuela, the U.S. dollar becomes king(WashingtonPost.com)
New Hope For Higher Silver Prices (Silverseek.com)
Is China hiding its gold shorts among the speculators? (GATA.org)
Listen on SoundCloud , Blubrry & iTunes. Watch on YouTube below

Gold Prices (LBMA AM)
02 Aug: USD 1,217.60, GBP 931.22 & EUR 1,048.23 per ounce
01 Aug: USD 1,222.75, GBP 932.47 & EUR 1,046.55 per ounce
31 Jul: USD 1,219.20, GBP 926.71 & EUR 1,039.86 per ounce
30 Jul: USD 1,222.05, GBP 931.20 & EUR 1,045.95 per ounce
27 Jul: USD 1,219.15, GBP 931.06 & EUR 1,048.10 per ounce
26 Jul: USD 1,228.35, GBP 931.46 & EUR 1,049.13 per ounce
25 Jul: USD 1,230.55, GBP 935.09 & EUR 1,051.75 per ounce
Silver Prices (LBMA)
02 Aug: USD 15.45, GBP 11.78 & EUR 13.29 per ounce
01 Aug: USD 15.48, GBP 11.79 & EUR 13.24 per ounce
31 Jul: USD 15.43, GBP 11.72 & EUR 13.15 per ounce
30 Jul: USD 15.49, GBP 11.81 & EUR 13.25 per ounce
27 Jul: USD 15.36, GBP 11.72 & EUR 13.20 per ounce
26 Jul: USD 15.54, GBP 11.79 & EUR 13.27 per ounce
25 Jul: USD 15.57, GBP 11.83 & EUR 13.31 per ounce
Recent Market Updates
– Gold to Enter New Bull Market – Charles Nenner
– Here’s Where the Next Crisis Starts
– House prices aren’t just slipping in the UK – this is global
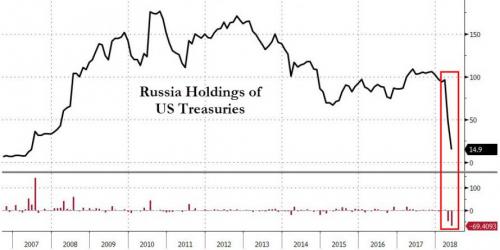
– Russia Sells 80% Of Its US Treasuries
– Are China’s Gold Reserves Slowly Rising?
– Gold Outlook In H2 2018
– Gold Production In South Africa Continues To Collapse – Plummets 85% From Peak In 1970 (VIDEO)
– Physical Gold Is The “Best Defence” Against “Escalating Currency Wars”
– Trump and War With China? Goldnomics Podcast
– Weekly Digest – News, Market Updates and Videos You May Have Missed
– Financial Terrorism In The UK – Collusion between Government, Regulators & Two Bailed-Out UK Banks
– “Biggest Bubble in the History of Mankind” Is “Going To Burst” – Ron Paul
– Global Debt Time Bomb Surges To Nearly $250,000,000,000,000 – GoldCore Video
– Trump, Russia, Brexit and the Demand For Gold and Silver – GoldCore Video Interview
– Trump Is Serious About A Global Trade War
– Ponzi Economy Will Lead To Next Global Financial Crisis
– World Cup Is 200 Ounces Of Gold Worth £140,000 – 30% Less Than Harry Kane’s Weekly Wage
Andrew Maguire’s Kinesis money which is a “bitcoin” but backed 100% by allocated gold and silver is set to go.
it think it would be a great idea to look at this!
please read at: https://kinesis.money/#/
(Andrew Maguire)
|
|
Dear Harvey Organ,
Thank you for your participation in our webinar on June 7th with our host and CEO of Kinesis, Thomas Coughlin.
The response we received has been incredible, we appreciate you taking the time to join us and hope you found it to be beneficial.
Due to such a high influx of questions we received we were unable to have them all answered. Nevertheless, if there was anything which requires more clarification, or you have a query which needs to be rectified, we invite you to join our telegram group:
We apologize for the technical issues we incurred during the webinar which resulted in it running a little over schedule, we hope that the next one we host will run seamlessly.
A video has been put together and uploaded onto our YouTube channel which can be found here:
Please share and subscribe to our YouTube channel to be notified of all the latest videos as they become available.
The rapid growth that we are currently experiencing has been incredible and with your support, is only going to get better.
We are working behind the scenes very hard to create a better experience for everyone involved! Stay tuned in as we have many more announcements to be released in the upcoming days.
Kind Regards,
 |
Kinesis Money
a:C/O ILS Fiduciaries (IOM) Limited, First Floor,Millennium House, Victoria Road, Douglas, Isle of Man IM2 4RW
   |
Gold set for violent spike up, Maguire tells KWN
Submitted by cpowell on Fri, 2018-08-03 18:46. Section: Daily Dispatches
2:47p ET Friday, August 3, 2018
Dear Friend of GATA and Gold:
Now that there is a record short position in gold futures by speculators, “a huge move higher” in gold is near, London metals trader Andrew Maguire tells King World News today.
China, Maguire adds, has been playing the gold market with its usual cleverness, using paper gold to knock prices down while buying real metal with devalued yuan. Contrary to suggestions from the World Gold Council, China’s gold demand this year has been strong, Maguire says.
Maguire’s comments are headlined “Andrew Maguire — Gold Market Set to Spike Violently Higher, Crushing Hedge Fund Shorts” and it’s excerpted at KWN here:
https://kingworldnews.com/andrew-maguire-gold-market-set-to-spike-violen…
CHRIS POWELL, Secretary/Treasurer
Gold Anti-Trust Action Committee Inc.
CPowell@GATA.org
end
The following is self explanatory
(courtesy GATA/Chris Powell and Harvey Organ)
GATA asks bank regulator to check risks of gold
futures maneuver
Submitted by cpowell on Sun, 2018-06-10 16:17. Section: Daily Dispatches
12:21p ET Sunday, June 10, 2018
Dear Friend of GATA and Gold:
GATA has appealed to the U.S. comptroller of the currency, who has regulatory authority over banks, to review financial risks certain banks may have incurred through derivatives in the monetary metals markets, particularly through the recent heavy use of the “exchange for physicals” mechanism of settling gold and silver futures contracts on the New York Commodities Exchange.
The appeal was made in a letter sent May 5 to the comptroller, Joseph M. Otting, whose office is part of the U.S. Treasury Department, by your secretary/treasurer and GATA futures market consultant Harvey Organ.
“Exchange for physical” settlements of futures contracts long were considered emergency procedures when a seller was not able to deliver metal from an exchange-approved warehouse and wanted to settle with delivery elsewhere. But now such settlements appear to constitute most gold and silver futures settlements on the Comex. It is a strange development that appears to have been necessitated by the increasing difficulties of central banking’s gold and silver price suppression policy.
GATA has received no acknowledgment of the letter. Its text is below and a PDF copy of it is here:
http://www.gata.org/files/ComptrollerOfCurrencyLetter.pdf
CHRIS POWELL, Secretary/Treasurer
Gold Anti-Trust Action Committee Inc.
CPowell@GATA.org
* * *
May 5, 2018
Joseph M. Otting, Comptroller of the Currency
U.S. Treasury Department
400 7th Street, SW
Washington DC 20219
Dear Comptroller Otting:
Please let us bring to your attention financial risks to major banks involving their possibly unreported exposure to derivatives in the monetary metals markets.
In recent months gold and silver future contracts issued by U.S. banks on the New York Commodities Exchange have been moved off-exchange for delivery through a mechanism known as “exchange for physical” (EFP) contracts. Until recently use of this mechanism was considered an emergency procedure when a seller did not have access to metal for delivery through Comex warehouses. Now the mechanism seems to be in use for a large share of front-month contracts for which delivery is sought.
Here is an example that is happening at the Comex in the front active month of April for gold and the inactive delivery month of April for silver.
In gold, there were 229,436 EFP contracts for 713.64 tonnes, an average of 10,925 contracts and 1,092,500 ounces per trading day.
In silver, there were 77,150 EFP contracts for 385,750,000 ounces, an average of 3,673 contracts and 18,369,000 ounces per trading day.
London Bullion Market Association rules suggest that these contracts may not be reported to regulators. The LBMA’s bylaws say:
“Figures above exclude any contracts not subject to risk-based capital requirements, such as FX contracts with an original maturity of 14 days or less, futures contracts, written options, and basis swaps. Therefore, the total notional amount of derivatives by maturity will not add to the total derivatives figure in this table.”
We are told that these EFP contracts are transferred from the Comex to London as what are called “serial forwards” and their duration is always less than 14 days, which exempts them from being reported.
It is our understanding that in each quarter your office prepares a report detailing risk undertaken by the banks under the comptroller’s supervision.
These risks include derivatives undertaken by U.S. banks and other obligations that may cause a bank to fail. Our concern is that your office may not be aware of large unreported derivative exposure by banks.
Could you review this matter and let us know your conclusions?
Sincerely,
CHRIS POWELL
Secretary/Treasurer
HARVEY ORGAN
Consultant
Gold Anti-Trust Action Committee Inc.
7 Villa Louisa Road
Manchester, Connecticut 06043-7541
end
What goes on in socialist and totally bankrupt Venezuela
(courtesy Washington post)
In socialist Venezuela, the U.S. dollar becomes
king
Submitted by cpowell on Thu, 2018-08-02 18:18. Section: Daily Dispatches
By Rachelle Krygier
Washington Post
Thursday, August 2, 2018
CARACAS, Venezuela — As hyperinflation spirals toward 1 million percent, Venezuelans are confronting a deepening crisis that is pulverizing their incomes and spreading hunger.
Increasingly, the line between survival and starvation is determined not by having a job or an education, but something else.
Access to U.S. dollars.
Long decried as a symbol of imperialism by President Nicolás Maduro, the American greenback is now king in a country broken by mismanagement, corruption and years of failed socialist policies. The dollar’s importance has soared as the local currency, the bolívar, has become nearly worthless.
…
This week, for instance, the price of a dozen eggs topped 2.6 million bolívares — equal to two weeks’ pay at the minimum wage. But for a Venezuelan who can exchange dollars at the black market rate, those same eggs are a relative bargain, costing only 60 cents.
Venezuelans are increasingly being separated into two classes: those who have dollars and those who do not.
Consider the case of the Berroterán sisters. …
… For the remainder of the report:
https://www.washingtonpost.com/world/in-socialist-venezuela-the-us-dolla…
END
Because of the weak Australian dollar, Aussie gold producers are outperforming North American miners. Now investors want these Australian producers to buy out some of their USA rivals
(courtesy Bloomberg/GATA)
Investors want Australian gold producers to buy
their U.S. rivals
Submitted by cpowell on Fri, 2018-08-03 01:09. Section: Daily Dispatches
By Ranjeetha Pakiam and David Stringer
Bloomberg News
Thursday, August 2, 2018
Gold producers in Australia are outperforming their global competitors, prompting investors to encourage them to expand their horizons and acquire struggling North American rivals.
Boosted by some of the sector’s best margins, low debt, and swelling cash piles, miners in the world’s No. 2 producer are defying a wider lull in gold equities. Saracen Mineral Holdings Ltd. and Northern Star Resources Ltd. have surged in the past year as rivals in Canada, the U.S., and South Africa faltered.
“Australian gold miners currently enjoy some of the highest margins in the world,” said Stephen Land, San Mateo, California-based portfolio manager at the $1.1 billion Franklin Gold and Precious Metals Fund. The producers are being supported by cuts to operating costs and stronger prices of bullion in Australian dollar terms. …
… For the remainder of the report:
https://www.bloomberg.com/news/articles/2018-08-02/gold-s-outback-outper…
end
A sensational article written by David Brady as he outlines why the price of gold mirrors the value of the yuan
a must read…
(courtesy David Brady/Sprott Money
USD/CNY – the Mirror Image of Gold
Written by David Brady, CFA- Sprott Money News
The price of Gold today is determined by USD/CNY, period. Any analysis of Gold is basically a review of USD/CNY, plain and simple. Once you understand this, the reason for Gold’s performance recently becomes clear.
This is to some degree unfortunate and quite frustrating for owners of Gold such as myself, especially because we don’t know what the Chinese plan to do: USD/CNY is a black box. This makes it almost impossible to predict where Gold is headed next.
However, it is also fortunate in my humble opinion, given that China has a vested interest in higher Gold prices long-term and an end to the dollar as the global reserve currency. So if you can endure the pain of potentially lower prices in the short-term, I expect Gold to go multiples higher long-term, Silver even more so.
In order for that to happen, either Gold has to be revalued in yuan terms (XAU/CNY) or the USD/CNY has to fall. So the key issues are: what are the circumstances under which either of these two outcomes could occur, and when? I will delve into that here (skip to 5 below), but first I want to address several queries I have received with regard to the Gold and USD/CNY connection. I have covered these points in prior articles, but they need repeating briefly here:
1. Why is Gold determined by USD/CNY?
Any and all currency exchange rates—and Gold is a currency, not a commodity—can be derived through other related exchange rates. For example:
EUR/USD = EUR/JPY divided by USD/JPY
This a mathematical certainty validated by arbitrage in the marketplace.
Now switch Gold or ‘XAU’ for EUR and CNY for JPY in the above equation and you get the following:
XAU/USD = XAU/CNY divided by USD/CNY
If one variable is fixed—in this case, Gold in yuan terms, or XAU/CNY—then it is clear that XAU/USD is simply the inverse of USD/CNY. Put simply, if USD/CNY goes up in value, XAU/USD falls, and vice-versa for a drop in USD/CNY. We have seen this recently in the decline of Gold from 1369 in April to as low as 1211 recently and the concurrent rise in USD/CNY, but this correlation has been going on for much longer than that:

The correlation has just become much more pronounced, as the other variable—Gold in yuan terms, or XAU/CNY—has been pegged in a tighter and tighter range, currently between ~8200-8360.

Again, this means that the price of Gold in dollar terms is simply calculated by dividing XAU/CNY above by USD/CNY. Given the XAU/CNY is confined to a tight range, the price of Gold in dollar terms is primarily determined by the USD/CNY exchange. Nothing else.
This why the COMEX has become redundant to some extent and the power of the Bullion Banks to drive or slam Gold prices removed.
2. Why has USD/CNY been rising and why so much?
I believe this is in response to U.S. tariffs. It is no coincidence that the rise in USD/CNY coincided with the first mention of tariffs on Chinese products by President Trump. Nor is it any coincidence that the introduction of 10% tariffs on a range of Chinese products has lead to a near 10% rise in USD/CNY—or put another way, a 10% devaluation of the yuan.
The devaluation of the yuan completely undermines the whole purpose of U.S. tariffs on Chinese products, by making Chinese goods cheaper in dollar terms. This offsets the entire increase in price due to tariffs, such that the price in dollars remains exactly the same as it was prior to the tariffs being levied.
This makes sense when you consider that China exports way more to the U.S. than the U.S. exports to China, hence the massive trade deficit that is the catalyst for these tariffs. This means that China can only respond so much with its own tariffs on goods imported from the U.S., so it must use other measures to respond to this escalating trade war. That is exactly what China is doing with the USD/CNY.
3. Why is China pegging Gold in yuan terms?
China (like Russia) has publicly stated that it wants an end to the dollar as the global reserve currency, replaced by a supranational currency like the IMF’s SDR. The Chinese yuan was added to the SDR’s basket of currencies in Oct 2016. Pegging the yuan against Gold enables China to say to prospective trading partners that “the yuan is as good as gold.” This is a key element of their plan to promote the yuan’s use in global trade and foreign investment in China. This would further erode the dollar’s use in global trade and FX reserves and increase the yuan’s weighting in the SDR basket.
4. Why is a one-off maxi devaluation of yuan by up to 25% bullish Gold, but a day-to-day valuation of 1% that is cumulatively 25% bearish Gold?
Whenever a currency is significantly devalued, it isn’t devalued against just one currency, it’s devalued against all currencies. For example, the pound cannot devalue against the dollar and stay at the same exchange rate against the euro, as that would also devalue the euro against the dollar. The pound devalues against both of them, leaving the euro/dollar exchange rate the same. The same happens for Gold. Gold in dollar terms would more or less remain unchanged.
In a one-off devaluation whereby the yuan is devalued by 25% against the dollar overnight, it would also have to be devalued against Gold and every other currency by 25%, otherwise Gold would have to rise 25% in dollar terms, and in euros, yen, pounds, etc. Obviously, the U.S. and every other country would not agree to this (seen in scenario B below).
The table below shows what would happen if the yuan was devalued by an additional 15% on top of the ~10% devalued it has already incurred. Scenario A shows what would happen in practice, leaving Gold unchanged in dollar terms but “Gold and the dollar both rising significantly in yuan terms”. Scenario B is presented to show what would NOT happen, but many misunderstand this. Such a devaluation would not be negative for Gold in dollar terms. Gold would remain unchanged as shown in Scenario A.

However, such a maxi devaluation would be extremely bullish Gold in my opinion, in that it would put a cap on USD/CNY. USD/CNY would not be expected to rise any further, as the yuan had already been devalued 25% and therefore USD/CNY was more likely to fall. This makes sense, too, in the event of a U.S. stock market crash caused by such a devaluation, followed by a Fed reversal of monetary policy in the U.S. leading to a generally weaker dollar, including against the yuan. Lower USD/CNY means higher Gold in dollar terms.
By contrast, a day-to-day devaluation of ~1% could go on and on, leading to lower and lower Gold prices over time. Hence, why I consider a massive one-off devaluation bullish but a stealth devaluation daily bearish.
A maxi devaluation is less likely, given China’s desire to keep Gold fixed in yuan terms for reasons outlined in #3 above, but not impossible.
Now to the final key question. Understanding that Gold’s performance is tied to that of USD/CNY…
5. What could propel USD/CNY lower and Gold higher? And when?
There are 3 possible catalysts for a weaker USD/CNY and higher Gold prices in dollar terms:
- Revaluation of XAU/CNY
- End to the Trade War
- Fed reversal of policy to QE, ZIRP/NIRP resulting in a weaker dollar
We covered the rationale for ‘A’ above in #4 in the discussion on a maxi devaluation. In terms of when, this could occur almost immediately—or soon after—in response to an escalation of tariffs on much or all Chinese exports to the U.S. to 25%.
Regarding B, I consider a voluntary end to the trade war to be extremely unlikely. Both sides appear intransigent. The U.S. may have genuine grievances with China on many issues, but the Chinese have recoiled at the manner in which U.S. concerns have been presented. There was no negotiation before a gauntlet had been laid down by the U.S., and China, all about saving face, feels it has no option now but to fight fire with fire. The war is more likely to escalate than dissipate. Both sides are playing a game of chicken and waiting to see who blinks first.
For example, yesterday, the Trump administration just confirmed that it is proposing to raise planned tariffs on $200 billion in Chinese imports from 10% to 25%.
Meanwhile, in this article in China’s Global Times yesterday, China is clearly unwilling to back down in the trade war with the U.S. and is relying on a U.S. economic and likely financial market meltdown to soften the U.S. stance on trade. This is their end game, and based on their own words, they’re going to continue to fight it out until then.
Therefore, the most likely end to the trade war would be involuntary, driven by a U.S. stock market crash followed by a reversal of monetary policy by the Fed to stimulus on steroids. This would be the catalyst for a renewed slide in the dollar, in my humble opinion. A weaker dollar would cause USD/CNY to fall, making Chinese imports more expensive and U.S. exports cheaper, and thereby erode the massive trade deficit between the two countries. This would eliminate the need for tariffs to achieve such an outcome. At the same time, it would also start a massive rally in Gold in dollar terms.
When could such a crash occur? This is something I have covered in several interviews recentlyhttps://www.sprottmoney.com/Blog/i-expect-a-crash-…, on Twitter and at globalprotraders.com, but suffice to say here that I expect such a crash to occur in October—but it could be slightly sooner or later than that. When a crash in the U.S. stock market occurs and it is followed by a Fed reversal in policy, I believe USD/CNY will fall and we will never see such low prices in Gold (or Silver) again.
end
Your early FRIDAY morning currency, Asian stock market results, important USA/Asian currency crosses, gold/silver pricing overnight along with the price of oil Major stories overnight/9 AM EST
i) Chinese yuan vs USA dollar/CLOSED DOWN TO 6.8554/HUGE DEVALUATION FOR THE PAST TWO WEEKS RESUMES BUT AT A SLOWER PACE//OFFSHORE YUAN: 6.8611 /shanghai bourse CLOSED DOWN 27.58 POINTS OR 1,00% /HANG SANG CLOSED DOWN 38.24 POINTS OR 0.14%
2. Nikkei closed DOWN 12.65 POINTS OR 0.06%/USA: YEN FALLS TO 111.59/
3. Europe stocks OPENED DEEP INTO THE GREEN /
USA dollar index RISES TO 95.20/Euro RISES TO 1.1598
3b Japan 10 year bond yield: FALLS TO . +.11/ !!!!(Japan buying 100% of bond issuance)/Japanese yen vs usa cross now at 111.59/ THIS IS TROUBLESOME AS BANK OF JAPAN IS RUNNING OUT OF BONDS TO BUY./JAPAN 10 YR YIELD IS NOW TARGETED AT .11%/JAPAN LOSING CONTROL OF THEIR BOND MARKET
3c Nikkei now JUST BELOW 17,000
3d USA/Yen rate now well below the important 120 barrier this morning
3e WTI:: 69.06 and Brent: 73.56
3f Gold UP/Yen UP
3g Japan is to buy the equivalent of 108 billion uSA dollars worth of bond per month or $1.3 trillion. Japan’s GDP equals 5 trillion usa./“HELICOPTER MONEY” OFF THE TABLE FOR NOW /REVERSE OPERATION TWIST ON THE BONDS: PURCHASE OF LONG BONDS AND SELLING THE SHORT END
Japan to buy 100% of all new Japanese debt and by 2018 they will have 25% of all Japanese debt. Fifty percent of Japanese budget financed with debt.
3h Oil UP for WTI and UP FOR Brent this morning
3i European bond buying continues to push yields lower on all fronts in the EMU. German 10yr bund FALLS TO +.440%/Italian 10 yr bond yield UP to 2.98% /SPAIN 10 YR BOND YIELD DOWN TO 1.44%
3j Greek 10 year bond yield RISES TO : 4.11
3k Gold at $1212.40 silver at:15.45 7 am est) SILVER NEXT RESISTANCE LEVEL AT $18.50
3l USA vs Russian rouble; (Russian rouble UP 2/100 in roubles/dollar) 63.34
3m oil into the 69 dollar handle for WTI and 73 handle for Brent/
3n Higher foreign deposits out of China sees huge risk of outflows and a currency depreciation. This can spell financial disaster for the rest of the world/
JAPAN ON JAN 29.2016 INITIATES NIRP. THIS MORNING THEY SIGNAL THEY MAY END NIRP. TODAY THE USA/YEN TRADES TO 111.59 DESTROYING JAPANESE CITIZENS WITH HIGHER FOOD INFLATION
30 SNB (Swiss National Bank) still intervening again in the markets driving down the SF. It is not working: USA/SF this morning 0.9939 as the Swiss Franc is still rising against most currencies. Euro vs SF is 1.1527 well above the floor set by the Swiss Finance Minister. Thomas Jordan, chief of the Swiss National Bank continues to purchase euros trying to lower value of the Swiss Franc.
3p BRITAIN VOTES AFFIRMATIVE BREXIT/LOWER PARLIAMENT APPROVES BREXIT COMMENCEMENT/ARTICLE 50 COMMENCES MARCH 29/2017
3r the 10 Year German bund now POSITIVE territory with the 10 year FALLING to +0.44%
The bank withdrawals were causing massive hardship to the Greek bank. the Greek referendum voted overwhelming “NO”. Next step for Greece will be the recapitalization of the banks and that will be difficult.
4. USA 10 year treasury bond at 2.98% early this morning (THIS IS DEADLY TO ALL MARKETS). Thirty year rate at 3.11%
5. Details Ransquawk, Bloomberg, Deutsche bank/Jim Reid.
(courtesy Jim Reid/Bloomberg/Deutsche bank/zero hedge)
Markets On Edge As Italian Bonds Slide, Yuan
Plunge Hits A Record; Payrolls Loom
World stocks traded mixed on Friday, with risk appetite dampened despite Apple crossing a $1 trillion market cap and boosting tech stocks around the globe, after Wilbur Ross warned there’s “more pain ahead” unless China changes its economic system adding to trade war tensions, pushing the Yuan as low as 6.91 after the lowest PBOC fixing since May 2017. And while there were no fireworks in Japanese bonds overnight for the first time in a week, this time it was Italian bonds that tumbled with 10Y BTP yields rising briefly above 3% ahead of a budget meeting between the country’s populist leaders and the finance minister. The MSCI All-Country World Index was down by 0.1% after the start of European trading, and set to break a four-week streak of gains.

S&P 500 and Dow Jones index futures were both flat ahead of the U.S. jobs report, which is expected to show unemployment ticking modestly lower. The Stoxx Europe 600 Index advanced for the first time in three days, powered by a rally in autos, tech and banking stocks after Credit Agricole SA beat earnings estimates while RBS announced its first dividend in 10 years.

Italian bonds slumped for the third day as Italy officials are set to meet on the budget today where populist leaders Di Maio and Salvini have pushed “Tria’s back to the wall” with their budget requests, according to La Stampa. Italian 10 year yields broke above 3 percent for the first time in nearly two months following a report by La Stampa newspaper that the gathering would take place at 11 a.m. Economy Minister Giovanni Tria is under pressure from the government’s populist leaders to raise spending and challenge European Union budget rules. The possibility that he might be forced to resign has investors worried that Italy could go on a spending binge, or even that fresh elections could follow. That in turn could strengthen the hand of the eurosceptic League party and its leader, Matteo Salvini.
“Clearly, this is about the fear that Tria gets kicked out, which could lead to a collapse of the government, new elections, and the League gaining even further,” said Commerzbank strategist Christoph Rieger. “Or it may mean that they agree on a budget that’s at odds with the EU,” which would imply heavier borrowing and greater bond supply.
Yields on 10-year government debt rose as much as 19 basis points to 3.10%, rising above 3% for the first time since June 11 with the spread over those on their German peers rising 20 basis points to 264 basis points. While Italian bank stocks fell 0.8% on the yield rise, set for their worst week since early June, the consequences of the BTP selling – which was compounded by a lack of liquidity – have been largely contained to Italy, with European stocks ignoring the potential fallout from today’s meeting.

Earlier in Asia, despite Wall Street’s tech-led rally, gains were capped by the trade tensions. MSCI’s broadest index of Asia-Pacific shares outside Japan was up 0.05% though it was down over half a percent on the week. Hardest hit again was China’s stock market, as the Shanghai Composite dropped another 1%, approaching one month lows.

It has been a week for notable inflection points, and one day after Apple surpassed the $1 trillion market cap, China also lost its ranking as the the world’s #2 stock market to Japan.

Meanwhile, the all important Chinese devaluation – which as a reminder if Beijing’s currency war response to Trump’s trade war – continued apace, when the PBOC weakened its daily reference rate by 0.56% to 6.8322, lowest level since May 2017. As a result, the onshore yuan is headed for an eighth week of declines, the longest stretch of weekly losses since the start of China’s modern foreign exchange regime began in 1994, amid speculation policy makers would tolerate currency weakness as China-U.S. trade tensions worsen. The offshore Yuan was also poised for an eighth straight week of losses, longest such streak on record; currency falls 0.10% to 6.8897 per dollar, after sliding as low as 6.9127, and is set for 1.2% weekly loss.

Elsewhere in FX, the dollar hit its highest in over three weeks, holding extending sharp gains made the previous day and holding above 95.000. The pound was set for its longest stretch of weekly losses since 2015 as investors looked past the Bank of England’s rate hike on Thursday and focused on Brexit risks. The euro dipped and Italian bonds slumped for a third day as core European debt gained with Treasuries
Elsewhere, Turkey’s lira, bonds and stocks extended their slide after the U.S. imposed sanctions on two government ministers over the detention of an evangelical pastor.
With the trade tensions encouraging demand for safe haven assets, the 10-year U.S. Treasury note yield pulled back to 2.9729% from a 10-week high above 3% hit midweek. The 10-year Treasury yield had hit the peak partly due to a surge in Japanese government bond yields to 1-1/2-year highs this week as the market tested the Bank of Japan’s rejigged policy framework. However,
Trump’s unpredictability on trade has kept markets on the back foot for the second earnings season in a row, even against the backdrop of a mostly positive earnings season and an upbeat assessment from the Fed earlier this week. Of the 397 S&P 500 companies that have already reported earnings this season so far, about 82% managed to beat analysts’ estimates, higher than the 72% beats seen during the same quarter last year.
Investors were also cautious before the July U.S. jobs report due later in the day. This will give a reading on the health of the world’s largest economy, now in its second longest expansion on record. Consensus expectation is that 190,000 jobs were created in July (see full preview here).
“The stock market trend continues to be characterized by a struggle between trade war distress, growth risks and strong corporate Q2 reports,” SEB analysts wrote in a note to clients. According to Bloomberg, mentions of tariffs in S&P 500 company earnings reports for the second quarter have more than doubled from the first quarter of this year.

In commodities, oil prices eased back slightly after the previous day’s rally, which was driven by an industry report suggesting U.S. crude stockpiles would soon decline again after a surprise rise in the latest week. Brent crude futures were down 0.4 percent at $73.17 a barrel after surging 1.5 percent on Thursday. Copper on the London Metal Exchange slipped half a percent to $6,107 per tonne. With trade tensions hurting demand, the industrial metal was down 2.8 percent for the week.
Expected data include trade balance, non-farm payrolls, and of course unemployment, and PMIs. Berkshire, Dish, Kraft Heinz, and Noble Energy are among companies reporting earnings.
Market Snapshot
- S&P 500 futures little changed at 2,826.75
- STOXX Europe 600 up 0.3% to 387.84
- MXAP down 0.3% to 164.82
- MXAPJ unchanged at 532.33
- Nikkei up 0.06% to 22,525.18
- Topix down 0.5% to 1,742.58
- Hang Seng Index down 0.1% to 27,676.32
- Shanghai Composite down 1% to 2,740.44
- Sensex up 0.9% to 37,495.42
- Australia S&P/ASX 200 down 0.1% to 6,234.78
- Kospi up 0.8% to 2,287.68
- German 10Y yield fell 4.3 bps to 0.417%
- Euro down 0.1% to $1.1573
- Brent Futures down 0.3% to $73.20/bbl
- Italian 10Y yield rose 12.2 bps to 2.643%
- Spanish 10Y yield fell 0.3 bps to 1.454%
- Brent futures down 0.4% to $73.13/bbl
- Gold spot little changed at $1,207.30
- U.S. Dollar Index little changed at 95.25
Top Overnight News
- The yuan closed in on the key milestone of 7 per dollar, a level it hasn’t weakened past in more than 10 years. The level is seen as significant as it could be the point where China steps in to arrest the decline for fear further sharp losses could prompt selling and capital outflows, according to analysts
- Commerce Secretary Wilbur Ross signaled there’s more pain ahead unless China changes its economic system. The Asian nation repeated it will never surrender to U.S. trade threats
- A U.K. business lobby called on Prime Minister Theresa May’s government to urgently publish its guidance for a no-deal Brexit scenario, as a survey of executives found less than a third have done any contingency planning
- China’s currency headed for an eighth weekly decline, the longest run since the start of the country’s modern foreign-exchange rate regime in 1994
- A bipartisan group of senators introduced legislation to impose new sanctions on Russia for interfering in U.S. elections, including penalties affecting Russian sovereign debt and energy projects, and requiring a report on President Vladimir Putin’s assets and net worth
- The Bank of Japan’s move to allow the 10-year government bond yield to trade higher may mean increased borrowing costs for local companies planning to tap yen debt markets
- Donald Trump’s anger with Robert Mueller’s alleged conflicts dates to when the U.S. president interviewed him for the job of FBI director in May of last year. The next afternoon, Trump was in another Oval Office meeting when an aide interrupted with news that Mueller had taken a different post: special counsel to investigate his presidential campaign. Trump and Attorney General Jeff Sessions, who attended both meetings, were blindsided, according to a person familiar with the two meetings
- Turkish inflation quickened less than forecast last month but price pressures are still building, giving policy makers little room to relax
Asian equity markets traded mixed as the momentum from US, where most majors gained and tech outperformed as Apple became the first ever to reach USD 1tln in market cap, was eventually dampened ahead of today’s NFP jobs figures and a further PMI miss from China. ASX 200 (-0.1%) and Nikkei 225 (+0.1%) both opened higher in which tech names in Australia revelled in the strength of their US peers and Apple’s historical feat, while Tokyo trade remained earnings-oriented. Sentiment then slightly deteriorated as China entered the fray and Caixin Services PMI missed estimates to add to the nation’s streak of disappointing PMI releases for July. The weak data and ongoing trade concerns weighed on Hang Seng (-0.2%) and Shanghai Comp. (+0.1%) from the open, although the latter recovered to trade relatively flat. Finally, 10yr JGBs were flat in the first signs of stability after the BoJ’s more flexible policy approach earlier this week, while the Rinban announcement also failed to spur price action as the BoJ kept purchases of 5yr-10yr JGBs inline with yesterday’s unscheduled announcement. PBoC skipped open market operations for a net weekly drain of CNY 210bln vs. last week’s CNY 370bln net drain. (Newswires) PBoC set CNY mid-point at 6.8322 (Prev. 6.7942)
Top Asian News
- Turkey’s Slower-Than-Expected Price Gains No Reason to Celebrate
- Tata Is Said to Get $1.3 Billion India Bill to Close Phone Deal
- A Massive Losing Bet on Bitcoin Futures Has Investors Buzzing
European equity markets have opened the day higher as the focus remains on earnings. The AEX (+0.5%) is the outperforming bourse buoyed by the news of Heineken’s (+2.3%) USD 3.1bln tie-up with China Resource Beer. The DAX (+0.5%) is also performing well after a positive earnings report from Allianz (+0.7%), but the bourse is finding resistance at its 100DMA of 12,573.54. RBS (+3.0) is up after news within their positive earnings report that they are set to pay their first dividend in over a decade. William Hill are down over 7% after the betting co. reported a pre-tax loss for H1 as a result of the new laws on betting terminals.
Top European News
- Italy Yield Tops 3% Before Budget Meeting as Bonds Extend Slump
- Italian Industrial Output Showed Annual Slowdown in June
- Eurozone Economy Enters Third Quarter With No Pickup in Sight
- Investors Doubt Dovish Czech Rate Outlook With Bets on Hikes
In FX, the Dollar remains in the ascendency, albeit off best levels, but NFP will likely determine the next big move, and especially wages after Wednesday’s broadly upbeat assessments of the economy. GBP – The Pound has extended its post-BoE declines as Governor Carney underlined benign if not outright dovish policy guidance during a BBC radio interview and also expressed discomfort about growing risk of a no deal Brexit. Cable dropped below 1.3000 in response and was hardly helped by a relatively big UK services PMI miss, but stopped just short of the 2018 base around 1.2960 at 1.2975. EUR/JPY – The single currency has also relinquished another big figure level vs the Usd and has seriously tested a key 1.1575 Fib after mostly softer than expected Eurozone services PMIs and retail sales. For the record, 1.1510 is the low so far this year. Usd/Jpy extremely restrained between 111.80-60 and flanked by hefty option expiries at 112.00 (1.8 bn) and 110.90-111.00 (1.3 bn), plus 1 bn from 111.40-50. TRY – The Lira slumped to fresh all time lows vs the Usd yet again (5.1125) before gleaning a degree of comfort from not so inflated CPI readings and reports that a meet between US Secretary of State Pompeo and Turkey’s Foreign Minister was constructive – Usd/Try currently around 5.0800.
In commodities, both WTI and Brent are seeing mild profit taking ahead of the weeks end, with WTI breaking through its 50DMA to the downside in early European trade, currently trading at USD 68.59, with news that China’s Unipec is suspending imports of US crude oil on growing trade tensions between Beijing and Washington failing to offer support. In the metals scope, Gold is essentially flat, with traders holding off ahead of the US employment report later in the day, but is languishing around a 1 year low, with the yellow metal heading for its 4th weekly loss. Silver is also heading for its 8th weekly decline amid trade tensions, and set for its longest consecutive decline since late 2000. OPEC July crude output up 340k BPD at 32.66mln BPD, compliance is at 105%, Saudi Arabian output near an all-time high, Kuwaiti, UAE and Iraqi output at its highest since December 2016, Iran at its lowest since January 2017, as according to Platts.
In terms of the day ahead, the July employment report in the US is due in the afternoon. Elsewhere in Europe the final services and composite PMIs are also due along with June retail sales for the Euro area. In the US, the other data includes the final July services and composite PMI prints along with July ISM non-manufacturing composite. Berkshire Hathaway will report its Q2 earnings. In Southern Europe the temperature will possibly get close to 48 degrees C today and tomorrow in some parts.
US Event Calendar
- 8:30am: Trade Balance, est. $46.5b deficit, prior $43.1b deficit
- 8:30am: Change in Nonfarm Payrolls, est. 193,000, prior 213,000
- Unemployment Rate, est. 3.9%, prior 4.0%
- Average Hourly Earnings MoM, est. 0.3%, prior 0.2%
- Average Hourly Earnings YoY, est. 2.7%, prior 2.7%
- Average Weekly Hours All Employees, est. 34.5, prior 34.5
- Labor Force Participation Rate, prior 62.9%
- 9:45am: Markit US Services PMI, est. 56.2, prior 56.2
- 9:45am: Markit US Composite PMI, prior 55.9; ISM Non-Manf. Composite, est. 58.6, prior 59.1
DB’s Jim Reid concludes the overnight wrap
If Apple could come up with iNanny I think they’d be the first $10 trillion company. For now they have to make do with being the first trillion dollar US company after yesterday’s +2.92% climb. For the record US Steel was the first to hit $1bn in 1901. It then took 54 years for GM to be the first to $10bn in 1955, another 32 years for IBM to reach $100bn in 1987 and now 31 years for the latest landmark. For the record Microsoft was the first $500bn company in 1999.
Apple’s landmark coincided with a tech-led rebound after a soft Asian/European session. The S&P 500 opened -0.60% on the latest overnight trade escalations but then climbed all day and closed +0.49% led by IT (+1.37%). The NYFANG index also closed +2.93%.
A common theme in recent weeks is for Asia and Europe to struggle on trade war headlines but for the US to break the shackles and shrug off any weakness and recover. DB’s Oli Harvey put out a blog highlighting that in the latest S&P market attributes report for June, it was noted that US share buybacks hit $189 billion in Q1, surpassing their previous record in Q3 2007. Buyback and decent earnings are continuing to allow the index to defy trade war gravity although the fact that we’ve been range trading since the end of January suggests that the tug of war (trade vs buyback/earnings) hasn’t necessarily seen a clear structural winner as yet.
In reality the US equity market has struggled to break out on the upside since payroll Friday brought us the vol shock 6 months ago this week. Average hourly earnings haven’t really broken out after the spike that day, but they remain a crucial part of the employment report out today on what could be the hottest day ever in some parts of Europe. Good luck keeping cool if you’re in one of those affected areas. In terms of expectations, market consensus is for a 193k payrolls print which compares to the above market 213k in June, while the unemployment rate is expected to nudge down one-tenth to 3.9%. The earnings data should be the main focus though with average hourly earnings expected to come in at +0.3% mom. Our US economists are forecasting the same for earnings which would keep the annual rate steady near +2.75% yoy. Our team are slightly below market on payrolls at 180k but that’s still more than indicative of the ongoing tightening in the labour market. So all eyes on that at 1.30pm BST.
Going into payrolls this morning in Asia, markets are trading mixed with the Nikkei (+0.14%) and Kospi (+0.52%) up modestly while the Hang Seng (-0.13%) and China’s CSI300 (-0.49%) are both weaker. Meanwhile 10y JGB yields are slightly lower while the Chinese Yuan is c0.4% weaker and heading for an eighth weekly decline – the longest streak since 1994. As for data, the July composite PMIs for China (Caixin) and Japan (Nikkei) have both eased modestly from June, printing at 52.3 (vs. 53.0 previous) and 51.8 (vs. 52.1 previous) respectively.
The moves this morning follow a fairly turbulent Asian/European session in markets yesterday as markets deliberated the latest US-China tariff threat. Europe initially followed Asia in selling off from the get-go with the likes of the DAX (-1.50%) falling by the most since early July. Europe didn’t rally much into the close as the US recovered well from opening losses.
Bonds were a bit more of a sideshow with Treasuries (10y -2.0bps) edging back below 3.00% while Bunds were -1.7bp lower. It was hard to ignore the move for BTPs however where 2 year yields shot up +20bps for the biggest sell-off since June 21st. General negative risk sentiment appeared to play a part as did the absorption of some Spanish supply, however some uncertainty leading into a Budget meeting between Finance Minister Tria and Deputy PMs Salvini and Di Maio last night also seemed to be a factor.
Now turning to some of the US / China trade headlines. Yesterday China’s Ministry of Commerce noted that “China is fully prepared and will have to retaliate to defend the nation’s dignity….” while a member of its State Council Wang Yi said “we hope that those directly involved in the US trade policies can calm down…” On the other side, the US Commerce Secretary Ross seems to have maintained his stance as he told Fox news that “we’ve to create a situation where it’s more painful for them to continue their bad practices than it is to reform”. As for the impacts on the US economy, Mr Ross noted that a 25% levy on $200bn is $50bn per year on a $18trn economy, so even if the levy was passed, “it’s not something that’s going to be cataclysmic”. Elsewhere Bloomberg cited unnamed US officials who noted that the US is open to new formal talks with China, but Beijing must agree to open its market to more competition and stop retaliatory measures. So lots bubbling along till the end of the public comments period in the US on 5th September.
As for the last central bank meeting of the week, we have to admit the market reaction to the afternoon BoE meeting was a bit of a headscratcher. There was certainly no surprise in the decision itself to raise the Official Bank Rate 25bps to 0.75% and the highest since 2009 although you could argue that the 9-0 unanimous decision by the MPC was more hawkish than what the market expected. The CPI forecasts were similar to the May projections for this year and next despite the softer CPI data recently while the statement also continued to emphasize labour market tightness. The R* was estimated at between 2% and 3% but caveated by de-emphasizing it from the forward guidance and also stating that the near term neutral rate is likely to be lower. Governor Carney’s press conference itself was mostly uneventful also with the Governor reiterating emphasis on a tightening labour market and also mentioning a pickup in unit labour cost growth.
So in light of the above it was a bit of a surprise to see Sterling drop -0.84% yesterday versus the Greenback, while Gilt yields also headed south with 10y yields in particular down over 5bps from their intraday highs at one stage, before selling-off a bit into the close to finish broadly unchanged. So markets certainly didn’t agree with the upbeat view and part of that view is perhaps based around the BoE’s assumption of a smooth Brexit – clearly still the big elephant in the room. Our UK economists viewed the minutes of the meeting and the latest Inflation Report to be on the hawkish side of expectations. However, they noted that a combination of rising uncertainty due to Brexit and slowing inflation should curb the BoE’s appetite for another move in rates this year. On the former, the Bank will want to get some view of the direction of progress with regards to Brexit talks before pulling the trigger on the next hike. Refer to their note for details.
Away from the BoE, yesterday’s economic data in Europe included a slightly higher than expected PPI reading for the Eurozone, which came in at 0.4% mom (vs. 0.3% expected) and lifted annual inflation to 3.6% yoy. Excluding energy, the increase in the index was a bit more restrained at 0.2% mom and 1.6% yoy. Meanwhile the July UK’s construction PMI rose 2.7pts mom to 55.8 (vs. 52.8 expected) – the highest since May last year. Over in the US, the June factory orders rose 0.3ppt mom to an in line print of 0.7% mom. The final readings on the June core durable goods and capital goods orders were both revised lower to 0.2% (vs. 0.4% previous) and 0.2% (vs. 0.6% previous) respectively, although growth in capital goods still rose 7.8% yoy. Finally the weekly initial jobless (218k vs. 220k expected) & continuing claims (1,724k vs. 1,750k expected) were slightly lower than expectations and remain at low levels.
In terms of the day ahead, the July employment report in the US is due in the afternoon. Elsewhere in Europe the final services and composite PMIs are also due along with June retail sales for the Euro area. In the US, the other data includes the final July services and composite PMI prints along with July ISM non-manufacturing composite. Berkshire Hathaway will report its Q2 earnings. In Southern Europe the temperature will possibly get close to 48 degrees C today and tomorrow in some parts. All time records could be broken!! And to think here in the UK we have been moaning about temperatures in the low 30s of late!! Good luck.
3. ASIAN AFFAIRS
i)FRIDAY MORNING/THURSDAY NIGHT: Shanghai closed DOWN 27.58 POINTS OR 1.00% /Hang Sang CLOSED DOWN 38.24 POINTS OR 0.14%/ / The Nikkei closed UP 12,65 POINTS OR 0.06%/Australia’s all ordinaires CLOSED DOWN 0.02% /Chinese yuan (ONSHORE) closed DOWN at 6.8554 AS POBC RESUMES ITS HUGE DEVALUATION /Oil DOWN to 69.06 dollars per barrel for WTI and 73.56 for Brent. Stocks in Europe OPENED DEEPLY IN THE GREEN//. ONSHORE YUAN CLOSED WELL DOWN AT 6.8554 AGAINST THE DOLLAR. OFFSHORE YUAN CLOSED DOWN ON THE DOLLAR AT 6.8611: HUGE DEVALUATION/PAST SEVERAL DAYS RESUMES : /ONSHORE YUAN TRADING STRONGER AGAINST OFFSHORE YUAN/ONSHORE YUAN TRADING WEAKER AGAINST USA DOLLAR/OFFSHORE YUAN TRADING WEAKER AGAINST THE DOLLAR /CHINA RETALIATES WITH TARIFFS/ TRUMP RESPONDS TO NEW TARIFFS AND IT NOW A FULL TRADE WAR COMMENCED
3 a NORTH KOREA/USA
North Korea/South Korea/USA/China
3 b JAPAN AFFAIRS
c) REPORT ON CHINA/HONG KONG
China/USA
The markets were not happy with this; Wilbur Ross states that Trump will put on more pressure on China such that they “modify their behaviour”
(courtesy zerohedge)
“More Pain Ahead”: Wilbur Ross Says Trump Will Put More Pressure On China “To Modify Their Behavior”
Chinese stocks slumped overnight as trade war tensions escalated after Wilbur Ross said there’s more pain ahead unless China changes its economic system, as Beijing repeated it will never surrender to U.S. trade threats.
“We have to create a situation where it’s more painful for them to continue their bad practices than it is to reform,” Commerce Secretary Wilbur Ross said in an interview on Fox Business Network late on Thursday. As a result, Trump will keep turning up the pressure on China for as long as the country refuses to level the economic playing field, Ross said.
Pointing out the obvious, Ross said that “the reason for the tariffs to begin with was to try and convince the Chinese to modify their behavior. Instead they have been retaliating. So the president now feels that it’s potentially time to put more pressure on, in order to modify their behavior.”
As for the impacts on the US economy, Ross noted that a 25% levy on $200bn is $50bn per year on a $18 trillion economy, so even if the levy was passed, “it’s not something that’s going to be cataclysmic”.
Elsewhere Bloomberg cited unnamed US officials who noted that the US is open to new formal talks with China, but Beijing must agree to open its market to more competition and stop retaliatory measures.
Ross’ comments follow a statement by China’s Ministry of Commerce which noted that “China is fully prepared and will have to retaliate to defend the nation’s dignity and the interests of the people, defend free trade and the multilateral system, and defend the common interests of all countries,” China’s Ministry of Commerce said in a statement Thursday on its website. The “carrot-and-stick” tactic won’t work, it said.
Elsewhere, a member of its State Council Wang Yi said “we hope that those directly involved in the US trade policies can calm down…”
Indeed, along with its pledge to fight back, China also left the door open for a resumption of negotiations. “China has consistently advocated resolving differences through dialogue, but only on the condition that we treat each other equally and honor our words,” the ministry said.
Trump said last month that he’s willing to impose tariffs on every good imported from China, which totaled more than $500 billion last year. American companies, industry and consumer groups have pleaded with the administration to avoid tariffs, saying they could raise their costs and eventually lead to price hikes for consumers.
So, as DB’s Jim Reid notes, “lots bubbling along till the end of the public comments period in the US on 5th September.”
end
A big story: the Chinese threw an olive branch for the USA as they basically nuked the yuan shorts by sending the yuan higher and dollar lower as they raised fx forward reserve requirements to 20%
(courtesy zerohedge)
China Nukes Yuan Shorts: PBOC Raises FX Fwd Reserve Requirement To 20%
In the clearest signal yet that the PBOC is drawing a “red line” to further currency devaluation, moments ago the PBOC announced it is raising the reserve requirement for FX forwards to 20%.
As the PBOC notes, “due to factors such as trade frictions and changes in international exchange markets, there have been some signs of procyclical fluctuations in the foreign exchange market.” As a result, the move is “aimed at preventing macro financial risks” with the central bank adding that it will “take counter cyclical measures to keep FX markets basically stable based on market conditions.” The new forward foreign FX risk reserve requirement will become effective as of Aug. 6th.
Stated much simpler, what the PBOC is doing is nuking Yuan shorts and forcing a marketwide FX short squeeze.
Commenting on the move, Nomura’s x-asset strategist Charlie McElligott said that when this action from the PBoC was previously enacted back in Oct ‘15, the market interpretation was that this shift was “…seen as an effort to restrict dollar purchases when the yuan is weakening.”So here we go again, “REVERSE ENGINES.”
Reuters is also reporting further “interventionary” commentary from the PBoC regarding willingness to take further “counter-cyclical” measures to stabilize FX markets.
“In the even-larger macro-sense, this is unambiguously a relief trade for risk-assets via the powerful “weakening USD” impact it can have—ESPECIALLY Emerging Markets and Commodities, which have again recently traded VERY sloppy” according to McElligott, who adds that “we see S&P futures rallying powerfully, as “stronger USD” has been a pure “tightening” of financial conditions.”
The Nomura strategist accurately concludes that “the PBoC just “eased” U.S. financial conditions.“
And sure enough, as the Yuan slides, S&P futures are surging.

Full statement below (google translated):
The People’s Bank of China decided to adjust the foreign exchange risk reserve ratio of the forward sales business to 20%.
Since the beginning of this year, the foreign exchange market has been operating steadily. The RMB exchange rate has been based on market supply and demand. There has been a rise in the market, the flexibility has been significantly enhanced, the market expectation has been basically stable, and cross-border capital flows and foreign exchange supply and demand have been generally balanced. Recently, due to factors such as trade frictions and changes in international exchange markets, there have been some signs of procyclical fluctuations in the foreign exchange market. In order to prevent macro financial risks, promote the stable operation of financial institutions, and strengthen macro-prudential management, the People’s Bank of China decided to adjust the foreign exchange risk reserve ratio of forward sales from 0 to 20% from August 6, 2018. In the next step, the People’s Bank of China will continue to strengthen the monitoring of the foreign exchange market. According to the development of the situation, it will take effective measures to carry out countercyclical adjustments, maintain the smooth operation of the foreign exchange market, and maintain the basic stability of the RMB exchange rate at a reasonable and balanced level.
Today’s move is a mirror image of what the PBOC announced on September 8, 2017 when the Yuan tumbled after the PBOC cut its FX reserve requirement from 20% to 0%, sending the Yuan tumbling after the currency had hit its highest level in years. Back then, the offshore Yuan tumbled from 6.45 to below 6.51 in hours…

Obviously the reversal of this move would have just as dramatic a move in the opposite direction, and sure enough, after hitting a one year low of 6.91 against the dollar, the CNH has surged massively, rising as high as 6.825 before finding some support.

And yet, as some traders already noted, there will be a cost to China in terms of the impact of what is effectively policy tightening will have on domestic liquidity. Specifically, as Citi notes, “the local economy and asset markets will struggle to cope with that and it is not a sustainable policy.”
And while Trump may be content that for now, at least, the PBOC has finally drawn a real line in the sand for further devaluation, he will be double happy that China no longer will permit Yuan devaluation as a currency war response to rising tariffs, effectively handing Trump leverage in the trade war, if only for the time being.
end
China releases its retaliation list to the big USA tariffs and they will levy a tax on 60 billion on USA goods entering China. Trump will react negatively to the news even though the Chinese threw an olive branch at the USA with the above nuking of yuan shorts.
(courtesy zerohedge)
China Releases “Retaliation List” To US Tariffs, Will Levy Tariffs On $60BN In US Goods
Just minutes after China appeared to offer Trump an olive branch in the trade wars, when as we reported moments ago it nuked Yuan shorts by hiking forward FX reserve requirements by 20% in the process effectively easing financial conditions in the US by sending the dollar sharply lower (and the Yuan higher), China surprised the market which took the PBOC announcement as a “risk on” signal, by releasing the proposed retaliation list to US tariffs, and announcing it will impose differentiated tariffs on $60 billion in US goods.
In a statement issued late Friday, the State Council, China’s cabinet, said China is preparing to impose duties at levels of 25%, 20%, 10% and 5% on some 5,207 American goods, and will be implemented as soon as the US enacts its own tariffs. Furthermore, the Chinese Government said it reserves the right for additional retaliation measures
Some of the products affected, per Reuters:
- CHINA GOVT’S NEW PROPOSED TARIFFS ON U.S. GOODS INCLUDE SOYBEAN OIL, PEANUT OIL, CORN OIL, OLIVE OIL, MUTTON, DRIED, SMOKED AND SALTED BEEF, COFFEE, WHEAT FLOUR, SPIRITS; WINE, SEMICONDUCTORS, CHEMICAL PRODUCTS, LNG, SMALL AND MEDIUM-SIZED AIRPLANES, AUTOMOTIVE PARTS, LUMBER
More importantly, the Chinese list includes tariffs on some US aircraft, which may lead to pain for Boeing today, although according to the list only “small and medium-sized” airplanes will be affected.
According to the announcement, the measures are to guard its interest and to keep trade frictions from escalating, although the moment Trump sees that China is responding in kind, he will most likely flip out and demand that the next set of $200BN in tariffs be swiftly implemented.
“The implementation date of the taxation measures will be subject to the actions of the U.S., and China reserves the right to continue to introduce other countermeasures,” the State Council statement said. “Any unilateral threat or blackmail will only lead to intensification of conflicts and damage to the interests of all parties.”
On the news, futures which spiked earlier on the FX reserve requirement increase, have slumped back to almost unchanged, with China effectively negating the risk on effect from its currency intervention.

At the same time, the iShares China large-cap ETF turned negative after pushing modestly in the green earlier.

Kudlow Says Trump Won’t Back Down: “China’s $60BN Response Is Weak”
It took little time for Trump’s chief China trade war advisor Larry Kudlow to respond to China’s publication of its “retaliation list” itemizing the $60 billion in US goods that will be subject to US tariffs. Saying that the $60 billion trade response by China might be weak, Kudlow warned that the US has more ammunition than China in a trade fight, envisioning that the US imports more products from China than vice versa.
Predictably, Kudlow focused on China’s currency devaluation response as the trade war recently shifted to currency war as Beijing hopes to offset the impact of tariffs using a weaker currency.
Speaking on Bloomberg TV, Kudlow correctly noted that the yuan has fallen in part because China has “stopped defending the yuan. They think it’s going to help offset the U.S. efforts to get rid of their unfair trading.” This changed on Friday evening (Chinese time) when the PBOC announced it would increase the reserve requirement on FX forward, precipitating a short squeeze and sending the Yuan sharply higher and the dollar sliding.

Some speculated that the PBOC move was a form of soft capital control, as the Yuan had fallen so much it had precipitated capital flight, easily the weakest link in China’s economy. Kudlow touched on this, saying that “some of the currency fall though I think is just money leaving China because it’s a lousy investment, and if that continues that will really damage the Chinese economy.”
“If money leaves China – and the currency could be a leading indicator – they’re going to be in a heap of trouble. And so I’m going to make the case that they are in a weak economic position. That’s not a good place for them to be vis-a-vis the trade negotiations,” he told BBG TV’s Jonathan Ferro.
It is not clear if this means that Kudlow – and thus Trump – finally understand that further tightening, and higher rates in the US, is a far worse for the Chinese economy, especially since China is about to post its first first half current account deficit on record which, without outside capital, it simply can’t fund and the alternative would be economic contraction.

It does, however, explain why Wilbur Ross yesterday said that Trump plans to pour more pain on China’s economy: after all if the Trump administration believes China is near a breaking point, it makes sense to keep cranking up the pressure.
Kudlow then made another accurate assessment of China’s economic situation saying that “it looks to me like the China economy is declining in growth. It’s weakening almost across the board. And it looks like the People’s Bank of China is trying to pump it up by adding high-powered money and new credit.”
And the punchline: “We’ve said many times: no tariffs, no tariff barriers, no subsidies. We want to see trade reforms. China is not delivering. Their economy’s weak, their currency is weak, people are leaving the country.”
As a reminder, this is precisely the prescription suggested by One River CIO Eric Peters, who last weekend laid out what is the best way to win trade war with China:
“The best way to bring Beijing to its knees is by running a tight monetary policy in the US,” continued the same investor. “China has the world’s most overleveraged, fragile financial system.” In 2008, China’s total debt-to-GDP was 140%. It is now roughly 300%, while GDP is slowing. “The economy is held together by capital controls. If those fail, the whole system fails.” The capital flight in 2015/16 cost the government $1trln in reserves, and that was with ultra-dove Yellen in charge. Imagine what would have happened with Volcker at the helm. “The Chinese are dying to get their money out.”
“Engineering a decade of rolling Chinese financial crises would be the most effective foreign policy the US could run,” continued the same investor. Forget about the South China Sea, don’t bother with more aircraft carriers, just let Beijing try to cope with their financial system. “And we’re 80% of the way there – we instigated a trade war, implemented a massive fiscal stimulus, which created the room to raise interest rates,” he said. “The combined policy mix makes capital want to leave at the same time it makes the dollar more attractive and effectively shuts down new investment inflows to China.”
Kudlow’s conclusion: China “better not underestimate President Trump’s determination to follow through” on trade threats, and we are confident that it is only a matter of time before Trump tweets his angry response to China’s latest retaliation to Trump’s own Chinese tariffs, pushing the tit-for-tat escalation further beyond a point of no return.
end
Zero hedge again talks about this morning’s currency invention causing yuan shorts to cry uncle.
(courtesy zerohedge)
China Blinks: Why Beijing’s Currency Intervention Is Doomed To Failure
The People’s Bank of China today announced a re-introduction of reserve requirements on FX forwards trading which it had eliminated last September just after the Yuan soared against the dollar – a move aimed at taking pressure off the renminbi as the USDCNY rapidly closed in on 7.00. However, as ING’s Chris Turner writes, this looks only a temporary reprieve for the renminbi as all prior PBoC attempts to stem CNY weakness haven’t been all that successful in reversing a trend.

Reserve requirements back in play
Since 2015 the PBOC has used reserve requirements on FX forward transactions as a tool to control ‘macro-financial risks’. The measure puts a 20% required reserve ratio for financial institutions when conducting onshore CNY forwards business on behalf of customers. The move makes it effectively costlier for the market to fund short CNY positions through the forwards market.
This measure was first used for domestic financial institutions in October 2015 and then broadened to include foreign institutions in July 2016 when USD/CNY was pushing above 6.70. These reserve requirements were scrapped when USD/CNY was dipping below 6.50 in September 2017 amidst broad dollar weakness.
Prior PBoC attempts to stem CNY weakness haven’t been all that successful

ING, Bloomberg
Why now?
It seems pretty clear that these measures have been introduced to trigger a squeeze in short CNY positions and keep USD/CNY away from 7.00. This reserve requirement is a relatively soft measure and avoids the bigger stick of FX intervention or rate hikes at a time policymakers are delicately deleveraging the economy.
We also think Chinese policymakers had a bad experience when USD/CNY was last trading near 7.00 in late 2016. Investors struggled to digest the message at the time that the renminbi was stable versus the basket and that the move to 7.00 was all about the dollar. That message will be so much harder to deliver today given the 6% decline in the renminbi against its trading basket since late June and the uncertainty over whether this is a market-led decline or the PBOC is using the renminbi as a weapon in the current trade war.
Temporary reprieve
USD/CNH has sold off 1% on today’s (Friday) news, but we doubt investors will be encouraged to return to Renminbi exposure anytime soon.

US Commerce Secretary Wilbur Ross has made the US trade position clear by outlining that Washington wants to create a situation where it’s more painful for China to continue current practices than it is for China to reform.
An increase in the proposed tariff rate to 25% on the next $200bn worth of Chinese imports looks likely over coming weeks. And combined with firm US rates and what look like continued dollar strength over coming months, it looks as though the PBOC will be forced to use more of its currency toolkit to prevent USD/CNY going through 7.00.
end
4. EUROPEAN AFFAIRS
EU/USA/Kidney Beans
Just take a look at the mess tariffs are creating in the kidney bean market. The 25% tariffs is making USA kidney beans unaffordable in Europe. Juncker is a liar: there has been no agreement whatsoever in a deal with the EU to reduce their tariffs on USA goods
(courtesy Mish Shedlock/Mishtalk)
6 .GLOBAL ISSUES
8. EMERGING MARKET
Your early morning currency/gold and silver pricing/Asian and European bourse movements/ and interest rate settings FRIDAY morning 7:00 am
Euro/USA 1.1598 UP .0013/ REACTING TO MERKEL’S FAILED COALITION/ REACTING TO +GERMAN ELECTION WHERE ALT RIGHT PARTY ENTERS THE BUNDESTAG/ huge Deutsche bank problems + USA election:///ITALIAN CHAOS /AND NOW ECB TAPERING BOND PURCHASES/JAPAN TAPERING BOND PURCHASES /USA RISING INTEREST RATES /FLOODING/EUROPE BOURSES ALL IN THE GREEN
USA/JAPAN YEN 111.59 DOWN 0.108 (Abe’s new negative interest rate (NIRP), a total DISASTER/NOW TARGETS INTEREST RATE AT .11% AS IT WILL BUY UNLIMITED BONDS TO GETS TO THAT LEVEL
GBP/USA 1.3037 UP 0.0020 (Brexit March 29/ 2017/ARTICLE 50 SIGNED/BREXIT FEES WILL BE CAPPED
USA/CAN 1.2979 DOWN .0026 (CANADA WORRIED ABOUT TRADE WITH THE USA WITH TRUMP ELECTION/ITALIAN EXIT AND GREXIT FROM EU/(TRUMP INITIATES LUMBER TARIFFS ON CANADA/CANADA HAS A HUGE HOUSEHOLD DEBT/GDP PROBLEM)
Early THIS FRIDAY morning in Europe, the Euro FELL by 46 basis points, trading now ABOVE the important 1.08 level FALLING to 1.1617; / Last night Shanghai composite CLOSED DOWN 27.58 POINTS OR 1.00% /Hang Sang CLOSED DOWN 38.24 POINTS OR 0.14% /AUSTRALIA CLOSED DOWN 0.02% / EUROPEAN BOURSES ALL GREEN
The NIKKEI: this FRIDAY morning CLOSED UP 12.65 POINTS OR 0.06%
Trading from Europe and Asia
1/EUROPE OPENED ALL GREEN/
2/ CHINESE BOURSES / :Hang Sang DOWN 38,24 POINTS OR 0.14% /SHANGHAI CLOSED DOWN 27.58 POINTS OR 1.00%
Australia BOURSE CLOSED DOWN 0.02%
Nikkei (Japan) CLOSED UP 12.65 POINTS OR 0.06%
INDIA’S SENSEX IN THE GREEN
Gold very early morning trading: 1210.60
silver:$15.40
Early FRIDAY morning USA 10 year bond yield: 2.98% !!! DOWN 0 IN POINTS from THURSDAY night in basis points and it is trading WELL ABOVE resistance at 2.27-2.32%. (POLICY FED ERROR)/
The 30 yr bond yield 3.11 DOWN 0 IN BASIS POINTS from THURSDAY night. (POLICY FED ERROR)/
USA dollar index early FRIDAY morning: 95.20 UP 3 CENT(S) from THURSDAY’s close.
This ends early morning numbers FRIDAY MORNING
xxxxxxxxxxxxxxxxxxxxxxxxxxxxxxxxxxxxxxxxxxxxxxxxxxxxxxxxxxxxxxxxxxxxxxxxxxxxxxxxxxxxxxxxxxxxxxxxxxxxxxxxxxxxxxx
And now your closing FRIDAY NUMBERS \1: 00 PM
Portuguese 10 year bond yield: 1.782% DOWN 1 in basis point(s) yield from THURSDAY/
JAPANESE BOND YIELD: +.11`% DOWN 2 BASIS POINTS from THURSDAY/JAPAN losing control of its yield curve/EXTREMELY VOLATILE YESTERDAY
SPANISH 10 YR BOND YIELD: 1.4220% DOWN 4 IN basis point yield from THURSDAY/
ITALIAN 10 YR BOND YIELD: 2.927 UP 2 POINTS in basis point yield from THURSDAY/
the Italian 10 yr bond yield is trading 151 points HIGHER than Spain.
GERMAN 10 YR BOND YIELD:FALLS TO +.409% IN BASIS POINTS ON THE DAY
END
IMPORTANT CURRENCY CLOSES FOR FRIDAY
Closing currency crosses for FRIDAY night/USA DOLLAR INDEX/USA 10 YR BOND YIELD/1:00 PM
Euro/USA 1.1600 UP .0015(Euro UP 15 Basis points/ represents to DRAGHI A COMPLETE POLICY FAILURE/
USA/Japan: 111.14 DOWN 0.588 Yen UP 59 basis points/
Great Britain/USA 1.3022 UP .0007( POUND UP 7 BASIS POINTS)
USA/Canada 1.2978 Canadian dollar UP 46 Basis points AS OIL FELL TO $68.12
xxxxxxxxxxxxxxxxxxxxxxxxxxxxxxxxxxxxxxxxxxxxxxxxxxxxxxxxxxxxxxxxxxxxxxxxxxxxxxxx
This afternoon, the Euro was UP 15 to trade at 1.1600
The Yen ROSE to 111.14 for a GAIN of 59 Basis points as NIRP is STILL a big failure for the Japanese central bank/HELICOPTER MONEY IS NOW DELAYED/BANK OF JAPAN NOW WORRIED AS AS THEY ARE RUNNING OUT OF BONDS TO BUY AS BOND YIELDS RISE
The POUND GAINED 7 basis points, trading at 1.3022/
The Canadian dollar GAINED 46 basis points to 1.2978./ WITH WTI OIL FALLING TO 68.12
The USA/Yuan closed AT 6.8270 ON SHORE (UP)
THE USA/YUAN OFFSHORE: 6.8449 (up)
the 10 yr Japanese bond yield closed at +.11% DOWN 2 FULL BASIS POINTS FROM YESTERDAY
Your closing 10 yr USA bond yield DOWN 3 IN basis points from THURSDAY at 2.954 % //trading well ABOVE the resistance level of 2.27-2.32%) very problematic USA 30 yr bond yield: 3.099 DOWN 2 in basis points on the day /
THE RISE IN BOTH THE 10 YR AND THE 30 YR ARE VERY PROBLEMATIC FOR VALUATIONS
Your closing USA dollar index, 95.03 DOWN 14 CENT(S) ON THE DAY/1.00 PM/
Your closing bourses for Europe and the Dow along with the USA dollar index closing and interest rates for FRIDAY: 1:00 PM
London: CLOSED UP 83.17 POINTS OR 1.10%
German Dax :CLOSED UP 69.43 OR 0.55%
Paris Cac CLOSED UP 18.00 POINTS OR 0.33%
Spain IBEX CLOSED UP 41.60 POINTS OR 0.43%
Italian MIB: CLOSED UP 172.13 POINTS OR 0.80%
The Dow closed UP 136.42 POINTS OR 0.54%
NASDAQ closed UP 9.32 points or 0.12% 4.00 PM EST (MAINLY APPLE)
WTI Oil price; 68.12 1:00 pm;
Brent Oil: 72.77 1:00 EST
USA /RUSSIAN ROUBLE CROSS: 63.37 DOWN 14/100 ROUBLES/DOLLAR (ROUBLE HIGHER BY 14 BASIS PTS)
TODAY THE GERMAN YIELD FALLS TO +.409% FOR THE 10 YR BOND 1.00 PM EST EST
END
This ends the stock indices, oil price, currency crosses and interest rate closes for today 4:30 PM
Closing Price for Oil, 4:00 pm/and 10 year USA interest rate:
WTI CRUDE OIL PRICE 4:30 PM:$68.57
BRENT: $73.28
USA 10 YR BOND YIELD: 2.95%
USA 30 YR BOND YIELD: 3.09%/
EURO/USA DOLLAR CROSS: 1.1569 DOWN .0017 ( DOWN 17 BASIS POINTS)
USA/JAPANESE YEN:111.26 DOWN 0.442 (YEN UP 44 BASIS POINT/ .
USA DOLLAR INDEX: 95.18 UP 1 cent(s)/
The British pound at 5 pm: Great Britain Pound/USA: 1.3002 DOWN 14 POINTS FROM YESTERDAY
Canadian dollar: 1.2990 DOWN 34 BASIS pts
USA/CHINESE YUAN (CNY) : 6.8270 (ONSHORE)
USA/CHINESE YUAN(CNH): 6.8489 (OFFSHORE)
German 10 yr bond yield at 5 pm: ,0.409%
VOLATILITY INDEX: 11.67 CLOSED DOWN 0.52
LIBOR 3 MONTH DURATION: 2.340% .LIBOR RATES ARE RISING
And now your more important USA stories which will influence the price of gold/silver
TRADING IN GRAPH FORM FOR THE DAY
l
Stocks, Bonds, Dollar Gain As US Macro Plunges
To 11-Month Lows
Everything was going so great – Apple etc… – and then China ruined the party and payrolls disappointed…
An ugly week for US macro data (tumbling to its most disappointing in 11 months) did nothing to stall hopes for economic growth…

Or faith in the US plunge protection team…

And, despite today’s spike, yuan ended lower for the 8th week in a row (and 14th of the last 16 weeks) as China-US trade tensions escalated further…

As Chinese stock cratered…

European stocks were unhappy too…

But USA USA USA was positive – even The Dow managed to get back to ‘even’… as Trannies outperformed…

It seems ‘Murica is winning the trade war – or the equity algos are anyway…

VIX closed the week with an 11 handle – because there’s nothing to fear but fear itself (oh and currency-, trade-, and potential kinetic-war)…

AAPL managed to hold on to its trillion-dollar market cap…

Big week for TSLA as it squeezed higher again… but bonds faded today…

Nasdaq bounced perfectly off its 50DMA…

FANG Stocks ended the week lower (despite Nasdaq gains)…

Treasury yields were broadly lower on the week (thanks to a heavy bid today) but 30Y ended higher (in yield)…

The yield curve steepened on the week

10Y briefly topped 3.00% (China?) early in the week, before pushing back lower (note the same level on Fed day in June)… so now do we plunge back to the other end of the range?

Remember, bond positioning has never been more short.

The Dollar ended the week higher, but found resistance in the middle of ECB-day spike range…

Turkish Lira was the week’s biggest loser, puking above 5.00/USD for the first time ever…

Cryptos were ugly all week… just leg down after leg down…

Worst week for Bitcoin in two months, back below $8,000…

Ethereum found support relative to Bitcoin once again at the 2017 year-end close…

Commodities rallied today but ended the week lower overall…

Finally, we note that China’s stock market capitalization has slumped to its lowest relative to the world since 2014 and a critical point of support/resistance…

Does this mean Trump is winning?
MARKET TRADING
Market DATA
Payrolls Miss: Only 157K Jobs Added In July As Hourly Earnings Come In Line
As per the earlier preview, there were virtually no potential downsides to today’s jobs report (with a possible adverse exception of tariffs), and as so often happens, moments ago the BLS reported that July payrolls missed “bigly”, rising just 157K, missing expectations of 193K, and the lowest monthly print since March. The 157K July jobs is well below the average monthly gain of 203,000 over the prior 12 months.

This was the biggest miss to expectations since October.

There is one potential culprit for the miss: the bankruptcy of Toys’R’Us: as SouthBay Research notes, jobs lost from the bankrupt retailer dragged payrolls lower by 31k.
Offsetting the poor July print was the sharp upward revision to the June number which rose from 202K to 234K. The change in total nonfarm payroll employment for May was revised up from +244,000 to +268,000, and the change for June was revised up from +213,000 to +248,000. With these revisions, employment gains in May and June combined were 59,000 more than previously reported.
The unemployment rate dipped from last month’s 4.0%, to print where consensus expected it would, at 3.9%

One reason why the market will likely ignore the poor print, however, is that average hourly earnings rose 0.3% in July, in line with expectations, while on an annual basis hourly earnings rose 2.7%, the same as June and also in line with the expected.

Another potentially troubling number is that the average workweek for all employees on private nonfarm payrolls decreased by 0.1 hour to 34.5 hours in July, following an increase of 0.1 hour in June. However, the average workweek for production and nonsupervisory employees on private nonfarm payrolls remained at 33.8 hours.
Digging into the numbers, there was distinct strength in energy jobs, with oil and gas extraction payrolls rose 7,500 from a year earlier. Gasoline stations payrolls rose 100 in July after rising 500 in June. Pipeline transport payrolls fell 200 in July after rising 300 in June. Petroleum and coal payrolls rose 800 in July after rising 200 in June
Bloomberg notes that while 12K employees said they could not work due to bad weather, the historical average for July is 31k employees; Meanwhile, another 104k workers who usually work full-time could only work part-time due to the weather last month.
* * *
Breaking down the job additions:
- Employment in professional and business services increased by 51,000 in July and has risen by 518,000 over the year. Over the month, employment edged up in temporary help services (+28,000) and in computer systems design and related services (+8,000).
- Manufacturing added 37,000 jobs in July, with most of the gain in the durable goods component. Employment rose in transportation equipment (+13,000), machinery (+6,000), and electronic instruments (+2,000). Over the past 12 months, manufacturing has added 327,000 jobs.
- In July, employment in health care and social assistance rose by 34,000. Health care employment continued to trend up over the month (+17,000) and has increased by 286,000 over the year. Hospitals added 7,000 jobs over the month. Within social assistance, individual and family services added 16,000 jobs in July and 77,000 jobs over the year.
- Employment in food services and drinking places continued to trend up over the month (+26,000). Over the year, the industry has added 203,000 jobs.
- Construction employment continued to trend up in July (+19,000) and has increased by 308,000 over the year.
- In July, employment in retail trade changed little (+7,000). Job gains occurred in general merchandise stores (+14,000), clothing and clothing accessories stores (+10,000), and food and beverage stores (+8,000). These employment gains were offset by a decline of 32,000 in sporting goods, hobby, book, and music stores, reflecting job losses in hobby, toy, and game stores.
END
special thanks to Gijsbert Groenewegen for sending this to us
G’s comment to me is accurate:

end
Two reasons for the job losses:
1. the bankruptcy of Toys R Us
2. teachers for the summer recess.
9(courtesy zerohedge)
Here Are The Two Things That Dragged Down Today’s
Jobs Report
Printing at 157K (170K private), the July jobs report was a disappointment to the expected 193K number, even if the unemployment rate dipped slightly, and nominal (if not real) hourly earnings came in line and unchanged from last month.
However, according to SouthBay Research the reason wasn’t broad-based weakness, but rather there were two very specific reasons for today’s jobs weakness:
The liquidation of Toys “R” Us contributed some 31K jobs to decline. The chart below shows the sharp drop in the “Retail Trade: Sporting Goods, Hobby, Book, and Music Stores” category.

Separately, School Vacation timing resulted in another 40K jobs lost.
As Southbay also notes, excluding these two categories, there was Broad Consumer Strength:
- Retail: +39K before ToysRUs layoffs
- Leisure & Hospitality: +40K
- Education layoffs: School layoff timing hits payrolls -40K: Bus Drivers (-15K) and Education (-11K) and Local Government Education (-14K)
Meanwhile, the big drivers for job growth were all there:
- Construction: +19K
- Manufacturing: +37K
- Professional Services: +51K
- Healthcare: +34K
A more detailed breakdown of jobs additions follow.
end
A very important commentary on the real story behind average hourly earnings turning negative. This has the effect of adding higher labour costs to production and it causes real earning to slump as in the case of the Cheesecake Factory earnings
(courtesy zerohedge)
Americans’ Real Earnings Slump Most Since 2012 In
July
But, but, but… there’s no slack in the labor force, we’re at maximum employment, this is the best economy ever?
For four years, Americans have hoped for ‘more’ – specifically higher household incomes – and that hope has accelerated since President Trump’s election. Today, we got yet another confirmation that hope is not a strategy as real average hourly earnings turned negative year-over-year…

In fact this is the weakest YoY shift in real average hourly earnings since October 2012…

All of which is rather paradoxical given that just this week, Cheesecake Factory stock crashed after its earnings collapsed due to soaring labor costs.
US Multiple Jobholders Soar By 453,000; Highest Since 1999
One of the recurring complaints about the job market – at least from the perspective of employers – has been the scarcity of workers, with the number of job openings now greater than the number of unemployed Americans (although a big question here that has so far been unanswered is why don’t employers simply raise wages to find more appropriate candidates than hiring convicts and drug addicts).
Meanwhile, the picture from the perspective of workers is quite different, and while today’s jobs report was overall solid when one excludes the Toys “R” Us liquidation and the layoffs associated with school vacations, there was one number that stood out: the surging number of multiple job holders.
According to the latest payrolls report, in July, the number of Americans holding multiple jobs soared by 453,000, the second highest on record, and only lower than the 487,000 multiple jobholder increase in October 2014. As a result, the total number of multiple jobholders in the US spiked to 8.072 million, surpassing the recession high of 8.071 million hit in August 2008, and the highest all the way back to 1999.

There was offsetting good news, as the number of full-time workers jumping by 453K in July, while part-time workers declined by 36,000.

And yet, by far the worst news in today’s report was that despite the 2.7% nominal increase in average hourly earnings, when netting out the 2.9% increase in inflation, real wages declined by 0.2%, which was the biggest monthly drop in average hourly earning going back to 2012. This may explain why US car sales just posted their worst decline in years and why increasingly more sectors have been complaining about sluggish spending by the US consumer.

It’s Not All Good: Here Is The Real Problem Deep Inside The Jobs Report
On the surface, today’s jobs report was solid: despite the headline miss, July payrolls were in line with expectations when one strips out Toys “R” Us job losses and the volatile summer vacation-linked occupations. Wages also came in line, rising at 2.7% Y/Y (a number which however was the most negative since 2012 when adjusted for inflation).
However, looking deeper between the lines reveals a potentially troubling problem.
Consistent with historical experience however, the breakdown in job creation by wage has evolved throughout the expansion. At first, more of the new jobs are for people with skills. As the cycle matures, job creation rotates in favor of lower-wage positions. Lower-wage workers are more easily replaced and have less bargaining power, so benefits from the economic expansion do not trickle down until the labor market is especially tight.
What this means in practical terms – as DB’s Torsten Slok explains – is that over the last three years, i.e. during the later stage of the current expansion, cumulative low-wage employment has risen by 104%, outperforming the high-wage segment which increased by only 64% over the same period. In the three years preceding that, high-wage jobs were created at a much higher rate, increasing 251% compared to only 28% for low-wage jobs.
And, as shown in the chart below, this means that high wage jobs have actually been declining throughout 2018 as employers have shifted their hiring to low-wage occupations, and replacing existing highly-paid workers with less productive, but cheaper, surrogates.

This has significant consequences for wage growth: the greater the portion of low wage jobs as a percentage of total, the more subdued overall hourly earnings growth will be. Which is precisely the phenomenon we have observed in recent years, and is what has stumped the Fed for which wage inflation has repeatedly been defined as a “mystery.”
There is another major problem: in their pursuit of semi-skilled workers, and low wage employment in general, potential employers have aggressively lowered their selection criteria. As a result, according to the BLS, over the past 3 months the vast majority of the total workers hired, some 1.1 million, are high school graduates or those without a high school diploma.
What about workers with some college degree or higher? Here the US economy has actually lost 233K workers!

Pink Floyd was right: American workers indeed no longer need any education.
Alas, there are extensive negative consequences of hiring workers who have – at best – graduated from high school. First and foremost, a chronic lack of productivity, which incidentally is also the key reason why this has been the slowest economic expansion in US history. And as the latest data reveals, the recent surge in hiring of less than college grads, confirms two things: wage growth will remain anemic at best, and productivity – that key component of GDP – will continue to shrink.
US Services Economy Slumps In July As ‘Hope’ Hits 6-Month Lows
Following yesterday’s disappointment in manufacturing data, Markit’s latest survey confirms the Services industry slowed in July as higher prices are hurting margins and business expectations hit a 6-month lows. Worse still, ISM’s Services survey tumbled with a big miss to its worst since Aug 2017.

Business confidence eased to a six-month low and was subdued in the context of the series history, with some service providers raising concerns surrounding tariffs and their effects on client demand.
Additionally, Market notes that Employment growth eased to a five-month low, with the rise in staffing numbers tempered by difficulties finding suitable candidates for vacancies.

ISM’s Survey breakdown confirms Markit’s view for once with new orders crashing by 6.2pts to 57 – its biggest drop since Aug 2016… and worse still, the stagflationary threat remains as prices paid kept rising despite weaker sales.

As Bloomberg notes, the slump in the gauge of service providers — which accounts for about 90 percent of the economy — is a reminder that U.S. growth will be hard-pressed to sustain the second-quarter pace that was the fastest since 2014.
Commenting on the PMI data, Tim Moore, Associate Director at IHS Markit said:
“US service providers experienced strong growth conditions at the start of the third quarter, with business activity rising at only a slightly softer pace than in June. Strong domestic demand helped to support another improvement in new order levels and a solid expansion of payroll numbers in July.
“However, business expectations across the service economy edged down to a six-month low.Survey respondents cited concerns about rising costs and trade frictions, alongside difficulties sustaining the tempo of new business growth seen in the second quarter of 2018.
”Rising operating expenses continued to place pressure on margins in the service economy, partly reflecting higher wages and fuel bills in July. There were signs that higher input costs have started to shift through to consumers, as service providers recorded the fastest increase in their average prices charged since September 2014.”
At 55.7 in July, the final seasonally adjusted IHS Markit U.S. Composite PMI™ Output Index dipped slightly from 56.2 in June. Despite the rate of expansion easing to a three-month low, it remained strong in the context of the series history…

Maybe the impact of the housing market is starting to hit the surveys…

USA ECONOMIC /GENERAL STORIES
A good look at how student debt is hitting pretty hard in the following 10 USA states
(courtesy zerohedge)
The Student Debt Crisis Is Hitting These Ten
States The Hardest
The student debt crisis in America continues to expand. According to the latest figures from the New York Federal Reserve, the total Student Loans Owned and Securitized, Outstanding (SLOAS) grew to over $1.52 trillion in July. Although the debt crisis affects millions of Americans, the debt is not spread evenly across the country, as millennials in some states are much more likely to be weighed down by student loans.

A new study by personal finance website GOBankingRates revealed that graduates in the northeastern states have the heaviest financial burdens. Of these states, millennials in New Hampshire have outstanding student loans around $36,367 — that is the highest rate in the country, according to the Institute for College Access and Success’s 12th Annual Student Debt report.

Geographically, GOBankingRates noticed an alarming trend of northeastern states made the top ten list for highest average debt and highest percentage of graduates with debt. As shown below, New Hampshire and Pennsylvania made the list while Connecticut, Maine, Massachusetts and Rhode Island were among the highest for average debt.
States With the Highest Average Student Debt
- New Hampshire Average student loan debt: $36,367 Percent of graduates with debt: 74%
- Pennsylvania Average student loan debt: Percent of graduates with debt: 68%
- Connecticut Average student loan debt: $35,494 Percent of graduates with debt: 60%
- Delaware Average student loan debt: $33,838 Percent of graduates with debt: 63%
- Minnesota Average student loan debt: $31,915 Percent of graduates with debt: 68%
- Massachusetts Average student loan debt: $31,563 Percent of graduates with debt: 60%
- South Dakota Average student loan debt: $31,362 Percent of graduates with debt: 75%
- Maine Average student loan debt: $31,295 Percent of graduates with debt: 55%
- Alabama Average student loan debt: $31,275 Percent of graduates with debt: 50%
- Rhode Island Average student loan debt: $31,217 Percent of graduates with debt: 61%
It makes sense that the Northeast states are carrying higher student loan debt, according to Adam Minksy a lawyer specializing in student loan law. “Certain states have less robust, affordable state education systems,” Minsky tells CNBC.
States like California and Florida have major state universities systems that are affordable, so many millennials chose those institutions with the least amount of debt, Minsky added.
GOBankingRates also noticed states like Utah, New Mexico, and California had the lowest percentage of graduates with debt at just 43 percent and the lowest average debt around $20,000. In fact, the states with the second- and third-lowest percentages of graduates with debt, Wyoming and Arizona, were also both among the ten states with the lowest debt.
As a slowdown in the economy nears, high school graduates and their families are starting to discover that the debt ball and chain via student loans is not a winning strategy when it comes to picking a college. “I was told by everyone to go to the best school you can get into, even if it’s more expensive, it will be a good investment,” Minsky says. “Now we’re starting to see a shift toward making responsible financial choices about college.”
* * *
Heavily indebted millennials might have a shot at paying off their student debt via a new game show on TruTV called “Paid Off.” Contestants must have lots of student loans and could have the chance to answer trivia questions – and if they win, the game show will pay off their student debt.
Harley-Davidson Begins Kansas Plant Shutdown As
Production Shifts To Thailand
Harley Davidson has begun shutting down its Kansas City north motorcycle plant as the firm shifts production to Thailand to avoid stiff EU tariffs in response to steel and aluminum tariffs imposed by the Trump administration.

Around 180 workers will clock out for the last time at the Kansas factory which has operated for over two decades, while additional staff will remain until next year to continue making motorcycles until the facility is completely closed. Meanwhile, the motorcycle builder will also shift the manufacture of three models currently made in Kansas City to their state-of-the art factory in Pennsylvania.

In total, 800 Kansas City employees will lose their jobs, while their York, PA factory will gain 450 workers.
In response to Harley’s move, President Trump in June called it “the beginning of the end” for the company, and blamed the motorcycle company for “waving the white flag” by using the trade war as an excuse to move production.

Donald J. Trump
✔@realDonaldTrump
Surprised that Harley-Davidson, of all companies, would be the first to wave the White Flag. I fought hard for them and ultimately they will not pay tariffs selling into the E.U., which has hurt us badly on trade, down $151 Billion. Taxes just a Harley excuse – be patient! #MAGA
Donald J. Trump
✔@realDonaldTrump
A Harley-Davidson should never be built in another country-never! Their employees and customers are already very angry at them. If they move, watch, it will be the beginning of the end – they surrendered, they quit! The Aura will be gone and they will be taxed like never before!
Trump then warned the company that it would pay a big tax to sell back into the US: “when I had Harley-Davidson officials over to the White House, I chided them about tariffs in other countries, like India, being too high. Companies are now coming back to America. Harley must know that they won’t be able to sell back into U.S. without paying a big tax!”
Donald J. Trump
✔@realDonaldTrump
….When I had Harley-Davidson officials over to the White House, I chided them about tariffs in other countries, like India, being too high. Companies are now coming back to America. Harley must know that they won’t be able to sell back into U.S. without paying a big tax!
In the same series of Tweets, Trump also said that the US is “getting other countries to reduce and eliminate tariffs and trade barriers that have been unfairly used for years against our farmers, workers and companies. We are opening up closed markets and expanding our footprint. They must play fair or they will pay tariffs!”
Donald J. Trump
✔@realDonaldTrump
….We are getting other countries to reduce and eliminate tariffs and trade barriers that have been unfairly used for years against our farmers, workers and companies. We are opening up closed markets and expanding our footprint. They must play fair or they will pay tariffs!
The workers are with Trump

Even after Harley Davidson became the first American company “to wave the white flag” and announce, in an 8-K filing, that it planned to move some production offshore, the workers at the Harley Davidson plant in Menomonee Falls, Wisconsin stood by their president even though the Financial Times reports that “they could end up as collateral damage.”
Mark, another Harley worker sitting astride his motorbike during the afternoon shift change at this plant that employs about 1,000 workers, said: “I think Harley is just using it as an excuse” to move more production overseas, after a recent decision to close the company’s Kansas City plant. “They will just blame it on Trump.” –FT
What’s more, several workers agreed with President Trump’s assessment that the company’s decision to move production is “just a Harley excuse.”

Mark, another Harley worker sitting astride his motorbike during the afternoon shift change at this plant that employs about 1,000 workers, said: “I think Harley is just using it as an excuse” to move more production overseas, after a recent decision to close the company’s Kansas City plant. “They will just blame it on Trump.”
Asked by the FT whether they blame Trump for Harley’s offshoring decision, most workers said they only blamed the EU, and that, regardless of the fallout, it wouldn’t change their vote. “The president was just trying to save the US aluminum and steel industry,” one said approvingly.
Harley-Davidson said on Monday that it maintained a “strong commitment to US-based manufacturing,” but that its facilities in India, Brazil and Thailand would increase production to avoid paying the EU tariffs that would have cost it as much as $100m.
When asked whether the latest news could make him vote against Mr Trump if he runs for a second term in 2020, one worker, who gave his name only as Tod, replied: “No, I don’t think so. It’s going to take a little bit more than that. He’s doing good things. We’ll just have to see who runs on the other side, that might change my vote.”
Workers at the Harley plant also expressed optimism that they would be able to find another job if they were laid off, largely because the US economy is booming. “He’s making changes, trying to get the country back where it needs to be,” one worker told the FT. And how he does it may matter less than the idea that he’s trying to “Make America Great Again.”
US trade deficit widens by $46.3 billion in June
By PAUL WISEMAN | Associated Press
WASHINGTON – The U.S. trade deficit widened in June for the first time in four months as exports fell and imports grew. Politically sensitive trade gaps with China, Mexico and Canada all increased.
The Commerce Department says the deficit in goods and services — the gap between what the US sells and what it buys in foreign markets — rose 7.3 percent to $46.3 billion in June from $43.2 billion in May. U.S. exports slid 0.7 percent to $213.8 billion; imports rose 0.6 percent to $260.2 billion.
In the first half of the year, the United States has registered a trade deficit of $291.2 billion, up 7.2 percent from January-June 2017.
SWAMP STORIES
end
Let us close out the week with this offering courtesy of Greg Hunter of USAWatchdog
(courtesy Greg Hunter/USAWatchdog)
Trump Coup MSM Ignores, Trump Branding MSM Fake News, Tommy Robinson Free
By Greg Hunter On August 3, 2018 In Weekly News Wrap-Ups
By Greg Hunter’s USAWatchdog.com (WNW 346 8.3.18)
The mainstream media (MSM) refuses to acknowledge the fact the FBI and DOJ used phony research paid for by Hillary Clinton and the DNC to get warrants to spy on Donald Trump and his Administration. It refuses to report there is not one single piece of evidence linking Trump to the Russians, let alone that the entire Mueller investigation was started on totally false pretenses. It ignores former Director of National Intelligence, James Clapper, who came out recently on CNN and essentially blamed the failed coup to stop Trump and remove him from office on his former boss President Obama. The MSM has turned into fake news.
The MSM is upset that Donald Trump has branded them “Fake News” or, in the case of CNN, “Very Fake News.” Trump is also branding them “The Enemy of the People.” The MSM says they are worried about violence against reporters, but I think they are worried about declining revenue and falling ratings. Trump is branding them fake news, and the MSM is destroying itself with lies, lies by omission and false narratives. Donald Trump is simply pointing that out as he fights back against bias reporting of the MSM that is set out to destroy him and not inform the public.
Free speech activist Tommy Robinson is free from his 13 month jail sentence. Robinson was charged, tried and convicted on the same day in the UK. Robinson was pointing out gang rape and pedophilia of the radical Muslim community in England when he was arrested. The top judge there overturned the conviction and offered the lower court a severe beatdown for how it handled the Robinson case. This is good news for those who love free speech and freedom.
Join Greg Hunter as he talks about these stories and more in the Weekly News Wrap-Up.
(This post talks about the MSM ignoring a failed coup of Donald Trump, fake news of the MSM, and the release of Tommy Robinson in the UK.)
After the Wrap-Up:
Dr. Dave Janda from the popular radio show “Operation Freedom” will be the guest for the Early Sunday Release.
Video Link
https://usawatchdog.com/trump-coup-msm-ignores- trump-branding-msm-fake-news-tommy-robinson-free/
end
WE WILL SEE YOU ON MONDAY NIGHT.
HARVEY


The rest of the story on China devaluation & tariffs.
The introduction of 10% tariffs on a range of Chinese products has lead to a near 10% rise in USD/CNY—or put another way, a 10% devaluation of the yuan.
Everybody is saying that these balance out and goods from China cost the same. That’s true for the 20% of Chinese imports that have tariffs on them. The other 80% of Chinese imports WITHOUT tariffs now sell at a 10% discount! Bulk up! Everything’s on sale!
US trade deficit widens by $46.3 billion in June
LikeLike