
April 20, 2022 · by harveyorgan · in Uncategorized · Leave a comment·Edit
april20, 2022 · by harveyorgan · in Uncategorized · Leave a comment·Edit
GOLD; $1953.20 DOWN 3.05
SILVER: $25.14 DOWN $0.15
ACCESS MARKET: GOLD $1957.65
SILVER: $25.19
Bitcoin morning price: $42,127 UP 645
Bitcoin: afternoon price: $41,053 DOWN 429
Platinum price: closing DOWN $28.10 to $989.65
Palladium price; closing UP 35.70 at $269.85
END
DONATE
Click here if you wish to send a donation. I sincerely appreciate it as this site takes a lot of preparation
comex notices/
: JPMorgan stopped/total issued 46/135
NUMBER OF NOTICES FILED TODAY FOR APRIL. CONTRACT 135 NOTICE(S) FOR 13,500 OZ (0.4199 TONNES)
total notices so far: 25,345 contracts for 2,534,500 oz (78.833 tonnes)
SILVER NOTICES:
80 NOTICE(S) FILED 400,000 OZ/
total number of notices filed so far this month 1279 : for 6,395,000 oz
END
Russia is a major supplier of silver to London while Mexico supplies the COMEX
With the sanctions, London has no way to obtain silver other than compete with NY.
END
GLD
WITH GOLD DOWN $3.05
WITH RESPECT TO GLD WITHDRAWALS: (OVER THE PAST FEW MONTHS):
GOLD IS “RETURNED” TO THE BANK OF ENGLAND WHEN CALLING IN THEIR LEASES: THE GOLD NEVER LEAVES THE BANK OF ENGLAND IN THE FIRST PLACE. THE BANK IS PROTECTING ITSELF IN CASE OF COMMERCIAL FAILURE
ALSO INVESTORS SWITCHING TO SPROTT PHYSICAL (phys) INSTEAD OF THE FRAUDULENT GLD//
A HUGE CHANGE IN GOLD INVENTORY AT THE GLD A HUGE DEPOSIT OF 6.36 TONNES INTO THE GLD//
INVENTORY RESTS AT 1106.74 TONNES
Silver//SLV
WITH NO SILVER AROUND AND SILVER DOWN 15 CENTS
AT THE SLV// A HUGE CHANGES IN SILVER INVENTORY AT THE SLV: A WHOPPING DEPOSIT OF 2.955 MILLION OF INTO THE SLV//
INVESTORS ARE SWITCHING SLV TO SPROTT’S PSLV
CLOSING INVENTORY: 577.941 MILLION OZ
Let us have a look at the data for today
SILVER//OUTLINE
SILVER COMEX OI ROSE BY A STRONG SIZED 828 CONTRACTS TO 170,577 AND CLOSER TO THE NEW RECORD OF 244,710, SET FEB 25/2020 AND THE STRONG GAIN IN OI WAS ACCOMPLISHED DESPITE OUR HUGE $0.62 LOSS IN SILVER PRICING AT THE COMEX ON TUESDAY. OUR BANKERS WERE SUCCESSFUL IN KNOCKING THE PRICE OF SILVER DOWN (IT FELL BY $0.62) BUT WERE UNSUCCESSFUL IN KNOCKING OUT ANY SILVER LONGS AS WE HAD A STRONG GAIN OF 1678 CONTRACTS ON OUR TWO EXCHANGES
WE MUST HAVE HAD:
I) HUGE BANKER SHORT COVERING AS THEY ARE VERY ANXIOUS TO GET OUT OF DODGE!!/. II)WE ALSO HAD SOME REDDIT RAPTOR BUYING//. iii) A STRONG ISSUANCE OF EXCHANGE FOR PHYSICALS iiii) A STRONG INITIAL SILVER STANDING FOR COMEX SILVER MEASURING AT 4.305 MILLION OZ FOLLOWED BY TODAY’S QUEUE. JUMP OF 110,000 OZ//NEW STANDING: 6.410 MILLION OZ// V) HUGE SIZED COMEX OI GAIN/
I AM NOW RECORDING THE DIFFERENTIAL IN OI FROM PRELIMINARY TO FINAL:
THE DIFFERENTIAL FROM PRELIMINARY OI TO FINAL OI SILVER TODAY: CONTRACTS : —-662
HISTORICAL ACCUMULATION OF EXCHANGE FOR PHYSICALS APRIL. ACCUMULATION FOR EFP’S SILVER/JPMORGAN’S HOUSE OF BRIBES/STARTING FROM FIRST DAY/MONTH OF APRIL:
TOTAL CONTACTS for 13 days, total 10,901 contracts: 54.505 million oz OR 4.19 MILLION OZ PER DAY. (838 CONTRACTS PER DAY)
TOTAL NO OF OZ UNDERGOING EFP TO LONDON 10,901 CONTRACTS X 5,000 PER CONTRACT:
EQUATES TO: 54.505 MILLION OZ
.
LAST 11 MONTHS TOTAL EFP CONTRACTS ISSUED IN MILLIONS OF OZ:
MAY 137.83 MILLION
JUNE 149.91 MILLION OZ
JULY 129.445 MILLION OZ
AUGUST: MILLION OZ 140.120
SEPT. 28.230 MILLION OZ//
OCT: 94.595 MILLION OZ
NOV: 131.925 MILLION OZ
DEC: 100.615 MILLION OZ
JAN 2022// 90.460 MILLION OZ
FEB 2022: 72.39 MILLION OZ//
MARCH: 207.430 MILLION OZ//A NEW RECORD FOR EFP ISSUANCE AND WE ARE STILL GOING STRONG THIS MONTH.
APRIL: 54.505 MILLION OZ (LOOKS LIKE OUR BANKERS ARE NOW LOATHE TO ISSUE EFP’S)
RESULT: WE HAD A STRONG SIZED INCREASE IN COMEX OI SILVER COMEX CONTRACTS OF 828 DESPITE OUR $0.62 LOSS IN SILVER PRICING AT THE COMEX// TUESDAY THE CME NOTIFIED US THAT WE HAD A STRONG SIZED EFP ISSUANCE CONTRACTS: 850 CONTRACTS ISSUED FOR MAY AND 0 CONTRACTS ISSUED FOR ALL OTHER MONTHS) WHICH EXITED OUT OF THE SILVER COMEX TO LONDON AS FORWARDS THE DOMINANT FEATURE TODAY: /HUGE BANKER SHORT COVERING AS THEY GET OUT OF DODGE//// WE HAVE A HUGE INITIAL SILVER OZ STANDING FOR MAR. OF 4.305 MILLION OZ FOLLOWED BY TODAY’S 110,000 OZ QUEUE JUMP//NEW STANDING: 6.410MILLION OZ/// .. WE HAD A STRONG SIZED GAIN 1678 OI CONTRACTS ON THE TWO EXCHANGES FOR 8.39 MILLION OZ DESPITE THE THE LOSS IN PRICE.
WE HAD 80 NOTICES FILED TODAY FOR 400,000 OZ
THE SILVER COMEX IS NOW BEING ATTACKED FOR METAL BY LONDONERS ET AL.
GOLD//OUTLINE
IN GOLD, THE COMEX OPEN INTEREST FELL BY A GOOD SIZED 4410 CONTRACTS TO 575,557 AND FURTHER FROM NEW RECORD (SET JAN 24/2020) AT 799,541 AND PREVIOUS TO THAT: (SET JAN 6/2020) AT 797,110.
THE DIFFERENTIAL FROM PRELIMINARY OI TO FINAL OI IN GOLD TODAY: -355 CONTRACTS.
THE BIS HAS ABANDONED THE GOLD COMEX TRADING!!!
.
THE GOOD SIZED DECREASE IN COMEX OI CAME DESPITE OUR HUGE LOSS IN PRICE OF $26.05//COMEX GOLD TRADING/TUESDAY /.AS IN SILVER WE MUST HAD HUGE BANKER/ALGO SHORT COVERING ACCOMPANYING OUR SMALL SIZED EXCHANGE FOR PHYSICAL ISSUANCE. WE HAD ZERO LONG LIQUIDATION
WE ALSO HAD A HUGE INITIAL STANDING IN GOLD TONNAGE FOR APRIL AT 78.33 TONNES ON FIRST DAY NOTICE
YET ALL OF..THIS HAPPENED WITH OUR HUGE LOSS IN PRICE OF $26.05 WITH RESPECT TO TUESDAY’S TRADING
WE HAD A TINY SIZED LOSS OF 700 OI CONTRACTS (2.174 PAPER TONNES) ON OUR TWO EXCHANGES
E.F.P. ISSUANCE
THE CME RELEASED THE DATA FOR EFP ISSUANCE AND IT TOTALED A GOOD SIZED 3710 CONTRACTS:
The NEW COMEX OI FOR THE GOLD COMPLEX RESTS AT 575,557.
IN ESSENCE WE HAVE A TINY SIZED DECREASE IN TOTAL CONTRACTS ON THE TWO EXCHANGES OF 345, WITH 4055 CONTRACTS DECREASED AT THE COMEX AND 3710 EFP OI CONTRACTS WHICH NAVIGATED OVER TO LONDON. THUS TOTAL OI LOSS ON THE TWO EXCHANGES OF 345 CONTRACTS OR 1/073 TONNES.
CALCULATIONS ON GAIN/LOSS ON OUR TWO EXCHANGES
WE HAD A GOOD SIZED ISSUANCE IN EXCHANGE FOR PHYSICALS (3710) ACCOMPANYING THE GOOD SIZED LOSS IN COMEX OI (4410,): TOTAL LOSS IN THE TWO EXCHANGES 700 CONTRACTS. WE NO DOUBT HAD 1) HUGE BANKER SHORT COVERING ,2.) HUGE INITIAL STANDING AT THE GOLD COMEX FOR APRIL. AT 78.33 TONNES FOLLOWED BY TODAY’S 1800 OZ QUEUE JUMP //NEW STANDING 82.009 TONNES/// 3) TINY LONG LIQUIDATION IF ANY ///. ,4) GOOD SIZED COMEX OI. LOSS 5) GOOD ISSUANCE OF EXCHANGE FOR PHYSICAL/
HISTORICAL ACCUMULATION OF EXCHANGE FOR PHYSICALS IN 2022 INCLUDING TODAY
APRIL
ACCUMULATION OF EFP’S GOLD AT J.P. MORGAN’S HOUSE OF BRIBES: (EXCHANGE FOR PHYSICAL) FOR THE MONTH OF APRIL :
29,966 CONTRACTS OR 2,996,600 OR 93.206 TONNES 13 TRADING DAY(S) AND THUS AVERAGING: 2305 EFP CONTRACTS PER TRADING DAY
TO GIVE YOU AN IDEA AS TO THE SIZE OF THESE EFP TRANSFERS : THIS MONTH IN 13 TRADING DAY(S) IN TONNES: 93.206TONNES
TOTAL ANNUAL GOLD PRODUCTION, 2020, THROUGHOUT THE WORLD EX CHINA EX RUSSIA: 3555 TONNES
THUS EFP TRANSFERS REPRESENTS 93.206/3550 x 100% TONNES 2.62% OF GLOBAL ANNUAL PRODUCTION
ACCUMULATION OF GOLD EFP’S YEAR 2021 TO 2022
JANUARY/2021: 265.26 TONNES (RAPIDLY INCREASING AGAIN)
FEB : 171.24 TONNES ( DEFINITELY SLOWING DOWN AGAIN)..
MARCH:. 276.50 TONNES (STRONG AGAIN/
APRIL: 189..44 TONNES ( DRAMATICALLY SLOWING DOWN AGAIN//GOLD IN BACKWARDATION)
MAY: 250.15 TONNES (NOW DRAMATICALLY INCREASING AGAIN)
JUNE: 247.54 TONNES (FINAL)
JULY: 188.73 TONNES FINAL
AUGUST: 217.89 TONNES FINAL ISSUANCE.
SEPT 142.12 TONNES FINAL ISSUANCE ( LOW ISSUANCE)_
OCT: 141.13 TONNES FINAL ISSUANCE (LOW ISSUANCE)
NOV: 312.46 TONNES FINAL ISSUANCE//NEW RECORD!! (INCREASING DRAMATICALLY)//SIGN OF REAL STRESS//SURPASSING THE MARCH 2021 RECORD OF 276.50 TONNES OF EFP
DEC. 175.62 TONNES//FINAL ISSUANCE//
JAN:2022 247.25 TONNES //FINAL
FEB: 196.04 TONNES//FINAL
MARCH: 409.30 TONNES INITIAL( THIS IS NOW A RECORD EFP ISSUANCE FOR MARCH AND FOR ANY MONTH.
APRIL: 93.206 TONNES (THIS IS GOING TO BE A LOW ISSUANCE MONTH)
SPREADING OPERATIONS
(/NOW SWITCHING TO GOLD) FOR NEWCOMERS, HERE ARE THE DETAILS
SPREADING LIQUIDATION HAS NOW COMMENCED AS WE HEAD TOWARDS THE NEW ACTIVE FRONT MONTH OF MAY.WE ARE NOW INTO THE SPREADING OPERATION OF SILVER
HERE IS A BRIEF SYNOPSIS OF HOW THE CROOKS FLEECE UNSUSPECTING LONGS IN THE SPREADING ENDEAVOUR ;MODUS OPERANDI OF THE CORRUPT BANKERS AS TO HOW THEY HANDLE THEIR SPREAD OPEN INTERESTS:HERE IS HOW THE CROOKS USED SPREADING AS WE ARE NOW INTO THE NON ACTIVE DELIVERY MONTH OF APRIL HEADING TOWARDS THE ACTIVE DELIVERY MONTH OF MAY, FOR SILVER:
YOU WILL ALSO NOTICE THAT THE COMEX OPEN INTEREST STARTS TO RISE BUT SO IS THE OPEN INTEREST OF SPREADERS. THE OPEN INTEREST IN WILL CONTINUE TO RISE UNTIL ONE WEEK BEFORE FIRST DAY NOTICE OF AN UPCOMING ACTIVE DELIVERY MONTH (MAR), AND THAT IS WHEN THE CROOKS SELL THEIR SPREAD POSITIONS BUT NOT AT THE SAME TIME OF THE DAY. THEY WILL USE THE SELL SIDE OF THE EQUATION TO CREATE THE CASCADE (ALONG WITH THEIR COLLUSIVE FRIENDS) AND THEN COVER ON THE BUY SIDE OF THE SPREAD SITUATION AT THE END OF THE DAY. THEY DO THIS TO AVOID POSITION LIMIT DETECTION. THE LIQUIDATION OF THE SPREADING FORMATION CONTINUES FOR EXACTLY ONE WEEK AND ENDS ON FIRST DAY NOTICE.”
WHAT IS ALARMING TO ME, ACCORDING TO OUR LONDON EXPERT ANDREW MAGUIRE IS THAT THESE EFP’S ARE BEING TRANSFERRED TO WHAT ARE CALLED SERIAL FORWARD CONTRACT OBLIGATIONS AND THESE CONTRACTS ARE LESS THAN 14 DAYS. ANYTHING GREATER THAN 14 DAYS, THESE MUST BE RECORDED AND SENT TO THE COMPTROLLER, GREAT BRITAIN TO MONITOR RISK TO THE BANKING SYSTEM. IF THIS IS INDEED TRUE, THEN THIS IS A MASSIVE CONSPIRACY TO DEFRAUD AS WE NOW WITNESS A MONSTROUS TOTAL EFP’S ISSUANCE AS IT HEADS INTO THE STRATOSPHERE.
First, here is an outline of what will be discussed tonight:
1.Today, we had the open interest at the comex, in SILVER, ROSE BY A STRONG SIZED 828 CONTRACT OI AND CLOSER TO OUR COMEX RECORD //244,710(SET FEB 25/2020). THE LAST RECORDS WERE SET IN AUG.2018 AT 244,196 WITH A SILVER PRICE OF $14.78/(AUGUST 22/2018)..THE PREVIOUS RECORD TO THAT WAS SET ON APRIL 9/2018 AT 243,411 OPEN INTEREST CONTRACTS WITH THE SILVER PRICE AT THAT DAY: $16.53). AND PREVIOUS TO THAT, THE RECORD WAS ESTABLISHED AT: 234,787 CONTRACTS, SET ON APRIL 21.2017 OVER 5 YEARS AGO.
EFP ISSUANCE 850 CONTRACTS
OUR CUSTOMARY MIGRATION OF COMEX LONGS CONTINUE TO MORPH INTO LONDON FORWARDS AS OUR BANKERS USED THEIR EMERGENCY PROCEDURE TO ISSUE:
MAY 850 ALL OTHER MONTHS: ZERO. TOTAL EFP ISSUANCE: 0 CONTRACTS. EFP’S GIVE OUR COMEX LONGS A FIAT BONUS PLUS A DELIVERABLE PRODUCT OVER IN LONDON. IF WE TAKE THE COMEX OI GAIN OF 828 CONTRACTS AND ADD TO THE 850 OI TRANSFERRED TO LONDON THROUGH EFP’S,
WE OBTAIN A VERY STRONG SIZED GAIN OF 1678 OPEN INTEREST CONTRACTS FROM OUR TWO EXCHANGES.
THUS IN OUNCES, THE GAIN ON THE TWO EXCHANGES 8.390 MILLION OZ
OCCURRED WITH OUR LOSS IN PRICE OF $0.62 IN PRICE.
OUTLINE FOR TODAY’S COMMENTARY
1/COMEX GOLD AND SILVER REPORT
(report Harvey)
2 ) Gold/silver trading overnight Europe,
(Peter Schiff,
3. Egon von Greyerz///Matthew Piepenburg via GoldSwitzerland.com,
4. Chris Powell of GATA provides to us very important physical commentaries
We lost a true patriot..
Financial letter writer, gold advocate James Dines dies
Submitted by admin on Tue, 2022-04-19 21:28Section: Daily Dispatches
From The Dines Letter, Belevedere, Califnrnia
Tuesday, April 19, 2022
https://www.dinesletter.com/index.html
Dear Subscribers:
It is with great sadness that we announce the passing of Mr. Dines at his home in California last week.
Mr. Dines was not only wonderful to work for but gracious and generous with his wisdom. We are grateful that he had a long, productive, and fulfilling life, which he willingly shared with all of us.
As his loyal Dines Letter readers were always his top priority, we wanted to inform you today, and didn’t want to wait for the next issue.
More details will follow in the next The Dines Letter, scheduled for publication on April 29.
Sincerely,
The Dines Letter Team
end
5. Other gold commentaries
Mises…
a must read!
Is There A Case For The Pre-1914 Gold Standard? Yes, If You Believe Inflation Is A Bad Thing
TUESDAY, APR 19, 2022 – 11:25 PM
Authored by Vibhu Vikramaditya via The Mises Institute,
The Russian central bank recently announced that it will stop buying gold at a fixed rate and will instead buy them at the negotiated rate from banks. Following the numerous sanctions which were imposed on Russia. The Ruble had fallen tremendously against the US dollar, to get out of such a situation it had announced that it would buy gold at a fixed price of 5,000 rubles a gram until June 30. Since that announcement, the ruble has strengthened sharply against the dollar for over one month. Five thousand rubles was worth around $52 on March 25 and around $63 on Thursday.
The mechanism which led to the increase was to allow the markets to play themselves out, in order to combat sanctions, they asked the nations to transact in their currency which, due to the extensive and growing array of sanctions by the western front, was becoming devalued by each day. It was here, by demanding payment in rubles, are attempting to increase demand for their currency which led to its increase where being pegged to hard currency allowed the confidence of the markets to increase so ruble wasn’t dumped extensively
But because once you allow for sound money such as gold pegged to your currency which is dictated by the effective allocating mechanism of the market you cannot ignore the market valuation any longer, therefore the bounce-back and effective strengthening of the ruble which took place more and earlier than expected has now forced them to abandon the fixed-rate currency and move towards a more flexible exchange rate mechanism which would allow them to set the rates effectively in line with the motivation of sellers while discounting for factors such as immediacy, global credit standing and the turns of the global economy.
A classical gold standard requires the central bank to exchange by the process of both purchasing and selling gold and the national currency for each other and to do so according to a fixed weight or quantity of gold per unit of currency. Thus, while neither the pegged currency nor the negotiated rates of exchange comprise the classical gold standard, they nonetheless serve as a great case study into the commendatory effects of having hard money serving as the medium of change in the economy.
In the much-celebrated book of his time, Tract on Monetary Reform, economist John Maynard Keynes urged the United States and Great Britain to abandon the gold standard, calling it a “barbarous relic.” In the decades that followed the book’s publication, countries around the globe heeded Keynes’ advice and relegated the gold standard to the dust bin. It is one of the great historical ironies that almost every advice of from Keynes was taken up by the world in the latter half of the 20th century and that none of the supposed benefits of stability, full employment have come to fruition.
The Problem of Gold standard in the Keynesian system
Keynes’s dictum on the gold standard has become the fountainhead of claims against a return back to the gold standard.
Keynes in his analysis found the gold standard to be a barbarous relic of the past that was unscientific and unfit to meet the demands of a modern world.
It is his arguments against the gold standard which have been repeated time and again, thus they serve as an excellent case for demonstration as to why the gold standard is superior based on the very allegations which are leveled against it.
Inflation and Gold standard
He wrote in his tract on monetary reform about the ills of inflation “ Inflation redistributes wealth…. Its most striking consequence is its injustice to those who in good faith have committed their savings to titles to money rather than to things…. Injustice on such a scale has further consequences…. Inflation has… destroyed the atmosphere of confidence which is a condition of the willingness to save….
Reading this one might form the opinion that the author of such lines might be highly unsavory and unscrupulous towards a monetary regime which causes destruction of the price mechanism and people’s stored up wealth through the artificial increase in prices but unfortunately one cannot do so without committing a grave error as both instances in modern history when prices have run amok namely the stagflation of the 70s and the massive rise in prices of around 10% today are both a result of Keynesian economics.
The most widely recognized virtue of the historical gold standard is its low average inflation rate. The rate of inflation was lowest, on average, under the gold standard when compared with the Bretton woods system of a pegged dollar and fluctuating system of fiat dollar reserve. (p. 30).
This was the era of the classical gold standard which lasted from 1880 to 1914, Inflation over this time period, while it fluctuated on a year-to-year basis, was virtually zero, and as a result, prices whose proper role lies in giving signals about market scarcity ensured proper allocation of resources due to which real income per capita in the United States increased by over 60 percent in a generation and a half. This low inflation is not a coincidence but a direct effect that is to be expected when the money supply is bound to the supply of gold. While the central bank can create thousands of dollars out of thin air to increase the money supply with its high stock to flow ratio, gold has the lowest price elasticity of supply, which is calculated as the percentage increase in quantity provided over price rise.
This implies the effects of the increased supply which would be prompted by increases in the price of gold through higher demand would be quite insignificant to cause changes in the absolute price level. For instance, the year 2006 witnessed a 36% rise in the spot price of gold. For any other commodity, this would be expected to increase mining output significantly to flood markets and bring the price down. Instead, annual production in 2006 was 2,370 tons, 100 tons less than in 2005, and it would drop a further 10 tons in 2007. (p. 34).
With changes in money supply being largely unaffected by changes in prices of gold, the general rise in prices which are caused when the supply of money is greater than the demand to hold it doesn’t occur. An economy where price increases are not caused due to an increase in money supply experiences price rise as a function of scarcity based on underlying consumer preferences which lead entrepreneurs to allocate resources properly in line with consumer demand.
Gold Standard and boom-bust cycles
A fiduciary media such as paper currency or bank deposits which are effectively used as the medium of exchange which is redeemable in gold enjoys certain properties which create a mechanism whereby artificial increases in money supply are either discouraged or its effects are reversed.
Suppose if commercial banks were to increase the supply of fiduciary media beyond what its coffers can handle, an increase in supply would first increase the cash balance holdings of its lenders who would when then start spending it on the various inputs of production thereby increasing its price, this increased price would accrue higher profits to the sellers of those inputs who would in-turn increase their output.
The process where sellers of inputs increase their input would lead them to hire more labor and capital goods which in turn would put further inflationary pressures on wages and other consumer goods when the rise in input prices are materialized into higher consumer goods prices.
Due to such an increase in prices, the goods of other economies would gain a competitive advantage over domestic ones which would lead to an increase in demand for gold to trade with other countries, as the demand for gold increases, the over-issued fiduciary media would find themselves back to banks who would then be put in dangers of bank runs and defaulting on their claim. This discipline of defaulting over time would root out banks that would have the habit of overissuing fiduciary media which is the source of an artificial unsustainable boom that eventually bursts and leads the economy towards a recession.
The same restrictions apply to the central banks as well where they can’t run an easy money policy without running the risk of a run on their reserves, given if a central bank lowers its lending rate of interest on its gold reserves to commercial banks in order to create a boom.
It would lead to capital outflows as investors would look to invest in countries where the interest rate is higher, this would mean that the demand for gold by investors to exchange it against foreign currency will increase. This outflow of gold reserves will decrease the quantity of money in the economy which will again lead to an increase in the rate of interest, therefore it not only means that the monetary policy would be rendered ineffective but also lead central banks to lose out on important gold reserves.
The problems of the pseudo gold standard
One of the greatest benefits of the gold standard lies in its ability to restrict and bind the hands of the government. This perhaps becomes most evident when one revisits the episodes of how the gold standard was one by one abandoned by all countries in line for preparation of war efforts of the first world war. Each country in order to build up reserves for arms and ammunition had to increase its defense spending which couldn’t take place under the restraining system which protects individual liberty. Once the war ended there were some attempts at coming back to the gold standard but since they were not based on the underlying dynamic of a market-based gold-currency exchange rate mechanism, it failed to restore the price stability and economic prosperity of the classical gold standard. Each of the countries that participated in the war thus spent huge amounts of money and had massively inflated their currencies, thus economic conditions had changed equilibrium exchange rates between national currencies, and hence gold parities should have been adjusted. If 1914 is taken as the base (= 100), wholesale prices in December 1918 were as follows: USA 202, France 355, UK 246.
After the war in 1918, the USA immediately announced that it would maintain the dollar price of gold at its prewar level. That is, it is willing to export gold at $20.67 per ounce. It was thought that Britain’s national honor was at stake. Failure to restore the prewar parity of the pound would undermine confidence in the pound.
Accordingly, Britain resorted to a deflationary policy and restored the value of the pound to its pre-WW1 levels, this turned out to be a disaster for the British economy and other economies connected to it. Artificially lowering the value of the pound despite the increased money supply during the war period distorted the entire structure of prices whose role is to guide entrepreneurs, it could be compared to a situation wherein amid congestion of traffic, the signals reflect guidance for coordinating yesterday’s traffic.
The USA was able to survive the artificial deflation on the account of its massive gold reserves which had grown during the war and the piling up of debt that countries owned to the United States. This allowed the USA to pursue an easy money policy which first sparked a temporary boom and then characteristically culminated in a bust. This mechanism was explained most adequately by Rothbard in his seminal work America’s Great Depression. Had the currencies been allowed to change as per a fixed weight of gold units per unit of currency, the picture may well have been different.
Conclusion
Keynes began his mission to enunciate his system of economics where the invisible hand of the market will be replaced by the visible hand of policymakers where an increase in government spending through the increase in aggregate demand as a result of the multiplier mechanism will provide full or near full employment. But before such a project could be undertaken, it was important to show why the gold standard fails to provide an order to the society as the foundations of his economic system relies on the fact that a country has independence in monetary and fiscal matters where it is not directly affected by the policies of other economies. There can be no such thing as a Keynesian state on the gold standard, any more than a cocaine addict or compulsive gambler can be on a strict budget.
But now on the backs of substantial evidence and analysis, it becomes quite clear that not only was Keynes incorrect about the question of instability of the value of money and on the gold standard as a monetary system. A stronger case has also been made to show the classical gold standard is superior on every front and a return to the gold standard will cure several economic ills of inflation, improper allocation of resources, and a continuous cycle of booms and busts. This now calls into question a reevaluation of the entire foundation of the fiat money system along with the Keynesian worldview.
end
6. Commodity commentaries/cryptocurrencies
3. ASIAN AFFAIRS
i)WEDNESDAY MORNING// TUESDAY NIGHT
SHANGHAI CLOSED DOWN 42.98 PTS OR 1.35% //Hang Sang CLOSED DOWN 84.09 OR 0.40% /The Nikkei closed UP 232.76 PTS OR 0.86% //Australia’s all ordinaires CLOSED UP .02% /Chinese yuan (ONSHORE) closed DOWN 6.4125 /Oil UP TO 104.11 dollars per barrel for WTI andUP TO 108.65 for Brent. Stocks in Europe OPENED ALL GREEN // ONSHORE YUAN CLOSED DOWN AGAINST THE DOLLAR AT 6.4125 OFFSHORE YUAN CLOSED UP ON THE DOLLAR AT 6.4431: /ONSHORE YUAN TRADING ABOVE LEVEL OF OFFSHORE YUAN/ONSHORE YUAN TRADING WEAKER AGAINST US DOLLAR/OFFSHORE WEAKER/
a)NORTH KOREA
outline
b) REPORT ON JAPAN/
OUTLINE
3 C CHINA
OUTLINE
4/EUROPEAN AFFAIRS
OUTLINE
5. RUSSIAN AND MIDDLE EASTERN AFFAIRS
OUTLINE
6.Global Issues
OUTLINE
7. OIL ISSUES
OUTLINE
8 EMERGING MARKET ISSUES
COMEX DATA//AMOUNTS STANDING//VOLUME OF TRADING/INVENTORY MOVEMENTS
GOLD
LET US BEGIN:
THE TOTAL COMEX GOLD OPEN INTEREST FELL BY A GOOD SIZED 4410 CONTRACTS TO 575,202 AND CLOSER TO THE RECORD THAT WAS SET IN JANUARY/2020: {799,541 OI(SET JAN 16/2020)} AND PREVIOUS TO THAT: 797,110 (SET JAN 7/2020). AND THIS GOOD COMEX DECREASE OCCURRED WITH OUR VERY STRONG LOSS OF $26.05 IN GOLD PRICING TUESDAY’S COMEX TRADING. WE ALSO HAD A GOOD SIZED EFP (3710 CONTRACTS). . THEY WERE PAID HANDSOMELY NOT TO TAKE DELIVERY AT THE COMEX AND SETTLE FOR CASH.
WE NORMALLY HAVE WITNESSED EXCHANGE FOR PHYSICALS ISSUED BEING SMALL AS IT JUST TOO COSTLY FOR THEM TO CONTINUE SERVICING THE COSTS OF SERIAL FORWARDS CIRCULATING IN LONDON. HOWEVER, MUCH TO THE ANNOYANCE OF OUR BANKERS, THE COMEX IS THE SCENE OF AN ASSAULT ON GOLD AS LONDONERS, NOT BEING ABLE TO FIND ANY PHYSICAL ON THAT SIDE OF THE POND, EXERCISE THESE CIRCULATING EXCHANGE FOR PHYSICALS IN LONDON AND FORCING DELIVERY OF REAL METAL OVER HERE AS THE OBLIGATION STILL RESTS WITH NEW YORK BANKERS. IT SEEMS THAT ARE BANKERS FRIENDS ARE EXERCISING EFP’S FROM LONDON AND NOW THEY ARE LOATHE TO ISSUE NEW ONES.
EXCHANGE FOR PHYSICAL ISSUANCE
WE ARE NOW MOVING TO THE ACTIVE DELIVERY MONTH OF APRIL.. THE CME REPORTS THAT THE BANKERS ISSUED A SMALL SIZED TRANSFER THROUGH THE EFP ROUTE AS THESE LONGS RECEIVED A DELIVERABLE LONDON FORWARD TOGETHER WITH A FIAT BONUS.,
THAT IS 3710 EFP CONTRACTS WERE ISSUED: ;: , . 0 JUNE :3710 & ZERO FOR ALL OTHER MONTHS:
TOTAL EFP ISSUANCE: 3710 CONTRACTS
WHEN WE HAVE BACKWARDATION, EFP ISSUANCE IS VERY COSTLY BUT THE REAL PROBLEM IS THE SCARCITY OF METAL AND IT IS FAR BETTER FOR OUR BANKERS TO PAY OFF INDIVIDUALS THAN RISK INVESTORS ESPECIALLY FROM LONDON STANDING FOR DELIVERY. THE LOWER PRICES IN THE FUTURES MARKET IS A MAGNET FOR OUR LONDONERS SEEKING PHYSICAL METAL. BACKWARDATION ALWAYS EQUAL SCARCITY OF METAL!
ON A NET BASIS IN OPEN INTEREST WE LOST THE FOLLOWING TODAY ON OUR TWO EXCHANGES: A SMALL SIZED TOTAL OF 700 CONTRACTS IN THAT 3710 LONGS WERE TRANSFERRED AS FORWARDS TO LONDON AND WE HAD A GOOD SIZED COMEX OI LOSS OF 4410 CONTRACTS..AND THIS LOSS OCCURRED WITH OUR STRONG LOSS IN PRICE OF GOLD $26.05.
// WE HAVE A STRONG AMOUNT OF GOLD TONNAGE STANDING FOR APRIL (82.009),
HERE ARE THE AMOUNTS THAT STOOD FOR DELIVERY IN THE PRECEDING 12 MONTHS OF 2021:
DEC 2021: 112.217 TONNES
NOV. 8.074 TONNES
OCT. 57.707 TONNES
SEPT: 11.9160 TONNES
AUGUST: 80.489 TONNES
JULY: 7.2814 TONNES
JUNE: 72.289 TONNES
MAY 5.77 TONNES
APRIL 95.331 TONNES
MARCH 30.205 TONNES
FEB ’21. 113.424 TONNES
JAN ’21: 6.500 TONNES.
TOTAL SO FAR THIS YEAR (JAN- DEC): 601.213 TONNES
YEAR 2022:
JANUARY 2022 17.79 TONNES
FEB 2022: 59.023 TONNES
MARCH: 36.678 TONNES
APRIL: 82.009
THE BANKERS WERE UNSUCCESSFUL IN LOWERING GOLD’S PRICE //// (IT FELL $26.05) AND AND WERE BASICALLY UNSUCCESSFUL IN FLEECING ANY LONGS AS WE HAVE REGISTERED A TINY SIZED LOSS OF 2.174 TONNES ON TOTAL OI FROM OUR TWO EXCHANGES, ACCOMPANYING OUR HUGE GOLD TONNAGE STANDING FOR APRIL (82.009 TONNES)…
WE HAD — 355 CONTRACTS REMOVED FROM COMEX TRADES. THESE WERE REMOVED AFTER TRADING ENDED LAST NIGHT
NET LOSS ON THE TWO EXCHANGES 700 CONTRACTS OR 70,000 OZ OR 2.174TONNES
Estimated gold volume today: 136,428/// poor
Confirmed volume yesterday: 190,156 contracts poor
INITIAL STANDINGS FOR APRIL ’22 COMEX GOLD //APRIL 20
| Gold | Ounces |
| Withdrawals from Dealers Inventory in oz | nil oz |
| Withdrawals from Customer Inventory in oz | 257.210 oz Brinks 8 kilobars |
| Deposit to the Dealer Inventory in oz | nil OZ |
| Deposits to the Customer Inventory, in oz | nil |
| No of oz served (contracts) today | 135 notice(s) 13,500 OZ0. 4199 TONNES |
| No of oz to be served (notices) | 1021 contracts 102,100 oz 3.175 TONNES |
| Total monthly oz gold served (contracts) so far this month | 25,345 notices 2,534,500 OZ 78.833 TONNES |
| Total accumulative withdrawals of gold from the Dealers inventory this month | NIL oz |
| Total accumulative withdrawal of gold from the Customer inventory this month | xxx oz |
For today:
dealer deposits 0
total dealer deposit nil oz//
No dealer withdrawals
0 customer deposit
total customer deposit nil oz
1 customer withdrawals
i) Out of Brinks 257.210 oz
total customer withdrawal: 257.210 oz /
ADJUSTMENTS:
0
CALCULATIONS FOR THE AMOUNT OF GOLD STANDING FOR APRIL.
For the front month of APRIL we have an oi of 1156 contracts having GAINED 10 contracts
We had 8 notices filed yesterday so we GAINED 18 contracts or an additional 1800 oz will stand for delivery at the comex
May saw a LOSS of 160 contracts to stand at 3380
June saw a LOSS of 4402 contracts UP to 474,679 contracts
We had 135 notice(s) filed today for 13500 oz FOR THE APRIL 2022 CONTRACT MONTH.
Today, 0 notice(s) were issued from J.P.Morgan dealer account and 0 notices were issued from their client or customer account. The total of all issuance by all participants equates to 135 contract(s) of which 0 notices were stopped (received) by j.P. Morgan dealer and 46 notice(s) was (were) stopped/ Received) by J.P.Morgan//customer account and 0 notice(s) received (stopped) by the squid (Goldman Sachs)
To calculate the INITIAL total number of gold ounces standing for the APRIL /2021. contract month,
we take the total number of notices filed so far for the month (25,345) x 100 oz , to which we add the difference between the open interest for the front month of (APRIL 1156 CONTRACTS ) minus the number of notices served upon today 46 x 100 oz per contract equals 2,636,600 OZ OR 82.009 TONNES the number of TONNES standing in this active month of APRIL.
thus the INITIAL standings for gold for the APRIL contract month:
No of notices filed so far (25,345) x 100 oz+ (1156) OI for the front month minus the number of notices served upon today (135} x 100 oz} which equals 2,636,600 oz standing OR 82.009 TONNES in this active delivery month of APRIL.
We GAINED 1800 additional oz that will stand for delivery on this side of the pond.
TOTAL COMEX GOLD STANDING: 82.009 TONNES (A WHOPPER FOR AN APRIL ( ACTIVE) DELIVERY MONTH)
XXXXXXXXXXXXXXXXXXXXXXXXXXXXXXXXXXXXXXXXXXXXXXXXXXXXXXXXXXXXX
COMEX GOLD INVENTORIES/CLASSIFICATION
NEW PLEDGED GOLD:
191,133,764.7, oz NOW PLEDGED /HSBC 5.94 TONNES
99,258.893 PLEDGED MANFRA 3.08 TONNES
54,339.114oz PLEDGED JPMorgan no 1 1.690 tonnes
243,923.704, oz JPM No 2 7.58 TONNES
898,821.330 oz pledged Brinks/27,96 TONNES
International Delaware:: 0
Loomis: 18,615.429 oz
total pledged gold: 1,887,433.936 oz 58.70 tonnes
TOTAL REGISTERED AND ELIG GOLD AT THE COMEX: 35,952,503.296 OZ (1118,27 TONNES)
TOTAL ELIGIBLE GOLD: 18,310,326.079 OZ (569.52 tonnes)
TOTAL OF ALL REGISTERED GOLD: 17,642,177.218 OZ (548.74 tonnes)
REGISTERED GOLD THAT CAN BE SERVED UPON: 15,754,744.0 OZ (REG GOLD- PLEDGED GOLD) 490.03 tonnes
END
APRIL 2022 CONTRACT MONTH//SILVER//APRIL 20
| Silver | Ounces |
| Withdrawals from Dealers Inventory | NIL oz |
| Withdrawals from Customer Inventory | 765,042.651 oz Manfra CNT Delaware JPMorgan |
| Deposits to the Dealer Inventory | nil OZ |
| Deposits to the Customer Inventory | 917,859.530 oz Brinks CNT Delaware JPMorgan |
| No of oz served today (contracts) | 80CONTRACT(S)400,000 OZ) |
| No of oz to be served (notices) | 62 contracts (15,000 oz) |
| Total monthly oz silver served (contracts) | 1279 contracts 6,395,,000 oz) |
| Total accumulative withdrawal of silver from the Dealers inventory this month | NIL oz |
| Total accumulative withdrawal of silver from the Customer inventory this month |
And now for the wild silver comex results
we had 0 deposit into the dealer
total dealer deposits: nil oz
i) We had 0 dealer withdrawal
total dealer withdrawals: nil oz
We have 4 deposits into the customer account
i) Into Brinks: 62,255.57 oz
ii) Into CNT: 268,486.180 oz
iii) Into Delaware: 4812.580 oz
iv) Into JPMorgan: 582,305.20
total deposit: 917,859.530 oz
JPMorgan has a total silver weight: 177.007 million oz/334.707 million =52.99% of comex
i) Comex withdrawals: 4
ii) Out of CNT 4954.527 oz
i) Out of Delaware: 10,946.700 oz
iii) Out of JPMorgan 627,881.580 oz
iv) Out of Manfra: 121,259.884 oz
total withdrawal 765,042.651 oz
1 adjustments: dealer to customer//Manfra 177,470.580 oz
and JPMorgan: 5061.880 oz
the silver comex is in stress!
TOTAL REGISTERED SILVER: 86.207 MILLION OZ
TOTAL REG + ELIG. 334.707 MILLION OZ
CALCULATION OF SILVER OZ STANDING FOR APRIL
silver open interest data:
FRONT MONTH OF APRIL OI: 83, HAVING GAINED 22 CONTRACTS FROM MONDAY. We had 0 notices filed yesterday,
so we GAINED 22 contracts or an additional 110,000 oz will stand on this side of the pond
MAY HAD A LOSS OF 4115 CONTRACTS DOWN TO 60,367 contracts
JUNE HAD A GAIN OF 78 TO STAND AT 1226
.
TOTAL NUMBER OF NOTICES FILED FOR TODAY: 80 for 400,000 oz
Comex volumes: 59,282// est. volume today// fair/
Comex volume: confirmed yesterday: 83,318 contracts ( good )
To calculate the number of silver ounces that will stand for delivery in APRIL. we take the total number of notices filed for the month so far at 1279 x 5,000 oz = 6,395,000 oz
to which we add the difference between the open interest for the front month of APRIL (83) and the number of notices served upon today 80 x (5000 oz) equals the number of ounces standing.
Thus the standings for silver for the APRIL./2021 contract month: 1279 (notices served so far) x 5000 oz + OI for front month of APRIL (83) – number of notices served upon today (80) x 5000 oz of silver standing for the APRIL contract month equates 6,410,000 oz. .
We GAINED 22 contracts or an additional 110,000 oz will stand on this side of the pond
the record level of silver open interest is 234,787 contracts set on April 21./2017 with the price on that day at $18.42. The previous record was 224,540 contracts with the price at that time of $20.44
END
GLD AND SLV INVENTORY LEVELS:
APRIL 20/WITH GOLD DOWN $3.05: A HUGE CHANGE IN GOLD INVENTORY AT THE GLD: A DEOISUT IF 6.36 TONNES INTO THE GLD..//INVENTORY RESTS AT 1106.74 TONNES
APRIL 19//WITH GOLD DOWN $26.90//A SMALL CHANGE IN GOLD INVENTORY AT THE GLD A DEPOSIT OF .87 TONNES INTO THE GLD//INVENTORY RESTS AT 1100.36 TONNES
APRIL 18/WITH GOLD UP $11.20: A HUGE CHANGE IN GOLD INVENTORY AT THE GLD: A WITHDRAWAL OF 4.93 TONNES FROM THE GLD..//INVENTORY RESTS AT 1099.44 TONNES
APRIL 14/WITH GOLD DOWN $8.90: A HUGE CHANGE IN GOLD INVENTORY AT THE GLD: A DEPOSIT OF 11.32 TONNES INTO THE GLD..//INVENTORY RESTS AT 1104.42 TONNES
APRIL 13/WITH GOLD UP $8.80: NO CHANGES IN GOLD INVENTORY AT THE GLD//INVENTORY RESTS AT 1093.10 TONNES
APRIL 12/WITH GOLD UP $26.95: A HUGE CHANGE IN GOLD INVENTORY AT THE GLD: A DEPOSIT OF 2.61 TONNES INTO THE GLD///INVENTORY REST AT 1093.10 TONNES
APRIL 11/WITH GOLD UP $3.40 //A HUGE CHANGE IN GOLD INVENTORY AT THE GLD: A DEPOSIT OF 1.74 TONNES OF GOLD INTO THE GLD.//INVENTORY RESTS AT 1090.49 TONNES
APRIL 8/WITH GOLD UP $7.70: A BIG CHANGE IN GOLD INVENTORY AT THE GLD: A DEPOSIT OF 1.45 TONNES INTO THE GLD//INVENTORY RESTS AT 1088.75 TONNES
APRIL 7/WITH GOLD UP $13.40: NO CHANGES IN GOLD INVENTORY AT THE GLD//INVENTORY RESTS AT 1087.30 TONNES
APRIL 6/WITH GOLD DOWN $4.10: A HUGE CHANGES IN GOLD INVENTORY AT THE GLD: A WITHDRAWAL OF 2.68 TONNES FROM THE GLD..//INVENTORY RESTS AT 1087.30 TONNES
APRIL 5/WITH GOLD DOWN $5.70: A HUGE CHANGE IN GOLD INVENTORY AT THE GLD: A WITHDRAWAL OF 1.75 TONNES FROM THE GLD//INVENTORY RESTS AT 1089.98 TONNES
APRIL 4/WITH GOLD UP $.70//NO CHANGES IN GOLD INVENTORY AT THE GLD//INVENTORY RESTS AT 1091.73 TONNES
APRIL 1///WITH GOLD DOWN $19.00 : A SMALL CHANGE IN GOLD INVENTORY AT THE GLD: A DEPOSIT OF .29 TONNES INTO THE GLD///INVENTORY RESTS AT 1091.73 TONNES
MARCH 31/WITH GOLD UP $13.30 TODAY: A HUGE CHANGE IN GOLD INVENTORY AT THE GLD FROM MONDAY A WITHDRAWAL OF 1.71 TONNES FROM THE GLD:INVENTORY RESTS AT 1091.44
MARCH 28/WITH GOLD DOWN $14.65: NO CHANGES IN GOLD INVENTORY AT THE GLD//INVENTORY RESTS AT 1093.18 TONNES
MARCH 25/WITH GOLD DOWN $7.60 : A HUGE CHANGE IN GOLD INVENTORY AT THE GLD: A DEPOSIT OF 5.52 TONNES INTO THE GLD///INVENTORY RESTS AT 1093.18 TONNES
MARCH 24/WITH GOLD UP $24.95: HUGE CHANGES IN GOLD INVENTORY AT THE GLD: A DEPOSIT OF 4.06 TONNES INTO THE GLD..//INVENTORY RESTS AT 1087.66 TONNES
MARCH 23/WITH GOLD UP $15.75//NO CHANGES IN GOLD INVENTORY AT THE GLD//INVENTORY RESTS AT 1083.60 TONNES
MARCH 22/WITH GOLD DOWN $7.75: A HUGE CHANGE IN GOLD INVENTORY AT THE GLD: A DEPOSIT OF 1.16 TONNES OF GOLD DEPOSITED INTO THE GLD//INVENTORY RESTS AT 1083.60 TONES
MARCH 21//WITH GOLD UP $.25 : A HUGE CHANGE IN GOLD INVENTORY AT THE GLD: A DEPOSIT OF 9.00 TONNES INTO THE GLD////INVENTORY RESTS AT 1082.44 TONES
MARCH 18/WITH GOLD DOWN $13.55 NO CHANGES IN GOLD INVENTORY AT THE GLD//INVENTORY RESTS AT 1073.44 TONES
MARCH 17/WITH GOLD UP $33.50: A HUGE CHANGE IN GOLD INVENTORY AT THE GLD: A DEPOSIT OF 11.61 TONNES INTO THE GLD//INVENTORY RESTS AT 1073.44 TONNES
MARCH 16/WITH GOLD DOWN $18.50//A HUGE CHANGE IN GOLD INVENTORY AT THE GLD: A WITHDRAWAL OF 2.33 TONNES FROM THE GLD///INVENTORY RESTS AT 1061.83 TONNES
MARCH 15/WITH GOLD DOWN $30.80 TODAY: NO CHANGES IN GOLD INVENTORY AT THE GLD//INVENTORY RESTS AT 1064.16 TONNES
MARCH 14//WITH GOLD DOWN $22.75, HUGE CHANGES IN GOLD INVENTORY AT THE GLD//STRANGE: A DEPOSIT OF 2.62 TONNES INTO THE GLD.//INVENTORY RESTS AT 1064.16 TONNES
MARCH 11/WITH GOLD DOWN $14.60: A BIG CHANGE IN GOLD INVENTORY AT THE GLD A WITHDRAWAL OF 1.74 TONNES FROM THE GLD////INVENTORY RESTS AT 1061.54 TONNES
MARCH 10//WITH GOLD UP $11.55: A HUGE CHANGES IN GOLD INVENTORY AT THE GLD: A WITHDRAWAL OF 4.06 TONNES FORM THE GLD///INVENTORY RESTS AT 1063.28 TONNES
MARCH 9/WITH GOLD DOWN $53.85//A HUGE CHANGE IN GOLD INVENTORY AT THE GLD: A DEPOSIT OF 4.64 TONNES INTO THE GLD//INVENTORY RESTS AT 1067.34 TONNES
MARCH 8/WITH GOLD UP $46.10: A HUGE CHANGE IN GOLD INVENTORY AT THE GLD: A DEPOSIT OF 8.42 TONNES INTO THE GLD///INVENTORY RESTS AT 1062.70 TONNES
MARCH 7/WITH GOLD UP $28.40 A HUGE CHANGES IN GOLD INVENTORY AT THE GLD: A DEPOSIT OF 4.06 TONNES INTO THE GLD..//INVENTORY RESTS AT 1054.28 TONNES
MARCH 4/WITH GOLD UP $28.40//NO CHANGES IN GOLD INVENTORY AT THE GLD//INVENTORY RESTS AT 1050.22 TONNES
CLOSING INVENTORY FOR THE GLD//1106.74 TONNES
Now the SLV Inventory/( vehicle is a fraud as there is no physical metal behind them
APRIL 20/WITH SILVER DOWN 15 CENTS : A HUGE CHANGES IN SILVER INVENTORY AT THE SLV: A DEPOSIT OF 2.955 MILLION OZ INTO THE SLV//INVENTORY RESTS AT 577.941 MILLION OZ///
APRIL 19/WITH SILVER DONW 62 CENTS: A SMALL CHANGES IN SILVER INVENTORY AT THE SLV: A WITHDRAWAL OF .461 MILLION OZ FROM THE SLV INVENTORY…//INVENTORY RESTS AT 574.986 MILLION OZ
APRIL 18/WITH SILVER UP 38 CENTS: A HUGE CHANGES IN SILVER INVENTORY AT THE SLV: A DEPOSIT OF 5.771 MILLION OZ INTO THE SLV./INVENTORY RESTS AT 575.447 MILLION OZ//
APRIL 14/WITH SILVER DOWN 25 CENTS : A MONSTROUS CHANGE IN SILVER INVENTORY AT THE SLV: A DEPOSIT OF 4.355 MILLION OZ INTO THE SLV.//INVENTORY RESTS AT 569.676 MILLION OZ//
APRIL 13/WITH SILVER UP 27 CENTS: NO CHANGES IN SILVER INVENTORY AT THE SLV//INVENTORY RESTS AT 565.521 MILLION OZ
APRIL 12/WITH SILVER UP 66 CENTS: NO CHANGES IN SILVER INVENTORY AT THE SLV/INVENTORY RESTS AT 565.521 MILLION OZ//
APRIL 11/WITH SILVER UP 13 CENTS: A SMALL CHANGE IN SILVER INVENTORY AT THE SLV: A WITHDRAWAL OF 831,000 OZ FORM THE SLV////INVENTORY RESTS AT 565.521 MILLION OZ
APRIL 8/WITH SILVER UP 11 CENTS :NO CHANGES IN SILVER INVENTORY AT THE SLV/INVENTORY RESTS AT 566.352 MILLION OZ//
APRIL 7/WITH SILVER UP 27 CENTS : NO CHANGES IN SILVER INVENTORY AT THE SLV//INVENTORY RESTS AT 566.352 MILLION OZ//
APRIL 6/WITH SILVER DOWN 9 CENTS : NO CHANGES IN SILVER INVENTORY AT THE SLV/INVENTORY RESTS AT 566.352 MILLION OZ
APRIL 5/WITH SILVER DOWN 16 CENTS : A HUGE CHANGES IN SILVER INVENTORY AT THE SLV: A DEPOSIT OF 1.386 MILLION OZ INTO THE SLV..//INVENTORY RESETS AT 566.352 MILLION OZ//
APRIL 4/WITH SILVER DOWN 5 CENTS TO CHANGES IN SILVER INVENTORY AT THE SLV//: A DEPOSIT OF 6.326 MILLION OZ//INVENTORY REST AT 564.966 MILLION OZ//
APRIL 1/WITH SILVER DOWN 39 CENTS A BIG CHANGES IN SILVER INVENTORY AT THE SLV: A DEPOSIT OF 2.302 MILLION OZ INTO THE SLV////INVENTORY REST AT 558.647 MILLION OZ//
MARCH 31/WITH SILVER UP 3 CENTS TODAY: HUGE CHANGES IN SILVER INVENTORY AT THE SLV//A DEPOSIT OF 2.171 MILLION OZ INTO THE SLV//INVENTORY RESTS AT 556.345 MILLION OZ
MARCH 28/WITH SILVER DOWN 30 CENTS TODAY: A HUGE CHANGES IN SILVER INVENTORY AT THE SLV: A DEPOSIT OF 1.847 MILLION OZ INTO THE SLV///INVENTORY RESTS AT 554.167 MILLION OZ//
MARCH 25/WITH SILVER DOWN 20 CENTS TODAY: NO CHANGES IN SILVER INVENTORY AT THE SLV//INVENTORY RESTS AT 552.320 MILLION OZ//
MARCH 24/WITH SILVER UP 54 CENTS TODAY; A HUGE CHANGES IN SILVER INVENTORY AT THE SLV: A DEPOSIT OF 2.092 MILLION OZ INTO THE SLV//INVENTORY RESTS AT 552.320 MILLION OZ//
MARCH 23/WITH SILVER UP 24 CENTS TODAY: NO CHANGES IN SILVER INVENTORY AT THE SLV//INVENTORY RESTS AT 550.288 MILLION OZ//
MARCH 22/WITH SILVER DOWN $0.29 TODAY : NO CHANGES IN SILVER INVENTORY AT THE SLV//INVENTORY RESTS AT 550.288 MILLION OZ//
MARCH 21/WITH SILVER UP 16 CENTS TODAY: NO CHANGES IN SILVER INVENTORY AT THE SLV//INVENTORY RESTS AT 550.288 MILLION OZ//
MARCH 18/WITH SILVER DOWN 37 CENTS TODAY: A HUGE CHANGES IN SILVER INVENTORY AT THE SLV: A DEPOSIT OF 2.217 MILLION OZ INTO THE SLV//INVENTORY RESTS AT 550.288 MILLION OZ//
MARCH 17/ WITH SILVER UP 72 CENTS TODAY: A HUGE CHANGE IN SILVER INVENTORY AT THE SLV: A DEPOSIT OF 3.049 MILLION OZ INTO THE SLVV//INVENTORY RESTS AT 548.071 MILLION OZ
MARCH 16/WITH SILVER DOWN 56 CENTS TODAY: A SMALL CHANGE IN SILVER INVENTORY AT THE SLV: A WITHDRAWAL OF 462,000 OZ FROM THE SLV//INVENTORY RESTS AT 544.560 MLLION O
MARCH 15/WITH SILVER DOWN 18 CENTS TODAY: NO CHANGES IN SILVER INVENTORY AT THE SLV//INVENTORY RESTS AT 545.022 MILLION OZ
MARCH 14/WITH SILVER DOWN 64 CENTS TODAY; STRANGE A HUGE CHANGE IN SILVER INVENTORY AT THE SLV: A DEPOSIT OF 2.125 MILLION OZ/INVENTORY RESTS AT 545.022 MILLIONOZ
MARCH 11/WITH SILVER DOWN 13 CENTS TODAY: NO CHANGES IN SILVER INVENTORY AT THE SLV//INVENTORY RESTS AT 542.897 MILLION OZ
MARCH 10/WITH SILVER UP 39 CENTS TODAY: NO CHANGES IN SILVER INVENTORY AT THE SLV//INVENTORY RESTS AT 542.897 MILLION OZ/
MARCH 9/WITH SILVER DOWN 88 CENTS TODAY: A HUGE CHANGE IN SILVER INVENTORY AT THE SLV: A WITHDRAWAL OF 5.174 MILLION OZ OF FAKE SILVER.//INVENTORY RESTS AT 542.897 MILLION OZ//
MARCH 8/WITH SILVER UP 88 CENTS TODAY; HUGE CHANGES IN SILVER INVENTORY AT THE SLV: A DEPOSIT OF 2.217 MILLION OZ INTO THE SLV////INVENTORY RESTS A 548.071 MILLION OZ//
MARCH 7/WITH SILVER UP 40 CENTS TODAY: NO CHANGES IN SILVER INVENTORY AT THE SLV//INVENTORY RESTS AT 545.854 MILLION OZ//
MARCH 4/WITH SILVER UP 50 CENTS TODAY: NO CHANGES IN SILVER INVENTORY AT THE SLV//INVENTORY RESTS AT 545.854 MILLION OZ/
SLV FINAL INVENTORY FOR TODAY: 577.941 MILLION OZ//
PHYSICAL GOLD/SILVER STORIES
1.PETER SCHIFF
Peter Schiff: The Risk Of A Market Crash Keeps Growing
WEDNESDAY, APR 20, 2022 – 01:45 PM
Bonds continue to get hammered.

On Tuesday morning, the yield on the 10-year Treasury rose above 2.9%, and the yield on the 30-year is knocking on the door of 3%. Since bond yields rise as bond prices fall, this indicates a serious decline in the bond market. In his podcast, Peter Schiff said that at some point, the market is going to actually crash.
A crash is coming. Because, if the bond market doesn’t crash, the stock market will. And if the bond market does crash, well then, the stock market is going to crash too. So, either way, at some point you’re going to get some kind of crash.”
The last time bond yields were this high was in late 2018. The target Fed funds rate at that time was 2.25% to 2.5%.
So, that was the highest the Fed was able to raise rates, and they had to start cutting them because that 3% yield was doing a lot of damage to the economy, as were the two-and-a-quarter to two-and-a-half Fed funds. Well, the Fed funds rate is still at .25 to .5 now. The Fed has only hiked rates once by 25 basis points. And we’re already almost at 3%. … So, yields are already where they were when the Fed funds rate was 2% higher than it is right now.”
If the Fed actually succeeds in raising short-term rates back to 2.5%, by then, you should see bond yields above 5%.
Does anybody believe that the economy can handle 5%? We couldn’t even handle 3% in 2018 when we had a lot less debt than we have now.”
Peter said the thing that should really scare investors in both the bond and stock markets is just how fast yields rose to 3% even though the Federal Reserve has barely started to move.
We’ve already reached the level where the economy broke down in 2018 because of how much interest rates had already risen.”
Remember, in 2018, when the economy reached this level, the Fed stopped tightening. It began cutting interest rates, and it relaunched quantitative easing. This fact gets lost in the extraordinary monetary policy we got in response to the COVID lockdowns. But the Fed was already loosening before the pandemic.
There is another thing the Fed was doing in 2018 that it’s only just now talking about — balance sheet reduction. In fact, the balance sheet is still growing.
The question is: if the Fed is talking about fighting inflation and they’re serious, why do they continue to create inflation? If the Fed is really going to aggressively shrink its balance sheet, why does it continue to expand its balance sheet? And if the US bond market is this weak when the Federal Reserve is still buying bonds, imagine how much weaker it’s going to get when the Federal Reserve not only stops buying but actually starts selling, which is exactly what they are indicating they are about to do. This is why I’m saying that a crash could be imminent in the stock market when stock investors actually come to terms with the reality of what’s going on in the bond market and what it portends for the economy and corporate earnings.”
In this podcast, Peter also talks about the weakness in the technology and cryptocurrency sectors, strength in gold and silver mining stocks, the high levels of inflation and how far the Fed has fallen behind the curve, and the Musk takeover bid for Twitter.
END
2.LAWRIE WILLIAM//,//Egon von Greyerz///Matthew Piepenburg via GoldSwitzerland.com, James RICKARDS/
3. Chris Powell of GATA provides to us very important physical commentaries
END
4.OTHER GOLD/SILVER COMMENTARIES
It Is “Just A Matter Of Time” Before Gold Rises 5x Or More: Lawrence Lepard
WEDNESDAY, APR 20, 2022 – 10:15 AM
Submitted by QTR’s Fringe Finance
Friend of Fringe Finance Lawrence Lepard released his most recent investor letter a few days ago with his updated take on the seismic changes occurring in monetary policy globally as a result of the Russia/Ukraine conflict.
He takes us through history as to how this landscape has changed in the past, and what could be coming in years ahead.
Larry had joined me for several interviews last year and I believe him to truly be one of the muted voices that the investing community would be better off for considering. He’s the type of voice that gets little coverage in the mainstream media, which, in my opinion, makes him someone worth listening to twice as closely.
Larry was kind enough to allow me to share his most recent thoughts. Part 1 is below, where he lays out his case for massive upside in gold, and Part 2 will be published later this week.
Reviewing the history and structure of the world monetary system is instructive given recent political developments with the kinetic war launched by Russia in the Ukraine. It can help us as we try to determine what happens next (Many of you know this, but allow us to review).
Bretton Woods I: 1944-1960s Period
Toward the end of World War II, in July 19441, the leaders of the free world convened a monetary conference in Bretton Woods, NH to establish the rules for a post war monetary system. This is now referred to as Bretton Woods I.
At this conference, the US Dollar was made the international reserve currency for the world financial system. The dollar would be backed by gold and could be exchanged for bullion at the price of $35 per ounce. (US citizens did not have that exchange privilege due to Roosevelt’s 1933 Executive Order 6102, which made it illegal for US citizens to own gold; this was repealed in 1975).
All other foreign currencies would be pegged to the dollar at fixed exchange rates.
The exchangeability of dollars for gold was credible because the US had 650,000 ounces (20.5 metric tonnes) of gold on deposit. In the early post war period, this arrangement worked fairly well, and the dollar was further supported because the US was the leading industrial nation; Japan and Germany’s economies had been devastated by the war.
From 1946-1957, US economic growth was solid, and the US Federal government was generally fiscally responsible and ran budget surpluses in 6 of those 11 years. Deficit years contained small deficits and only the Korean conflict spiked the annual deficit in 1953. Inflation was present in the late 1940’s and 1950’s, but the Fed kept interest rates in check through financial repression (yield curve control). The US dominated the world militarily. US economic growth was robust as returning GI’s started families, bought houses and cars.
The US was a net exporter with a positive balance of trade. There was a high level of trust in the dollar and its exchangeability for gold was a backstop.
1960s: Deficits Drive a “Run on Gold” and the Ultimate Failure of the London Gold Pool
However, the pot started to boil in the 1960’s with the US entering the Vietnam War, along with President Johnson’s “Great Society” social programs (welfare, Medicare, Medicaid). This spending was called “Guns and Butter” at the time and led to significant US Fiscal deficits.
The net result of these deficits, and the monetization (money printing) employed to finance them, was that foreign creditors began to doubt the value of the dollar as measured in gold terms. Thus, many of those creditors began to take the US up on its offer to exchange dollars for gold.
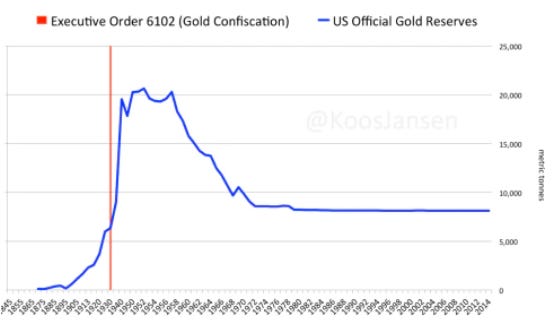
As you can see in the chart below, the trend of foreigners exchanging dollars for US gold bullion began in 1959 when the US ran a fiscal budget deficit of $13 billion (at the time considered very large). Those deficits persisted and grew throughout the 1960’s, and so did the outflow of US Treasury gold.
The leader in the repatriation effort was France, and its President Charles de Gaulle, who was advised by economist Jacques Reuff.
Reuff pointed out that the US Dollar, as the world’s reserve currency, enjoyed an “exorbitant privilege” where foreigners see themselves supporting American living standards. As American economist Barry Eichengreen summarized:
“It costs only a few cents for the Bureau of Engraving and Printing to produce a $100 bill, but other countries had to pony up $100 of actual goods in order to obtain one.”
This was the first instance of the world recognizing that the US Dollar as the world’s reserve currency allowed Americans to live better at the expense of the rest of the world – but it would not be the last.
As the chart above shows, the run on US gold that began in 1959 accelerated throughout the 1960’s. The US deficits from the Vietnam war grew larger, culminating in a US fiscal deficit of $25 billion in 1968 (again – deemed to be a very large deficit at that time), a figure that had not been exceeded since WW II.
(This post is free but if you have the means and would like to support my work, I’d love to have you as a subscriber by clicking here).
In fact, the free market price of gold in London was trading above the official $35 reference price. Investors realized that the US fiscal position was untenable, and foreigners who could legally buy gold were turning their dollars in for gold – well above $35 per ounce for delivery in London. Countries were also taking delivery of gold directly from the US treasury in exchange for the dollars that they had earned in trade.
This was now an accelerating bank run on gold. To mitigate this problem, in the 1960s a group of Central Banks formed the London Gold Pool in an effort to keep the free-market gold price close to the Bretton Woods reference price of $35.
These Central Bankers manipulated the price of gold through strategic selling, and threats of selling of paper gold. However, the run on gold situation in the 1960s ratcheted up in 1967. Overwhelmed by the demand for physical gold, the British were forced to devalue the Pound Sterling by 14% and gold was trading at $50 per ounce.
One by one and led by France, the Central Banks exited the London Gold Pool following 1967 and it failed.
1970s: Nixon Closes Gold Window, Given the Run on Gold
Failure of the London Gold Pool’s manipulation only buoyed physical demand for gold, as all recognized that gold is the ultimate form of scarce and sound money.
The US gold reserves were being drained at a very rapid rate; there was massive pressure on the dollar. On August 15, 1971, President Nixon (who had no interest in, or ability to, contain the war spending) “temporarily” closed the US gold window to thwart the “evil international speculators”.
Consequently, without the promised gold exchangeability, the US government had effectively defaulted on its foreign creditors. We were bankrupt, and confidence in the dollar was fading fast. The impact of the US abandoning the international convertibility of the dollar into gold did not take long to stimulate the price of gold.
The US Treasury Secretary, John Connally, went to the G-10 meetings in Rome in late 1971, after the default, and brazenly said “the dollar is our currency, but it is your problem”.
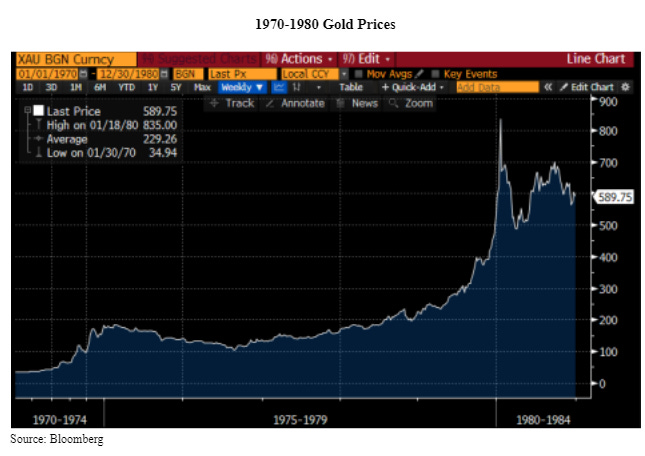
The sentiment was not lost on the other participants and the gold price responded accordingly:
Paper Gold Suppression
What is instructive about this history of gold price suppression is that the London Gold Pool tried to manipulate the gold price from 1962 to 1968, somewhat successfully, but ultimately physical gold demand overwhelmed the manipulation scheme and it failed.
Over the past 20 years, there is substantial evidence that a similar manipulation scheme has been used by Central Banks, the Bank of International Settlements (BIS) and the Fed, whereby they “sell” paper gold contracts to keep gold prices down.
Gold is the only commodity market where there are large, unallocated paper derivatives which many in the Gold community believe have been used to suppress and contain its price. The evidence for this is overwhelming and buried in many places. Suffice it to say, many analysts believe that there are between 20x, 50x and perhaps up to 1,000x paper claims on each physical ounce of gold in the world today.
In effect, the Central Banks, Sovereign Governments and London Bullion Market Association (LBMA) have run a fractional reserve gold market. This scheme will only stay intact if everyone who holds a paper claim on gold does not ask for actual physical delivery (i.e., another run on physical gold like the late 1960s).
Conversely, if all of the claims were presented and asked to provide physical ounces (e.g. think short squeezes in Gamestop in 2021, or more recently nickel) there would either be a Force Majeure (similar to what happened recently in nickel) or the gold price would rise to multiples of its current price to match supply with demand.
We believe that the gold price has been severely suppressed by Western Governments in order to mask the underlying inflation or dilution of value which has taken place in order to support fiat currencies, Keynesian economics, Western government social policies, and credit inflation. Even with this suppression, the price of gold has performed quite well over the long sweep of time since 1971. Note the chart below shows the decline in US Dollars priced in gold terms.
There are some interesting things in this chart above. First, you can see the effect of the raging inflation in the 1970’s (red line above) when gold went from $35 per ounce to $800 per ounce (inverted white line). Note that at $800 an ounce gold in 1980, the US Money Supply (M1) was nearly 55% backed by our gold reserves.
If the price of gold had been $1,459 in 1980, every dollar would have had 100% gold backing. So even though we were not legally on a gold standard the market had effectively taken us more than halfway there by 1983.
It is also interesting to see M1 money supply (green line above) and how much it has skyrocketed since the 2008 crisis and bank bailouts. It is interesting to consider these numbers in today’s terms which show how much the gold price has been artificially suppressed as a measure of monetary inflation. Today, in order to obtain the bare minimum (30% coverage) necessary to have the US Treasury reserves of gold backing the dollar, the price of gold would need to be $23,000 per ounce, and to get to the 1980 peak of 55%% coverage of M1, the price would be $42,000 per ounce vs. gold today at only $1,970 per ounce. Indeed, there has been quite a bit of monetary inflation in terms of gold!
As concerns our portfolio upside, we think it’s just a matter of time until we get that mid-late 1970s 5x+ gold price acceleration. The reason this has not shown up in the gold price is due to the suppression scheme which until recently was perfected by the Western Central banks and the Gold Cartel. Some Bitcoin enthusiasts like to say Bitcoin is going to steal all of gold’s monetary premium. Gold bugs laugh at this because there is not much premium in gold to steal. On average, gold costs about $1,200 per ounce to mine and the sales price of $1,970 barely compensates for the capital costs to build mines and replace reserves.
If gold were to trade at much higher prices, then perhaps there would be a monetary premium to steal.
(This post is free but if you have the means and would like to support my work, I’d love to have you as a subscriber by clicking here).
Part 2 of Larry’s letter, where he discusses Bretton Woods III and the state of monetary policy from 1980 onward will be published this week.
About Larry Lepard
Larry manages the EMA GARP Fund, a Boston based investment management firm. Their strategy is focused on providing “Monetary Debasement Insurance”. He has 38 years experience and an MBA from Harvard Business School. On Twitter he is @LawrenceLepard Managing Partner and, via email, he is llepard@ema2.com
Disclaimer: QTR is long various gold and silver miners and have both long and short exposure to the market through equities and derivatives. I have no position in Larry’s funds. Larry is a subscriber to Fringe Finance and has been on my podcast. The excerpts from Larry’s letter, above, shall not be construed as an offer to sell, or the solicitation of an offer to sell, any securities or services. Any such offering may only be made at the time a qualified investor receives from EMA formal materials describing an offering plus related subscription documentation. There is no guarantee the Fund’s investment strategy will be successful. Investing involves risk, and an investment in the Fund could lose money. The strategy is also subject to the following risks: Currency Risk, Non-US Investment Risks, Issuer Specific Risk
end.
5.OTHER COMMODITIES RICE
Global Rice Production Set To Plunge 10%, Threatening Half Of Humanity
WEDNESDAY, APR 20, 2022 – 04:15 AM
Farmers in China, India, Bangladesh, Indonesia, and Vietnam — the largest rice-producing countries could experience reduced output due to soaring fertilizer prices.
The International Rice Research Institute warns that harvests could plunge as much as 10% in the next season, equating to about 36 million tons of rice, or enough food to feed a half billion people, according to Bloomberg.
Chemical fertilizers, such as nitrogen, phosphorus, and potassium, are the most applied nutrients for high-yielding rice cultivation. Farmers have been particularly vulnerable to soaring fertilizer prices as some have reduced the amount of nutrients to save costs. This threatens future harvests as production declines could stoke food inflation for a crop that feeds half of humanity.

Humnath Bhandari, a senior agricultural economist at the institute, said the 10% drop in global rice production is a “very conservative estimate.” He said if the Ukraine conflict continued and fertilizer prices remained high and supply limited, then the decline of rice output could be even more severe. This may trigger a full-blown global food crisis, similar to the one that the UN has been warning about.
Russia and Belarus are big suppliers of every major type of crop nutrient. Western countries have sanctioned both, which have limited fertilizers shipments to the rest of the world, crimping supply and why prices are soaring. On top of this, Moscow has reduced or halted nutrient exports.
Nguyen Binh Phong, the owner of a fertilizer shop in Vietnam’s Kien Giang province, said nutrient costs have soared three-fold over the past year, forcing farmers in the region to reduce fertilizer use by up to 20% because of rising prices.
“When the farmers cut fertilizer use, they accept that they will get lower profit,” Phong said.
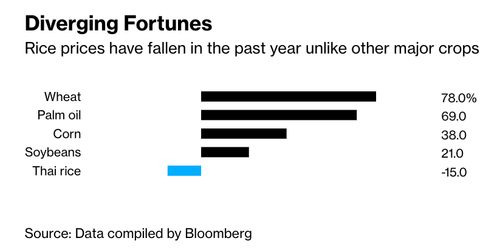
Bloomberg outlines a significant problem: Unlike most crop prices, the price of rice has gone down, not up, which will compress farmers’ margins even more.
Governments across Asia have kept rice prices under control to maintain social order. Some countries offer generous fertilizer subsidies to farmers to keep yields plentiful. For example, India will spend $20 billion this year to shield farmers from soaring nutrient prices, up from the $14 billion budget before the Russian invasion of Ukraine.
Bhandari said it’s “inevitable” that rice prices will go higher; “It has to be reflected somewhere.”
Maybe the world is in the beginning stages of a food crisis and could worsen next year as crops of all sorts could experience harvest declines because farmers are spreading fewer nutrients due to high prices.
Global food prices will remain at record-highs (or at least elevated levels) as forward-looking markets expect tightening supplies in 2023. This will give rise to continued social unrest (see: here & here) as the dominos fall in the weakest countries.
end
COMMODITIES IN GENERAL
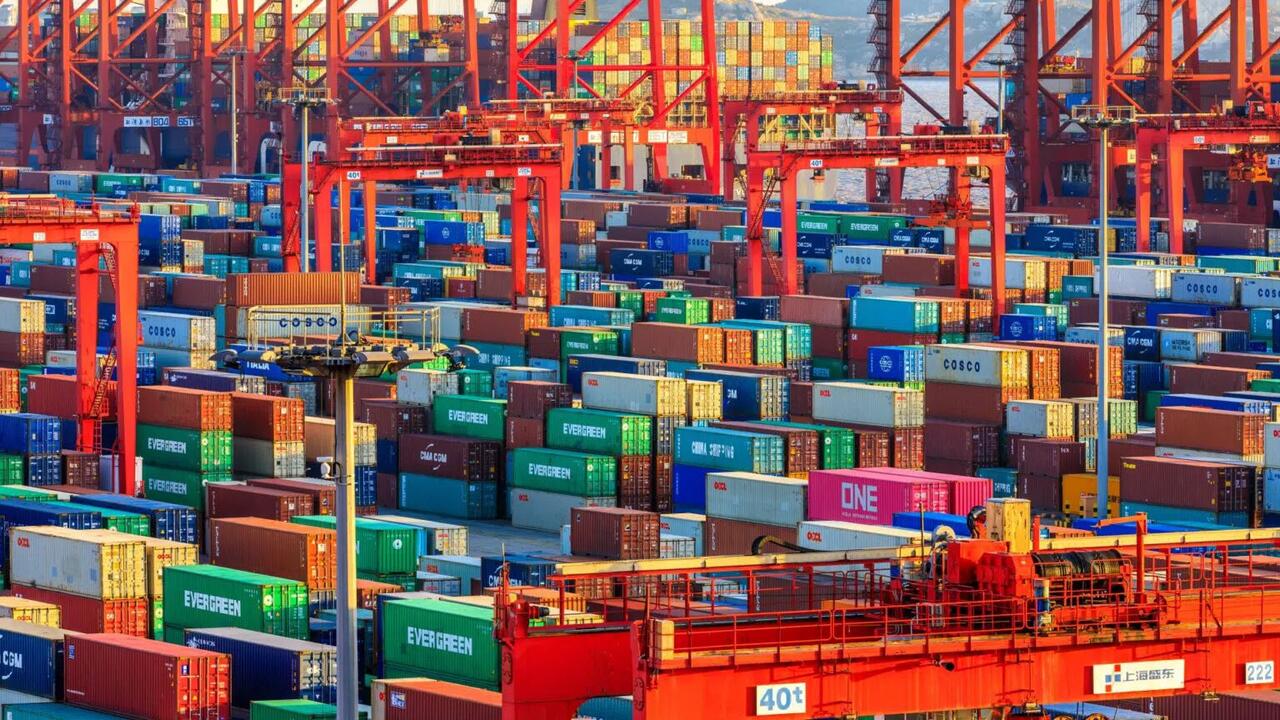
Get Ready For The Next Supply Chain Shockwave
TUESDAY, APR 19, 2022 – 04:50 PM
By Eric Kulisch of FreightWaves
Concern is growing that the spread of COVID cases and city lockdowns in China will have massive downstream effects for global supply chains that could dwarf previous disruptions since the start of the pandemic.
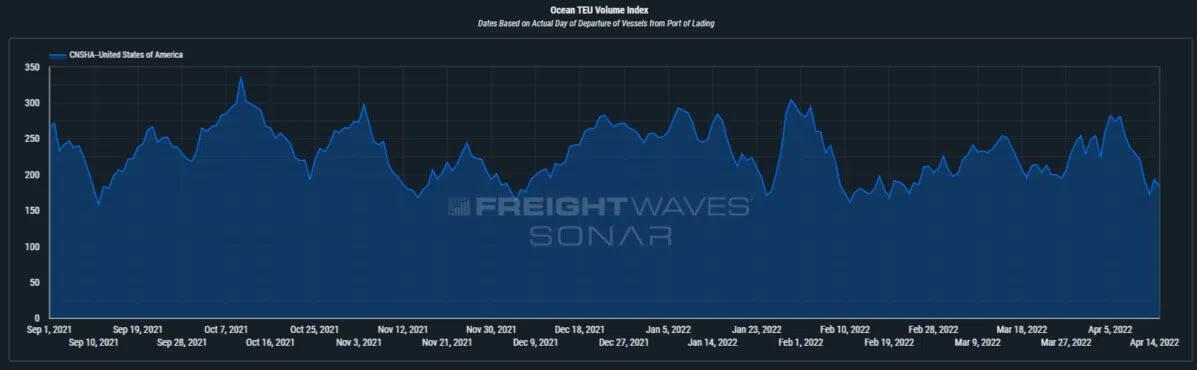
Last May, the huge Yantian container terminal at the Port of Shenzhen throttled down to 30% of normal productivity for a month to stamp out a handful of positive cases there. Hundreds of thousands of shipments that couldn’t enter the port accumulated in factories and warehouses, and many vessels skipped the port to avoid waiting seven days or more at anchor. It took weeks after the port reopened to clear the cargo backlog. The effects cascaded to the U.S. and Europe, resulting in port traffic jams, transit times triple the norm and missed retail deliveries for the holidays.
The difference this time is that an entire metropolis — and highly interconnected global trade center — is essentially shut down. Not since the initial 2020 COVID-19 outbreak in Wuhan have lockdowns been this extensive in China.
“It’s probably worse than Wuhan,” said Jon Monroe, an ocean shipping and supply chain expert who runs a consulting firm. “You’re going to have a lot of pent-up orders. It’s going to be an overwhelming movement of goods” that will drown shipping lines and ports once the lockdowns are lifted.
Freight is piling up
Twenty-five million people in Shanghai have been sequestered for 18 days. Chinese authorities this week slightly eased the restrictions, dividing the city into three categories based on previous screenings and risk levels. People can wander outside their apartment buildings but are encouraged to stay home in neighborhoods with no positive COVID-19 cases in the past two weeks. Those in high-risk areas must still shelter at home.
Spanish financial services firm BBVA predicts Chinese authorities will stick to the “zero-COVID” strategy and lockdowns until at least June. Other China observers say it could take even longer to meet China’s infection standard.
Shanghai is one of the largest manufacturing centers in China, with heavy concentrations of automotive and electronics suppliers. It is home to the largest container port in the world and a major airport that serves inbound and outbound air cargo. Exports produced in Shanghai account for 7.2% of China’s total volume and about 20% of China’s export container throughput moves through the port there, according to the BBVA report.
Most warehouses and plants are closed, nine out of 10 trucks are sidelined, the port and airport have limited function, shipping units are stranded in the wrong places, and freight is piling up.
More and more, the logistics impacts are rippling beyond the contagion epicenter.
Impacts spread beyond Shanghai
Export containers that were already at the Port of Shanghai when the lockdown started are making it onto vessels, but most goods booked on outbound vessels are stranded at warehouses because shuttle trucks can’t make pickups or deliveries.
Truckers require special permits, which are only good for 24 hours, as well as negative COVID tests to get in and out of the city or enter certain zones, according to logistics providers. Checking COVID certificates has led to huge traffic jams at the port.
The French logistics provider Geodis reports that truck drivers in the Shanghai area are being forced to wait up to 40 hours at certain highway entrances. Trucking rates have soared because of the limited supply, and shippers are waiting three to five days for cargo to get picked up, according to San Francisco-based Flexport.
Reduced manufacturing output, along with limited truck access to the port and airport, are causing a significant drop in air and ocean export volumes. Less demand is translating to lower freight rates.
In response to the lack of labor and cargo, air carriers have announced widespread cancellations, and some ocean carriers are skipping Shanghai port calls.
Several shipping lines have also begun offloading refrigerated containers at other ports along their voyage because the storage area with electric plugs is too crowded in Shanghai. Customers face extra port fees and delays routing the cargo to its intended destination. Maersk, the second-largest container vessel operator, said Thursday it has stopped accepting bookings to Shanghai for refrigerated cargo, some types of gas and flammable liquids.
More omissions are expected and liner companies may temporarily idle vessels or cancel some outbound Asia sailings altogether, according to Crane Worldwide Logistics and other service providers.
Asia-U.S. East Coast rates have fallen 7% since the outbreaks in March, said freight booking site Freightos, which also publishes an ocean rate index.
“But even if the lockdown persists and demand drops significantly, ocean carriers will likely reduce capacity which could keep rates from plummeting, just as they were able to do in the first few months of the pandemic when ocean volumes fell significantly but transpacific rates declined by less than 15% and were about level year on year,” it said.
The supply chain is backing up like water behind a dam. When water is released, the landscape gets flooded.
At Shanghai Pudong airport, ground handling companies are operating with skeleton staff.
Shanghai Eastern Airlines Logistics, a cargo terminal operator, ceased bulk loading of containers after a positive COVID case, which will further slow cargo processing, said Dimerco, a Taiwan-based freight forwarder. Airlines report that Pactl, which operates three other cargo terminals, has suspended acceptance of dangerous goods and temperature-controlled cargo because the warehouse is full.
Flexport said in a market update that 80% of commercial freighter services have been canceled and airlines are considering shifting operations to nearby airports. Qatar Airways announced that freighter flights will remain canceled until next Thursday, saying “the latest COVID-19 restrictions announced by local authorities limit our ability to operate flights in and out of Shanghai with sufficient cargo loads.”
Freight forwarders have been rerouting cargo to alternative airports such as Zhengzhou, Xiamen, Shenzhen and Beijing, as well as the Port of Ningbo, but those facilities are beginning to feel congestion effects themselves. Rates to ship from those locations are increasing.
Flights at Zhengzhou Xinzheng International Airport are reduced by 50%, according to Geodis. Most inbound cargo there is transit cargo to other cities, such as Shanghai — which is compounding backlogs because the cargo isn’t allowed to move to the final destination. That means logistics companies can only clear shipments that customers can pick up in Zhengzhou.
Dimerco advises that Zhengzhou airport is not accepting loose cargo – only palletized shipments – because of labor challenges. And it has just implemented a 14-day closed-loop program in which workers live on-site to minimize the potential for virus transmission, forcing the logistics provider to pivot again and reroute shipments to other airports, including back to Shanghai’s second airport – Hongqiao International.
Everstream Analytics, which helps companies manage supply chain risk, predicts U.S. and Canadian automotive assembly plants will quickly face delays and disruptions because the lockdowns will affect shipping of parts such as seats, tires, engines, bodies and brakes.
Ships delayed at port of Hong Kong and Yantian
Shipping schedules in South China are being impacted by irregular feeder vessels and large barge services, creating delays for transoceanic vessels at the ports of Hong Kong and Yantian, according to a situational update from supply chain data platform project44. Both ports have been coping with disruptive COVID restrictions for months.
Nearby manufacturing hubs in Vietnam and Cambodia are already suffering from a shortage of Chinese components for their manufacturing industries, project44 reported. And pharmaceutical companies in India, which source 70% of their active ingredients from China, are facing limited supplies.
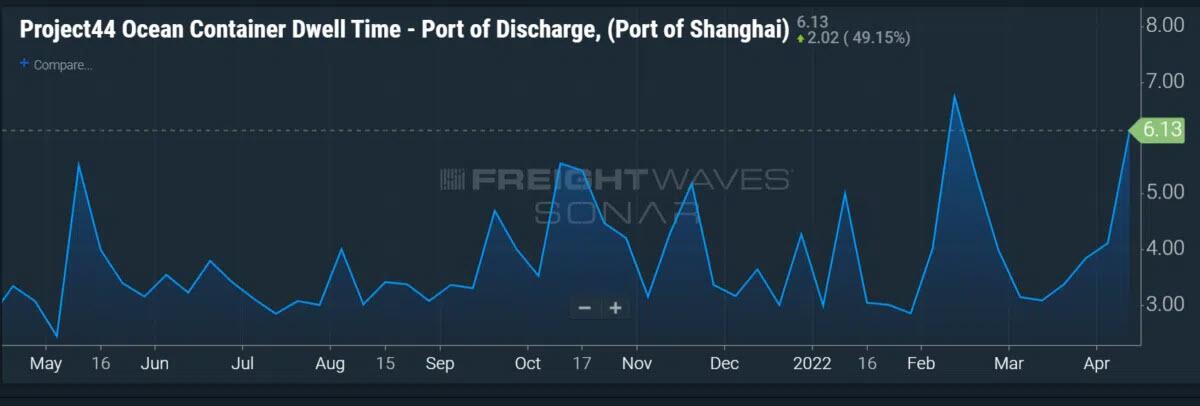
Ocean shipping delays from the top three Chinese ports to Hamburg, Germany, and Amsterdam had already doubled to more than 12 days during the first quarter, before the Shanghai lockdown fully materialized, according to project44 data.
Ocean freight expert Lars Jensen, CEO of Vespucci Maritime, summed up the situation on his LinkedIn page this way: “Until this situation is resolved — which appears next to impossible when matching the omicron variant with zero-tolerance — we should expect drops in export demand, port omissions and more blank sailings in the near term future as well as Shanghai-bound cargo increasingly being discharged elsewhere.”
COVID lockdowns spread
Meanwhile, COVID infections are spreading beyond Shanghai, according to news reports and logistics companies. The southern manufacturing hub of Guangzhou, for example, has started mass COVID testing, introduced travel restrictions and shifted schools to online learning — steps that often portend a wider lockdown.
The city of Kunshan — an important production center for electronics near Shanghai — is closed down until April 19. Part of Taicang, another manufacturing area in Jiangsu province, is also locked down. A surge of new COVID cases is hitting the coastal cities of Dalian and Tianjin in the north, Ningbo in the east, and Xiamen and Dongguan in the south.
Ningbo officials ordered residents in two downtown districts to sequester at home, but so far the seaport is not affected. Nantong is on a partial lockdown until April 15. Port operations have been severely impacted, with logistics companies diverting shipments to Nanjing. Zhangiagang is also under partial lockdown until April 19, resulting in slower port operations and some factory closures.
Many shippers are exercising contingency plans and using alternative import/export gateways when possible, but road transport is increasingly difficult.
The outbreaks have led to a virtual ban by authorities on truck drivers from high- and medium-risk areas transporting cargo to low-risk areas. That includes transporting cargo from Shanghai and Kunshan to the Port of Ningbo. No cargo will be accepted if drivers have been to medium- or high-risk areas within the last 14 days or the factory is located in medium- or high-risk areas, said UPS Supply Chain Solutions in a customer update.
As of Friday, Dalian, Tianjin, parts of Beijing, Shanghai, and Dongguan are all in high- and medium-risk areas.
Dimerco said in a notice that traffic control for road transportation is getting more strict and it is difficult to secure trucks to bring freight to Shanghai or alternative ports.
Lockdowns ease U.S. supply chain strains before flood of cargo
The slowdown in China exports should provide temporary relief to congestion-plagued U.S. ports on both coasts, as well as in Europe, but logistics experts say the breather is likely to be followed by a tsunami of deferred cargo once the lockdowns are lifted. The cargo volume will far exceed the handling capability of the ports, with containers jamming up terminals faster than they can be transferred to inland transport and pushing vessels into long queues at sea.
Delta Air LInes President Glen Hauenstein said on an earnings call Wednesday that once the Shanghai restrictions are lifted, the airline expects a boom in cargo bookings that more than offsets the current export lag.
A mass quarantine that lasts until June could mean the drawdown of backlogged air and ocean freight pushes into the peak shipping season, as more volume enters the system.
“Even with air and ocean ports open, the length of the shutdown could make this iteration the most significant logistics disruption since the start of the pandemic,” Freightos said in its update.
6.CRYPTOCURRENCIES
7. GOLD/ TRADING
Your early currency/gold and silver pricing/Asian and European bourse movements/ and interest rate settings WEDNESDAY morning 7:30 AM
ONSHORE YUAN: CLOSED DOWN 6.4131
OFFSHORE YUAN: 6.4431
HANG SANG CLOSED UP DOWN 83.09 PTS OR 0.40%
2. Nikkei closed UP 232.76PTS OR 0.86%
3. Europe stocks ALL GREEN
USA dollar INDEX DOWN TO 100.45/Euro RISES TO 1.0829
3b Japan 10 YR bond yield: RISES TO. +.244/ !!!!(Japan buying 100% of bond issuance)/Japanese yen vs usa cross now at 128.19/JAPANESE FALLING APART WITH YEN FALTERING AS WELL AS LONG TERM YIELDS RISING BREAKING THE JAPANESE CENTRAL BANK.
3c Nikkei now ABOVE 17,000
3d USA/Yen rate now well below the important 120 barrier this morning
3e Gold UP /JAPANESE Yen DOWN CHINESE YUAN: DOWN -SHORE CLOSED UP// OFF- SHORE DOWN
3f Japan is to buy the equivalent of 108 billion uSA dollars worth of bond per month or $1.3 trillion. Japan’s GDP equals 5 trillion usa./“HELICOPTER MONEY” OFF THE TABLE FOR NOW /REVERSE OPERATION TWIST ON THE BONDS: PURCHASE OF LONG BONDS AND SELLING THE SHORT END
Japan to buy 100% of all new Japanese debt and by 2018 they will have 25% of all Japanese debt. Fifty percent of Japanese budget financed with debt.
3g Oil UP for WTI and DOWN FOR Brent this morning
3h European bond buying continues to push yields lower on all fronts in the EMU. German 10yr bund fallS TO +.0.848%/Italian 10 Yr bond yield FALLS to 2.47% /SPAIN 10 YR BOND YIELD FALLS TO 1.78%…ITALIAN 10 YR BOND YIELD/GERMAN BUND: 1.62: DANGEROUS FOR THE ITALIAN BANKING SYSTEM
3i Greek 10 year bond yield FALLS TO : 2.48
3j Gold at $1949.35 silver at: 25.10 7 am est) SILVER NEXT RESISTANCE LEVEL AT $30.00
3k USA vs Russian rouble;// Russian rouble UP 1 & 1/4 roubles/dollar; ROUBLE AT 77,22
3m oil into the 104 dollar handle for WTI and 108 handle for Brent/
3n Higher foreign deposits out of China sees huge risk of outflows and a currency depreciation. This can spell financial disaster for the rest of the world/
JAPAN ON JAN 29.2016 INITIATES NIRP. THIS MORNING THEY SIGNAL THEY MAY END NIRP. TODAY THE USA/YEN TRADES TO 127.88 DESTROYING JAPANESE CITIZENS WITH HIGHER FOOD INFLATION
30 SNB (Swiss National Bank) still intervening again in the markets driving down the FRANC. It is not working: USA/SF this morning .9467– as the Swiss Franc is still rising against most currencies. Euro vs SF 1.0253 well above the floor set by the Swiss Finance Minister. Thomas Jordan, chief of the Swiss National Bank continues to purchase euros trying to lower value of the Swiss Franc.
USA 10 YR BOND YIELD: 2.865 DOWN 5 BASIS PTS
USA 30 YR BOND YIELD: 2.931 DOW 6 BASIS PTS
USA DOLLAR VS TURKISH LIRA: 14.66
Futures Recover Losses After Netflix Disaster; 10Y Real Yields Turn Positive
WEDNESDAY, APR 20, 2022 – 08:02 AM
US index futures were little changed, trading in a narrow, 20-point range, and erasing earlier declines as a selloff in bonds reversed with investors also focusing on the catastrophic Q1 earnings report from Netflix. Nasdaq 100 Index futures slipped 0.2% by 7:15 a.m. in New York, recovering from an earlier drop of as much as 1.2%; the Nasdaq 100 has erased $1.3 trillion in market value since April 4 as bond yields have been surging on fears of rate hikes. S&P 500 futures also recouped losses to trade little changed around 4,460. Treasuries rallied and 10Y yields dropped to 2.86% after hitting 2.98% yesterday. The dollar dropped for the first time in 4 days after hitting the highest level since July 2020, and gold was flat while bitcoin rose again, hitting $42K.
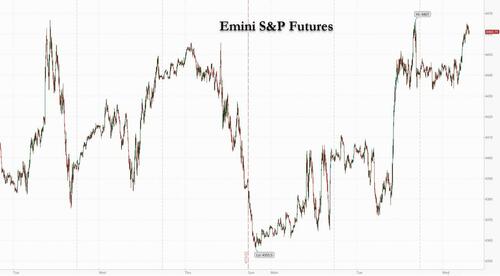
In perhaps the most notable move overnight, US 10-year real yields turned positive for the first time since March 2020, signaling a potential return to the pre-pandemic normal. But that was quickly followed by a global drop in bond yields as investors assessed growth challenges from the Ukraine war and the potential for a peak in inflation.
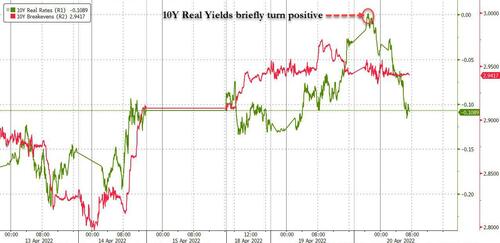
“Real yields matter for equities,” Esty Dwek, chief investment officer at Flowbank SA, said in an interview with Bloomberg Television. “It’s another aspect for the valuation picture that isn’t helping. It shouldn’t be that much of a surprise to see real yields are back closer to zero again. We’re pricing in so much bad news already between inflation and the hikes and war and supply chains.”
10-year Treasurys yield shed 7 basis points in choppy session after as money managers from Bank of America to Nomura indicated the panic over inflation has gone too far: “Our forecasts point to inflation peaking this quarter and falling steadily into 2023,” BofA analysts including Ralph Axel wrote in a note. “We believe this will reduce the panic level around inflation and allow rates to decline.” Bank of America also said it has turned long on 10-year Treasuries.
Elsewhere, Japan’s 10-year yield holds at 0.25%, the top of Bank of Japan’s trading band as the central bank resumes massive intervention. Despite the BOJ’s dovish commitment to keep rates low, the Japanese yen rebounded from a 13-day slump and gold extended its decline.
Going back to stocks, Netflix shares which have a 1.2% weighting in the Nasdaq, sank 27% in premarket trading after the streaming service said it lost customers for the first time in a decade and forecast that the decline will continue. The shares were downgraded at many firms including UBS Group AG, KGI Securities and Piper Sandler. Other streaming stocks including Walt Disney and Roku also slipped. IBM, on the other hand, rose 2.5% after reporting revenue that beat the average analyst estimate on demand for its hybrid-cloud offerings. Analysts acknowledged the strong quarter of revenue performance. A dimmer outlook for corporate earnings as well as the rise in yields have dented demand for risk assets, with investors preferring defensive stocks such as healthcare to growth-linked stocks, which come under greater pressure from higher interest rates. Some other notable premarket movers:
- Interactive Brokers (IBKR US) shares fell 1.1% in after-market trading as net income missed analysts’ consensus estimates. Still, analysts at Piper Sandler and Jefferies are positive.
- Omnicom (OMC US) shares jumped 3.7% in postmarket. Its cautious outlook for the rest of the year could bring some positive surprises, according to analysts, after the company’s 1Q revenue beat estimates
In Europe, the Stoxx 600 rose 0.8%, led by banking and technology shares while miners underperformed as metals fell, as investors assessed a mixed bag of corporate results and the outlook for France’s presidential-election runoff on Sunday. There’s a divergence in performance of European stocks; Euro Stoxx 50 rallies 1.2%. FTSE 100 lags, adding 0.4%. Danone SA rose after reporting its fastest sales growth in seven years, and Heineken NV advanced after sales climbed. Here are some of the biggest European movers today:
- ASML shares rise as much as 8% with analysts saying the semiconductor-equipment group’s earnings show demand remains strong, even if a timing issue meant its outlook missed expectations.
- Danone shares gain as much as 9% following a French financial newsletter report that rival Lactalis may be interested in buying its businesses and after the producer of Evian reported a surge in bottled water revenue.
- Just Eat Takeaway shares rise as much as 7.7% after the company gave mixed guidance and said it is considering selling Grubhub. While analysts note the growth looks weak, they highlight the focus on profitability and the strategic review of Grubhub are positives.
- Vopak shares rise as much as 7.2%, most since March 2020, after the tank terminal operator reported higher revenues and Ebitda for the first quarter.
- Heineken shares rise as much as 5% after the Dutch brewer reported 1Q organic beer volume that beat analyst expectations and said net revenue (beia) per hectolitre grew 18.3%. Analysts were impressed by the company’s price-mix during the period.
- Rio Tinto shares fall as much as 3.9%. A production miss for 1Q could prevent the miner’s shares from recovering after recent underperformance, RBC Capital Markets says.
- Credit Suisse declines as much as 2.8% after the bank said it anticipates a first-quarter loss owing to a hit to revenue from Russia invading Ukraine and an increase in legal provisions.
- Oxford Biomedica drops as much as 10% after reporting full-year revenue that was below consensus. RBC Capital said reasons for the revenue miss were “unclear,” adding that there was no new business development news.
Asian stocks rose as Japanese equities rallied on the back of a weaker yen, which will support exports. Shares in China fell as investors were disappointed by the decision among banks to keep borrowing rates there unchanged. The MSCI Asia Pacific Index gained as much as 0.9% and was poised to snap a three-day losing streak. Japanese exporters including Toyota and Sony helped lead the way, with shares also stronger in Singapore, Malaysia and the Philippines. “It looks like the cheap yen may continue for a longer period than originally expected,” said Bloomberg Intelligence auto analyst Tatsuo Yoshida. “The weaker yen is good for all Japanese automakers.” China’s benchmarks bucked the uptrend and dipped more than 1%, as lenders maintained their loan rates for a third month despite the central bank’s call for lower borrowing costs to help an economy hurt by Covid-19 and geopolitical headwinds. China’s rate stall, together with last week’s smaller-than-expected cut in the reserve requirement, has led some investors to believe broad and significant policy easing is unlikely. “Doubts about access to easier funding remain a bugbear despite headline easing,” Vishnu Varathan, head of economics and strategy at Mizuho Bank, wrote in a note. “Inadvertent restraints on actual lending may mute intended stimulus, revealing risks of ‘too little too late’ stimulus.”
In positive news, daily covid cases in Shanghai were in downtrend in recent days and number of communities with more than 100 daily infections fell for three consecutive days, Wu Qianyu, an official with Shanghai’s health commission, says at a briefing.

Financial stocks outside of China gained after U.S. 10-year Treasury real yields turned positive for the first time since 2020 as traders continue to bet on a series of aggressive Federal Reserve rate hikes. This may pose more headwinds for Asian tech stocks, which have dragged the broader market lower this year.
Japanese equities rose for a second day after the yen weakened against the dollar for a record 13 straight days. Automakers were the biggest boost to the Topix, which climbed 1%. Financials advanced as yields gained. Fast Retailing and SoftBank Group were the largest contributors to a 0.9% gain in the Nikkei 225. The yen strengthened slightly after shedding nearly 6% against the dollar since the start of the month. “It looks like the cheap yen may continue for a longer period than originally expected,” said Bloomberg Intelligence auto analyst Tatsuo Yoshida. “The weaker yen is good for all Japaneseautomakers, “no one loses,” he added.
Indian equities snapped their five-day drop as energy companies advanced on expectations of blockbuster earnings, driven by wider refining margins. Software exporters Infosys, Tata Consultancy and lender HDFC Bank bounced back from a slump, triggered by weaker results. The S&P BSE Sensex gained 1% to 57,037.50 in Mumbai, while the NSE Nifty 50 Index rose 1.1%. The two gauges posted their biggest surge since April 4. Thirteen of the 19 sector sub-indexes compiled by BSE Ltd. climbed, led by a gauge of automobile companies. “A series of sharp negative reactions to minor misses in earnings from large caps points to a precarious state of positioning among investors,” according to S. Hariharan, head of sales trading at Emkay Global Financial. He expects corporate commentary on the margin outlook for FY23 to be key to investors’ reaction to other quarterly results, which will be released over the next couple of weeks. The benchmark Sensex lost about 5% in the five sessions through Tuesday, dragged lower by a selloff in software makers, a slump in HDFC Bank and its parent Housing Development Finance Corp. Foreign investors, who have been net sellers of Indian stocks since the start of October, have withdrawn $1.7 billion from local equities this month through April 18. The IMF slashed its world growth forecast by the most since the early months of the Covid-19 pandemic and projected even faster inflation. It expects India’s economy to grow by 8.2% in fiscal 2023 compared with an earlier estimate of 9%. Reliance Industries contributed the most to the Sensex’s gain, increasing 3%. Out of 30 shares in the Sensex index, 20 rose, while 10 fell.
In FX, the Bloomberg Dollar Spot Index fell 0.4%, its first drop in four days, after yesterday reaching its highest level since July 2020, as the greenback weakened against all Group-of-10 peers. Scandinavian and Antipodean currencies led gains followed by the yen, which halted a 13-day rout. The euro advanced a second day and bunds extended gains, underperforming euro-area peers as money markets pared ECB tightening wagers. The yen snapped a historic declining streak amid short covering after the currency approached a key level of 130 per dollar. The Bank of Japan stepped in to cap 10-year yields for the first time since late March as it reiterated its ultra loose monetary policy with four days of unscheduled bond buying. The Australian and New Zealand dollars gained as risk sentiment improved after a selloff in Treasuries paused. The Aussie was supported by offshore funds buying into contracting yield spreads with the U.S. and on demand from exporters for hedging at the week’s low, according to FX traders. The pound edged higher against a broadly weaker dollar, but lagged behind the rest of its Group-of-10 peers, with focus on the risks to the U.K. economy.
In rates, Treasuries advanced, reversing a portion of Tuesday’s sharp selloff which pushed the 10Y as high as 2.98%, with gains led by belly of the curve amid bull-flattening in core Focal points of U.S. session include Fed speakers and $16b 20-year bond reopening. US yields were richer by ~7bp across belly of the curve, 10-year yields around 2.87% keeping pace with gilts while outperforming bunds, Fed-dated OIS contracts price in around 222bp of rate hikes for the December FOMC meeting vs 213bp priced at Monday’s close; 49bp of hikes remain priced in for the May policy meeting. Japan 10-year yields held at 0.25%, the top of Bank of Japan’s trading band as the central bank resumes massive intervention. Australian and New Zealand bonds post back-to-back declines.
Coupon issuance resumes with $16b 20-year bond sale at 1pm New York time; WI yield at around 3.10% sits ~45bp cheaper than March result, which stopped 1.4bp through. IG dollar issuance slate includes Development Bank of Japan 5Y SOFR, Canada 3Y and ADB 3Y/10Y SOFR; six deals priced almost $19b Tuesday, headlined by financials including JPMorgan and Bank.
In commodities, crude futures advance. WTI trades within Tuesday’s range, adding 1.1% to around $103. Brent rises 0.9% to around $108. Most base metals trade in the red; LME lead falls 1.6%, underperforming peers. Spot gold falls roughly $4 to trade near $1,946/oz.
Looking at the day ahead now, and data releases include German PPI for March, Euro Area industrial production for February, US existing home sales for march, and Canadian CPI for March. From central banks, we’ll hear from the Fed’s Bostic, Evans and Daly, as well as the ECB’s Rehn and Nagel, whilst the Federal Reserve will be releasing their Beige Book. Earnings releases include Tesla, Procter & Gamble, and Abbott Laboratories. Finally, French President Macron and Marine Le Pen will debate tonight ahead of Sunday’s presidential election.
Market Snapshot
- S&P 500 futures down 0.4% to 4,443.50
- STOXX Europe 600 up 0.4% to 458.21
- MXAP up 0.5% to 171.88
- MXAPJ up 0.2% to 570.00
- Nikkei up 0.9% to 27,217.85
- Topix up 1.0% to 1,915.15
- Hang Seng Index down 0.4% to 20,944.67
- Shanghai Composite down 1.3% to 3,151.05
- Sensex up 0.9% to 56,945.14
- Australia S&P/ASX 200 little changed at 7,569.23
- Kospi little changed at 2,718.69
- German 10Y yield little changed at 0.88%
- Euro up 0.3% to $1.0823
- Brent Futures up 1.0% to $108.27/bbl
- Brent Futures up 1.0% to $108.27/bbl
- Gold spot down 0.3% to $1,943.30
- U.S. Dollar Index down 0.28% to 100.67
Top Overnight News from Bloomberg
- On the surface the yen looks like the perfect well for carry traders to dip into, under pressure from a Bank of Japan determined to keep local yields anchored to the floor even as interest rates around the world push higher. But despite consensus building for further losses — peers look like better funding options on certain key metrics
- Almost eight weeks after Vladimir Putin sent troops into Ukraine, with military losses mounting and Russia facing unprecedented international isolation, a small but growing number of senior Kremlin insiders are quietly questioning his decision to go to war
- French President Emmanuel Macron and nationalist leader Marine le Pen are gearing up for their only live TV debate on Wednesday evening, a high-stakes event just days before the final ballot of the presidential election this weekend
- China will continue strengthening strategic ties with Russia, a senior diplomat said, showing the relationship remains solid despite growing concerns over war crimes in Vladimir Putin’s war in Ukraine
A more detailed look at global markets courtesy of Newsquawk
APAC stocks eventually traded mostly positive after the firm handover from the US despite continued upside in yields. ASX 200 was led by the healthcare sector as shares in Ramsay Health Care surged due to a takeover proposal from a KKR-led consortium, but with gains capped by miners after Rio Tinto’s lower quarterly iron ore production and shipments. Nikkei 225 was underpinned by the initial currency depreciation and with the BoJ defending its yield cap. Hang Seng and Shanghai Comp were mixed with the mainland subdued after the PBoC defied expectations for a cut to its benchmark lending rates and instead maintained the 1yr and 5yr Loan Prime Rates at 3.70% and 4.60%, respectively.
Top Asian News
- Fed’s Aggressive Rate Hike Plans Jolt Policy in China and Japan
- BOJ Further Boosts Bond Buying as Yields Advance to Policy Limit
- Sunac Bondholders Say They Haven’t Received Interest Due Tuesday
- Regulators Under Pressure to Ease Loan Curbs: Evergrande Update
- China Buys Cheap Russian Coal as World Shuns Moscow
European bourses and US futures were choppy at the commencement of the European session, but, have since derived impetus in relatively quiet newsflow amid multiple earnings and as yields continue to ease; ES Unch. Currently, Euro Stoxx 50 +1.8%, while US futures are little changed on the session but rapidly approaching positive territory ahead of key earnings incl. TSLA. Netflix Inc (NFLX) – Q1 2022 (USD): EPS 3.53 (exp. 2.89), Revenue 7.87bln (exp. 7.93bln), Net Subscriber Additions: -0.2mln (exp. +2.5mln). Q1 UCAN streaming paid net change -640k (exp.+87.5k). Co. lost 640k subscribers in US/Canada, 300k in EMEA, and 350k in LatAm. Co. Said macro factors, including sluggish economic growth, increasing inflation, geopolitical events such as Russia’s invasion of Ukraine, and some continued disruption from COVID are likely having an impact, via PR Newswire. Click here for the full breakdown. -26% in the pre-market. Chinese Civil Aviation publishes prelim report looking into the China Eastern Airline crash; still recovering and analysing damaged black boxes from the plane: there was no abnormal communication between air crew and air controllers before the aircraft deviated from cruising altitude; no dangerous weather, goods or overdue maintenance.
Top European News
- Le Pen Upset Would Be as Big a Shock to Markets as Brexit
- Macron and Le Pen Set for High Stakes French Debate
- Riksbank Governor Leaves Door Open for String of Rate Hikes
- Danone Gains on Lactalis Takeover Speculation, Evian Rebound
- Heineken Rises; MS Says Results Were Widely Expected
FX:
- Buck concedes ground to recovering Yen as US Treasury yields recede, USD/JPY over 150 pips below new 20 year high circa 129.42.
- Yuan on the rocks after PBoC set a soft onshore reference rate and regardless of unchanged LPRs, USD/CNH eyes 6.4500 after breach of 200 DMA.
- Aussie back in pole position as high betas benefit from Greenback retreat and Kiwi in second spot ahead of NZ CPI data; AUD/USD rebounds through 0.7400 and NZD/USD from under 0.6750.
- Loonie also bouncing before Canadian inflation metrics, with Usd/Cad closer to 1.2550 than 1.2625, while Euro and Pound are both firmer on 1.0800 and 1.3000 handles respectively as DXY dips below 100.500.
- Rand shrugs aside mixed SA CPI prints as correction from bull run continues and Gold slips under Usd 1950/oz, USD/ZAR holds above 15.0000.
- ECB’s Kazaks says a rate hike is possible as soon as July this year; ending APP early in Q3 is possible and appropriate; zero is not an a cap for the deposit rate, via Bloomberg. Adds, a gradual approach does not mean a slow approach, do not need to wait for stronger wage growth.
Fixed Income:
- Debt redemption, as futures retrace following tests/probes of cycle lows.
- Lack of concession not really evident at longer-dated German and UK bond sales, but 20 year US supply may be a separate issue.
- BoJ ramps up intervention and aims to anchor rather than cap 10 year JGB yield around zero percent, while BoA suggests contra-trend position in 10 year UST to target 2.25% from current levels close to 3.0%.
Commodities:
- Crude benchmarks are firmer on the session in what is more of a consolidation from yesterday’s pressured settlement than a concerted effort to move higher, also benefitting from broader equity action.
- Currently, WTI and Brent reside at the top-end of USD 2/bbl parameters; focus very much on China-COVID, Iran, Libyan supply and Ukraine-Russia developments.
- US Private Energy Inventory Data (bbls): Crude -4.5mln (exp. +2.5mln), Cushing +0.1mln, Gasoline +2.9mln (exp. -1.0mln), Distillate -1.7mln (exp. -0.8mln).
- Spot gold/silver are contained at present but have seen bouts of modest pressure, including the loss of the USD 1946.45/oz 21-DMA at worst.
US Event Calendar
- 07:00: April MBA Mortgage Applications, prior -1.3%
- 10:00: March Existing Home Sales MoM, est. -4.1%, prior -7.2%
- 10:00: March Home Resales with Condos, est. 5.77m, prior 6.02m
- 14:00: U.S. Federal Reserve Releases Beige Book
Central Bank Speakers
- 11:25: Fed’s Daly Discusses the Outlook
- 11:30: Fed’s Evans Discusses the Economic and Policy Outlook
- 13:00: Fed’s Bostic Discusses Equity in Urban Development
DB’s Jim Reid concludes the overnight wrap
It took me a while to adjust to being back to the office yesterday after two and a half weeks off. No screaming kids, no stealing half their food as I made their meals, and no stepping on endless lego and screaming myself. My team at work are much better behaved, protect their food, and clear up after playing with their toys. Talking of lego, the first day of the holiday was spent in a snow blizzard at LEGOLAND and the last day in shorts and t-shirt on a family bike ride on the Thames. No I haven’t been off for that long just a typical April in the UK. When I left you, I was in constant agony due to sciatica in my back and a knee that was very fragile post surgery. On my last day I had a back injection that I wasn’t that hopeful about as three previous ones hadn’t done anything. However after a second opinion and a new consultant, this injection hit the spot and my sciatica has completely gone and I’m just back to the long-standing normal wear and tear related back stiffness. The consultant can’t tell me how long it’ll last so Reformer Pilates starts next week. My knee is slowly getting better via some overuse flare ups. So until the next time, I’m in as good a shape as I have been for quite some time!
It’s hard to guage how good a shape the market is in at the moment as there are lots of conflicting forces. Since I’ve been off global yields have exploded higher, the US yield curve has resteepened notably and risk is a bit softer. As regular readers know I think a late 2023/early 2024 US recession is likely in this first proper boom and bust cycle for over 40 years. However we’re still in some kind of boom phase and I’ve been trying not to get too bearish too early. While I was off, I published our latest credit spread forecasts and having met our earlier year widening targets, we’ve moved more neutral for the rest of the year. However into year end 2023, we now have a very big widening of spreads in the forecasts to reflect the likely recession. See the report here. Also while I’ve been off, the House View is now also that we’ll get a US recession at a similar point which as far as I can see is the first Wall Street bank to officially predict this. See the World Outlook here for more.
On the steepening I don’t have a strong view but ultimately I think 2 year yields will probably have to rise again at some point after a recent pause as the risks are skewed to the Fed having to move faster than the market expects. The long end is complicated by QT but generally I suspect the curve will be fairly flat or inverted for most of the next few months.
Coming back after my holidays and the long Easter weekend, the bond market sell-off resumed yesterday with yields climbing to fresh highs. In fact, the losses for Treasuries so far in April now stand at -2.95% on a total return basis, just outperforming the -3.04% decline in March that itself was the worst monthly performance since January 2009, back when the US economy started emerging from the worst phase of the GFC.
Elsewhere the US yield curve flattened for the first time in six sessions, with 2yr yields climbing +14.4bps to 2.59%, their highest level since early 2019. Yields on 10yr Treasuries rose +8.3bps to 2.94%, a level unseen since late 2018, on another day marked by heightened rates volatility. Meanwhile 30yr yields breached 3.00% intraday for the first time since early 2019, climbing +5.4bps. And what was also noticeable was the continued rise in real yields, with the 10yr real yield closing at -0.009% yesterday, and briefly trading in positive territory for the first time since March 2020 in early trading this morning. Bear in mind that the 10yr real yield has surged roughly 110bps in around 6 weeks, and since we’ve been able to calculate real yields using TIPS, the only faster moves over such a short time period have been during the GFC and a remarkable 2-week period in March 2020 around the initial Covid-19 wave. On the other hand, as I pointed out in my CoTD yesterday (link here), the 10yr real yield based on spot inflation is currently around -5.6%, so still incredibly negative.
The latest moves come ahead of the Fed’s next decision two weeks from now, where futures are placing the odds of a 50bp hike at over 100% now. We’ve been talking about 50bps for some time, and we’d probably have had one last month had it not been for Russia’s invasion of Ukraine, but it would still be a historic moment if it happens, since the last 50bp hike was all the way back in 2000. Nevertheless, we could be about to see a whole run of them, with our economists pencilling in 50bp hikes at the next 3 meetings, whilst St Louis Fed President Bullard (the only dissenting vote at the last meeting who wanted 50bps) said on Monday night that he wouldn’t even rule out a 75bps hike, which probably gave some fuel to the subsequent front end selloff.
The bond selloff also took hold in Europe yesterday, where yields on 10yr bunds (+6.9ps), 10yr OATs (+5.0bps) and BTPs (+6.2bps) all hit fresh multi-year highs. Indeed, those on 10yr bunds (0.91%) were at their highest level since 2015, having staged an astonishing turnaround since they closed in negative territory as recently as March 7. Rising inflation expectations have been a driving theme behind this, and yesterday we saw the 5y5y forward inflation swap for the Euro Area close above 2.4%, which is the first time that’s happened in almost a decade, and just shows how investor confidence in the idea of “transitory” inflation is becoming increasingly subdued given that metric is looking at the 5-10 year horizon. Those moves higher in inflation expectations came in spite of the fact that European natural gas prices fell to their lowest level since Russia’s invasion of Ukraine began yesterday. By the close, they’d fallen -1.94% to €93.77/MWh, whilst Brent crude oil prices were down -5.22% to $107.25/bbl. In Asia, oil prices are a touch higher, with Brent futures +0.82% higher as we go to press.
Whilst bonds sold off significantly on both sides of the Atlantic, equities put in a much more divergent performance, with the US seeing significant advances just as Europe sold off. By the close of trade, the S&P 500 (+1.61%) had posted its best day in more than a month, as part of a broad-based advance that left 446 companies in the index higher on the day, the most gainers in a month. Tech stocks outperformed in spite of the rise in yields, with the NASDAQ (+2.15%) and the FANG+ index (+1.81%) posting solid advances, and the small-cap Russell 2000 (+2.04%) also outperformed. In Europe however, the STOXX 600 shed -0.77%, with others including the DAX (-0.07%), the CAC 40 (-0.83%) and the FTSE 100 (-0.20%) also losing ground.
The S&P was higher despite a day of mixed earnings. Of the ten companies reporting during trading yesterday, only 4 beat both sales and earnings expectations. After hours, Netflix was the main story, losing subscribers for the first quarter in over a decade and forecasting further declines this quarter, which sent the stock as much as -24% lower in after hours trading. It’s 2 bad earnings releases in a row for the world’s largest streaming service, who saw their stock dip -21.79% the day after their fourth quarter earnings in January.
Asian equity markets are mixed this morning as the People’s Bank of China (PBOC) defied market expectations by keeping its benchmark lending rates steady. In mainland China, the Shanghai Composite (-0.21%) and the CSI (-0.43%) are lagging on the news. Bucking the trend is the Nikkei (+0.57%) and the Hang Seng (+0.66%). Outside of Asia, stock futures are indicating a negative start in the US with contracts on the S&P 500 (-0.35%) and Nasdaq (-0.75%) both trading in the red partly due to the Netflix earnings miss.
Separately, the Bank of Japan (BOJ) reiterated its commitment to purchase an unlimited amount of 10-yr Japanese Government Bonds (JGBs) at 0.25% to contain yields, underscoring its desire for ultra-loose monetary settings, in contrast to the global move in a more hawkish direction.
The yen has moved slightly higher (+0.3%) after depreciating for 13 straight days, a streak which hasn’t been matched since the US left the gold standard in the early 70s and effectively brought the global free floating exchange rate regime into being. The pace and magnitude of the depreciation has brought some expressions of consternation from Japanese officials, but no official intervention. The reality is, it would be extraordinarily difficult to credibly support the currency at the same time as maintaining strict control of the yield curve. 10yr JGBs continue to trade just beneath the important 0.25% level.
Over in France, we’re now just 4 days away from the French presidential election run-off on Sunday, and tonight will see President Macron face off against Marine Le Pen in a live TV debate. Whilst that will be an important moment, recent days have seen a slight widening in Macron’s poll lead that has also coincided with signs of an easing in market stress, with the spread of French 10yr yields over bunds coming down to its lowest level since the start of the month yesterday, at 46.7bps. In terms of yesterday’s polls, Macron was ahead of Le Pen by 56-44 (Opinionway), 56.5-43.5 (Ipsos), and 55-54 (Ifop), putting his lead beyond the margin of error in all of them.
Elsewhere, the IMF released their latest World Economic Outlook yesterday, in which they downgraded their estimates for global growth in light of Russia’s invasion of Ukraine. They now see global growth in both 2022 and 2023 at +3.6%, down from estimates in January of +4.4% in 2022 and +3.8% in 2023. Unsurprisingly it was Russia that saw the biggest downgrades, but they were broadly shared across the advanced and emerging market economies, whilst inflation was revised up at the same time.
Otherwise on the data side, US housing starts grew at an annualised rate of 1.793m in March (vs. 1.74m expected), which is their highest level since 2006. Building permits also rose to an annualised rate of 1.873m (vs. 1.82m expected), albeit this was still beneath its post-GFC high reached in January.
To the day ahead now, and data releases include German PPI for March, Euro Area industrial production for February, US existing home sales for march, and Canadian CPI for March. From central banks, we’ll hear from the Fed’s Bostic, Evans and Daly, as well as the ECB’s Rehn and Nagel, whilst the Federal Reserve will be releasing their Beige Book. Earnings releases include Tesla, Procter & Gamble, and Abbott Laboratories. Finally, French President Macron and Marine Le Pen will debate tonight ahead of Sunday’s presidential election.
3. ASIAN AFFAIRS
i)WEDNESDAY MORNING// TUESDAY NIGHT
SHANGHAI CLOSED DOWN 42.98 PTS OR 1.35% //Hang Sang CLOSED DOWN 84.09 OR 0.40% /The Nikkei closed UP 232.76 PTS OR 0.86% //Australia’s all ordinaires CLOSED UP .02% /Chinese yuan (ONSHORE) closed DOWN 6.4125 /Oil UP TO 104.11 dollars per barrel for WTI andUP TO 108.65 for Brent. Stocks in Europe OPENED ALL GREEN // ONSHORE YUAN CLOSED DOWN AGAINST THE DOLLAR AT 6.4125 OFFSHORE YUAN CLOSED UP ON THE DOLLAR AT 6.4431: /ONSHORE YUAN TRADING ABOVE LEVEL OF OFFSHORE YUAN/ONSHORE YUAN TRADING WEAKER AGAINST US DOLLAR/OFFSHORE WEAKER//
3 a./NORTH KOREA/ SOUTH KOREA
///NORTH KOREA
END
3B JAPAN
“These Are Incredible Moves” – Yen’s Problem Is That Japan Will Also See Inflation In 2022
TUESDAY, APR 19, 2022 – 07:05 PM
As we discussed earlier today in “Why you should pay attention to the crashing JPY“, with the Japanese currency imploding at a never before seen pace, sliding on 13 consecutive days – an uninterrupted streak never once seen in history – things are starting to get scary for the BOJ and adherents of the lunacy that is MMT.
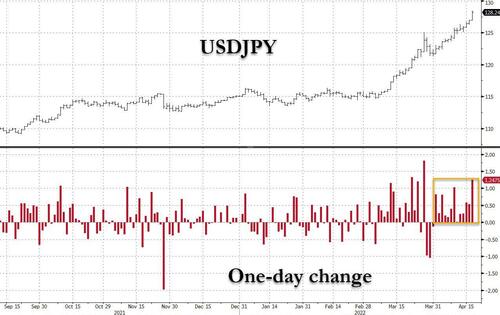
And unfortunately for the BOJ, as Bloomberg’s resident FX experts Mark Cudmore writes, the yen has plenty more downside in 2022 as the BOJ is yet another central bank being lulled into misplaced complacency on inflation.
Below, Cudmore explains why it about to get much uglier for any remaining yen bulls out there.
Remember the 2021 idea that “inflation is transitory”?! That was laughable. And so is the idea that Japan won’t see above-target inflation in 2022. The problem is that too many people trust economists on this issue even though the only thing we know from the past year is that, in aggregate, economists, globally and also particularly in Japan, are very poor at forecasting inflation.
When we suggested in December that consumer price inflation in Japan was a 2022 black swan to watch for, the reaction was extremely dismissive. At the time, the consensus forecast for full-year inflation was 0.7%. It now has jumped to 1.5% and will keep being revised higher by economists chasing the trend rather than looking at the real world around them:
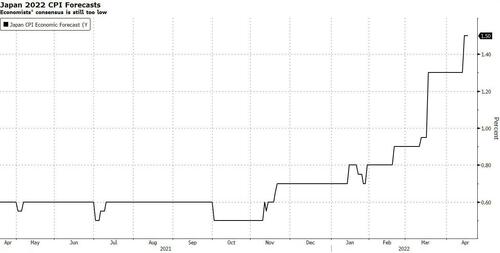
I’m told that Japanese companies struggle to raise prices in a country that hasn’t had inflation for so long. I get that. But reality will overtake them and force everyone to adapt, because the hard facts are that input prices are going parabolic in Japan, and to such an extent that it can’t be ignored any more.
The Bloomberg Commodity Spot Index rose 8.2% in JPY terms over just the past week. It’s up 29% since end of Feb., more than 48% ytd and 177% over the past two years (all in JPY terms). These are incredible moves:
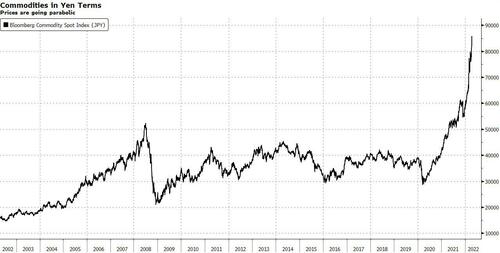
With the BOJ sticking to its extraordinarily easy policy, the yen’s negative real yields will deepen. And the central bank is trapped because the country’s large sovereign debt pile means that higher rates create a new problem, where the stress outlet will again likely be the currency.
This post isn’t making any particular call on the short-term price action, but, as outlined last week, any yen rally in 2022 won’t be sustainable without a global growth shock.
end
3c CHINA
CHINA/COVID/SHANGHAI LOCKDOWNS/
END
4/EUROPEAN AFFAIRS//UK AFFAIRS
//EUROPE//GATESTONE
FOR YOUR INTEREST…
The Cost Of ‘New Energy’ In Europe, But Not In Money…
WEDNESDAY, APR 20, 2022 – 02:00 AM
Authored by Giulio Meotti via The Gatestone Institute,
- “When I left Nantes in 1984, it was tranquility itself, even in the traditionally more working-class neighborhoods… Today Nantes has become Lebanonized. And its history is that of France…” — Ivan Rioufol, journalist, Le Figaro, April 7, 2018.
- One might even be forgiven for thinking that Qatar’s ultimate goal was to Islamize Europe. In the words of a television documentary, it is Qatar’s “war of influence”.
- “[T]he Assalam mosque,” Le Figaro recounts, “was built on land sold by the municipality, benefiting from a ‘cultural’ contribution of 200,000 euros and a loan guarantee of 346,800 euros”. The city financed its own self-conquest. …
- Russian gas is not free; Qatari gas as well.
- The German website Tichys Einblick comments that “instead of Putin’s war, we will finance Islamic terrorism”. The unconditional will to shine morally has harmful consequences — all because nuclear power is “haram” (forbidden).
As Europe turns from its masochistic energy dependence on Russia, and the potential blackmail that came with it, will it now fall into the open arms of other dictatorships that stand ready to pump gas into its markets, such as Algeria? Even more dangerous might be a new partnership formed between Germany and Qatar. They have just agreed on a huge long-term energy partnership to reduce dependence on Russian gas, according to German Economy Minister Robert Habeck, who last month visited the Persian Gulf and met with the Emir of Qatar, Sheikh Tamim bin Hamad al-Thani. Italy was the first to negotiate with Qatar, a country that, according to Freedom House, numbers 25 out of 100 on its the freedom score, only slightly above Russia, at 19.

Qatar is now saying that it stands “in solidarity” with Europe.
Solidarity?
Qatar is an Islamist state where “Islam is the official religion… and Sharia is the main source of legislation”, claims its constitution. Qatar is governed as an absolute monarchy. Political parties are banned and elections are sham, and it is illegal to be homosexual. According to Open Doors, there are only 18 states in the world where a Christian is worse off than in Qatar. As for the billion euros that Qatar has spent on building mosques and Koranic schools in Europe, perhaps the champions of “progressivism” feel expansively “diverse” with that. However, even the newspaper of the French left, Libération, has referred to “Qatar, financier of European Islam”.
“Qatar and Turkey are the two main supporters of the Muslim Brotherhood ideology in the world,” Elie Chouraqui told i24NEWS.
“They presented themselves well and proclaimed themselves privileged interlocutors of the political world which welcomed them with open arms to the point of entrusting them with the training of imams of France”.
At the same time as the economy minister of Germany went to the sheikh to implore him for more gas, in France the ambassador of Qatar was receiving an award from the mayor of Nice, Christian Estrosi.
Qatar has been extremely active in France. The emirate graciously financed the Islamic Center of Villeneuve-d’Ascq and France’s first state-funded Muslim faith school, the Lycée-Collège Averroès. Unfortunately, the Lycée Averroès soon became the center of a scandal. One of its teachers resigned after writing that the school was “a hotbed of anti-Semitism and ‘promoting Islamism’ to pupils”. Qatar, meanwhile, has financed many mosques in France, including the Great Mosque of Poitiers, which sits in the vicinity of the site of the Battle of Tours (also known as the Battle of Poitiers), where Charles Martel, ruler of the Franks, stopped the advancing Muslim army of Abdul al-Rahman in the year 732.
The Assalam mosque in Nantes and the Grand Mosque of Paris are other examples of Qatari generosity. Qatar, in fact, has been funding many mega-mosques across Europe. One might even be forgiven for thinking that Qatar’s ultimate goal was to Islamize Europe. In the words of a television documentary, it is Qatar’s “war of influence“.
“Woman’s month for the city of Nantes, a veiled woman on the streets of the city. Unacceptable complacency towards Islamism! This is the real threat that hangs over France!” is how Eric Ciotti, a senior leader of the Les Republicans party, described the municipal billboards in a large city that he sees as lost to Islamization.
Nantes is the city of the Dukes of Brittany, steeped in history on the Loire estuary. Its story is emblematic of how Europe is sinking. Ivan Rioufol wrote in Le Figaro:
“Having been a journalist in Nantes for a long time, I know this city where I was born very well. When I left Nantes in 1984, it was tranquility itself, even in the traditionally more working-class neighborhoods… Immigrants were a minority… Today Nantes has become Lebanonized. And its history is that of France…
“The Malakoff mosque… seats 1,200 and has erected a 17-meter minaret. In addition to this ‘cathedral mosque’ there are four other mosques in the city, not to mention those in neighboring communities. This influence of Islam accompanied the new settlement of the working-class neighborhoods, under the encouragement of the socialist municipalities”.
Today, in Nantes alone, there are ten mosques.
The Assalam Mosque was constructed with Qatari money — but not only. The Assalam mosque,” Le Figaro recounts, “was built on land sold by the municipality, benefiting from a ‘cultural’ contribution of 200,000 euros and a loan guarantee of 346,800 euros”. The city financed its own self-conquest. And who was the mayor of the city at the time of the financing and the agreement with Qatar? Jean-Marc Ayrault, mayor of Nantes from 1989 to 2012 and socialist prime minister of France from 2021 to 2014 …
Pierre Vermeren , in his book Déni français (French Denial), noted:
“In Nantes, Jean-Marc Ayrault practiced a patronage that led to the construction of three, four, community mosques distributed among the Muslim Brotherhood, Morocco and Turkey, as well as a Salafi mosque on the outskirts of his city. He is accused, like the former mayor of Paris, of violating the religious funding law. In Bordeaux, Alain Juppé (former prime minister) canceled the Great Mosque project when it was discovered that the funds came from Qatar and Azerbaijan…”
The magazine L’Incorrect explains how Qatari money is changing the French landscape.
“When you think of Alsace, you imagine a thousand small flowered villages lost in the vineyards on the side of the Vosges mountains, whose names give you a headache. We are (for the moment) in Christian land, as evidenced by the chapels that line roads and paths. But mosques sprout like mushrooms after the rain, even in villages with a few thousand inhabitants. This phenomenon reveals a slow but sure Islamization of this region”.
We are in the region where the other capital of the EU, Strasbourg, is located.
“The European capital has among its buildings the most important mosque in Europe, the center of An-Nour. The largest building of its kind in France, this center is not just a place of worship, but a cultural and political one, funded by Qatar”.
This is happening not only in France. The Great Mosque of Copenhagen received a donation of 30 million euros from Hamad bin Khalifa al Thani, former Emir of Qatar, who is also a leading supporter of the Muslims in Belgium. Europe’s Parliament was also asked to investigate Qatari mosques in Kosovo.
Russian gas is not free; Qatari gas as well.
The German website Tichys Einblick comments that “instead of Putin’s war, we will finance Islamic terrorism”. The unconditional will to shine morally has harmful consequences — all because nuclear power is “haram” (forbidden).
Former German Foreign Minister Sigmar Gabriel provided a glimpse of the relativism that dominates our ruling classes:
“Qatar does not threaten anyone, does not finance terrorist organizations, but hosts Hamas and the Taliban at the request of the USA (!) in order to be able to negotiate with them in Doha. Qatar is simply a reliable partner of the West.”.
Shortly before his death, Christophe de Margerie, the late head of French oil giant Total, said: “Anything can be bought, including men, it’s just a question of price”.
What is Europe’s price?
“This tiny Persian Gulf kingdom is emerging as one of Europe’s best hopes for weaning itself off Russian natural gas, in another sign of how the war in Ukraine is changing the world’s energy relationships”, The Wall Street Journal reported. “Germany, France, Belgium and Italy are in talks with Qatar to buy liquefied natural gas on a long-term basis, said Qatari and European officials”. The EU last month dropped antitrust investigations into Qatar Petroleum, the state energy company, clearing the way for the country to pursue more long-term contracts with Europe.
Le Figaro tells one of these extraordinary evenings in which Qatar supported the French cultural élite:
“Dozens of guests flocked to Place de l’Étoile… home to the Qatari embassy. In the rooms with gilded panels with mosaics and frescoes of languid nymphs, His Excellency Mohamed al-Kuwari awarded cartoonist Jean Plantu and Amirouche Laïdi, president of the Averroes Club, with the ‘Doha Arab Cultural Capital’ award. The ambassador awarded André Miquel (famous Arabist from the Collège de France), Dominique Baudis (writer), Bernard Noël (art critic) and the poet Adonis. From former Culture Minister Jack Lang to Nouvel Observateur founder Jean Daniel, a total of 66 French cultural figures have been decorated by Qatar”.
Making fun of the deal with Qatar, the German newspaper Die Welt ironically proclaimed:
“The relief in Germany is enormous. They are finally no longer dependent on gas supplies from an autocratically-ruled country that makes life difficult for homosexuals and does not always take human rights very seriously.”
Before the suspicion arises however, that German environmentalist-progressive-woke circles are throwing their noble principles overboard, it must be said that Qatar is willing to make major concessions to the German “Greens”. The emirate has promised to install wind turbines in the desert and to host the next COP26 conference about how to create a “sustainable world”.
UK
UK energy executives tell MPs that fuel poverty will crush households into massive debt
(zerohedge)
UK Energy Execs Tell MPs That “Fuel Poverty” Will Crush Households Into Debt
WEDNESDAY, APR 20, 2022 – 02:45 AM
Living standards in Britain continue a death spiral as a large number of customers will go into debt due to soaring power bills, according to Bloomberg.
European electric utility executives told MPs on the business, energy, and industrial strategy select committee in parliament that emerging signs show an alarming number of customers have trouble paying their power bills.
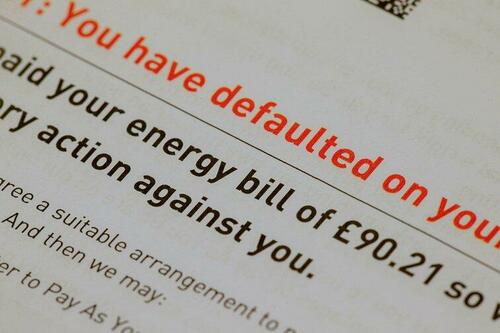
European electric utility E.ON SE’s chief executive officer Michael Lewis told lawmakers that customer borrowings would increase by 50%.
“We are expecting a severe impact on customers’ ability to pay.
“That will see a significantly larger number of people moving into fuel poverty … and a consequent significant increase in bad debt.
“Government action won’t be nearly enough to mitigate the full impact of the price increase,” Lewis said.
Keith Anderson, CEO of Scottish Power Ltd, told a similar warning to the parliamentary panel:
“Come October, that’s going to get horrific, truly horrific.
“The size and scale of this is beyond what I can deal with, beyond what I think the industry can deal with. It needs a massive shift, significant shift in the government’s approach to this,” Anderson said.
Chris O’Shea, CEO of the UK’s biggest supplier Centrica Plc, warned:
“It will get worse without any further intervention in October, a lot worse,” O’Shea said.
In Britain, living costs skyrocket as wages fail to outpace inflation amid rising energy costs. According to the Resolution Foundation, the average family will be paying 1,100 pounds more over the next 12 months to satisfy their energy needs. This will break the bank for lower-income households that will go into debt. To mitigate some of the stress on families, the government pledged a nine billion-pound rescue package for consumers.
High inflation has pushed the UK Misery Index, an economic indicator to gauge how the average person is doing, to three-decade highs.
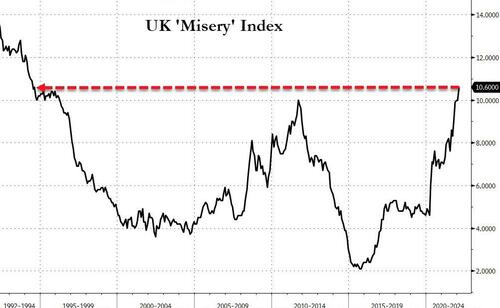
Discontent is soaring across the country as the most significant living standards decline since the 1950s is underway as inflation crushes households. Energy prices could continue to rise if Europe bans all Russian oil. JPM warned Tuesday that crude could hit $185 a barrel if that happened.
END.
GERMANY
Germany warns that a ban on natural gas will cripple the country
(Kennedy/OilPrice.com)
German Industry Fears Immediate Russian Gas Ban
WEDNESDAY, APR 20, 2022 – 05:00 AM
By Charles Kennedy of OilPrice.com,
As Europe continues to consider a ban on Russian energy exports, German business and unions are joining forces in opposition, warning that an immediate Russian natural gas ban would have a severe negative impact on industry and jobs.

Germany boasts the largest economy in the 27-nation European Union and resisted a ban on Russian energy imports, opting instead for a strategy that would seek to gradually phase out Russian oil by year-end 2022 and Russian gas imports within two years.
“A rapid gas embargo would lead to loss of production, shutdowns, a further de-industrialization and the long-term loss of work positions in Germany,” AP quoted the chairmen of the BDA employer’s group and the DGB trade union confederation as saying Monday.
Some 40% of the European Union’s natural gas and some 25% of its oil now comes from Russia, mostly through pipelines.
Germany alone depends on Russia for approximately one-third of its total energy consumption.
Last week, the German government approved its biggest pension hike in decades at a time when inflation is expected to skyrocket, already hitting a 40-year high. Beginning on July 1st, pensions for former West German states will increase by 5.35%.
While Germany’s employers and unions are on edge over the potential for an “immediate” ban on Russian oil and natural gas, the bloc is still starkly divided on the issue.
EU ministers are now in discussions about a sixth round of potential new sanctions against Russia, noting that the bloc has jointly paid 35 billion euros for Russian energy since Vladimir Putin launched his war on Ukraine. Germany, Italy, Austria and Hungary are the most dependent on Russian gas and fearful of an immediate ban.
A ban on Russian coal imports has already been agreed but will not be implemented until August and will have only a limited effect on money going into Russian coffers compared to oil and gas.
end
5. RUSSIAN AND MIDDLE EASTERN AFFAIRS
RUSSIA/UKRAINE//THE WEST/DONBASS
Russia tells the Azov fighters (Nazis) to lay down their arms or they will level the steel fortress which is housing them
(zerohedge)
Russia Tells Azov Fighters Trapped In Giant ‘Fortress’ Steel Plant: “Lay Down Arms Or We’ll Level Everything”
TUESDAY, APR 19, 2022 – 05:10 PM
While the major southeast Ukraine port city of Mariupol has already for weeks been effectively under total siege by Russian forces, a European official cited in The Hill on Tuesday has said “Mariupol will be controlled in the coming days” by the Russian military. It’s believed that Vladimir Putin also wants to see a major victory over the Donbas region by the time of Russia’s Victory Day holiday on May 9.
And Western officials are already alleging that Bucha-style mass killings will take place after President Zelensky said Monday that Russia is seeking to “wipe out” Mariupol. It’s being commonly estimated that there could still be as many as 100,000 civilians trapped in the city. “The Russians will continue to use artillery and bombings, and at the same time they will push civilians out of the city. So at the end of the day, we do expect a complete destruction of the city and many civilian casualties in Mariupol,” the European official added. “My fear is that it’s going to be worse than Bucha.”

Russian media, however, has said most of Mariupol is already “liberated” and that military forces have Ukrainian “radicals” surrounded – in reference to fighters from the neo-Nazi Azov regiment. Russian forces have reportedly opened a temporary ‘humanitarian corridor’ allowing anyone trapped inside the giant Azovstal steelworks plant to leave.
The complex ranks as among Europe’s metallurgical plants, with the entire stretch of the complex covering a whopping 4.25 square miles. Both Interfax and Russian state TV have reported that so far at least 120 people have safely exited the Azovostal plant since Russia forces erected the corridor.
Ukrainian military officials have estimated that hundreds of civilians have been sheltering in the plant, while Russian sources have said that at least a couple thousand Azov as well as foreign fighters are still holed up in a large steel factory.
Below: purported footage showing the evacuation of the some 120 civilians from the plant…
“Today, 120 people who were sheltering in basements in the area of a checkpoint of the Azovstal plant, residents of Mariupol, were brought to a safe place by DPR soldiers,” a representative of the Donetsk People’s Republic (DPR) was cited in Russian media as saying.
The final showdown for Mariupol now appears to hinge on the fate of the giant steelworks plant, with Azov commanders now alleging war crimes being committed against civilians:
Russia has begun dropping bunker-buster bombs on a Mariupol steel plant where Ukrainians are refusing to surrender, the commander of the Azov Regiment of the National Guard said Monday.
Denys Prokopenko, whose soldiers have been holding out against Russian forces in the key southern port city, said in a video message that the bombs are dropping even though civilians are sheltering in the plant’s tunnels.
Western media and CNN in particular is also backing the Azov account, alleging further that Russian forces are preparing to level the entire Azovstal factor complex:
The Security Service of Ukraine (SBU) on Tuesday released a purported communications intercept of a Russian ground unit commander, who said Russian aircraft were planning to “level everything to the ground” around Azovstal, the steel factory that is a redoubt of Ukrainian defenders in the besieged port city of Mariupol.
The audio recording released Tuesday purports to feature the voice of the leader of a Russian platoon four kilometers (or about 2.5 miles) from Azovstal.
The man’s voice says, “We are expecting ‘surprises’ from Russia here.”
“What kind of surprises?” a woman’s voice replies.
“Three-ton ones, from the sky,” the man replies, adding that his command “said to level everything to the ground.”
CNN noted that it cannot verify the authenticity of the recording, and cited Ukrainian officials and military commanders to say “the situation around the Azovstal plant to be extremely difficult, with hundreds of civilians also sheltering in the basements of the steel factory with dwindling supplies and defenders under constant attack.”
Earlier in the day Tuesday Russia issued a directive for Ukrainian forces to “immediately” lay down their arms and they’ll be given safe passage out of the steel plant. “Everyone who lays down their arms will be guaranteed survival,” a defense ministry statement said. The statement called on Ukrainian troops to…
withdraw from the steel plant between 1400 and 1600 Moscow time “without exception, without any weapons and without ammunition”.
It’s very unlikely that the hardened Azov militants will take up the call, and some independent media reports have alleged that Azov will shoot anyone that attempts to surrender.
Ukrainian officials have said Russian has bombarded the plant from above while civilians huddle below, in underground facilities that are part of the plant. Tunnels that reach deep under the industrial complex will indeed likely provide sustained protection from even powerful aerial bombs. But it’s unlikely that food and supplies will last too much longer as the fight for the fortress-like plant rages outside.
END
UKRAINE/USA
Biden setting up another huge Ukraine arms package as their aid totals $3 billion. It may be a little late
(zerohedge)
Biden Prepping Yet Another Huge Ukraine Arms Package As Total Military Aid Nears $3BN
TUESDAY, APR 19, 2022 – 08:25 PM
Coming off last week’s approved gargantuan $800 million military package for Ukraine, which the broader public and media seemed to not even bat an eye about (but quite the opposite: positively cheering it), what more is there for Biden to do except sign off on another massive weapons package for Kiev…
“The Biden administration is preparing to announce another substantial military aid package for Ukraine this week,” NBC News cited five US officials to report Tuesday evening. “Three officials said the package is expected to be similar in size to the $800 million one the administration announced last week.”

Biden previewed the new aid package by answering a simple “yes” when asked by a reporter whether Washington will send more artillery to Ukraine.
The new transfers are expected to include “tens of thousands more artillery rounds” – notes Bloomberg, and likely along with more anti-tank missiles, as has been consistently shipped stretching back even before Russia’s late February invasion kicked off.
It appears to be the administration’s response to Moscow launching a ‘new phase’ in the war: a major force buildup and push to take the Donbas region from Ukraine, which the Kremlin reportedly wants to see fully accomplished by May 9, Victory Day, which commemorates the Soviet defeat of Nazi Germany.
Without doubt these continual major weapons packages pledged to Ukraine will only push Russia and NATO into increasingly direct confrontation, given the Kremlin’s standing warning that it will target any inbound Western arms transfers.
Meanwhile, on Monday a senior Pentagon official told Reuters of plans to begin training Ukrainian forces on how to use American-supplied howitzers. It was described, however, that the training would occur outside Ukraine, likely in a neighboring friendly country like Poland.
White House Press Secretary Jen Psaki confirmed this week that so far the United States has successfully delivered new weapons to the Ukrainians on four flights – this as overall US aid pledged to Ukraine since Feb.24 has totaled about $2.6 billion and counting.
END
UKRAINE
Ukraine has received fighter jets from an unnamed USA ally
(zerohedge)
Ukraine Has Received Fighter Jets From Unnamed US Ally: Pentagon
WEDNESDAY, APR 20, 2022 – 09:45 AM
For the first time since the Russian invasion began, the Pentagon on Tuesday issued cryptic confirmation that Ukraine has received fighter planes. In a press briefing spokesman John Kirby was careful to say it wasn’t the Untied States who sent them, however.
He also didn’t specify what types of aircraft were sent, only that Ukrainian forces “right now have available to them more fixed-wing fighter aircraft than they did two weeks ago.” Kirby described, “Without getting into what other nations are providing, they (Ukrainian forces) have received additional platforms and parts to be able to increase their fleet size.”

“Other nations who have experience with those kinds of aircraft have been able to help them get more aircraft up and running,” Kirby added. As for the US role, he only specified assistance given in the shipment of some parts, but that the US has “not transported whole aircraft.”
Ukraine’s President Volodymyr Zelensky has for weeks been lobbying Western capitals to “close the sky” – or impose a no fly zone – which would effectively guarantee direct Russia-NATO war. While he’s recently backed off that rhetoric slightly, he’s instead taken the strategy of saying that if his Western backers aren’t ready to commit to a NFZ, then they can at least provide aircraft.
As for this fresh Pentagon admission of jets having been recently transferred to Kiev, a few possibilities remain as to which country is behind it. Last month, Poland offered a deal to give Ukraine its almost two dozens MiGs if Washington would replenish its lost supply by upgrading Warsaw with US fighters. Apparently caught off guard by the move, the Pentagon rejected it.
Slovakia is another likely possibility after it sent an S-300 system and missiles to Ukraine, with the US agreeing to resupply the country with Patriots. Slovakia followed by offering to send MiG jets in a similar set-up based on the US sending upgraded American planes to replenish.
Likely it’s one of these Eastern European or Baltic NATO countries that supplied the aircraft Kirby referenced Tuesday. The revelation came just as Joe Biden is said to be readying approval of yet another $800 million arms package to Ukraine, which would bring total military aid given since the war began to surpass $3 billion.
end
UKRAINE
About one third of Ukraine farmland may go unplanted as Russia begins its second phase of the war: the Donbass
(zerohedge)
One-Third Of Ukraine Farmland May Go Unplanted As Russia Begins ‘Second Phase’ Of War
WEDNESDAY, APR 20, 2022 – 07:11 AM
About one-third of Ukraine’s farmlands may not be harvested or cultivated this year as Russia begins the second phase of the conflict in the war-torn country.
The Food and Agriculture Organization of the United Nations (FAO) noted in a report on Tuesday that the “vast destruction of crops and infrastructure due to the war jeopardizes food production.”
FAO estimates approximately 33% of the crops and agricultural land may not be harvested because of the escalating war.
In March, Ukraine President Volodymyr Zelenskyy urged farmers to sow as many fields as possible to protect the food supply, but that appears to be a challenging task considering the displacement of people (labor shortage), bombed-out fields, severely damaged infrastructure, and shortage of everything (diesel, seeds, & fertilizer).
Ukraine is considered the world’s second-biggest shipper of grains and the biggest exporter of sunflower oil. The planting season has already begun — its crop production is vital to the global food supply.
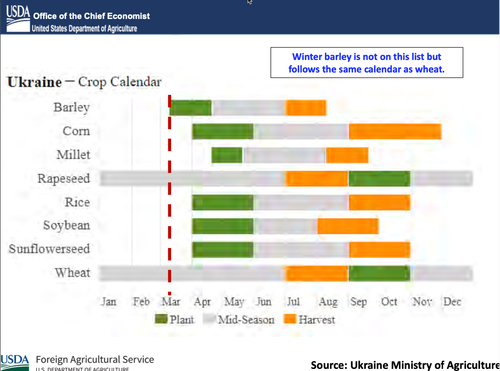
Even if farmers were to sow as many fields as possible, their ability to export crops would be severely impacted during the harvest season due to damaged infrastructure, such as bombed-out rail systems, highways, bridges, and ports. Also, buyers of grains can barely get dry bulk carriers insured to transit the Black Sea to a Ukrainian port because of soaring war risk premiums.
Besides FAO, some private ag forecasters have warned crop harvests could be halved.
Forecast data from ag expert UkrAgroConsult show Ukraine’s corn output could be as low as 19 million tons, about half of last year’s 41 million tons.
There’s no question in our minds the impacts of continuing war will boost global food prices to new record highs. Ukraine is a top producing grains country and what this may spell next is a worldwide food crisis.
end
“One less traitor”: Zelensky oversees campaign of assassination, kidnapping and torture of political opposition – The Grayzone
Inbox

| Robert Hryniak | 4:57 PM (48 minutes ago) | ||
| to |
War is a terrible thing, no matter who is justified in action; if in reality anyone is. War also has no sense of compassion as war brings out the worse in humanity and atrocities are committed not really by regular troops but by so called patriots of a cause. In the Ukraine the SBU and the Azov bunch are such people and deserve no sympathy from anyone. Nor does the likes of Zelensky deserve attention as a bully and poor excuse for a elected leader of a failed state. Watching this person paraded as an icon serves only to question legitimacy of those trying to push the narrative, and that includes the politicians who fawn over him.
Strangely, as we learn of thousands of NATO troops in the Ukraine fighting the so called “ good fight” one must ask for whom? Certainly not for the citizens of the Ukraine. While we can watch the massive supply of weapons; the question is who does this protect? Is this the means to further allow the bunch of maniacs to terrorize the civilian population? And if so to whose benefit? Because it surely is not to the Benefit of Ukrainians or even the rest of the world. And why soldiers need to die or be maimed for such an evil crowd is mystery. If this is side show war of currency hegemony between the Neocon crowd and globalists; let’s call it. Because in such a conflict everyone in the world becomes a combatant by default. People can understand this but to be silent is cowardice and deceit, offering no moral support.
As sad and as horrible as such articles are, calling into question the balderdash narrative spewed by Politicos and MSM. A citizen in many a land is compelled to question individual harm being caused as a indirect result in everything from higher food prices to gasoline. Many people are being forced by necessity to make daily choices that do not inspire well being in society. In major cities in North America and elsewhere in the past, we have witnessed drives for everything from donations for food to raising money to buy school supplies. And in many cities children go to school hunger and are asked to learn.
Clearly, no civilian benefits. So who does? Who is it that such terror as it exists in the Ukraine serve? Does more disfunction within individual countries and cities serve anyone?
Global trade is finished as we have known it. Supply chains are broken so badly that it will take years to fix and yesterday’s normal is a memory that is best remembered because it will not return. Daily now events unfold to show more disruptions being baked in to a sphere of life that will worsen in the near future as things like food shortages arise. Mindless thinking that interest rates hikes will help are more than naive as they will serve only to cause more angst and harm. Interest hikes do not solve shortages that drive up prices. Rather they serve to further squeeze a stressed consumer in consuming less because of financial constraints imposing burdens on the least fortunate in society.
As gas and food prices now start to climb quickly, know that we are all now part of a global roadshow of events until one side chooses to give in.
Cheers
Robert
end
Mariupol street fighting
Inbox
| Robert Hryniak | 3:06 PM (51 minutes ago) | ||
| to |
This dude has steel balls and is a real war reporter, old-fashion, down and dirty but that what real war is. Patrick has to stay safe, together with his brave cameraman. Reminds me of Vietnam era reporting vs the “green screens” of today. There are some reports of VSU simply abandoning villages and towns now and the stream of POWs continues. Many of them do not even look like military men anymore: completely warn down and broken down, many say that the stream of surrendering VSU would have been even larger if not for many trying to surrender being shot in the back by AZOV Nazis. Remember that 1 out every 10 regular troops is Azov with orders to kill anyone who surrenders. What a way to run a fight. Such action never works. In. WWII the Germans did the same thing in Sicily using Slavic boys in foxholes with machine guns behind them to fight the Allied forces.
What a sad tale of woe for these poor souls.
During the coming week, there is chatter of 30-40,000 new POW’s coming. This is a over whelming number of people to look after, feed and guard. No wonder the #1 job being recruited for in the Donbas is guard duty. Just feeding this many people is logistical nightmare on short notice.
The scars from this fighting will linger long after this conflict is finished.
Successful test of Sarmat missile today
Inbox
| Robert Hryniak | 12:49 PM (3 minutes ago) | ||
| to |
The RS-28 Sarmat is capable of carrying about 10 tons of payload for either up to 10 heavy, or 15 light, MIRV warheads, as well as an unspecified number of Avangard hypersonic glide vehicles (HGVs) or a combination of warheads. It also carries several countermeasures against anti-ballistic missile systems. The Russian ministry of Defense said that the missile is Russia’s response to the U.S. Prompt Global Strike.
It is now in serial production. This means deployment later this year.
ISRAEL/IRAN/THE WEST
END
6// GLOBAL COVID ISSUES/VACCINE MANDATE/
GLOBAL ISSUES
VACCINE MANDATES/
VACCINE INJURIES/
A Staggering Number of Athletes Collapsed This Past Year
Inbox
| Robert Hryniak | 9:45 AM (2 hours ago) | ||
| to |
Are these poor folks the canary in the coal mine for the rest of us?
A Staggering Number of Athletes Collapsed This Past Year
With cases like these becoming impossible to ignore, even a mainstream media sports channel in Australia speculated that the health issues could be linked to COVID-19 shots, and one of the hosts acknowledged that multiple players have suffered from heart issues and Bell’s palsy following COVID-19 booster shots
More than 769 athletes have collapsed on the field during a game from March 2021 to March 2022. The shocking statistic was revealed by One America News Network (OAN), which also found the average age of the athletes who suffered cardiac arrest is just 23 years old.[1] The unprecedented surge in cardiac arrest and other heart issues among elite athletes coincides with the rollout of COVID-19 jabs.
The Miami Open made headlines in early April 2022 after 15 players — all of whom had reportedly received COVID-19 injections[2] — dropped out. Among them were favorites Paula Badosa and Jannik Sinner. Badosa left the court in tears after becoming unwell, and Sinner’s opponent said he saw him “bend over” on the court, noting “it was very strange.”[3] Even the fans were confused, with one stating, “What is going on?”[4]
As Pearson Sharp of OAN explained, “These are just two of more than 769 athletes who have collapsed during a game, on the field, over the last year.” He continued:[5]
“How many 23-year-old athletes were collapsing and suffering heart attacks before this year? Do you know any 23-year-old people who had heart attacks before now? And these are just the ones we know about. How many have gone unreported? Nearly 800 athletes — young, fit people in the prime of life — falling down on the field. In fact, 500% more soccer players in the EU are dropping dead from heart attacks than just one year ago.
Coincidence? When the Pfizer vaccine is known to cause heart inflammation? No. In fact, many doctors treating these players list their injuries and deaths as being directly caused by the vaccine … This is not a coincidence.”
VAERS May Not Show the Whole Picture
As of April 1, 2022, the Vaccine Adverse Event Reporting System (VAERS), which is where adverse events caused by COVID-19 jabs in the U.S. are supposed to be collected, lists 26,693 deaths along with 147,677 hospitalizations in association with the COVID-19 shot.[6] There are also 13,677 heart attacks and 38,024 cases of myocarditis (inflammation of the heart muscle) and pericarditis (inflammation of the tissue sac surrounding the heart).
Myocarditis and pericarditis cause symptoms such as chest pain, shortness of breath and a fluttering or pounding heart. Cases have occurred most often after mRNA COVID-19 injections (Pfizer-BioNTech or Moderna), particularly in male adolescents and young adults, according to the CDC. Further, myocarditis occurs more often after the second injection, usually within a week.[7]
Past investigations have shown only between 1%[8] and 10%[9] of adverse reactions are ever reported to VAERS, which is a passive, voluntary reporting system, so the actual number could be much higher. Kyle Warner is one athlete who filed a VAERS report about his own health injuries following the COVID-19 jab. It took him 45 minutes to complete — a length of time that many doctors can’t or won’t devote when it comes to reporting adverse vaccine reactions seen among their patients.
Warner, who is 29 years old, was at the peak of his career as a professional mountain bike racer when, in June 2021, he got his second dose of Pfizer’s COVID-19 shot. He suffered a reaction so severe that, months later, he was still spending days in bed, easily overwhelmed by too much mental or physical exertion.
“I believe where there is risk, there needs to be choice,” he said.[10] Instead, “People are being coerced into making a decision based on lack of information versus being convinced of a decision based on total information transparency.”[11] Despite the rising number of adverse effects being reported in VAERS, top government officials, such as NIAID director Dr. Anthony Fauci and CDC director Dr. Rochelle Walensky, have attempted to discredit it.
Most notably, this occurred during a Senate hearing when both individuals implied that if a person had received the jab and was then killed in a car accident, it’s possible it could be recorded in VAERS as a vaccine injury.[12] However, while anyone can make a report to VAERS — a component that critics use to claim that VAERS can contain errors and even false claims — due to the lengthy and complicated submittal process, adverse events are notoriously under- — not over- — reported.
Shocking Stories of Athletes Harmed by COVID-19 Jabs
Warner developed pericarditis, postural orthostatic tachycardia syndrome (POTS) and reactive arthritis following his second dose of Pfizer’s COVID-19 shot.[13] Again, he’s a young, world-class athlete whose life has been sidelined by the shots.
Unfortunately, many doctors are unwilling to acknowledge that the COVID-19 shots might be related to patients’ injury complaints, and many who have been injured find their stories have remained hidden from public view, with YouTube, Instagram, Facebook and other social media platforms censoring their personal stories and videos. Some, however, have made it through to mainstream media, including:
• Florian Dagoury, a world record holder in static breath-hold freediving. After receiving his second dose of Pfizer’s COVID-19 injection, he experienced increased heart rate and a reduction in his breath-holding capacity. A cardiologist diagnosed him with myocarditis and pericarditis.[14] As a result of the shots, Dagoury’s career may be over.
• Jeremy Chardy, a 34-year-old professional tennis player ranked 73rd in the world, suspended his season due to a severe adverse reaction to the COVID-19 shot, which left him unable to engage in intense activity.[15]
• Veteran triathlete Antoine Méchin, 32, is facing the potential end to his career after receiving Moderna COVID-19 injections. After his second dose, he began to experience shortness of breath and low-back pain, which turned out to be a pulmonary embolism.
The symptoms, which included breathing problems and arm pain, started after the first dose, but doctors brushed off his shortness of breath as related to stress and fatigue. About a month after his second dose, shortness of breath and body pain returned. Only after testing at a sports clinic was the pulmonary embolism revealed.[16]
Unprecedented Cases of Athletes Collapsing and Dying
U.K. football legend and sports commentator Matt Le Tissier, featured in the video above, is among those who have been speaking out about the large number of athletes who have collapsed or died on the field — and he lost his job as a commentator because of it. In an interview with Red Voice Media, Le Tissier is asked about his thoughts on the surge of cardiac events in the sporting world, to which he responded:[17]
“I’ve never seen anything like it. I played for 17 years. I don’t think I saw one person in 17 years have to come off the football pitch with breathing difficulties, clutching their heart, heart problems …
The last year, it’s just been unbelievable how many people, not just footballers but sports people in general, tennis players, cricketers, basketball players, just how many are just keeling over. And at some point, surely you have to say this isn’t right, this needs to be investigated.”
By December 2021, 300 reports of athletes collapsing, and some dying, had already been collected,[18] including high-profile European Soccer star Adama Traore, who clutched his chest and collapsed on the field. An updated report by Good Sciencing, a team of investigators, news editors, journalists and “truth seekers,” has detailed 890 cardiac arrests and other serious issues among athletes, including 579 deaths, following COVID-19 shots.[19]
They’re maintaining a “nonexhaustive and continuously growing list of mainly young athletes who had major medical issues in 2021/2022 after receiving one or more COVID vaccines” and note:[20]
“It is definitely not normal for so many mainly young athletes to suffer from cardiac arrests or to die while playing their sport, but this year it is happening. Many of these heart issues and deaths come shortly after they got a COVID vaccine. While it is possible this can happen to people who did not get a COVID vaccine, the sheer numbers clearly point to the only obvious cause.
… Initially, many of these were not reported. We know that many people were told not to tell anyone about their adverse reactions and the media was not reporting them. They started happening and ramping up after the first COVID vaccinations.
The mainstream media still are not reporting most, but sports news cannot ignore the fact that soccer players and other stars collapse in the middle of a game due to a sudden cardiac arrest. Many of those die — more than 50%.
We also note that many posts in Facebook, Instagram, twitter, forums and news stories are being removed. So now we are receiving some messages saying there is no proof of the event or of vaccination status. That is partly because this information is being hidden.”
Gary Dempsey, a professional soccer player with a nearly two-decade career, also tweeted just how unusual the recent wave of cardiac events among athletes is:[21]
“Was a professional for nearly 20 years. From 1996. Played nearly 500 games. Club and international level. Never ever was there 1 cardiac arrest. Either in the crowd or a player. It’s actually quite scary.”
Heart Issues and Bell’s Palsy ‘Through the Roof’
The video above is from a mainstream sports channel in Australia,[22] detailing another professional athlete, Ollie Wines, who is out of the game due to nausea, dizziness and heart palpitations.
With cases like this becoming impossible to ignore, the “Sunday Footy Show” panel speculated that the health issues could be linked to COVID-19 shots, and one of the hosts acknowledged that multiple players have suffered from heart issues and Bell’s palsy following COVID-19 booster shots. “Wards filled with people suffering the same issues,” he said.[23]
Former professional footballer Matthew Lloyd, who was recently diagnosed with Bell’s palsy, stated, “Heart issues and Bell’s palsy have gone through the roof since the boosters and Covid issues.”[24]
During phase 3 clinical trials of mRNA COVID-19 shots, more cases of facial paralysis occurred in the vaccine groups (seven out of 35,654) compared to the placebo group (one out of 35,611), leading the U.S. Food and Drug Administration to recommended monitoring vaccine recipients for facial paralysis.[25]
Lloyd also said that he’s heard of many cases of heart issues similar to Wines’. “We had [sports journalist] Michelangelo Rucci on … and he said that there’s a ward filled with people with similar symptoms to Ollie Wines — nausea, heart issues — so there has to be something more to it.”[26]
It’s well known that toxic spike proteins can circulate in your body after infection or COVID-19 injection, causing damage to cells, tissues and organs. As your heart beats faster during intense athletic activity, the spike proteins are able to circulate faster throughout your body, pointing to a potential reason why so many athletes are collapsing on the field.
It’s important that these stories are heard, so if you or a loved one has been injured by a COVID-19 injection, please share your story with us and encourage others you know who have a story to share theirs as well.
Originally published April 19, 2022, on Mercola.com
Vaccinated Pilot Goes Into Cardiac Arrest With 200 People Onboard – Media Blackout – News Punch
Inbox

| Milan Sabioncello | 10:37 PM (44 minutes ago) | ||
| to me |
Vaccinated Pilot Goes Into Cardiac Arrest With 200 People Onboard – Media Blackout – News Punch
end
AIDS-Like “Chronic Covid” is Taking Over Europe, Australia and NZ
Inbox
11:00 PM (20 minutes ago) AIDS-Like “Chronic Covid” is Taking Over Europe, Australia and NZhttps://igorchudov.substack.com/p/aids-like-chronic-covid-is-taking?utm_source=direct
/VACCINE IMPACT
Vaccine Impact
| Get Ready for Forced Lockdowns as China is Once Again the Boiler Plate for What Comes Next April 19, 2022 2:37 pm  I have been reporting for 2 weeks now how what has been happening in Shanghai, China, is by far the most significant news event currently happening, and that includes the war in Ukraine. Some in the Alternative media now seem to be coming to this understanding also, and now the corporate media is also addressing the issue, apparently warning Americans that lockdowns are coming soon to the U.S. We already know from our experiences in 2020 how the lockdowns, not a “virus,” caused massive economic and social upheaval. If you didn’t learn from that experience, then you are going to suffer badly, and perhaps lose your life, because we have already been warned by the Globalists that what comes next will make the 2020 COVID-19 look like a vacation. The corporate media is reporting that the lockdowns in Shanghai have spread to many other cities in China now, with almost 400 million people currently under lockdowns, which is more than the entire population of the United States. Fortune published an article today with the headline: “‘It’s probably worse than Wuhan’: Experts warn China’s COVID-19 lockdowns will once again cripple global supply chains.” WAKE UP AMERICA!!!! The pharma-funded corporate media is now telling you what is coming! If you don’t want to be like the people in Shanghai, who are having their children ripped away from them, having their pets killed, dying from starvation and committing mass suicide, being forced into quarantine camps and force vaccinated, then you better start preparing NOW!! It’s coming. And it’s probably coming very soon. I have been reporting for 2 weeks now how what has been happening in Shanghai, China, is by far the most significant news event currently happening, and that includes the war in Ukraine. Some in the Alternative media now seem to be coming to this understanding also, and now the corporate media is also addressing the issue, apparently warning Americans that lockdowns are coming soon to the U.S. We already know from our experiences in 2020 how the lockdowns, not a “virus,” caused massive economic and social upheaval. If you didn’t learn from that experience, then you are going to suffer badly, and perhaps lose your life, because we have already been warned by the Globalists that what comes next will make the 2020 COVID-19 look like a vacation. The corporate media is reporting that the lockdowns in Shanghai have spread to many other cities in China now, with almost 400 million people currently under lockdowns, which is more than the entire population of the United States. Fortune published an article today with the headline: “‘It’s probably worse than Wuhan’: Experts warn China’s COVID-19 lockdowns will once again cripple global supply chains.” WAKE UP AMERICA!!!! The pharma-funded corporate media is now telling you what is coming! If you don’t want to be like the people in Shanghai, who are having their children ripped away from them, having their pets killed, dying from starvation and committing mass suicide, being forced into quarantine camps and force vaccinated, then you better start preparing NOW!! It’s coming. And it’s probably coming very soon.Read More… |
Michael Every
Michael Every on the day’s most important topics
7. OIL ISSUES
The major problem with LNG: the length of time to develop.5 years.
(Paraskova/OilPrice.com)
The Problem With America’s LNG Boom
WEDNESDAY, APR 20, 2022 – 07:10 AM
By Tsvetana Paraskova of OilPrice.com
America’s liquefied natural gas (LNG) exports are booming amid a global energy crisis and a European drive to wean itself off Russian gas. U.S. shipments of natural gas have jumped to all-time highs this year as the United States is intent on helping Europe cut its dependence on Putin’s gas. As demand for natural gas grows, export facilities along the U.S. Gulf Coast are operating at capacity and cannot ship more LNG than they are currently doing—at least not now.

Many projects for LNG export plants are under consideration or are already approved by authorities but awaiting final investment decisions (FIDs). While current LNG demand, especially in Europe, remains strong and is likely to draw cargoes that would have typically gone to Asia, Europe’s push to free itself from Russian gas includes reducing gas use in the long term and doubling down on renewables to reach its climate neutrality goal by 2050.
This is hardly good news for American LNG developers, who need long-term supply commitments and purchase agreements for decades in order to raise investments for the multi-billion projects that take years to build.
Environmental concerns about the greenhouse gas emissions of the LNG supply chain, from fracking to methane leaks, could also put a limit on the amount of LNG America will be able to send to Europe a decade or two from now.
U.S. LNG Exports Booming
Right now, U.S. LNG exports are booming, and most are going to Europe, where the prices are the highest and demand is the strongest. Amid the energy crisis that began last autumn, LNG demand was high in Europe even before the Russian invasion of Ukraine. After the war started, however, demand went off the charts as the European Union vowed to reduce EU demand for Russian gas by two-thirds before the end of the year.
U.S. LNG exports hit a record high in January, according to the latest EIA data. In February, exports decreased by 10.5 percent from January 2022 but jumped by 51.9 percent compared to February 2021, the Department of Energy’s latest LNG Monthly showed. The top five countries of destination, representing 57.5 percent of total U.S. LNG exports in February 2022, were Turkey, France, Spain, the Netherlands, and South Korea. The top Asian buyer of U.S. LNG in February came only fifth behind destinations in Europe and the Mediterranean.
The U.S. is already on course to have the largest LNG export capacity in the world, ahead of Australia and Qatar, with the first cargo produced at Calcasieu Pass LNG in Cameron, Louisiana, having departed from Venture Global LNG’s newly-commissioned facility last month.
LNG export plants are running at capacity in the U.S., so there is little room for increased shipments. To secure more American LNG, Europe must rely on cargoes being redirected from Asia due to the higher prices in Europe and the EU’s motivation to replace as much Russian supply as it can as soon as possible. This is happening right now since many price-sensitive buyers in Asia are backing out of the spot market.
Not All Proposed LNG Projects May See The Light Of Day
While the EU’s determination to ditch Russian gas and the EU-U.S. deal for more American LNG shipments have made some U.S. developers more upbeat on the future of their projects, not all of the more than a dozen proposed export facilities will see the light of day, analysts say.
Facilities need to lock in long-term purchase deals to secure the viability of the expensive projects, and while deal-signing with China has accelerated in recent months, Europe’s long-term energy policy remains rooted in the idea of reducing gas use by 30 percent by 2030 to reach climate goals.
In the United States, there are a dozen projects approved by the Federal Energy Regulatory Commission (FERC) but not under construction yet as they need a final investment decision, investors, or long-term customers. Another six projects have been proposed to FERC, and two others are in the pre-filing stage.
“Having European customers, especially if supported by public money, could easily create a huge tranche of LNG supply,” Nikos Tsafos, a James R. Schlesinger Chair in Energy and Geopolitics at the Center for Strategic and International Studies, wrote last month.
However, it takes up to five years to build a new project, and all new projects are planned with a 20-year investment horizon and firm sale contracts of up to 20 years.
“For a European company that wants to be aligned with the continent’s target for climate neutrality by 2050, these time scales present a problem. A European customer might want gas in 2025 or 2030, but not in 2040 and likely not by 2045. This mismatch prevents U.S. LNG projects from moving forward with European help,” Tsafos noted.
“There’s a big customer out there that wants LNG, but you’re not quite sure for how long,” Tsafos told the Financial Times this month.
Europe wants a lot of non-Russian gas now, but, ideally, it wants to not want an increased gas supply a decade or two from now. The U.S., for its part, cannot currently ship more LNG than it is already doing as its operating export facilities are maxed out. For future projects, Europe’s 2050 net-zero goal and a push to reduce gas use overall is not good news for U.S. developers looking at long-term purchase deals and investments to bring their plans to operating projects.
“I wish I had better news for Europe but it’s going to take . . . at least five-plus years to get anything of size done,” Jack Fusco, president and CEO of the leading U.S. LNG exporter, Cheniere Energy, told FT.
end
8 EMERGING MARKET& AUSTRALIA ISSUES
Australia//// NEW ZEALAND/ SOUTH AFRICA/BRAZIL/ARGENTINA/INDIA
SOUTH AFRICA/DURBAN
END
Your early currency/gold and silver pricing/Asian and European bourse movements/ and interest rate settings WEDNESDAY morning 7:30 AM
Euro/USA 1.0829 UP .0036 /EUROPE BOURSES //ALL GREEN
USA/ YEN 127.84 DOWN 1.47 /NOW TARGETS INTEREST RATE AT .11% AS IT WILL BUY UNLIMITED BONDS TO GETS TO THAT LEVEL…
GBP/USA 1.3053 UP 0.0039
Last night Shanghai COMPOSITE CLOSED DOWN 42.98 PTS OR 1.35%
Hang Sang CLOSED DOWN 83.09 PTS OR 0.40%
AUSTRALIA CLOSED UP .02% // EUROPEAN BOURSES OPENED ALL GREEEN
Trading from Europe and ASIA
I) EUROPEAN BOURSES ALL GREEN
2/ CHINESE BOURSES / :Hang SANG CLOSED DOWN 83.09 PTS OR 0.40%
/SHANGHAI CLOSED DOWN 42.989 PTS OR 1.35%
Australia BOURSE CLOSED UP .02%
(Nikkei (Japan) CLOSED UP 232.76 PTS OR 0.86%
INDIA’S SENSEX IN THE GREEN
Gold very early morning trading: 1950.65
silver:$25.20
USA dollar index early WEDNESDAY morning: 100.45 DOWN 52 CENT(S) from TUESDAY’s close.
THIS ENDS WEDNESDAY MORNING NUMBERS
xxxxxxxxxxxxxxxxxxxxxxxxxxxxxxxxxxxxxxxxxxxxxxxxxxxxxxxxxxxxxxxxxxxxxxxxxxxxxxxxxxxxxxxxxxxxxxxxxxxxxxxxxxxxxx
And now your closing WEDNESDAY NUMBERS 1: 00 PM
Portuguese 10 year bond yield: 1.84% UP 8 in basis point(s) yield
JAPANESE BOND YIELD: +0.255% up 0 AND 7/10 BASIS POINTS /JAPAN losing control of its yield curve/
SPANISH 10 YR BOND YIELD: 1.80%// DOWN 5 in basis points yield
ITALIAN 10 YR BOND YIELD 2.51 DOWN 6 points in basis points yield ./
the Italian 10 yr bond yield is trading 71 points higher than Spain.
GERMAN 10 YR BOND YIELD: FALLSTO +0.855% IN BASIS POINTS ON THE DAY//
THE IMPORTANT SPREAD BETWEEN ITALIAN 10 YR BOND AND GERMAN 10 YEAR BOND IS 1.65% AND NOW ABOVE THE 3.00% LEVEL WHICH WILL IMPLODE THE ENTIRE ITALIAN BANKING SYSTEM. AT 4% SPREAD THERE WILL BE A HUGE BANK RUN…
END
IMPORTANT CURRENCY CLOSES FOR WEDNESDAY
Closing currency crosses for WEDNESDAY /USA DOLLAR INDEX/USA 10 YR BOND YIELD/1:00 PM
Euro/USA 1.0853 UP .0059 or 59 basis points
USA/Japan: 127.82 DOWN 1.51 OR YEN U[ 151 basis points/
Great Britain/USA 1.3040 UP .0036 OR 36 BASIS POINTS
Canadian dollar UP 105 BASIS pts to 1.2499
xxxxxxxxxxxxxxxxxxxxxxxxxxxxxxxxxxxxxxxxxxxxxxxxxxxxxxxxxxxxxxxxxxxxxxxxxxxxxxxx
The USA/Yuan, CNY: closed ON SHORE (CLOSED ..DOWN 6.4192
THE USA/YUAN OFFSHORE: (YUAN CLOSED (DOWN)..6.4521
TURKISH LIRA: 14.67 EXTREMELY DANGEROUS LEVEL/DEATH WISH/HYPERINFLATION TO BEGIN.
the 10 yr Japanese bond yield at +0.255
Your closing 10 yr US bond yield DOWN 5 IN basis points from THURSDAY at 2.865% //trading well ABOVE the resistance level of 2.27-2.32%) very problematic
USA 30 yr bond yield: 2.921 DOWN 7 in basis points
Your closing USA dollar index, 100.31 DOWN 65 CENT(S) ON THE DAY/1.00 PM/
Your closing bourses for Europe and the Dow along with the USA dollar index closing and interest rates WEDNESDAY: 12:00 PM
London: CLOSED UP 27.94PTS OR 0371%
German Dax : CLOSED UP 208.57 POINTS OR 1.47%
Paris CAC CLOSED UP 90.12PTS OR 1.38%
Spain IBEX CLOSED UP 75.50 PTS OR 0.87%
Italian MIB: CLOSED UP 253.32 PTS OR 1.03%
WTI Oil price 100.91 12: EST
Brent Oil: 105.52 12:00 EST
USA /RUSSIAN /// RUBLE RISES TO: 76.41 UP 2 1/8 RUBLES/DOLLAR
GERMAN 10 YR BOND YIELD; +.855
CLOSING NUMBERS: 4 PM
Euro vs USA: 1.0848 UP .0054 OR UP 54 BASIS POINTS
British Pound: 1.3057 UP .0043 or UP 43 basis pts
USA dollar vs Japanese Yen: 127,80 DOWN 1.527//YEN UP 152 BASIS PTS
USA dollar vs Canadian dollar: 1.2498 UP .0106 (CDN dollar UP 106 basis pts)
West Texas intermediate oil: 102.56
Brent OIL: 107.50
USA 10 yr bond yield: 2.847 DOWN 7 points
USA 30 yr bond yield: 2.889 DOWN 10 pts
USA DOLLAR VS TURKISH LIRA: 14.67
USA DOLLAR VS RUSSIA///USA/ ROUBLE: 76.41 DOWN 2 & 1/8 ROUBLES (ROUBLE UP UP 2 & 1/8 ROUBLES/USA
DOW JONES INDUSTRIAL AVERAGE: UP 499.51 PTS OR 1.45%
NASDAQ 100 UP 299.49 PTS OR 2.15%
VOLATILITY INDEX: 21.37 DOWN 0.8- PTS (3.41%)
GLD: 181.82 DOWN 2.89 PTS OR 1.51%
SLV/ 23.24 DOWN .63 PTS OR 2.64%
end)
USA trading day in Graph Form
Tech Wrecks As Bond Bid Sparks Major Curve-Flattening
WEDNESDAY, APR 20, 2022 – 04:00 PM
Major divergence in US equities today as Nasdaq puked (after NFLX collapsed) and the rest, led by The Dow and Small Caps, managed gains (with late-day weakness erasing S&P’s positive returns)…
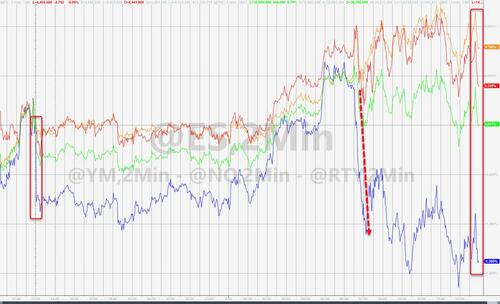
Of course everyone was focused on today’s carnage in NFLX (biggest volume since Oct 2013, 2nd worst daily loss since IPO – Oct 2004 previous) with over $56 billion in market cap being wiped away, leaving the company smaller than $100 bn total market cap…
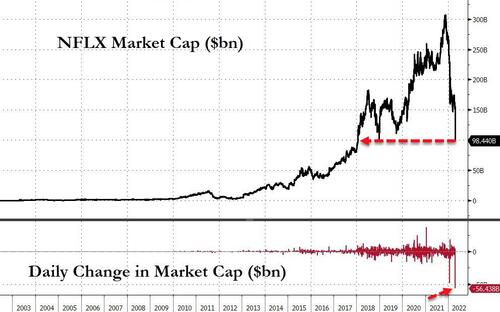
Source: Bloomberg
Traditional ‘defensive’ stocks like Real Estate, Healthcare, and Consumer Staples, were today’s best performing sectors, while many of the sectors that outperformed throughout the pandemic – Tech, Consumer Discretionary – lagged today…
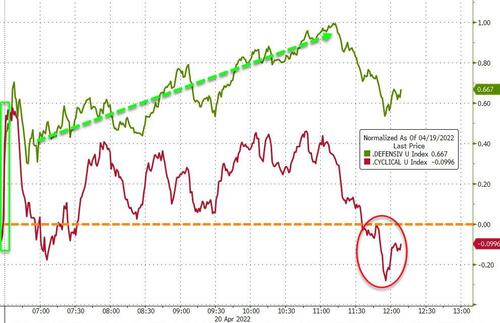
Source: Bloomberg
The FANG+ complex, which outperformed so much throughout the pandemic crashed today (with only MSFT ending green) with the biggest daily drop since March 2020. The FANG+ complex has basically erased all of the late-March meltup…
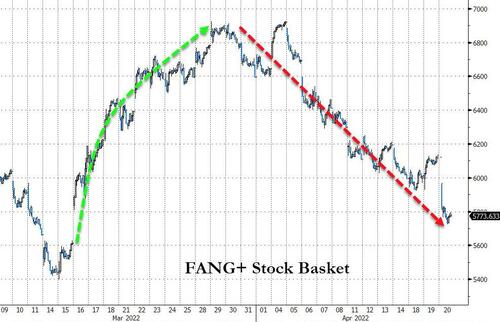
Source: Bloomberg
“Most Shorted” stocks whipsawed back lower today…so back up we squeeze tomorrow?
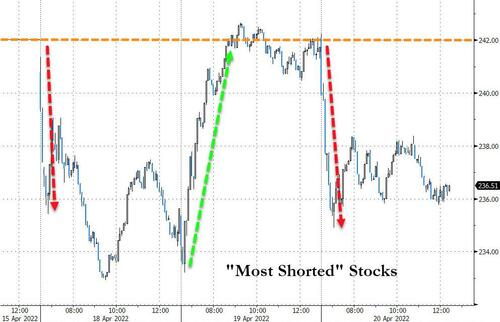
Source: Bloomberg
Treasuries were bid across the curve with the long-end dramatically outperforming (30Y -11bps, 2Y -1bps) helped lower in yield after a very strong 20Y auction. This pushed 30Y (and 10Y) lower in yield on the week, while the short-end remains notably higher on the week(2Y +13bps)…
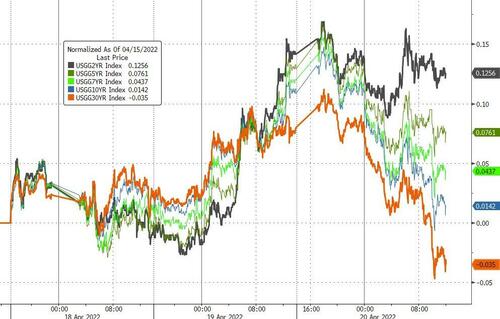
Source: Bloomberg
The yield curve (2s30s) has plunged almost 30bps in 2 days after steepening back into the March FOMC range…

Source: Bloomberg
The dollar fell back today finding support at unchanged on the week…
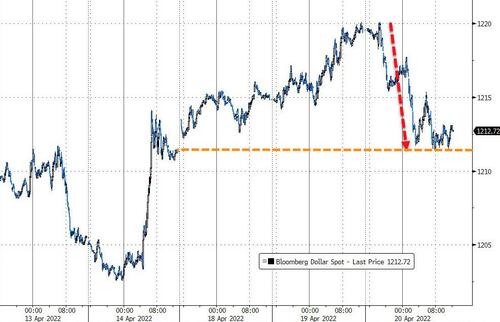
Source: Bloomberg
The Ruble rebounded to pre-invasion levels today, back below 77/USD…
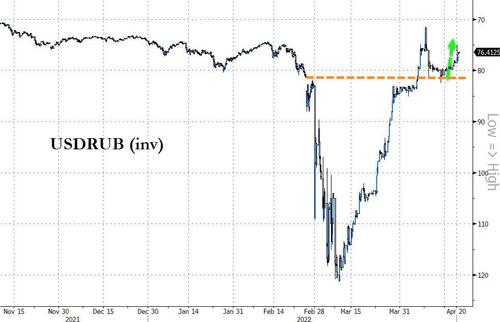
Source: Bloomberg
Bitcoin ended the day basically unchanged after testing above $42k and below $41k…
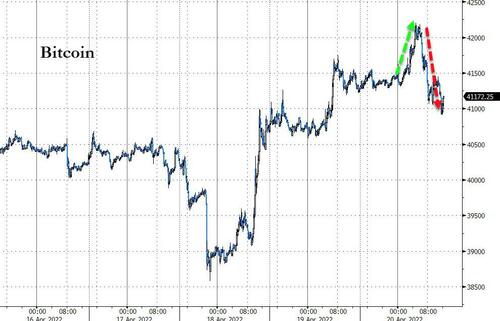
Source: Bloomberg
Gold ended marginally lower, but seemed to hold $1950…
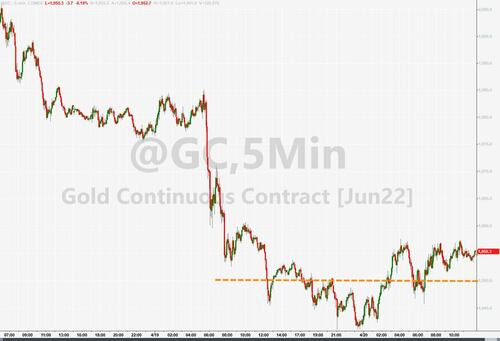
WTI ended the day modestly higher after finding support at the $100 handle…
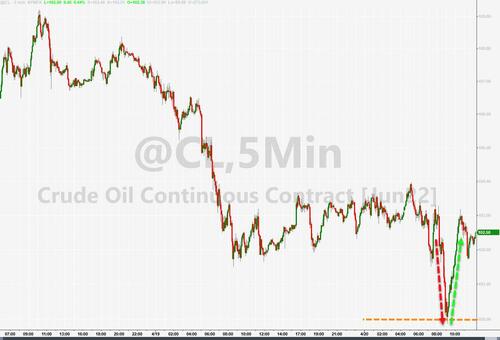
Finally, today is the 2 year anniversary of WTI futures closing negative for the first time in history. Since that day, WTI is up a stunning $140 per barrel… the largest surge in absolute price ever…
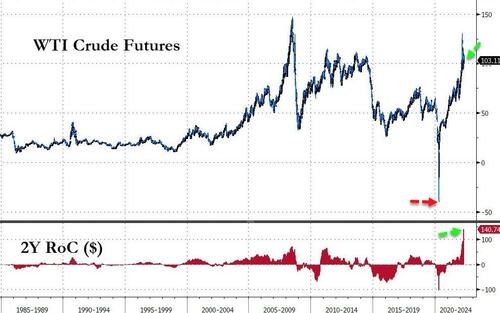
Source: Bloomberg
It’s also another anniversary… of President Biden saying this…
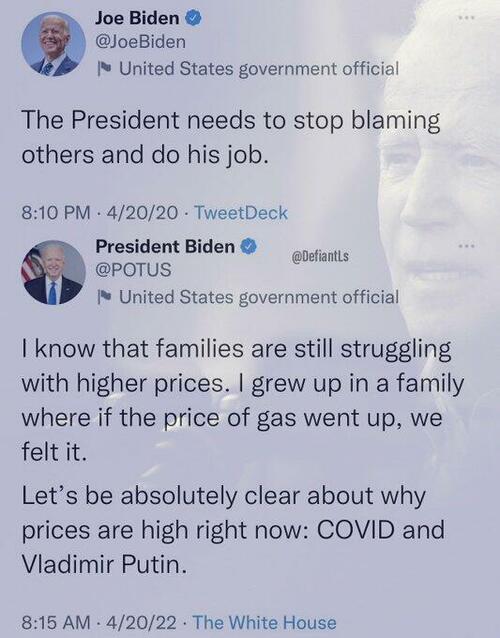
And gas prices are up quite a bit since he took over…
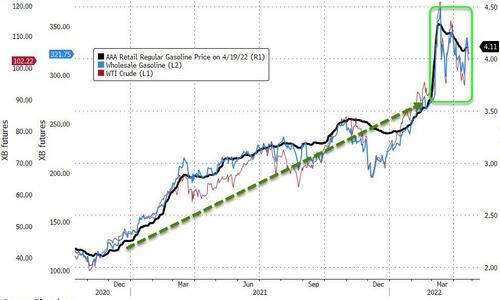
Source: Bloomberg
‘probably nothing’ right?
END
I) /MORNING TRADING/
AFTERNOON
END
II)USA data
-END-
IIB) USA COVID/VACCINE MANDATES
end
end
iiia) USA inflation//SHIPPING commentaries//LOG JAMS//
This is becoming quite obvious, the rising inflation is causing unaffordability: renters just cannot earn enough to ever own a home
(zerohedge)
Rising Unaffordability Is Causing Renters To Abandon Hope Of Ever Owning A Home
TUESDAY, APR 19, 2022 – 10:25 PM
After two years of a buying frenzy that has become self-reinforcing as investors and speculators have sought to cash in on the trend, it looks like American homebuyers are getting ready to throw in the towel.
The New York Fed’s 2022 SCE Housing Survey (readers can find a breakdown on the New York Fed’s blog, Liberty Street Economics), released Monday, showed the that respondents believe they would be less likely to buy if they were to move compared to the year-ago survey, marking the first annual decline since the series began in 2014. Compared with last February, the drop amounted to a decline of 10 percentage points.
The drop was driven by the current renter segment; the Fed’s data showed renters were much less likely to buy compared to renters in the 2021 survey. The survey also showed that while respondents see prices for homes in their zip codes rising over the coming year, they expect that pace to cool five substantially over the next five years, slowing from an average of nearly 6 percentage points, to 2 percentage points, both on an annualized basis.
What’s more, the share of respondents stating that they believe housing to be a “good” or “very good” investment fell slightly to 71% compared to its series high of 73.6% in February 2021.
Put another way, this essentially confirms something that we have been warning about for months now. Housing affordability has been crashing by the most on record, as the surge in prices over the last two years has left first-time buyers at a tremendous disadvantage.
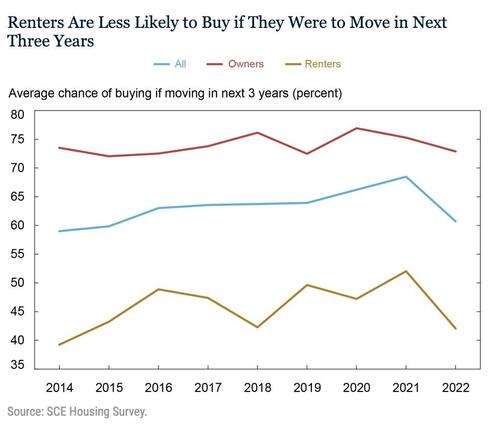
The data confirm something that the NAR, BofA and others have warned about as well. For example, BofA in particular has warned that the housing-market euphoria seen last year seemed unlikely to continue. Their reasoning relies mostly on the pickup in mortgage rates, which have surged to one record after another as bond yields relentlessly moved higher.
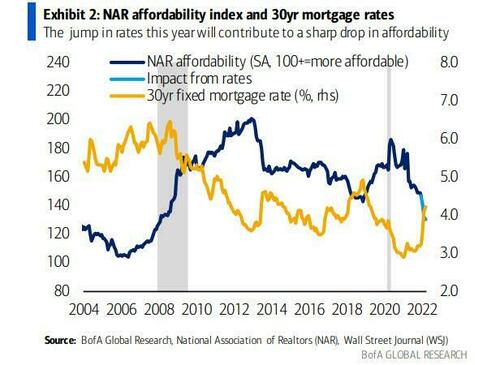
The drop in affordability has already corresponded with a drop in home sales.
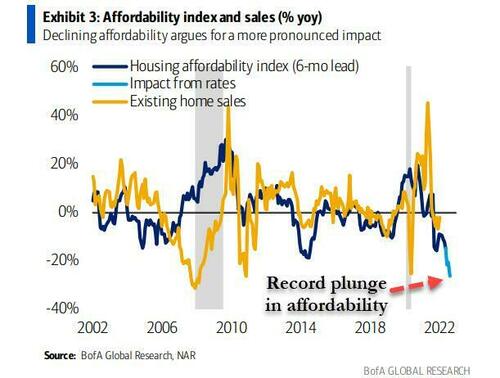
And for what it’s worth, consumers are bracing for rising rents both over the coming year and during the years to come.
But of all the charts published by the Fed to illustrate the survey data, this probably does the best job: the percentage of renters who believe they will ever own a home has also fallen to the lowest level since the survey began.
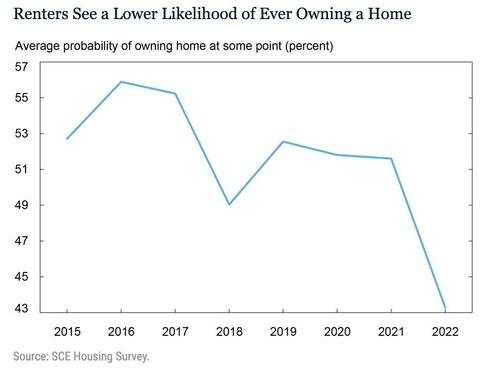
So, not only are renters bracing for surging rents in the years to come, but many are giving up hope of ever owning a home.
end
Does not look like the uSA economy is booming
(zerohedge)
US Existing Home Sales Slump Near 2-Year Lows As Mortgage Rates Soar
WEDNESDAY, APR 20, 2022 – 10:09 AM
After crashing in March, existing home sales were expected to keep slumping in April as mortgage rates have done nothing but accelerate and mortgage applications collapse. Analysts were right as existing home sales fell to 5.77mm SAAR (as expected), sliding 2.7% MoM, slightly better than expected (but only because of a downwardly revised 8.6% MoM drop in March). Existing home sales are now down year-over-year for the eight straight month…
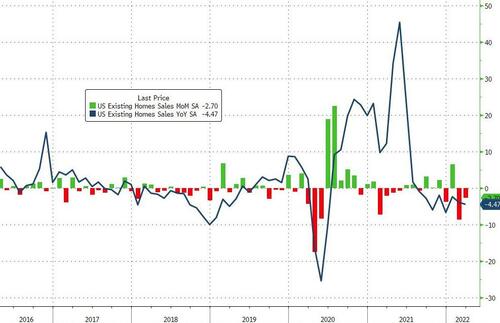
Source: Bloomberg
That is the lowest SAAR since June 2020…
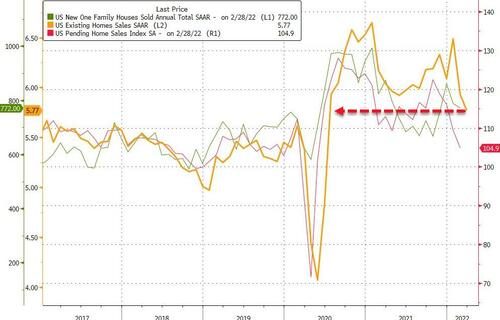
Source: Bloomberg
All-cash sales accounted for 28% of transactions in March, up from both the 25% recorded in February and from 23% in March 2021.
“With rising mortgage rates, cash sales made up a larger fraction of transactions, climbing to the highest share since 2014,” Yun said.
Total housing inventory at the end of March totaled 950,000 units, up 11.8% from February and down 9.5% from one year ago (1.05 million). Unsold inventory sits at a 2.0-month supply at the present sales pace, up from 1.7 months in February and down from 2.1 months in March 2021.
“Home prices have consistently moved upward as supply remains tight,” Yun said.
“However, sellers should not expect the easy-profit gains and should look for multiple offers to fade as demand continues to subside.”
The median existing-home price for all housing types in March was $375,300, up 15.0% from March 2021 ($326,300)…

…as prices rose in each region.
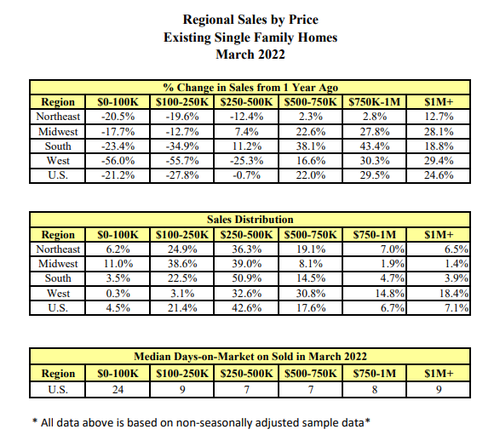
This marks 121 consecutive months of year-over-year increases, the longest-running streak on record.
“The housing market is starting to feel the impact of sharply rising mortgage rates and higher inflation taking a hit on purchasing power,” said Lawrence Yun, NAR’s chief economist.
“Still, homes are selling rapidly, and home price gains remain in the double-digits.”
With mortgage rates expected to rise further, Yun predicts transactions to contract by 10% this year, for home prices to readjust, and for gains to grow around 5%.
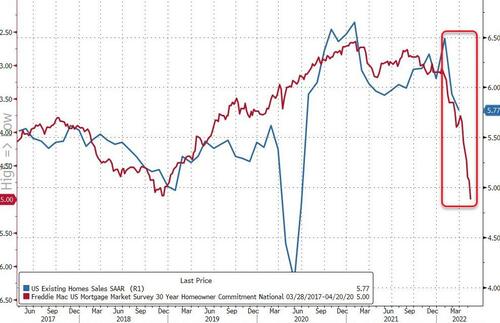
Source: Bloomberg
Just how much pain will Powell push before he folds?
IIIB) USA ECONOMIC STORIES
Beige Book Finds Economy Growing At “Moderate Pace”; Spots First Instances Of Demand Destruction, Slowing Wage Growth
WEDNESDAY, APR 20, 2022 – 02:26 PM
With the Fed now telegraphing to markets that a 50 bps rate hike in two weeks is in the bag, moments ago the latest Fed Beige Book validated the cheerful economic outlook, noting that based on information collected before April 11, 2022, US economy activity expanded at “moderate” (no longer “modest”) pace with several Districts reporting “moderate employment gains despite hiring and retention challenges in the labor market.” At the same time, with Covid now a long-gone nanny state nightmare consumer spending accelerated among retail and non-financial service firms, as virus cases tapered across the country.
The report also notes that manufacturing activity was solid overall across most Districts, but the usual suspects – supply chain backlogs, labor market tightness, and elevated input costs – continued to pose challenges on firms’ abilities to meet demand. Worse, the Beige Book also noted that demand destruction from soaring prices is starting to emerge, and notes that “contacts in a few Districts noted negative sales impacts from rising prices. Firms in most Districts expected inflationary pressures to continue over the coming months.”
Some other highlights from the report:
- Commercial real estate activity accelerated modestly as office occupancy and retail activity increased. Districts’ contacts reported continued strong demand for residential real estate but limited supply.
- Agricultural conditions were mixed across regions. Farmers were supported by surging crop prices, but drought conditions were a challenge in some Districts and increasing input costs were squeezing producer margins across the nation.
- Vehicle sales remained largely constrained by low inventories.
- Outlooks for future growth were clouded by the uncertainty created by recent geopolitical developments and rising prices.
Looking at labor markets, employment increased at a moderate pace. Demand for workers continued to be strong across most Districts and industry sectors. But hiring was held back by the overall lack of available workers, though several Districts reported signs of modest improvement in worker availability.
- Many firms reported significant turnover as workers left for higher wages and more flexible job schedules. Persistent labor demand continued to fuel strong wage growth, particularly for footloose workers willing to change jobs.
- Firms reported that inflationary pressures were also contributing to higher wages, and that higher wages were doing little to alleviate widespread job vacancies.
Perhaps most importantly, the Beige Book notes that “some contacts reported early signs that the strong pace of wage growth had begun to slow.” This will surely bolster the “peak inflation” thesis.
Meanwhile inflation, of course, remains the big problem, with the report noting that inflationary pressures remained strong since the last report, with firms continuing to pass swiftly rising input costs through to customers.
- Contacts across Districts, particularly those in manufacturing, noted steep increases in raw materials, transportation, and labor costs.
- In multiple Districts, contacts reported spikes in prices for energy, metals, and agricultural commodities following the Russian invasion of Ukraine, and several noted that COVID-19 lockdowns in China had worsened supply chain disruptions.
- A few reports noted that input suppliers were making use of more flexible contract terms or only honoring price quotes for 24 hours. Strong demand generally allowed firms to pass through input cost increases to customers, for example, via fuel surcharges for freight and airline fares.
The big highlight, however, is that as noted above, several districts noted negative sales impacts from rising prices.
Finally, looking ahead don’t expect a big drop in inflation: firms in most Districts expected inflationary pressures to continue over the coming months.
Elsewhere, several months of improvement (i.e. reduction) in mentions of shortages, recall that the March Beige Book saw a modest deterioration, with “mentions” of shortage rising from 55 in January to 60 in March. Well, not so much in April, when the word “shortage” was used just 52 times, the fewest since April of 2021.
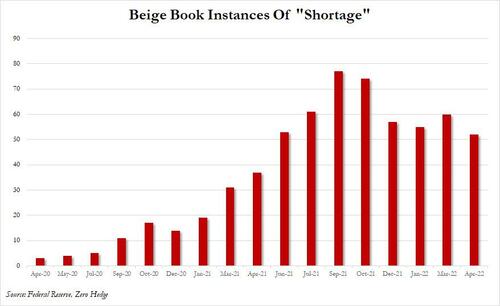
However, the easing in shortages was more than offset by a surge in what is a clear proxy for inflation. As shown below, as shortages are easing, what is rising is, well, “rising” – yes the word “rising” was used no less than 57 times, almost double the 32 times in March, and – usually in the context of prices or joblessness – indicates that things are getting worse, not better.

Finally, here are the highlights by Federal Reserve District
- Boston: Economic activity expanded at a modest pace on aver-age. Headcounts increased modestly despite significant layoffs by one large firm. Wages and output prices alike increased at a moderate pace, but some nonlabor input prices soared. The outlook remained optimistic, but several contacts perceived an increase in downside risks.
- New York:Growth picked up to a moderate pace in recent weeks, despite supply disruptions, worker shortages, and un-seasonably inclement weather. Tourism, consumer spending, and manufacturing activity all picked up. Businesses continued to report substantial increases in selling prices, input prices, and wages. Overall, business contacts have become less optimistic about the near-term outlook.
- Philadelphia:Business activity continued to grow modestly during the current Beige Book period, and some sectors remained below pre-pandemic levels. Customer traffic resumed and workers began returning to offices, as the lull in COVID-19 cases continued. The labor market remained tight with moderate growth, while wages eased to a moderate pace and prices grew sharply.
- Cleveland:The District’s economy expanded at a moderate pace despite ongoing supply and labor constraints. The war in Ukraine had little meaningful impact on current demand for goods and services, but it added another layer of complexity to supply chains. However, contacts said that the war had significantly increased uncertainty and put further upward pressure on costs, particularly for energy, metals, and agricultural commodities.
- Richmond:The regional economy expanded moderately, but some businesses were concerned that rising energy prices and the war in Ukraine could have adverse effects on business conditions in coming weeks and months. Many Fifth District businesses reported increasing employment and that rising costs of labor, materials, transportation and energy contributed to strong price growth in recent weeks.
- Atlanta:Economic activity expanded at a moderate pace. Labor markets remained tight, and wages continued rising. Nonlabor costs rose. Retail sales were strong. Tourism activity strengthened. Housing demand was strong. Commercial real estate conditions were mixed. Manufacturing activity was robust. Banking conditions were steady.
- Chicago:Economic activity increased moderately. Employment increased strongly, and consumer spending, business spending, manufacturing, and construction and real estate were up modestly. Wages and prices rose rapidly, while financial conditions tightened some. Agriculture markets experienced price increases and substantial volatility related to Russia’s invasion of Ukraine.
- St. Louis:Economic conditions have improved at a moderate pace since our previous report. Prices for food and raw materials increased at a robust pace. The pace of hiring rose slightly, but labor shortages continued to limit output and wage growth remained strong. Consumer spending on services rose, but some softening in retail spending pointed to a mixed outlook moving forward.
- Minneapolis:The region’s economy grew moderately since mid-February. Despite continued price pressures, overall demand in most sectors remained healthy. Meeting that demand, however, was checked by tight labor, supply chain difficulties, and other challenges. Firms expressed rising interest in automation to address persistent pressures on wages and labor availability. Startup loans to Minority- and women-owned business enterprises in rural areas were on the rise.
- Kansas City:Growth in the Tenth District accelerated to a robust pace. Prices increased rapidly and contacts reported changing prices much more frequently than is typical. Labor markets tightened further. The invasion of Ukraine disrupted supply chains and caused input prices to rise, but District businesses reported no effects on demand, hiring or planned capital expenditures.
- Dallas:Economic activity expanded at a faster clip. Growth was broad-based across sectors, but many firms noted sup-ply-chain disruptions as a primary constraint on revenues. Employment and wages rose robustly. Supply-chain issues and energy prices continued to drive up costs. Optimism in outlooks waned, and uncertainty increased because of mounting headwinds.
- San Francisco:Economic activity strengthened moderately over the re-porting period. Employment levels expanded while over-all conditions in the labor market remained tight. Wages and price levels significantly increased. Retail sales and consumer and business services sector activity continued to expand, while the agriculture and resource sectors strengthened a bit. Lending activity was little changed.
The full report can be found here.
iv)swamp stories
Carbon tax is the most useless tax out there. Louisiana is asking the Supreme court to block the Biden administration from calculating “social cost: ” of carbon emissions
(Vadum/EpochTimes)
Louisiana Asks SCOTUS To Block Biden Administration From Calculating ‘Social Cost’ Of Carbon Emissions
TUESDAY, APR 19, 2022 – 08:05 PM
Authored by Matthew Vadum via The Epoch Times (emphasis ours),
Louisiana Attorney General Jeff Landry is vowing to ask the U.S. Supreme Court to prevent the Biden administration from recalculating and using the “social cost” of carbon emissions, a metric used in climate regulation that critics say needlessly drives up operating costs for businesses and prices for consumers.
Critics have long said that the classification of carbon dioxide, the gas humans expel from their lungs when breathing, as a pollutant makes no sense. Carbon dioxide is essential to life on the planet and is used in the process of photosynthesis, which spurs plant growth. But environmentalists claim that human-created carbon dioxide contributes to climate change.
The social cost of carbon, a measurement in dollars of the damages supposedly caused by releasing a metric ton of greenhouse gases, is used by policymakers to provide cost-benefit analyses and to write regulations. Placing a monetary value on the effect of the gases gives federal regulators ammunition to justify tougher environmental regulations.
On Inauguration Day, President Joe Biden signed an executive order that resurrected an interagency working group on the social cost of carbon and temporarily set the cost at $51 per metric ton, the level used before President Donald Trump took office in 2017. During his presidency, Trump had reduced the social cost figure to as low as $1 per metric ton. Biden’s working group was studying the social cost with a view to establishing a new, presumably higher rate.
In February, U.S. District Judge James D. Cain Jr. of the Western District of Louisiana, agreed with Louisiana and nine other states, issuing an order blocking the use of the interim metric. The states told Cain, who was appointed by Trump, that the metric was arbitrary and would boost the cost of producing energy and hike regulatory costs for states.
At the time, Max Sarinsky, an attorney at the Institute for Policy Integrity at NYU Law School, said Cain’s injunction might not survive.
“This injunction is extraordinarily broad,” Sarinsky told Axios. “I think it will receive very, very close scrutiny on appeal.”
In mid-March, the U.S. Court of Appeals for the 5th Circuit stayed Cain’s injunction at the request of the Biden administration in an emergency application. The appeals court held that Louisiana and the other states challenging the metric had raised “merely hypothetical” claims of harm and that they probably didn’t have legal standing to take action in court.
Greenwire reported that days later, the states asked the 5th Circuit to hear the case, arguing that allowing the use of the social cost metric “lets one of the most consequential regulations in history remain in effect … despite the irreparable harm it’s causing the states.” The appeals court denied the rehearing.
“We are disappointed in the 5th Circuit’s decision, and we will appeal to the Supreme Court,” Landry’s office told E&E News, a trade publication. “Attorney General Landry will continue fighting the Biden administration’s attempts to inject the government into the everyday lives of Americans.”
Landry’s comments come as the Supreme Court is considering West Virginia v. EPA, which the court heard on Feb. 28.
West Virginia Attorney General Patrick Morrisey previously told The Epoch Times that he hopes the Supreme Court will use the case to rein in the far-reaching powers of the U.S. Environmental Protection Agency (EPA) to shut down carbon dioxide-generating industries without regard to the economic well-being of those affected.
The problem is that the EPA is trying to transform itself from “an environmental regulator into a central energy planning authority,” according to Morrisey, a Republican.
West Virginia is a major producer of coal, natural gas, and crude oil. West Virginia and 18 other states are challenging the authority that the Clean Air Act provides to the EPA. The challengers hope the high court will resolve whether the U.S. Constitution gives Congress the power to delegate regulatory authority to the EPA to limit so-called greenhouse gas emissions.
The challenge comes years after the Supreme Court ruled 5–4 in Massachusetts v. EPA (2007) that the agency can regulate greenhouse gas emissions such as carbon dioxide as “air pollutants” under the act. In the decision, the court called climate change “the most pressing environmental challenge of our time.”
end
Virtually No One Shows Up To Hear Biden Claim He Was The “Poorest Man In Congress”
WEDNESDAY, APR 20, 2022 – 08:45 AM
Authored by Steve Watson via Summit News,
Joe Biden, the sitting President, and apparently the most voted for president in history, struggled to rally a crowd of more than fifty people in New Hampshire Tuesday, where he complained to them that he was “the poorest man in Congress.”

Biden was visiting the Port Authority at Portsmouth Harbor. His record low approval rating was clear to see as only a few tens of people showed up.
There were empty seats.
Biden apparently believes he’s the only Democrat who can beat Trump in 2024. Judging from this turnout, compared to Trump filling entire stadiums, he’ll struggle. Although, magically, that didn’t seem to translate to a lack of votes last time. Perhaps that’s why he has confidence in his ability to win again, despite even the leftist media admitting he’s weak and lacks leadership.
During the appearance in front of his tens of supporters Biden again claimed that rampant inflation in the U.S. is because of Vladimir Putin, a notion that only a complete fool would believe at this point.
He also again lied and said that gas prices were volatile during his childhood (they were not).
Then he told the “crowd” that “I’m so tired of trickle-down economics. I never found that it trickled down on top of my head very much. I was listed … as the poorest man in Congress for 36 years. I didn’t think you should make money while you’re in office.”
end
The King Report (including swamp stories)
t was crystal clear on Monday, that someone wanted to force US stocks higher by ESM manipulation.
ESMs were negative at 9:06 ET. By 10:48 ET, they had soared 71 points due to a near vertical rally. ESMs and stocks then inched their way modestly higher until peaking at 11:51 ET. ESMs and US stocks effectively traded sideways in a moderate range from the end of the first hour of NYSE trading until they eased lower near the 14:15 VIX Fix. Perhaps, the determined ESM manipulation occurred because yesterday was the last trading day for April VIX options. The expiration is today.
ESMs and stocks bottomed at 14:20 ET. After inching a tad higher for 15 minutes, the rally for the expected last-hour upward manipulation commenced. As expected, someone juiced ESMs when the final hour arrived. At 15:38 ET, ESMs had soared 95.25 from their low – on no impact news! ESMs tumbled 28.00 during the final 9 minutes of trading.
The late ESM manipulation coincided with a Big Guy address in New Hampshire that was sparsely attended. Pic: https://twitter.com/RNCResearch/status/1516491255643004928
@townhallcom: BIDEN: “Last year alone, [automobiles] accounted for 1/3 of all the inflation in America because the price went up because so fewer were be made… Last month about 70% of the increase in inflation was a consequence of Putin’s Price Hike… The war in Ukraine is going to continue to take its toll on the world economy. It’s going to take its toll on energy, and it’s going to take its toll relative to food.” https://twitter.com/townhallcom/status/1516495635469553665
Biden: “I had the great pleasure of being listed as the poorest man in Congress for 36 years. I still had making a helluva lot more money than anybody else because I was getting a Senator’s salary. No kidding. I didn’t think you should make money while you’re in office.” (You cannot make this up!)
https://twitter.com/Breaking911/status/1516503898168692747
The DJTA soared because oil sank after the Nikkei closed. May WTI Oil tumbled from a high of 108.92 to 102.10 at the European close. There was no impact news concerning oil.
Oil From Joe Biden’s Emergency SPR Release Is Heading to Europe- Not to US Consumers
According to Bloomberg, citing a person familiar with the matter, the Suezmax ship Advantage Spring – sailing for Rotterdam, according to ship-tracking data compiled by Bloomberg – received emergency SPR sweet crude from Energy Transfer’s Nederland oil facility around April 1 for export…
https://www.zerohedge.com/commodities/oil-bidens-emergency-spr-release-heading-europe?s=02
Bonds declined sharply after Europe opened. USMs hit a bottom of -1 7/32 (3.01%) at 10:13 ET. After a moderate rally, bonds and notes tumbled during the final hour of NYSE trading. The 2-year note hit 2.61%, the 10-year 2.946%, the 30-year 3.005%.
The yen is skidding toward its longest losing streak in at least half a century
Japan’s currency slid for a 13th day against the dollar, the longest run of losses in Bloomberg data starting in 1971… The yen traded at 128.31 per dollar as of 7:32 a.m. in New York after earlier hitting 128.46, the weakest level since May 2002. The currency has slumped 5% since its current run of losses began on April 1… “Until the BOJ changes its ultra-dovish stance, the monetary policy divergence argues for continued yen weakness and intervention would likely have little lasting impact,” said Win Thin, global head of currency strategy at Brown Brothers Harriman & Co…
https://www.yahoo.com/now/yen-tumbles-longest-ever-losing-190916148.html
Yen weakness propelled the Dollar Index higher, which generated steep declines in precious metals.
US March Housing Starts increased 1.793m units (1.74m expected) due to a 4.6% m/m jump in multi-family units. Single-family units declined 1.7% m/m. Permits rose 1.873m (1.82m expected) on a 10% m/m explosion in multi-family units. Single-family units declined 4.8% m/m. Surging rents are drawing investors. Completions declined 4.5% m/m; single-family completions tumbled 6.4% m/m.
U.S. single-family starts tumble; construction backlog at record high http://reut.rs/3JUprwL
J&J Trims Annual Profit Forecast, Citing Currency Headwinds
Adjusted earnings for the year will be $10.15 to $10.35 a share, down from an earlier range of $10.40 to $10.60… the change was “exclusively” due to exchange rates that shaved $2.5 billion off anticipated top-line growth for the year. First-quarter adjusted profit was $2.67 a share, outpacing analysts’ average estimate of $2.59. Sales for the quarter were $23.4 billion, narrowly missing the average estimate. J&J maintained its operational profit and sales forecast and boosted its quarterly dividend to $1.13 a share from $1.06… https://www.yahoo.com/now/j-j-trims-annual-profit-142852956.html
Despite J&J’s lower guidance, the stock soared 4.57% in early trading and hit an all-time high!
@JackDetsch: Zelensky claims Ukraine would have defeated Russia by now if West had granted all UA weapons requests. “We would have restored peace and liberated our territory,” Zelensky said. “Because the superiority of the Ukrainian military in tactics and wisdom is quite obvious…
The Tank Is Dead: Long Live the Javelin, the Switchblade, the … ?
Is the value of the tank in modern warfare zilch? That’s the lesson many observers are taking from a flood of images depicting Russian tanks mired in the mud, their turrets blown off, having been ambushed and destroyed by Ukrainian forces armed with cheap anti-tank weapons…
After the recent Nagorno-Karabakh war, in which Russian-produced tanks were destroyed by the same model of drones, this is heady stuff for those ready to proclaim the death of the tank…
In the past decade the growing ubiquity of unmanned aerial systems on the battlefield has been stunning. Be they Predators, Reapers, Switchblades, Turkish TB2s, loitering munitions, or weaponized toys, unmanned aerial systems are a capability with which to be reckoned. As already noted, many existing armored ground systems are vulnerable to top-down attacks. This type of attack can also be delivered by drones. Other uses that have shown great utility include intelligence, surveillance, and reconnaissance; geolocating targets; communications relays; and jamming, to mention but a few…
We should all recall the words of Australian Maj. Gen. Kathryn Toohey in 2019: “Tanks are like dinner jackets. You don’t need them very often, but when you do, nothing else will do.” The general’s caution explains why the tank has endured and why it is perhaps not time for its funeral, unless she can be proven wrong. https://warontherocks.com/2022/04/the-tank-is-dead-long-live-the-javelin-the-switchblade-the/
Shares of Netflix cratered more than 23% on Tuesday after the company reported a loss of 200,000 subscribers during the first quarter… Netflix previously told shareholders it expected to add 2.5 million net subscribers during the first quarter. Analysts had predicted that number will be closer to 2.7 million. During the same period a year ago, Netflix added 3.98 million paid users… The company said that the suspension of its service in Russia and the winding-down of all Russian paid memberships resulted in a loss of 700,000 subscribers. Excluding that impact… it would have seen 500,000 net additions during the most recent quarter… (-640k North American subscribers! NFLX projects it will lose 2 million subscribers this quarter!!!) https://www.cnbc.com/2022/04/19/netflix-nflx-earnings-q1-2022.html
Disney shares tumbled as much as 5% in after-hour trading due to Netflix’s dire customer losses.
DeSantis: Florida lawmakers to consider elimination of Disney’s self-governing status http://hill.cm/jjkrYiK
DeSantis Signs Bill to Reform Higher Education
Under the new law, which takes effect July 1, tenured faculty will be reviewed every five years by a Board of Governors of the State University System of Florida, which will consider such things as accomplishments, productivity, performance metrics. and compensation. “Transparency and accountability is absolutely key,” DeSantis said… We’re going to make sure that our institutions of higher education are committed to excellence, not ideology – we’re going to be even better than we have been, and we’ve been pretty doggone good over the last many years.”… Florida’s higher education institutions were ranked No. 1 in U.S. News and World Report for the last five years…
https://www.zerohedge.com/political/desantis-signs-bill-reform-higher-education
IBM reported EPS of 1.40; 1.41 exp. Revenue $14.20B; $13.81B was consensus. IBM jumped 3%.
CalPERS to vote to replace Buffett as Berkshire chairman… though he would remain chief executive officer… http://reut.rs/3ErD2L0
Today is VIX April expiration. For the past two sessions, there has been clear and unambiguous ESM manipulation. What we said for yesterday’s session remains true for today’s trading: It all depends on the presence or absence of the manipulator(s). Secondly, how much impact will Netflix’s travails have on its fellow Fangs? NQMs tumbled 136.00 and ESMs sank 20.50 after they opened last night. Someone quickly forced them higher. NQMs (Nasdaq 100 June future) rescinded their rally by 19:24 ET and fell to a low of -151.25 at 19:34 ET.
We do not know who is doing the manipulation or why. But it is someone significant. It is not the Fed! At some point, asset allocators will buy bonds and sell stocks. It’s only a question of when.
NGMs are -144.00, ESMs are -18.50, the yen is -0.25%, and USMs are -23/32 at 20:15 ET.
Expected earnings: ANTM 7.73, ABT 1.47, PG 1.29, BKR .19, CSX .37, UAL -4.23, TSLA 2.28
Expected economic data: March Existing Home Sales 5.78m; Fed Beige Book 14:00 ET; SF Fed Pres Daly 10:30 ET, Chicago Fed Pres Evans (Big dove) 11:30 ET, Atlanta Fed Pres Bostic (Dove) 13:00 ET
S&P 500 Index 50-day MA: 4416; 100-day MA: 4517; 150-day MA: 4519; 200-day MA: 4496
DJIA 50-day MA: 34,296; 100-day MA: 34,896; 150-day MA: 35,010; 200-day MA: 35,017
S&P 500 Index – Trender trading model and MACD for key time frames
Monthly: Trender is positive; MACD is negative – a close below 4153.02 triggers a sell signal
Hourly: Trender and MACD are negative – a close above 4547.45 triggers a buy signal
Daily: Trender and MACD are negative – a close above 4529.25 triggers a buy signal
Hourly: Trender and MACD are positive – a close below 4414.13 triggers a sell signal
Massive increase in Black Americans murdered was result of defund police movement: experts
Black Americans were disproportionately affected by the skyrocketing murders of 2020
Murders across the board spiked by nearly 30% in 2020 compared to the year prior, according to FBI data, marking the largest single-year increase in killings since the agency began tracking the crimes. Among Black Americans, the number of deaths spiked by more than 32% compared to 2019…The figures are more staggering considering White Americans make up 76% of the population compared to Black Americans representing only 13%… (What happened to Black Lives Matter?)
https://www.foxnews.com/us/black-americans-paid-enormous-price-for-defund-the-police-movement
@RNCResearch: Biden says it’s “up to” Americans whether they want to wear masks on planes. About an hour before this, Jen Psaki said they “would advise all Americans to [wear masks on airplanes].”
Liberals Raise Concerns About Account That’s Making Them Look Bad by Just Sharing Their Actual Words https://babylonbee.com/news/leftists-worried-libs-of-tiktok-account-making-them-look-bad-by-just-sharing-their-actual-words
WaPo “Tech Reporter” Taylor Lorenz under Fire for Doxxing ‘Libs of TikTok’, Harassing Family
This is the same Taylor Lorenz who broke down in tears because people published her private information online, which she said led to PTSD and having to sever relationships…
https://www.zerohedge.com/political/wapo-tech-reporter-taylor-lorenz-under-fire-doxxing-libs-tiktok-harassing-family
Washington Post backs Taylor Lorenz…
Lorenz used information sourced by a former Twitter employee to reveal the identity of the Libs of TikTok account owner, who chose to operate the account anonymously and is otherwise a private citizen. The Post reporter even showed up to the home of the account owner’s relatives and harassed a random Instagram user with a similar name…The Washington Post stood by Lorenz’s tactics…
The Washington Post‘s assertion that they did not “publish or link to any details about her personal life” appears to be false. According to Washington Examiner reporter Jerry Dunleavy, an early version of the article linked to the Libs of TikTok account owner’s real estate license. The link contained the account owner’s real estate license number, full name, and possible address…
https://spectatorworld.com/topic/washington-post-libs-tik-tok-doxxed-taylor-lorenz/
@seanmdav: Aging left-wing nutjobs like @TaylorLorenz doxx randos because they want their brownshirt Antifa brigade to show up at their homes and violently harass them. That’s why the Left was so angry about Kyle Rittenhouse being acquitted: you’re supposed to submit, not defend yourself.
Twitter Founder Jack Dorsey Shreds CNN, Brian Stelter in Online Rant
“I know this from being on the streets of Ferguson during the protests and watching them try to create conflict and film it causing the protestors to chant ‘f**k CNN,’” Dorsey responded….
https://conservativebrief.com/dorsey-62109/?utm_source=CB&utm_medium=DJD
@JradRabel: I boarded a plane today with my son and midflight, the pilot announces that the mask mandate is over. Flight attendants pulled off their masks and sneezed directly into their hands while screaming “this is MAGA airspace”. My son turned to me in tears. I don’t know what to do. Wow so this blew up, cash app is in the bio for my son’s legal defense fund. We are suing for intentional infliction of emotional distress.
Just got messaged by a NYT journalist about my previous tweet. This is what happened.
https://twitter.com/JradRabel/status/1516260569124323333
@RMConservative: The Brooklyn subway shooting disappeared.
Reporter Demands to Know When Biden Will Apologize to Border Agents Falsely Accused of ‘Whipping’ Migrants – Biden previously vowed to ‘make them pay for what they did’…Of course Biden will never apologise for this and it will be quietly swept under the rug…
https://summit.news/2022/04/19/video-reporter-demands-to-know-when-biden-will-apologise-to-border-agents-falsely-accused-of-whipping-migrants/
Ex-DNI @RichardGrenell: The Pennsylvania Senate approved two bills that would ban outside grant$ to local election offices and prohibit the use of drop-boxes for absentee ballots. The Democrat Governor is against the move. They clearly want to cheat.
Let us close today with this offering courtesy of Greg Hunter interviewing karen Kingston
7 Different Patented Poisons in CV19 Injections – Karen Kingston
By Greg Hunter On April 19, 2022 In Political Analysis13 Comments
By Greg Hunter’s USAWatchdog.com
Karen Kingston is a biotech analyst and a former Pfizer employee who has researched and written about many aspects of the so-called CV19 vaccines. It was never intended to cure anything, and the paperwork proves it at Big Pharma and the CDC. Kingston explains, “We are being lied to at such a level it is difficult for people to comprehend. The American people and global citizens were told the injections were vaccines. In fact, when you look at the patents, they call them bioweapons. They call them ‘toxins,’ they call them ‘agents of chemical biowarfare’. . . . Specifically, there is a 2017 patent related to what they are calling a ‘vaccine.’ The patent is titled ‘Vaccine Nanotechnology.’ . . .It is owned by the NIH, and when you read this nanotechnology patent in section 9, it clearly states in some embodiments, the small molecule is a toxin, a toxin from a chemical weapon, an agent of biowarfare. What they call a ‘vaccine’ in the patent, they say we are going to inject people with bioweapons.”
More stunning information is being uncovered by Kingston’s research and analysis of both government and vaccine maker documents. It appears the vaccine is more than one of several possible treatments all in one injection. Kingston explains, “We are told the mRNA produces just a small sequence of the spike protein. Through my research, I found separate patents for the spike protein. There are seven different spike proteins in the actual patents. This should all be part of the SARS COV II patent. It should not have a separate patent. . . .They all do different things per the patent and per the research.”
So, instead of getting one experimental mRNA injection, could people be injected with a cocktail of separate and different spike proteins? Kinston says, “I am hypothesizing based on the spike proteins having separate patents and separate licensing deals. The scientists say they jimmied the spike protein independent of the mRNA viral sequence. What I am saying, in some of what they are calling vaccines, yes, people are being injected with mRNA producing spike proteins. They can also be injected directly with spike proteins . . . made separately and frozen separately. These spike proteins do have their own patents, they do have their own separate licensing agreements. . . . So, the spike proteins could be made separately and frozen separately, these poisons, and then encapsulated and stuck in the formulation. That is what I am saying. . . . Keep in mind, in the world patent . . . it says in some embodiments can include a delivery device, and that can deliver an agent or a toxin over a period of hours, days, weeks, months or years. . . . This is important for a legal reason because every lawsuit says people were injected with mRNA, which produces a toxin, which is a spike protein. But it turns out, the toxin was in there independent of the mRNA. . . . It’s not a vax. It’s just a direct bioweapon.”
Kingston says all kinds of problems are coming from the CV19 shots and the different patented spike proteins in them. She says some of these spike proteins cause extreme and aggressive cancers, some cause heart disease, still others cause autoimmune disease and some even mimic snake venom. That is just to name just a few of the diseases that are showing up in the real world data.
In closing, Kingston says, “It’s demonic what is in these vials, and it needs to stop.”
(There is much more in the 58 min interview.)
Join Greg Hunter of USAWatchdog.com as he goes One-on-One with biotech analyst Karen Kingston as she talks about the demonic injections being forced on people worldwide on 4.19.22.
(To Donate to USAWatchdog.com Click Here)
After the Interview:
After the Interview:


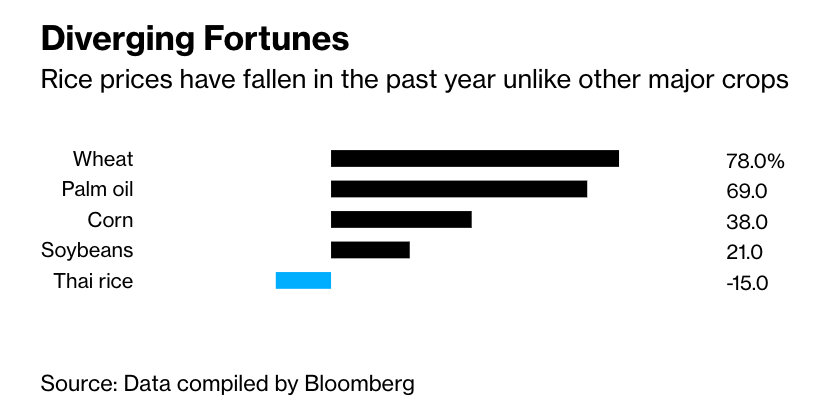
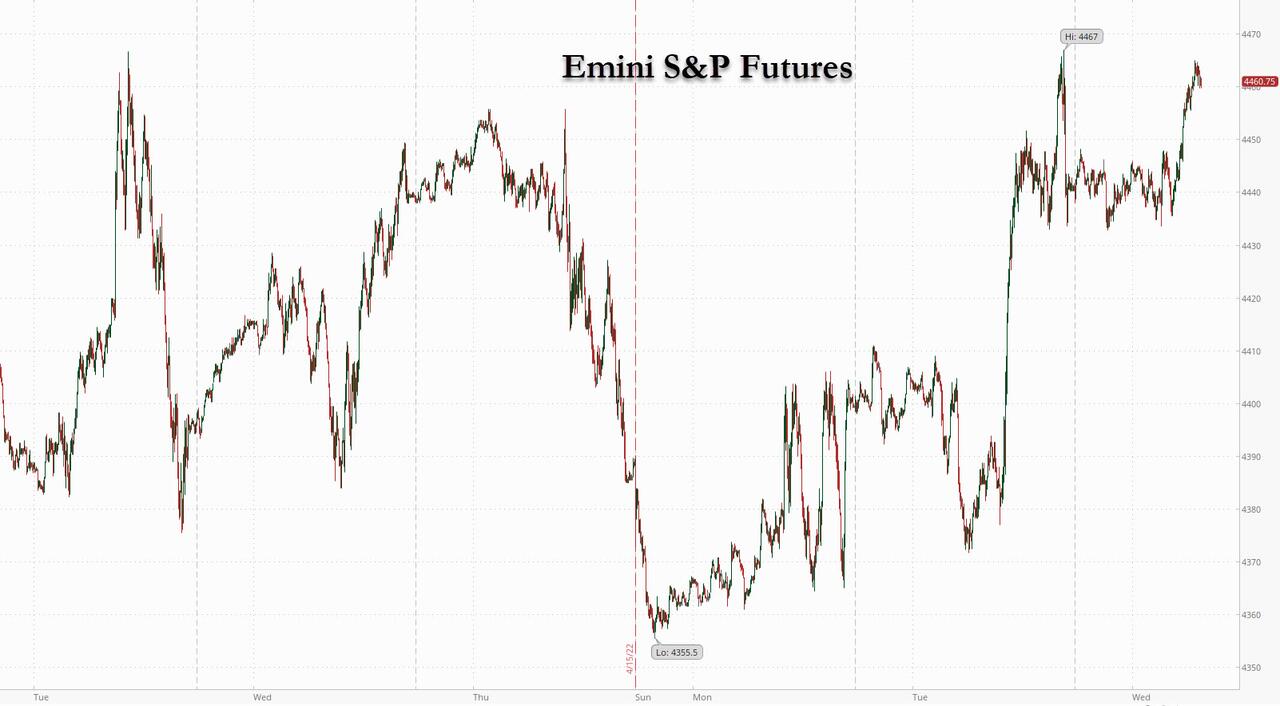
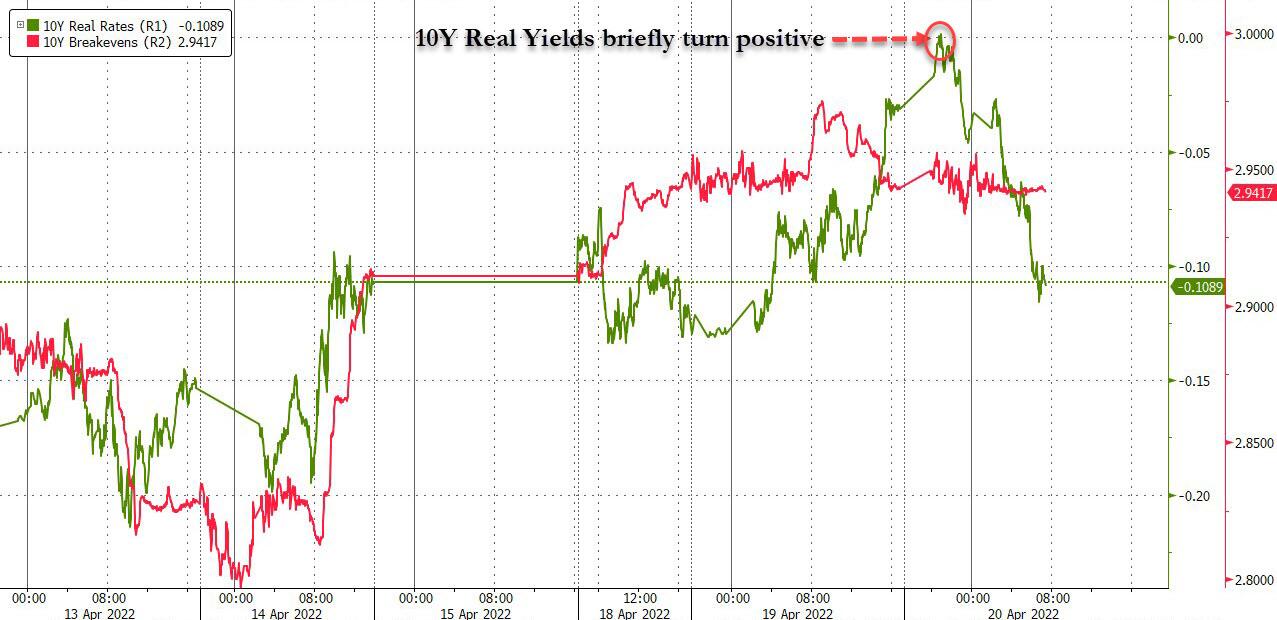
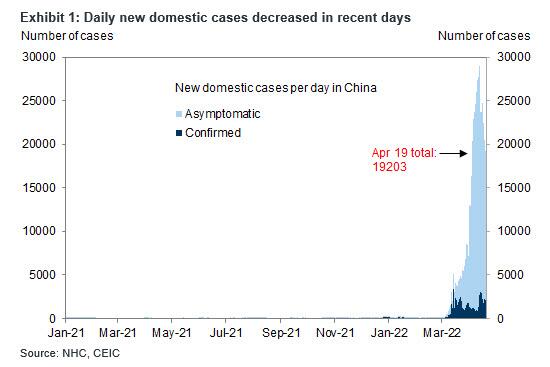
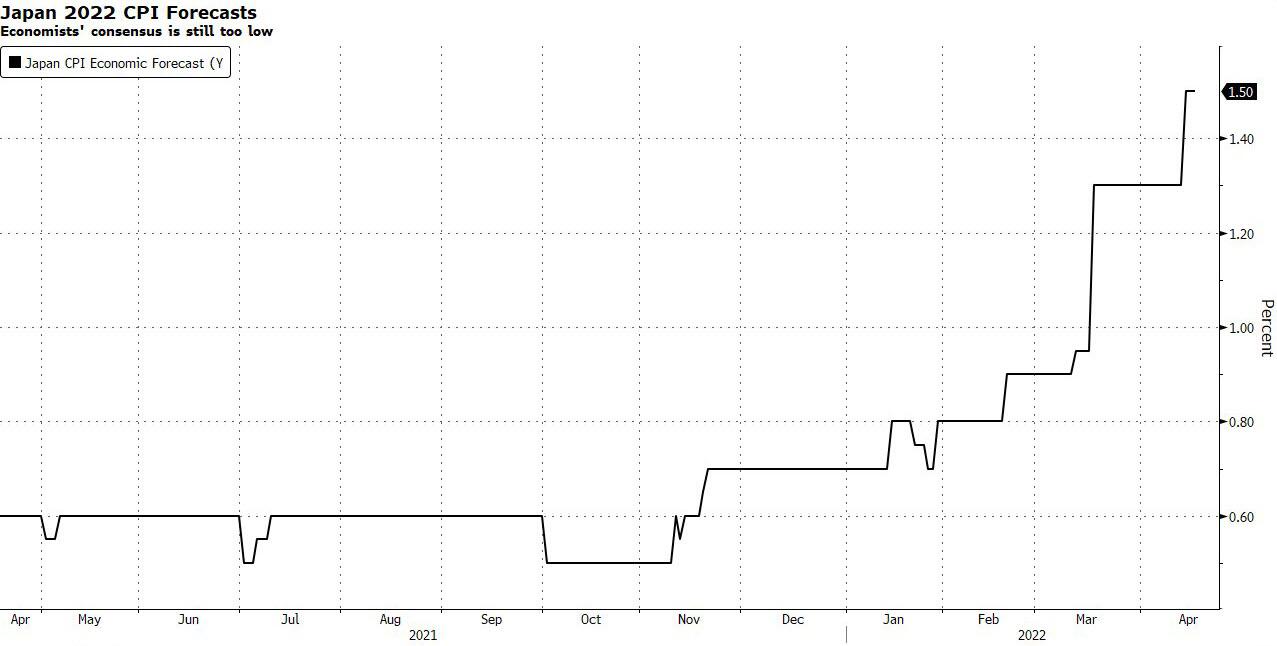
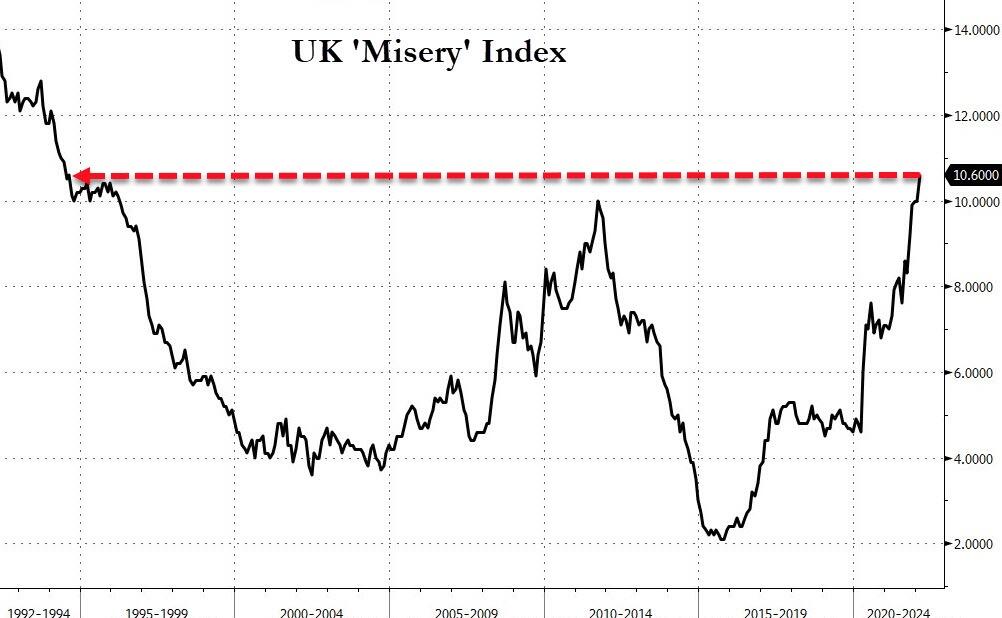
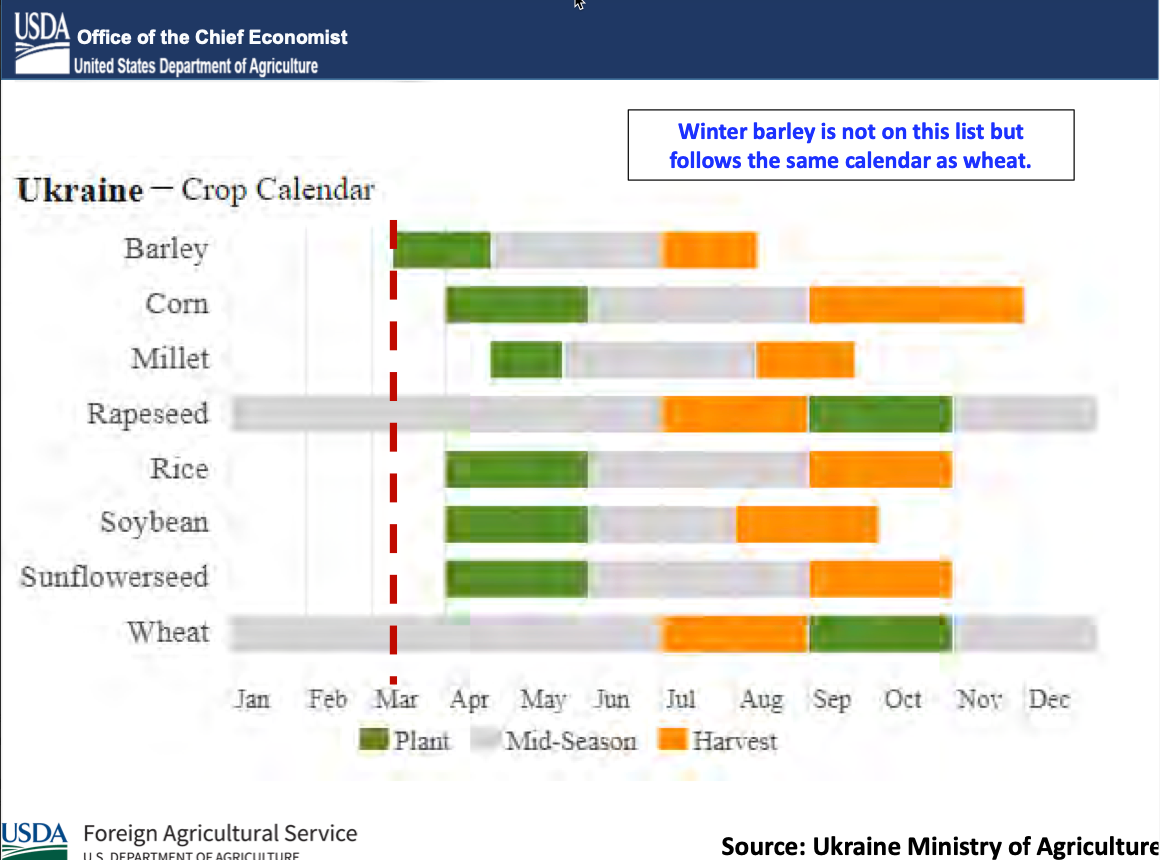
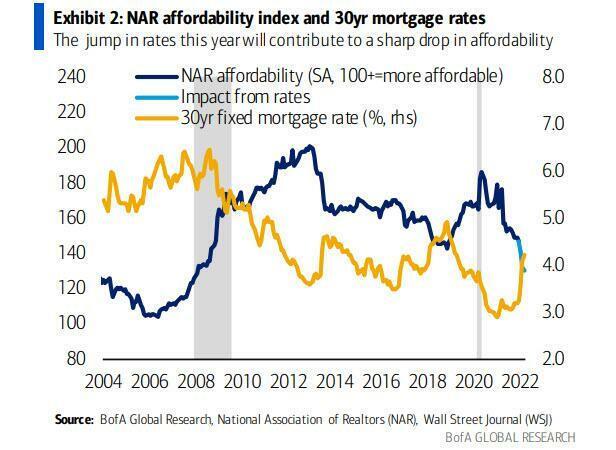
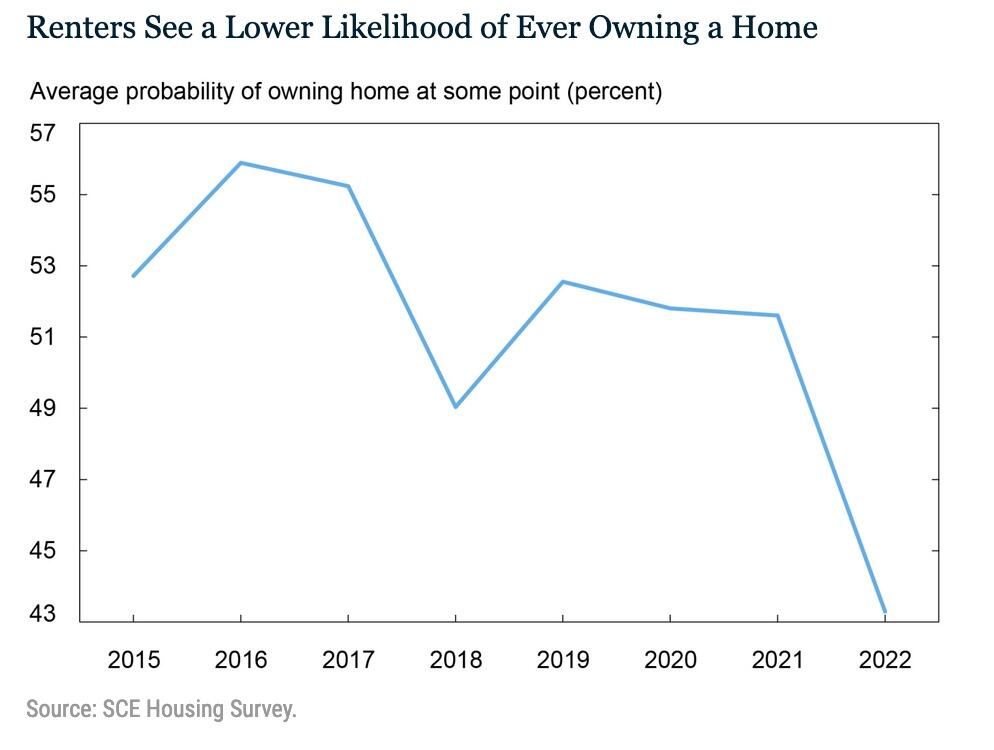
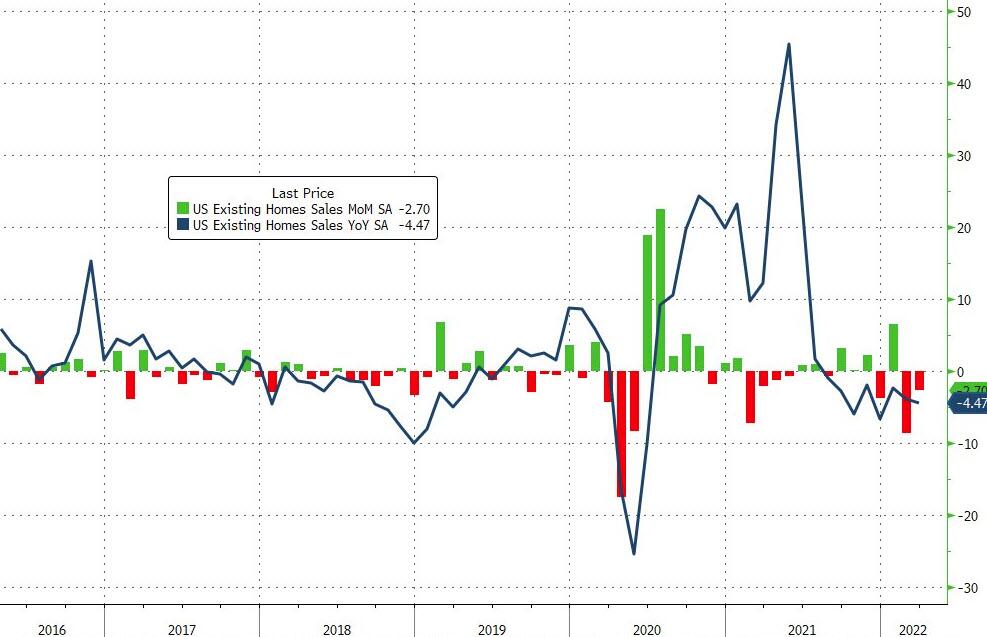
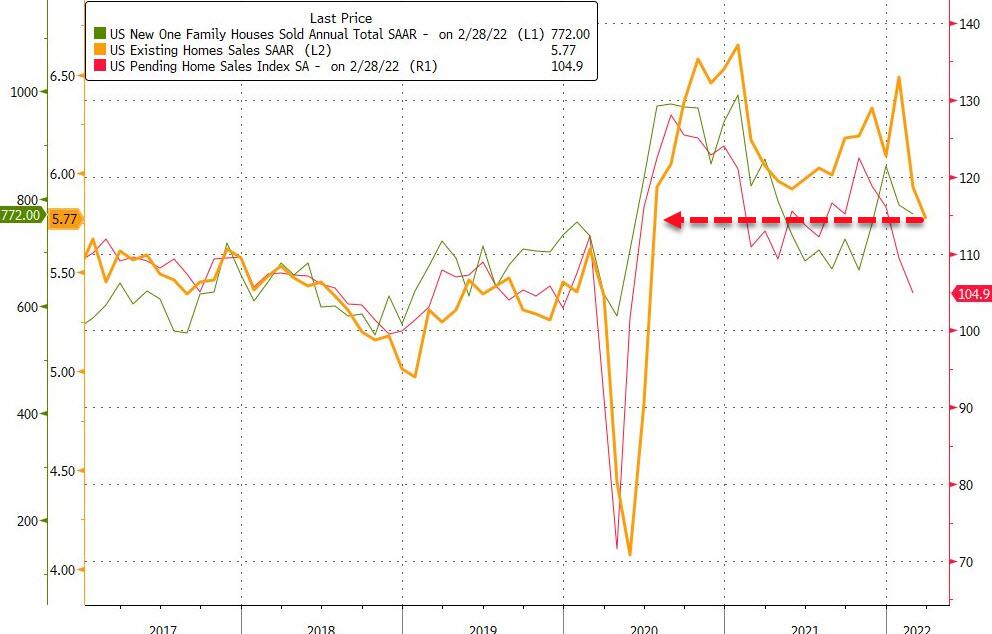
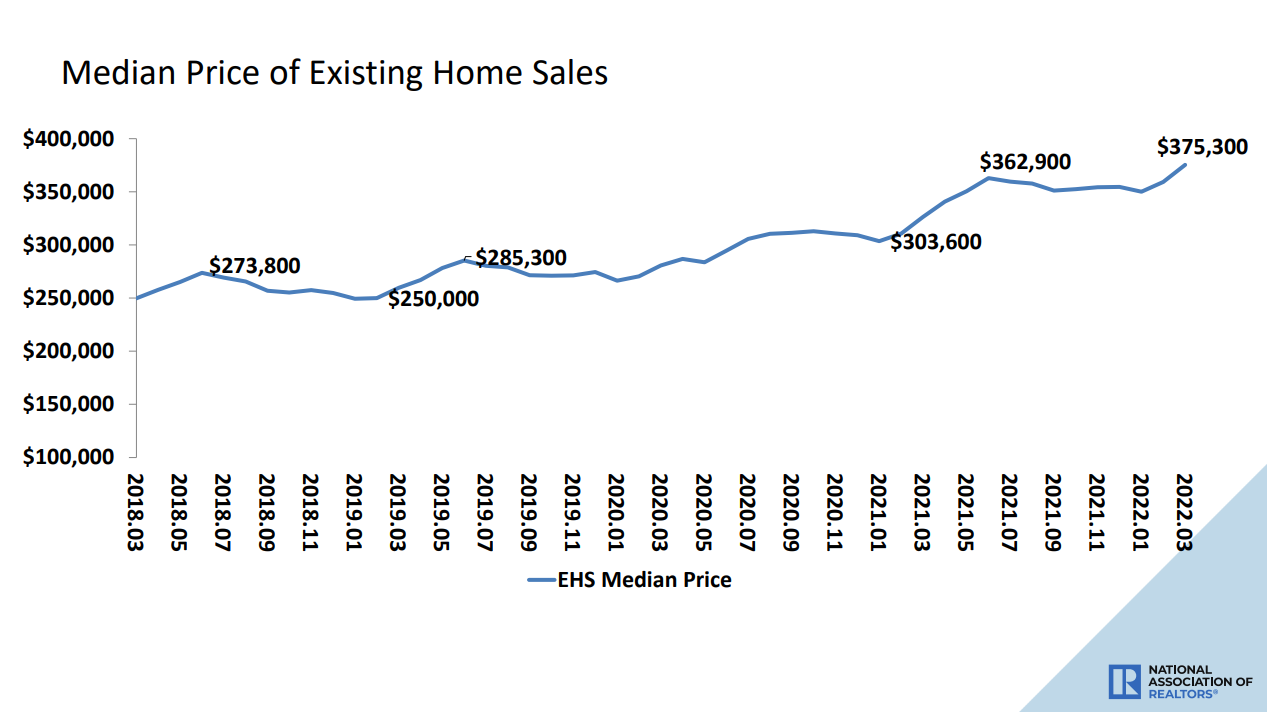
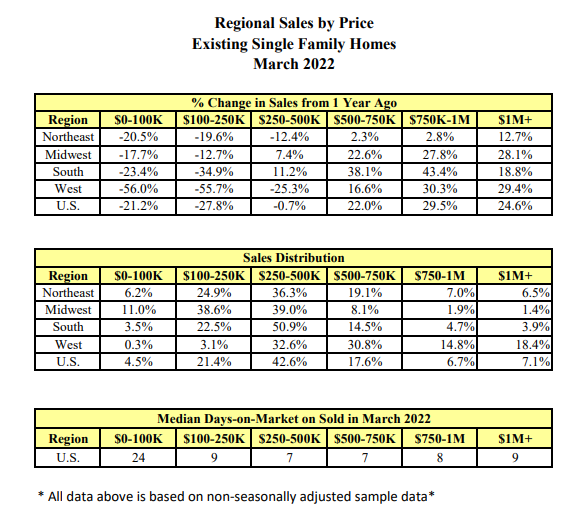
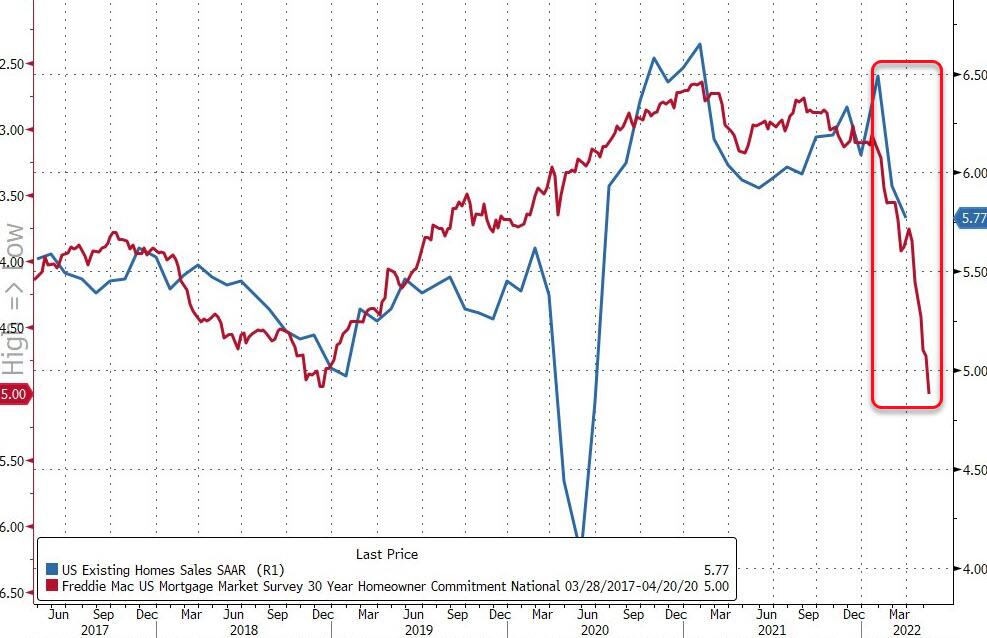
[…] by Harvey Organ, Harvey Organ Blog: […]
LikeLike
[…] by Harvey Organ, Harvey Organ Blog: […]
LikeLike
[…] by harveyorgan · in Uncategorized · Leave a comment·Edit […]
LikeLike