
by harveyorgan · in Uncategorized · Leave a comment·Edit
GOLD PRICE CLOSED: UP $2.80 TO $1958.30
SILVER PRICE CLOSED: DOWN $0.17 AT $23.85
Access prices: closes 4: 15 PM
Gold ACCESS CLOSE 1957.90
Silver ACCESS CLOSE: 23.88
xxxxxxxxxxxxxxxxxxxxxxxxxxxxxx
Bitcoin morning price:, $24,944 DOWN 977 Dollars
Bitcoin: afternoon price: $25,444 DOWN 477 dollars
Platinum price closing $990.85 UP $12.05
Palladium price; $1400.10 DOWN $.40
END
Due to the huge rise in the dollar, we must look at gold and silver in currencies other than the dollar to understand where we are heading
I will now provide gold in Canadian dollars, British pounds and Euros/4: 15 PM ACCESS
CANADIAN GOLD: $2,587.60 DOWN 4.73 CDN dollars per oz (ALL TIME HIGH 2,775.35)
BRITISH GOLD: 1531.54 DOWN 5.60 pounds per oz//(ALL TIME HIGH//CLOSING///1630.29)
EURO GOLD: 1788.40 DOWN 8.13 euros per oz //(ALL TIME HIGH/CLOSING//1861.21)//
DONATE
Click here if you wish to send a donation. I sincerely appreciate it as this site takes a lot of preparation
EXCHANGE: COMEX
EXCHANGE: COMEX
CONTRACT: JUNE 2023 COMEX 100 GOLD FUTURES
SETTLEMENT: 1,955.300000000 USD
INTENT DATE: 06/14/2023 DELIVERY DATE: 06/16/2023
FIRM ORG FIRM NAME ISSUED STOPPED
132 C SG AMERICAS 12
323 C HSBC 480
323 H HSBC 142
357 C WEDBUSH 1
363 H WELLS FARGO SEC 4
435 H SCOTIA CAPITAL 19
657 C MORGAN STANLEY 5
661 C JP MORGAN 255 367
661 H JP MORGAN 20
685 C RJ OBRIEN 1
690 C ABN AMRO 16 24
709 C BARCLAYS 5
737 C ADVANTAGE 5
880 H CITIGROUP 130
905 C ADM 16
TOTAL: 751 751
MONTH TO DATE: 18,903
JPMorgan stopped 387/751 contracts
FOR JUNE:
GOLD: NUMBER OF NOTICES FILED FOR JUNE/2023. CONTRACT: 751 NOTICES FOR 75,100 OZ or 2.3359 TONNES
total notices so far: 18,903 contracts for 1,890,300 oz (58.796 tonnes)
FOR JUNE:
SILVER NOTICES: 0 NOTICE(S) FILED FOR NIL OZ/
total number of notices filed so far this month : 423 for 2,115,000 oz
XXXXXXXXXXXXXXXXXXXXXXXX
Click here if you wish to send a donation. I sincerely appreciate it as this site takes a lot of preparation
END
GLD
WITH GOLD UP $2.80
INVESTORS SWITCHING TO SPROTT PHYSICAL (PHYS) INSTEAD OF THE FRAUDULENT GLD//
/HUGE CHANGES IN GOLD INVENTORY AT THE GLD:////A WITHDRAWAL OF 1.74 TONNES OF GOLD FROM THE GLD//
INVENTORY RESTS AT 929.70 TONNES
Silver//
WITH NO SILVER AROUND AND SILVER DOWN 17 CENTS AT THE SLV//
HUGE CHANGES IN SILVER INVENTORY AT THE SLV: A WITHDRAWAL OF 1.377 MILLION OZ FROM THE SLV//
INVESTORS ARE SWITCHING SLV TO SPROTT’S PSLV.
CLOSING INVENTORY: 463.642 MILLION OZ
Let us have a look at the data for today
SILVER//OUTLINE
SILVER COMEX OI FELL BY A GIGANTIC SIZED 2019 CONTRACTS TO 151,874 AND FURTHER FROM THE RECORD HIGH OI OF 244,710, SET FEB 25/2020 AND THIS HUMONGOUS SIZED LOSS IN COMEX OI WAS ACCOMPLISHED DESPITE OUR $0.29 GAIN IN SILVER PRICING AT THE COMEX ON WEDNESDAY. TAS ISSUANCE WAS A SMALL SIZED 384 CONTRACTS. THESE WILL BE USED FOR MANIPULATION LATER THIS MONTH . CRAIG HEMKE HAS POINTED OUT THAT THE CROOKS USE THE MID MONTH FOR MANIPULATION AS THEY SELL THEIR BUY SIDE OF THE CALENDAR SPREAD FIRST AND THEN KEEP THE SELL SIDE TO LIQUIDATE AT A LATER DATE. THUS WE HAVE TWO VEHICLES THE CROOKS USE FOR MANIPULATION AND BOTH ARE SPREADERS: 1) AT MONTH’S END/SPREADERS COMEX AND 2/ TAS SPREADERS, MID MONTH. TOTAL TAS ISSUED ON WEDNESDAY NIGHT: A SMALL SIZED 384 CONTRACTS. DESPITE MANY COMPLAINTS THAT THE CROOKS HAVE VIOLATED POSITION LIMITS DUE TO THE FACT THAT THE TAS ISSUED HAVE A VALUE OF ZERO (AS TO POSITION LIMITS FOR OUR CROOKED BANKERS). THE PROBLEM OF COURSE IS THAT THE CROOKS DO NOT LIQUIDATE THE TAS TOGETHER BUT SELL THE BUY SIDE FIRST AND THEN LIQUIDATE THE SELL SIDE TWO MONTHS HENCE. IT IS OBVIOUS MANIPULATION TO THE HIGHEST DEGREE BUT IT NATURALLY FELL ON DEAF EARS WITH OUR REGULATORS (OCC) WHEN THEY RECEIVED OUR COMPLAINTS. IT THUS LOOKS LIKE THE FED (GOV’T) IS BEHIND ALL OF THESE TRADES.
WE HAVE THIS YEAR SET ANOTHER RECORD LOW AT 117,395 CONTRACTS ///MARCH 29.2023. OUR BANKERS WERE UNSUCCESSFUL IN KNOCKING THE PRICE OF SILVER DOWN (IT ROSE BY $0.29). AND WERE UNSUCCESSFUL IN KNOCKING ANY SPEC LONGS AS WE HAD A HUMONGOUS GAIN ON OUR TWO EXCHANGES OF 3401 CONTRACTS. WE HAD 0 CRIMINAL NOTICES FILED IN THE CATEGORY OF EXCHANGE FOR RISK TRANSFER FOR 0 MILLION OZ// ( THE TOTAL ISSUED IN THIS CATEGORY SO FAR THIS MONTH TOTAL 7.5 MILLION OZ.). WE HAVE NOW RETURNED TO OUR USUAL AND CUSTOMARY SCENARIO: BANKERS SHORT AND SPECS LONG WITH MANIPULATION NOW MID MONTH AND BEYOND, DUE TO (TAS) MANIPULATION.
WE MUST HAVE HAD:
AN ATMOSPHERIC SIZED ISSUANCE OF EXCHANGE FOR PHYSICALS( 4950 CONTRACTS) iiii) AN INITIAL SILVER STANDING FOR COMEX SILVER MEASURING AT 3.935 MILLION OZ(FIRST DAY NOTICE) FOLLOWED BY TODAY’S 0 OZ QUEUE JUMP + 0 MILLION OZ EXCHANGE FOR RISK(ISSUED TODAY: TOTAL ISSUED SO FAR: 7.5 MILLION OZ)// TOTAL STANDING FOR THE MONTH 4.270 MILLION OZ + 7.5 MILLION EXCHANGE FOR RISK = 11.77 MILLION OZ// ) // HUMONGOUS SIZED COMEX OI LOSS/ ATMOSPHERIC SIZED EFP ISSUANCE/VI) SMALL NUMBER OF T.A.S. CONTRACT ISSUANCE (384 CONTRACTS)//ZERO T.A.S LIQUIDATION THROUGHOUT THE COMEX SESSION //WEDNESDAY BUT CONSIDERABLE LIQUIDATION DURING THE ACCESS MARKET//
I AM NOW RECORDING THE DIFFERENTIAL IN OI FROM PRELIMINARY TO FINAL –470 CONTRACTS
HISTORICAL ACCUMULATION OF EXCHANGE FOR PHYSICALS JUNE. ACCUMULATION FOR EFP’S SILVER/JPMORGAN’S HOUSE OF BRIBES/STARTING FROM FIRST DAY/MONTH OF JUNE:
TOTAL CONTRACTS for 10 days, total 9434 contracts: OR 47.170 MILLION OZ (943 CONTRACTS PER DAY)
TOTAL EFP’S FOR THE MONTH SO FAR: 47.170 MILLION OZ
LAST 23 MONTHS TOTAL EFP CONTRACTS ISSUED IN MILLIONS OF OZ:
MAY 137.83 MILLION
JUNE 149.91 MILLION OZ
JULY 129.445 MILLION OZ
AUGUST: MILLION OZ 140.120
SEPT. 28.230 MILLION OZ//
OCT: 94.595 MILLION OZ
NOV: 131.925 MILLION OZ
DEC: 100.615 MILLION OZ
YEAR 2022:
JAN 2022-DEC 2022
JAN 2022// 90.460 MILLION OZ
FEB 2022: 72.39 MILLION OZ//
MARCH: 207.430 MILLION OZ//A NEW RECORD FOR EFP ISSUANCE
APRIL: 114.52 MILLION OZ FINAL//LOW ISSUANCE
MAY: 105.635 MILLION OZ//
JUNE: 94.470 MILLION OZ
JULY : 87.110 MILLION OZ
AUGUST: 65.025 MILLION OZ
SEPT. 74.025 MILLION OZ///FINAL
OCT. 29.017 MILLION OZ FINAL
NOV: 134.290 MILLION OZ//FINAL
DEC, 61.395 MILLION OZ FINAL
TOTALS YR 2022: 1135.767 MILLION OZ (1.1356 BILLION OZ)
JAN 2023/// 53.070 MILLION OZ //FINAL
FEB: 2023: 100.105 MILLION OZ/FINAL//MUCH STRONGER ISSUANCE VS THE LATTER TWO MONTHS.
MARCH 2023: 112.58 MILLION OZ//FINAL//STRONG ISSUANCE
APRIL 118.035 MILLION OZ(SLIGHTLY GREATER THAN THAN LAST MONTH)
MAY 66.120 MILLION OZ/INITIAL (MUCH SMALLER THIS MONTH)
JUNE: 47.170 MILLION OZ//
RESULT: WE HAD A HUMONGOUS SIZED DECREASE IN COMEX OI SILVER COMEX CONTRACTS OF 2019 CONTRACTS DESPITE OUR GAIN IN PRICE OF $0.29 IN SILVER PRICING AT THE COMEX//WEDNESDAY.,. THE CME NOTIFIED US THAT WE HAD AN ATMOSPHERIC SIZED EFP ISSUANCE CONTRACTS: 4950 ISSUED FOR JULY AND 0 CONTRACTS ISSUED FOR ALL OTHER MONTHS) WHICH EXITED OUT OF THE SILVER COMEX TO LONDON AS FORWARDS./ WE HAVE A GOOD INITIAL SILVER OZ STANDING FOR JUNE OF 3.935 MILLION OZ FOLLOWED BY TODAY’S 0 OZ QUEUE JUMP+ 0 MILLION EXCHANGE FOR RISK TODAY + 7.5 MILLION EXCHANGE FOR RISK(PRIOR)//NEW TOTAL STANDING: 11.77 MILLION OZ////// .. WE HAVE A GIGANTIC SIZED GAIN OF 2931 OI CONTRACTS ON THE TWO EXCHANGES. THE TOTAL OF TAS INITIATED CONTRACTS TODAY: A SMALL 384//ZERO FRONT END OF THE TAS CONTRACTS WERE LIQUIDATED DURING THE WEDNESDAY COMEX SESSION BUT CONSIDERABLE LIQUIDATION DURING THE ACCESS MARKET. THE NEW TAS ISSUANCE TODAY (384) WILL BE PUT INTO “THE BANK” TO BE COLLUSIVELY USED AT A LATER DATE.
WE HAD 0 NOTICE(S) FILED TODAY FOR NIL OZ
THE SILVER COMEX IS NOW BEING ATTACKED FOR METAL BY LONDONERS ET AL.
GOLD//OUTLINE
IN GOLD, THE COMEX OPEN INTEREST FELL BY A FAIR SIZED 2511 CONTRACTS TO 430,805 AND FURTHER FROM THE RECORD (SET JAN 24/2020) AT 799,541 AND PREVIOUS TO THAT: (SET JAN 6/2020) AT 797,110.
THE DIFFERENTIAL FROM PRELIMINARY OI TO FINAL OI IN GOLD TODAY: REMOVED – 418 CONTRACTS
WE HAD A FAIR SIZED DECREASE IN COMEX OI ( 2511 CONTRACTS) DESPITE OUR $10.30 GAIN IN PRICE. WE ALSO HAD A STRONG INITIAL STANDING IN GOLD TONNAGE FOR JUNE. AT 70.79 TONNES ON FIRST DAY NOTICE FOLLOWED BY TODAY’S 0.0246 TONNE QUEUE JUMP: NEW TOTAL 63.863 TONNES STANDING SO FAR // + /A SMALL ISSUANCE OF 742 T.A.S. CONTRACTS/ZERO FRONT END OF TAS LIQUIDATION WEDNESDAY COMEX SESSION BUT CONSIDERABLE LIQUIDATION DURING ACCESS MARKET ////YET ALL OF..THIS HAPPENED WITH A $10.30 GAIN IN PRICE WITH RESPECT TO WEDNESDAY’S TRADING.WE HAD A TINY SIZED LOSS OF 439 OI CONTRACTS (1.3654 PAPER TONNES) ON OUR TWO EXCHANGES.
E.F.P. ISSUANCE
THE CME RELEASED THE DATA FOR EFP ISSUANCE AND IT TOTALED A FAIR SIZED 2072 CONTRACTS:
The NEW COMEX OI FOR THE GOLD COMPLEX RESTS AT 430,805
IN ESSENCE WE HAVE A TINY SIZED DECREASE IN TOTAL CONTRACTS ON THE TWO EXCHANGES OF 21 CONTRACTS WITH 2093 CONTRACTS DECREASED AT THE COMEX//TAS CONTRACTS INITIATED (ISSUED): A SMALL 742 CONTRACTS) AND 2072 EFP OI CONTRACTS WHICH NAVIGATED OVER TO LONDON. THUS TOTAL OI LOSS ON THE TWO EXCHANGES OF 21 CONTRACTS OR 0.6531 TONNES.
CALCULATIONS ON GAIN/LOSS ON OUR TWO EXCHANGES
WE HAD A FAIR SIZED ISSUANCE IN EXCHANGE FOR PHYSICALS (2072 CONTRACTS) ACCOMPANYING THE FAIR SIZED LOSS IN COMEX OI (2511) //TOTAL LOSS FOR OUR THE TWO EXCHANGES: 439 CONTRACTS. WE HAVE ( 1) NOW RETURNED TO OUR NORMAL FORMAT OF BANKERS GOING SHORT AND SPECULATORS GOING LONG ,2.) GOOD INITIAL STANDING AT THE GOLD COMEX FOR JUNE AT 70.79 TONNES FOLLOWED BY TODAY’S 800 OZ QUEUE JUMP //// NEW STANDING FALLS TO 63.863 TONNES// /3) ZERO LONG LIQUIDATION//4) FAIR SIZED COMEX OPEN INTEREST LOSS/ 5) FAIR ISSUANCE OF EXCHANGE FOR PHYSICAL PAPER///6: SMALL T.A.S. ISSUANCE: 742 CONTRACTS
HISTORICAL ACCUMULATION OF EXCHANGE FOR PHYSICALS IN 2023 INCLUDING TODAY
JUNE
ACCUMULATION OF EFP’S GOLD AT J.P. MORGAN’S HOUSE OF BRIBES: (EXCHANGE FOR PHYSICAL) FOR THE MONTH OF JUNE :
TOTAL EFP CONTRACTS ISSUED: 20,963 CONTRACTS OR 2,096,300 OZ OR 65.204 TONNES IN 10 TRADING DAY(S) AND THUS AVERAGING: 2099 EFP CONTRACTS PER TRADING DAY
TO GIVE YOU AN IDEA AS TO THE SIZE OF THESE EFP TRANSFERS : THIS MONTH IN 10 TRADING DAY(S) IN TONNES 65.204 TONNES
TOTAL ANNUAL GOLD PRODUCTION, 2022, THROUGHOUT THE WORLD EX CHINA EX RUSSIA: 3555 TONNES
THUS EFP TRANSFERS REPRESENTS 65.204/3550 x 100% TONNES 1.830% OF GLOBAL ANNUAL PRODUCTION
ACCUMULATION OF GOLD EFP’S YEAR 2021 TO 2023
JANUARY/2021: 265.26 TONNES (RAPIDLY INCREASING AGAIN)
FEB : 171.24 TONNES ( DEFINITELY SLOWING DOWN AGAIN)..
MARCH:. 276.50 TONNES (STRONG AGAIN/
APRIL: 189..44 TONNES ( DRAMATICALLY SLOWING DOWN AGAIN//GOLD IN BACKWARDATION)
MAY: 250.15 TONNES (NOW DRAMATICALLY INCREASING AGAIN)
JUNE: 247.54 TONNES (FINAL)
JULY: 188.73 TONNES FINAL
AUGUST: 217.89 TONNES FINAL ISSUANCE.
SEPT 142.12 TONNES FINAL ISSUANCE ( LOW ISSUANCE)_
OCT: 141.13 TONNES FINAL ISSUANCE (LOW ISSUANCE)
NOV: 312.46 TONNES FINAL ISSUANCE//NEW RECORD!! (INCREASING DRAMATICALLY)//SIGN OF REAL STRESS//SURPASSING THE MARCH 2021 RECORD OF 276.50 TONNES OF EFP
DEC. 175.62 TONNES//FINAL ISSUANCE//
TOTALS: 2,578.08 TONNES/2021
JAN:2022 247.25 TONNES //FINAL
FEB: 196.04 TONNES//FINAL
MARCH: 409.30 TONNES INITIAL( THIS IS NOW A RECORD EFP ISSUANCE FOR MARCH AND FOR ANY MONTH.
APRIL: 169.55 TONNES (FINAL VERY LOW ISSUANCE MONTH)
MAY: 247.44 TONNES FINAL//
JUNE: 238.13 TONNES FINAL
JULY: 378.43 TONNES FINAL
AUGUST: 180.81 TONNES FINAL
SEPT. 193.16 TONNES FINAL
OCT: 177.57 TONNES FINAL ( MUCH SMALLER THAN LAST MONTH)
NOV. 223.98 TONNES//FINAL ( MUCH LARGER THAN PREVIOUS MONTHS//comex running out of physical)
DEC: 185.59 tonnes // FINAL
TOTAL: 2,847,25 TONNES/2022
JAN 2023: 228.49 TONNES FINAL//HUGE AMOUNT OF EFP’S ISSUED THIS MONTH!!
FEB: 151.61 TONNES/FINAL
MARCH: 280.09 TONNES/INITIAL (ANOTHER STRONG MONTH FOR EFP ISSUANCE)
APRIL: 197.42 TONNES
MAY: 236.67 TONNES (A VERY STRONG ISSUANCE FOR THIS MONTH)
JUNE: 65.204 TONNES
SPREADING OPERATIONS
(/NOW SWITCHING TO GOLD) FOR NEWCOMERS, HERE ARE THE DETAILS
SPREADING LIQUIDATION HAS NOW COMMENCED AS WE HEAD TOWARDS THE NEW ACTIVE FRONT MONTH OF JUNE. WE ARE NOW INTO THE SPREADING OPERATION OF GOLD
HERE IS A BRIEF SYNOPSIS OF HOW THE CROOKS FLEECE UNSUSPECTING LONGS IN THE SPREADING ENDEAVOUR ;MODUS OPERANDI OF THE CORRUPT BANKERS AS TO HOW THEY HANDLE THEIR SPREAD OPEN INTERESTS:HERE IS HOW THE CROOKS USED SPREADING AS WE ARE NOW INTO THE NON ACTIVE DELIVERY MONTH OF MAY HEADING TOWARDS THE ACTIVE DELIVERY MONTH OF JUNE., FOR BOTH GOLD:
YOU WILL ALSO NOTICE THAT THE COMEX OPEN INTEREST STARTS TO RISE BUT SO IS THE OPEN INTEREST OF SPREADERS. THE OPEN INTEREST IN WILL CONTINUE TO RISE UNTIL ONE WEEK BEFORE FIRST DAY NOTICE OF AN UPCOMING ACTIVE DELIVERY MONTH (JUNE), AND THAT IS WHEN THE CROOKS SELL THEIR SPREAD POSITIONS BUT NOT AT THE SAME TIME OF THE DAY. THEY WILL USE THE SELL SIDE OF THE EQUATION TO CREATE THE CASCADE (ALONG WITH THEIR COLLUSIVE FRIENDS) AND THEN COVER ON THE BUY SIDE OF THE SPREAD SITUATION AT THE END OF THE DAY. THEY DO THIS TO AVOID POSITION LIMIT DETECTION. THE LIQUIDATION OF THE SPREADING FORMATION CONTINUES FOR EXACTLY ONE WEEK AND ENDS ON FIRST DAY NOTICE.”
WHAT IS ALARMING TO ME, ACCORDING TO OUR LONDON EXPERT ANDREW MAGUIRE IS THAT THESE EFP’S ARE BEING TRANSFERRED TO WHAT ARE CALLED SERIAL FORWARD CONTRACT OBLIGATIONS AND THESE CONTRACTS ARE LESS THAN 14 DAYS. ANYTHING GREATER THAN 14 DAYS, THESE MUST BE RECORDED AND SENT TO THE COMPTROLLER, GREAT BRITAIN TO MONITOR RISK TO THE BANKING SYSTEM. IF THIS IS INDEED TRUE, THEN THIS IS A MASSIVE CONSPIRACY TO DEFRAUD AS WE NOW WITNESS A MONSTROUS TOTAL EFP’S ISSUANCE AS IT HEADS INTO THE STRATOSPHERE.
The crooks also use the spread in the TAS account (trade at settlement). They buy the spot TAS (e.g. June) and sell the future TAS two months out (e.g. August). Then they unload the front month (i.e. unload the buy side first so the price of gold/silver falls. This occurs in the middle of the front delivery month cycle. They unload the sell side of the equation, two months down the road. The crooks violate position limits as the OCC refuse to hear our complaints.
First, here is an outline of what will be discussed tonight:
1.Today, we had the open interest at the comex, in SILVER FELL BY A HUMONGOUS SIZED 2019 CONTRACTS OI TO 151,834 AND FURTHER FROM OUR COMEX HIGH RECORD //244,710(SET FEB 25/2020). THE LAST RECORDS WERE SET IN AUG.2018 AT 244,196 WITH A SILVER PRICE OF $14.78/(AUGUST 22/2018)..THE PREVIOUS RECORD TO THAT WAS SET ON APRIL 9/2018 AT 243,411 OPEN INTEREST CONTRACTS WITH THE SILVER PRICE AT THAT DAY: $16.53). AND PREVIOUS TO THAT, THE RECORD WAS ESTABLISHED AT: 234,787 CONTRACTS, SET ON APRIL 21.2017 OVER 5 YEARS AGO. HOWEVER WE HAVE SET A NEW RECORD LOW OF 117,395 CONTRACTS MARCH 27/2022
EFP ISSUANCE 4950 CONTRACTS (RECORD ISSUANCE)
OUR CUSTOMARY MIGRATION OF COMEX LONGS CONTINUE TO MORPH INTO LONDON FORWARDS AS OUR BANKERS USED THEIR EMERGENCY PROCEDURE TO ISSUE:
JULY 4950 and ALL OTHER MONTHS: ZERO. TOTAL EFP ISSUANCE: 4950 CONTRACTS. EFP’S GIVE OUR COMEX LONGS A FIAT BONUS PLUS A DELIVERABLE PRODUCT OVER IN LONDON. IF WE TAKE THE COMEX OI LOSS OF 2019 CONTRACTS AND ADD TO THE 4950 OI TRANSFERRED TO LONDON THROUGH EFP’S,
WE OBTAIN AN ATMOSPHERIC SIZED GAIN OF OPEN INTEREST CONTRACTS FROM OUR TWO EXCHANGES OF 2931 CONTRACTS
THUS IN OUNCES, THE GAIN ON THE TWO EXCHANGES TOTAL 17.005 MILLION OZ
OCCURRED WITH OUR $0.29 GAIN IN PRICE …..
END
OUTLINE FOR TODAY’S COMMENTARY
1a/COMEX GOLD AND SILVER REPORT
(report Harvey)
b, ) Gold/silver trading overnight Europe,//GOLD COMMENTARIES
(Peter Schiff)
c) Commentaries from: Egon von Greyerz///Matthew Piepenburg via GoldSwitzerland.com, Pam and Russ Martens
ii a) Chris Powell of GATA provides to us very important physical commentaries
b. Other gold/silver commentaries
c. Commodity commentaries//
d)/CRYPTOCURRENCIES/BITCOIN ETC
2.ASIAN AFFAIRS//
THURSDAY MORNING//WEDNESDAY NIGHT
SHANGHAI CLOSED UP 23.99 PTS OR 0.74% //Hang Seng CLOSED UP 420.50 PTS OR 2.17% /The Nikkei closed DOWN 16.93 OR 0.05% //Australia’s all ordinaries CLOSED UP 0.22 % /Chinese yuan (ONSHORE) closed DOWN 7.1602 /OFFSHORE CHINESE YUAN DOWN TO 7.1700 /Oil DOWN TO 69.10 dollars per barrel for WTI and BRENT DOWN AT 73.87 / Stocks in Europe OPENED ALL MIXED// ONSHORE YUAN TRADING ABOVE LEVEL OF OFFSHORE YUAN/ONSHORE YUAN TRADING WEAKER AGAINST US DOLLAR/OFFSHORE WEAKER
a)NORTH KOREA/SOUTH KOREA
outline
b) REPORT ON JAPAN/
OUTLINE
3 CHINA
OUTLINE
4/EUROPEAN AFFAIRS
OUTLINE
5. RUSSIAN AND MIDDLE EASTERN AFFAIRS
OUTLINE
6.Global Issues//COVID ISSUES/VACCINE ISSUES
OUTLINE
7. OIL ISSUES
OUTLINE
8 EMERGING MARKET ISSUES
9. USA
XXXXXXXXXXXXXXXXXXXXXXXXXXXXXXXXXXXXXXXXXXXXXXXXXXXXXXXXXXXXXXXXXXXXXXXXXXXXXXXXXXXXXXXXXXXXXXXXXXXXXXXXXX
1. COMEX DATA//AMOUNTS STANDING//VOLUME OF TRADING/INVENTORY MOVEMENTS
GOLD
LET US BEGIN:
THE TOTAL COMEX GOLD OPEN INTEREST FELL BY A FAIR SIZED 2511 CONTRACTS DOWN TO 430,387 DESPITE OUR STRONG GAIN IN PRICE OF $10.30 ON WEDNESDAY,
EXCHANGE FOR PHYSICAL ISSUANCE
WE ARE NOW IN THE ACTIVE DELIVERY MONTH OF JUNE… THE CME REPORTS THAT THE BANKERS ISSUED A FAIR SIZED TRANSFER THROUGH THE EFP ROUTE AS THESE LONGS RECEIVED A DELIVERABLE LONDON FORWARD TOGETHER WITH A FIAT BONUS.,
THAT IS 2072 EFP CONTRACTS WERE ISSUED: : AUGUST 2072 & ZERO FOR ALL OTHER MONTHS:
TOTAL EFP ISSUANCE: 2072 CONTRACTS
ON A NET BASIS IN OPEN INTEREST WE LOST THE FOLLOWING TODAY ON OUR TWO EXCHANGES: A TINY SIZED TOTAL OF 439 CONTRACTS IN THAT 2072 LONGS WERE TRANSFERRED AS FORWARDS TO LONDON AND WE HAD A FAIR SIZED LOSS OF 2511 COMEX CONTRACTS..AND THIS TINY SIZED GAIN ON OUR TWO EXCHANGES HAPPENED DESPITE OUR GAIN IN PRICE OF $10.30. AS PER OUR NEWBIE TRADE AT SETTLEMENT (TAS) MANIPULATION OPERATION (WHICH CRAIG HEMKE HAS POINTED OUT HAPPENS DURING MID MONTH IN THE DELIVERY CYCLE), THE CME REPORTS THAT THE TOTAL T.A.S. ISSUANCE FOR WEDNESDAY NIGHT WAS A SMALL 742 CONTRACTS. THROUGHOUT LAST WEEK, THE BANKERS SOLD OFF THE LONG SIDE OF THE SPREAD WHICH OF COURSE CONTINUES TO MANIPULATE THE PRICE OF GOLD SOUTHBOUND. (THEY KEEP THE SHORT SIDE OF THE CALENDAR SPREAD WHICH WILL BE LIQUIDATED TWO MONTHS HENCE)//THE HUGE NUMBER OF T.A.S. CONTRACTS INITIATED OVER THE PAST SEVERAL DAYS SPELLS TROUBLE FOR THE GOLD/SILVER MARKET AS RAIDS WILL SURELY BE UPON US.
// WE HAVE A STRONG AMOUNT OF GOLD TONNAGE STANDING: JUNE (62.863) ( NON ACTIVE MONTH)
TONNES),
HERE ARE THE AMOUNTS THAT STOOD FOR DELIVERY IN THE PRECEDING 12 MONTHS OF 2021-2022:
DEC 2021: 112.217 TONNES
NOV. 8.074 TONNES
OCT. 57.707 TONNES
SEPT: 11.9160 TONNES
AUGUST: 80.489 TONNES
JULY: 7.2814 TONNES
JUNE: 72.289 TONNES
MAY 5.77 TONNES
APRIL 95.331 TONNES
MARCH 30.205 TONNES
FEB ’21. 113.424 TONNES
JAN ’21: 6.500 TONNES.
TOTAL YEAR 2021 (JAN- DEC): 601.213 TONNES
YEAR 2022:
JANUARY 2022 17.79 TONNES
FEB 2022: 59.023 TONNES
MARCH: 36.678 TONNES
APRIL: 85.340 TONNES FINAL.
MAY: 20.11 TONNES FINAL
JUNE: 74.933 TONNES FINAL
JULY 29.987 TONNES FINAL
AUGUST:104.979 TONNES//FINAL
SEPT. 38.1158 TONNES
OCT: 77.390 TONNES/ FINAL
NOV 27.110 TONNES/FINAL
Dec. 64.541 tonnes
(TOTAL YEAR 656.076 TONNES)
2003:
JAN/2023: 20.559 tonnes
FEB 2023: 47.744 tonnes
MAR: 19.0637 TONNES
APRIL: 75.676 tonnes
MAY: 19.094 TONNES + 1.244 tonnes of exchange for risk = 20.338
JUNE: 62.863 TONNES
THE SPECS/HFT WERE UNSUCCESSFUL IN LOWERING GOLD’S PRICE( IT ROSE $10.30) //// AND WERE UNSUCCESSFUL IN KNOCKING A FEW SPECULATOR LONGS AS WE HAD OUR TINY SIZED LOSS OF 439 CONTRACTS ON OUR TWO EXCHANGES. WE HAD ZERO TAS LIQUIDATION THROUGHOUT THE COMEX SESSION ON WEDNESDAY BUT CONSIDERABLE CONTRACTS WERE LIQUIDATED IN THE ACCESS MARKET . THE TAS ISSUED WEDNESDAY NIGHT, WILL BE “PUT INTO THE BANK” TO BE USED AT A LATER DATE AT THE COLLUSIVE CHOOSING OF OUR BANKERS.
WE HAVE LOST A TOTAL OI OF 0.6531 PAPER TONNES OF TOTAL OI FROM OUR TWO EXCHANGES, ACCOMPANYING OUR INITIAL GOLD TONNAGE STANDING FOR JUNE. (70.709 TONNES) FOLLOWED BY TODAY’S 800 OZ QUEUE JUMP..NEW STANDING REMAINS AT 63.863 TONNES // ALL OF THIS WAS ACCOMPLISHED WITH OUR GAIN IN PRICE TO THE TUNE OF $10.30
WE HAD – REMOVED 418 CONTRACTS TO THE COMEX TRADES TO OPEN INTEREST AFTER TRADING ENDED LAST NIGHT
NET LOSS ON THE TWO EXCHANGES 439 CONTRACTS OR 43900 OZ OR 1.3654 TONNES.
Estimated gold volume today:// 258,962 fair
final gold volumes/yesterday 206,364 fair
//JUNE 15/ FOR THE JUNE 2023 CONTRACT
| Gold | Ounces |
| Withdrawals from Dealers Inventory in oz | nil |
| Withdrawals from Customer Inventory in oz | 24,567.040 OZ ASAHI 578.728 oz BRINKS 18 kilobars . |
| Deposit to the Dealer Inventory in oz | nil |
| Deposits to the Customer Inventory, in oz | nil oz |
| No of oz served (contracts) today | 751 notice(s) 75,100 OZ 2.3359 TONNES |
| No of oz to be served (notices) | 1630 contracts 163000 oz 5.0699 TONNES |
| Total monthly oz gold served (contracts) so far this month | 18,902 notices 1,890,300 OZ 58.796 TONNES |
| Total accumulative withdrawals of gold from the Dealers inventory this month | NIL oz |
| Total accumulative withdrawal of gold from the Customer inventory this month | x |
No dealer withdrawals
Customer deposits: 0
total deposits: nil oz
Withdrawals: 2
i) Out of Brinks: 578.72 oz
ii) Out of ASAHI: 24,567.040 oz
total 25,145.760 oz
Adjustments;1
i) ASAHI: 47,896.750 oz was adjusted out of the customer account into dealer
leaving zer0 oz eligible for ASAHI
CALCULATIONS FOR THE AMOUNT OF GOLD STANDING FOR JUNE.
For the front month of JUNE we have an oi of 2381 contracts having LOST 82 contracts. We had 90 contracts served on WEDNESDAY so we gained 8 contracts or an additional 800 oz will stand for gold at the comex.
The next front month after June is the non active delivery month of July. Here, July lost 243 contracts to stand at 2661 contracts.
AUGUST lost 2338 contracts down to 363,236 contracts
We had 751 contracts filed for today representing 75,100 oz
Today, 0 notice(s) were issued from J.P.Morgan dealer account and 255 notices were issued from their client or customer account. The total of all issuance by all participants equate to 751 contract(s) of which 20 notices were stopped (received) by j.P. Morgan dealer and 367 notice(s) was (were) stopped received by J.P.Morgan//customer account and 0 notice(s) received (stopped) by the squid (Goldman Sachs)
To calculate the INITIAL total number of gold ounces standing for the JUNE /2023. contract month,
we take the total number of notices filed so far for the month (18,903 x 100 oz ), to which we add the difference between the open interest for the front month of JUNE (2381 CONTRACT) minus the number of notices served upon today 751 x 100 oz per contract equals 2,053,200 OZ OR 63.863 TONNES the number of TONNES standing in this active month of June.
thus the INITIAL standings for gold for the JUNE contract month: No of notices filed so far (18,903) x 100 oz + (2381) {OI for the front month} minus the number of notices served upon today (751) x 100 oz) which equals 2,053,200 oz standing OR 63.863 TONNES
TOTAL COMEX GOLD STANDING: 63.863 TONNES WHICH IS HUGE FOR AN ACTIVE DELIVERY MONTH.
XXXXXXXXXXXXXXXXXXXXXXXXXXXXXXXXXXXXXXXXXXXXXXXXXXXXXXXXXXXXX
COMEX GOLD INVENTORIES/CLASSIFICATION
NEW PLEDGED GOLD:
241,794.285 oz NOW PLEDGED /HSBC 5.94 TONNES
204,937.290 PLEDGED MANFRA 3.08 TONNES
83,657.582 PLEDGED JPMorgan no 1 1.690 tonnes
265,999.054, oz JPM No 2
1,152,376.639 oz pledged Brinks/
Manfra: 33,758.550 oz
Delaware: 193.721 oz
International Delaware:: 11,188.542 o
total pledged gold: 2,055,246.664 OZ 63.92 tonnes
TOTAL OF ALL GOLD ELIGIBLE AND REGISTERED: 22,773,725,284 OZ
TOTAL REGISTERED GOLD: 11,702,019,946 (363.98 tonnes)..
TOTAL OF ALL ELIGIBLE GOLD: 11,071,705.338 O Z
REGISTERED GOLD THAT CAN BE SERVED UPON: 9,646,773 OZ (REG GOLD- PLEDGED GOLD) 300.05 tonnes//
END
SILVER/COMEX
JUNE 15//2023// THE JUNE 2023 SILVER CONTRACT
| Silver | Ounces |
| Withdrawals from Dealers Inventory | NIL oz |
| Withdrawals from Customer Inventory | 607,324.650 oz CNT Delaware HSBC . |
| Deposits to the Dealer Inventory | nil oz |
| Deposits to the Customer Inventory | 5023.400 oz Brinks |
| No of oz served today (contracts) | 0 CONTRACT(S) (NIL OZ) |
| No of oz to be served (notices) | 431 contracts (2,155,000 oz) |
| Total monthly oz silver served (contracts) | 423 Contracts (2,115,000 oz) |
| Total accumulative withdrawal of silver from the Dealers inventory this month | NIL oz |
| Total accumulative withdrawal of silver from the Customer inventory this month |
i) 0 dealer deposits
total dealer deposit: nil oz
total dealer deposits: 0
i) We had 0 dealer withdrawal
total dealer withdrawals: oz
We had 1 deposits customer account:
i) Into Brinks 5023.400 oz
total customer deposits: 5023.400 oz
JPMorgan has a total silver weight: 142,366 million oz/271.773 million =52.39% of comex .//dropping fast
Comex withdrawals 3
i) Out of Delaware: 5940.300 oz
ii) Out of CNT: 1013.520 oz
iii) out of HSBC 600,370.830 oz
total withdrawals: 607,324.650 oz
adjustments: none
TOTAL REGISTERED SILVER: 27.117 MILLION OZ (declining rapidly).TOTAL REG + ELIGIBLE. 271.773 million oz
DEALER SILVER DROPPING FAST. (moves into the 27 million oz column)
CALCULATIONS FOR THE NEW STANDING FOR SILVER FOR JUNE:
silver open interest data:
FRONT MONTH OF JUNE /2023 OI: 431 CONTRACTS HAVING LOST 0 CONTRACT(S).
WE HAD 0 NOTICES FILED ON WEDNESDAY SO WE LOST 0 CONTRACTS OR AN ADDITIONAL NIL OZ WILL STAND FOR DELIVERY IN THIS NON ACTIVE DELIVERY MONTH OF JUNE
JULY HAD A 6332 CONTRACT LOSS TO 71,912 CONTRACTS
AUGUST LOST 2 CONTRACTS TO STAND AT 28
SEPT HAS A GAIN OF 4305 CONTRACTS UP TO 68,092
TOTAL NUMBER OF NOTICES FILED FOR TODAY: 0 for NIL oz
Comex volumes// est. volume today 95,852 very strong /
Comex volume: confirmed yesterday:75,876 good
To calculate the number of silver ounces that will stand for delivery in JUNE. we take the total number of notices filed for the month so far at 423 x 5,000 oz = 2,115,000 oz
to which we add the difference between the open interest for the front month of JUNE(431) and the number of notices served upon today 0 x (5000 oz) equals the number of ounces standing.
Thus the standings for silver for the JUNE/2023 contract month: 423 (notices served so far) x 5000 oz + OI for the front month of JUNE (431) – number of notices served upon today (0 )x 500 oz of silver standing for the JUNE contract month equates to 4.270 million oz +7.5MILLION OZ EXCHANGE FOR RISK//NEW TOTAL: 11.77 MILLION OZ STANDING
the record level of silver open interest is 234,787 contracts set on April 21./2017 with the price on that day at $18.42. The previous record was 224,540 contracts with the price at that time of $20.44
END
GLD AND SLV INVENTORY LEVELS
JUNE 15/WITH GOLD UP $2.80 TODAY: HUGE CHANGES IN GOLD INVENTORY AT THE GLD: A WITHDRAWAL OF 1.74 TONNES OF GOLD FROM THE GLD//INVENTORY RESTS AT 929.70 TONNES
JUNE 14/WITH GOLD UP $10.30 TODAY: NO CHANGES IN GOLD INVENTORY AT THE GLD//INVENTORY RESTS AT 931.44 TONNES
JUNE 13/WITH GOLD DOWN $10.30 TODAY:HUGE CHANGES IN GOLD INVENTORY AT THE GLD: A WITHDRAWAL OF 3.01 TONNES FORM THE GLD///INVENTORY RESTS AT 931.44
JUNE 12/WITH GOLD DOWN $7.10 TODAY: NO CHANGES IN GOLD INVENTORY AT THE GLD/INVENTORY RESTS AT 934.65 TONNES
JUNE 9/WITH GOLD DOWN $1.00: NO CHANGES IN GOLD INVENTORY AT THE GLD//INVENTORY RESTS AT 934.65 TONNES
JUNE 8/WITH GOLD UP $20.45 TODAY; HUGE CHANGES IN GOLD INVENTORY AT THE GLD: A WITHDRAWAL OF 3.46 TONNES FROM THE GLD///INVENTORY RESTS AT 934.65 TONNES
JUNE 7 WITH GOLD DOWN $22.15 TODAY: HUGE CHANGES IN GOLD INVENTORY AT THE GLD: A WITHDRAWAL OF 1.45 TONNES OF GOLD FROM THE GLD////INVENTORY RESTS AT 938.11 TONNES
JUNE 6/WITH GOLD UP $6.90 TODAY; HUGE CHANGES IN GOLD INVENTORY AT THE GLD: A DEPOSIT OF 1.45 TONNES OF GOLD INTO THE GLD////INVENTORY RESTS AT 939.56 TONNES
JUNE 5/WITH GOLD UP $5.00 TODAY : NO CHANGES IN GOLD INVENTORY AT THE GLD//INVENTORY RESTS AT 938.11 TONNES
JUNE 2/WITH GOLD DOWN $24.40 TODAY: HUGE CHANGES IN GOLD INVENTORY AT THE GLD: A WITHDRAWAL OF 1.45 TONNES FROM THE GLD///INVENTORY RESTS AT 938.11 TONNES
JUNE 1/WITH GOLD UP $14.10 TODAY: NO CHANGES IN GOLD INVENTORY AT THE GLD//INVENTORY RESTS AT 939.56 TONNES
MAY 31/WITH GOLD UP $5.70 TODAY: HUGE CHANGES IN GOLD INVENTORY AT THE GLD: A WITHDRAWAL OF 1.73 TONNES OF GOLD FROM THE GLD///INVENTORY RESTS AT 939.56 TONNES
MAY 30/WITH GOLD UP $14.55 TODAY: NO CHANGES IN GOLD INVENTORY AT THE GLD//INVENTORY RESTS AT 941.29 TONNES
MAY 26/WITH GOLD UP $.90 TODAY: NO CHANGES IN GOLD INVENTORY AT THE GLD//INVENTORY REST AT 941.29 TONNES
MAY 25/WITH GOLD DOWN $19.70 TODAY: NO CHANGES IN GOLD INVENTORY AT THE GLD//INVENTORY RESTS AT 941.29 TONNES
MAY 24/WITH GOLD DOWN $9.50 TODAY:HUGE CHANGES IN GOLD INVENTORY AT THE GLD: A WITHDRAWAL OF 1.45 TONNES OF GOLD FROM THE GLD////INVENTORY RESTS AT 941.29 TONNES
MAY 23/WITH GOLD $2.25 TODAY: NO CHANGES IN GOLD INVENTORY AT THE GLD//INVENTORY RESTS AT 942.74 TONNES
MAY 22/WITH GOLD DOWN $4.70 TODAY: HUGE CHANGES IN GOLD INVENTORY AT THE GLD: A DEPOSIT OF 5.83 TONES OF GOLD INTO THE GLD DESPITE THE L0SS IN PRICE//INVENTORY RESTS AT 942.74 TONNES
MAY 19/WITH GOLD UP $22.20 TODAY: NO CHANGES IN GOLD INVENTORY AT THE GLD//INVENTORY RESTS AT 936.96 TONNES
MAY 18/WITH GOLD DOWN $23.80 TODAY: HUGE CHANGES IN GOLD INVENTORY AT THE GLD: A DEPOSIT OF 2.02 TONNES OF GOLD INTO THE GLD////INVENTORY RESTS AT 936.96 TONNES
MAY 17/WITH GOLD DOWN $8.25 TODAY: HUGE CHANGES IN GOLD INVENTORY AT THE GLD: A DEPOSIT OF .87 TONNES OF GOLD INTO THE GLD///INVENTORY RESTS AT 934.94 TONNES
MAY 16/WITH GOLD DOWN 28.05 TODAY: HUGE CHANGES IN GOLD INVENTORY AT THE GLD: A WITHDRAWAL OF 3.57 TONNES OF GOLD FROM THE GLD///INVENTORY RESTS AT 934,07
MAY 15/WITH GOLD UP $2.85 TODAY: NO CHANGES IN GOLD INVENTORY AT THE GLD//INVENTORY RESTS AT 937.64 TONNES
MAY 12/WITH GOLD DOWN $.40 TODAY: HUGE CHANGES IN GOLD INVENTORY AT THE GLD: A DEPOSIT OF 2.89 TONNES OF GOLD INTO THE GLD////INVENTORY RESTS AT 937.84 TONNES
MAY 11/WITH GOLD DOWN $15.15 TODAY: NO CHANGES IN GOLD INVENTORY AT THE GLD//INVENTORY RESTS AT 934.95 TONNES
MAY 10/WITH GOLD DOWN $5.00 TODAY: HUGE CHANGES IN GOLD INVENTORY AT THE GLD: A WITHDRAWAL OF 2.70 TONNES OF GOLD FROM THE GLD////INVENTORY RESTS AT 934.95 TONNES
GLD INVENTORY: 929.70 TONNES
Now the SLV Inventory/( vehicle is a fraud as there is no physical metal behind them
JUNE 15/WITH SILVER DOWN 17 CENTS TODAY; HUGE CHANGES IN SILVER INVENTORY AT THE SLV: A WITHDRAWAL OF 1.377 MILLION OZ OF SILVER FROM THE SLV////INVENTORY RESTS AT 463.642 MILLION OZ//
JUNE 14/WITH SILVER UP 29 CENTS TODAY: HUGE CHANGES IN SILVER INVENTORY AT THE SLV: A WITHDRAWAL OF 735,000 OZ FROM THE SLV///INVENTORY RESTS AT 465.019 MILLION OZ//
JUNE 13/WITH SILVER DOWN 25 CENTS TODAY; HUGE CHANGES IN SILVER INVENTORY AT THE SLV: A WITHDRAWAL OF 1.515 MILLION OZ OF SILVER FROM THE SLV///INVENTORY RESTS AT 465.754 MILLION OZ//
JUNE 12/WITH SILVER DOWN 26 CENTS TODAY: NO CHANGES IN SILVER INVENTORY AT THE SLV//INVENTORY RESTS AT 467.269 MILLION OZ//
JUNE 9/WITH SILVER UP 7 CENTS TODAY: SMALL CHANGES IN SILVER INVENTORY AT THE SLV: A WITHDRAWAL OF SILVER TO THE TUNE OF 550,000 OZ//INVENTORY RESTS AT 467.269 MILLION OZ
JUNE 8/WITH SILVER UP $0.63 TODAY: NO CHANGES IN SILVER INVENTORY AT THE SLV/INVENTORY RESTS AT 467.819 MILLION OZ/
JUNE 7/WITH SILVER DOWN 17 CENTS TODAY:HUGE CHANGES IN SILVER INVENTORY AT THE SLV: A DEPOSIT OF 1.01 MILLION OZ INTO THE SLV////INVENTORY RESTS AT 467.819 MILLION OZ/
JUNE 6/WITH SILVER UP 7 CENTS TODAY: NO CHANGES IN SILVER INVENTORY AT THE SLV/INVENTORY RESTS AT 466.809 MILLION OZ//
JUNE 5/WITH SILVER DOWN $.13 TODAY: SMALL CHANGES IN SILVER INVENTORY AT THE SLV: A WITHDRAWAL OF 266,000 OZ FROM THE SLV////INVENTORY RESTS AT 466.809 MILLION OZ/
JUNE 2/WITH SILVER DOWN 23 CENTS TODAY: SMALL CHANGES IN SILVER INVENTORY AT THE SLV: A WITHDRAWAL OF 918,000 OZ FROM THE SLV./INVENTORY RESTS AT 467.015 MILLION OZ/
JUNE 1/WITH SILVER UP 49 CENTS TODAY; NO CHANGES IN SILVER INVENTORY AT THE SLV//INVENTORY RESTS AT 467.933 MILLION OZ
MAY 31/WITH SILVER UP 37 CENTS TODAY:SMALL CHANGES IN SILVER INVENTORY AT THE SLV: A WITHDRAWAL OF 367,000 OZ FROM THE SLV////INVENTORY RESTS AT 467.933 MILLION OZ//
MAY 30/WITH SILVER DOWN 9 CENTS TODAY: NO CHANGES IN SILVER INVENTORY AT THE SLV//INVENTORY RESTS AT 468.300 MILLION OZ//
MAY 26/WITH SILVER UP $0.44 TODAY: HUGE CHANGES IN SILVER INVENTORY AT THE SLV: A WITHDRAWAL OF 3.306 MILLION OZ FROM THE SLV//INVENTORY RESTS AT 468.300 MILLION OZ//
MAY 25.WITH SILVER DOWN $0.32 TODAY; SMALL CHANGES IN SILVER INVENTORY AT THE SLV: A DEPOSIT OF 276,000 OZ INTO THE SLV////INVENTORY RESTS AT 471.606 MILLION OZ//
MAY 24/WITH SILVER DOWN $.35 TODAY; NO CHANGES IN SILVER INVENTORY AT THE SLV//INVENTORY RESTS AT 471.330 MILLION OZ//
MAY 23/WITH SILVER DOWN 22 CENTS TODAY: HUGE CHANGES IN SILVER INVENTORY AT THE SLV: A DEPOSIT OF 2.801 MILLION OZ INTO THE SLV///INVENTORY RESTS AT 471.330 MILLION OZ//
MAY 22/WITH SILVER DOWN 19 CENTS TODAY: NO CHANGES IN SILVER INVENTORY AT THE SLV//INVENTORY RESTS AT 468.529 MILLION OZ//
MAY 19/WITH SILVER UP 38 CENTS TODAY; NO CHANGES IN SILVER INVENTORY AT THE SLV//INVENTORY RESTS AT 468.529 MILLION OZ
MAY 18/WITH SILVER DOWN 23 CENTS TODAY: HUGE CHANGES IN SILVER INVENTORY AT THE SLV: A WITHDRAWAL OF 919,000 OZ FROM THE SLV////INVENTORY RESTS AT 468.529 MILLION OZ/
MAY 17/WITH SILVER DOWN 2 CENTS TODAY; NO CHANGES IN SILVER INVENTORY AT THE SLV//INVENTORY RESTS AT 469.448 MILLION OZ//
MAY 16/WITH SILVER DOWN 34 CENTS TODAY: SMALL CHANGES IN SILVER INVENTORY AT THE SLV: A WITHDRAWAL OF .643 MILLION OZ FROM THE SLV////INVENTORY RESTS AT 469.448 MILLION OZ.
MAY 15/WITH SILVER UP 13 CENTS TODAY; NO CHANGES IN SILVER INVENTORY AT THE SLV//INVENTORY RESTS AT 470.091 MILLION OZ/
MAY 12/WITH SILVER DOWN $.26 TODAY: SMALL CHANGES IN SILVER INVENTORY AT THE SLV A DEPOSIT OF 3,123 MILLION OZ INTO THE SLV////INVENTORY RESTS AT 470.091 MILLION OZ./
MAY 11/WITH SILVER DOWN $1.18 TODAY: NO CHANGES IN SILVER INVENTORY AT THE SLV//INVENTORY RESTS AT 466.968 MILLION OZ
MAY 10/WITH SILVER DOWN 23 CENTS TODAY; HUGE CHANGES IN SILVER INVENTORY AT THE SLV: A DEPOSIT OF 1.286 MILLION OZ INTO THE SLV////INVENTORY RESTS AT 466.968 MILLION OZ//
CLOSING INVENTORY 463.642 MILLION OZ//
PHYSICAL GOLD/SILVER COMMENTARIES
1:Peter Schiff/Mike Maharrey
END
2 Commentaries from: Egon von Greyerz///Matthew Piepenburg via GoldSwitzerland.com, Pam and Russ Martens//JAMES RICKARDS//JOHN RUBINO
3,Chris Powell of GATA provides to us very important physical commentaries
USA has swapped more gold and the amount is 188 tonnes from the beginning of 2023. The BIS is nervous that they will not get their gold back.
(Robert Lambourne)
Robert Lambourne: BIS gold swaps rose 39% in May amid U.S. debt turmoil
Submitted by admin on Wed, 2023-06-14 15:12Section: Daily Dispatches
By Robert Lambourne
Wednesday, June 14, 2023
Gold swaps by the Bank for International Settlements rose markedly in May, according to the bank’s monthly account statement, published this week:
The bank’s gold swaps are estimated to be 188 tonnes as of May 31, a 39% increase over the 135 tonnes reported as of April 30. As shown in Table B below, recent months have brought much volatility in the level of swaps.
Evidence of the significant trading carried out via BIS gold swaps is provided by the changes in the monthly volumes of swaps since October 2022. At that time there were an estimated 7 tonnes of swaps outstanding, but this increased to 105 tonnes at November 30 and then fell back to none at December 31.
Significant changes and continued this year, with 103 tonnes of gold swaps estimated as of January 31, followed by 136 tonnes as of February 28, 78 tonnes as of March 31, 135 tonnes as of April 30, and 188 tonnes as of May 31.
Once again it seems reasonable to suspect that the BIS has entered these swaps on behalf of the U.S. Federal Reserve. With the new deal on the U.S. federal government debt ceiling causing political turmoil in May, a rising gold price probably would have been unwelcome by U.S. authorities.
The basic transaction that the BIS undertakes with gold swaps is to exchange dollars for gold from a bullion bank and then deposit the gold in a gold sight account at a central bank, almost certainly being the central bank that is using the BIS to execute the gold swap on its behalf.
Given the recent volatility in the level of BIS gold swaps, it seems likely that the swaps are mainly of a short duration. Why a central bank would need the BIS to undertake these gold swaps isn’t clear, but the swaps may be linked to short-term trading needs. This trading could aim to suppress the gold price.
Using the May 31 gold price of $1,966 (per USAGold.com), the 188 tonnes of BIS gold swaps as of May 31 are valued at about $11.9 billion. Hence it is evident that the recent volatility in BIS gold swaps involves high value and shows that gold remains a significant monetary asset.
As ever with the BIS, it remains unlikely that more information about the reasons for the bank to undertake these transactions, presumably on behalf of a central bank client, will ever be provided. This secrecy implies that central bank gold policy involves much deception of the public and the markets — that it is a form of currency market intervention for which the BIS provides camouflage.
The worsening finances of Western governments, especially the U.S. government, may reduce the appeal of gold swaps to the BIS and the central bank or banks for which the BIS has been acting. In this context a report issued by GATA in 2012 —
https://www.gata.org/node/11304
— is worth revisiting, since it highlights acknowledgment of gold price suppression by a former chairman of the BIS, Jelle Zilstrra, a Dutch politician and economist. BIS management almost certainly understands very well what the swaps are being used for and why they are camouflaged.
The recent strength of the gold price together with the conundrum facing the Federal Reserve about raising dollar interest rates must reduce the appeal of having to return swapped gold to bullion banks.
Despite its rhetoric about pushing interest rates higher, the Fed needs to avoid more erosion of confidence in the U.S. Treasuries market when the U.S. government’s rising debt recently has been so controversial.
The Treasury Department’s May report demonstrates three continuing adverse trends. Lower cumulative revenues than were received in the same period a year ago and higher cumulative expenditure contributed to much higher interest costs aided by higher interest rates set by the Federal Reserve:
https://www.fiscal.treasury.gov/files/reports-statements/mts/mts0523.pdf
Because of the special measures taken by the Treasury Department to avoid breaching the former debt ceiling, it seems likely that the portion of the underlying interest cost payable to government-sponsored trust funds has been underreported recently, but this presumably will be corrected in June and subsequent months, providing a clearer picture of the growing interest cost. The cumulative interest charge on the externally held debt is up by 33% over the same period in 2022, indicating the problem that higher interest costs cause for the U.S. government’s borrowing.
In these circumstances the room for the Fed to keep raising interest rates seems restricted and hence it seems that the BIS and some of its owners — other central banks — might be questioning the role of the bank in these swaps and the obligation to make future deliveries of gold.
Indeed, a cynic might claim that the recent deal on the federal government debt makes it easier to defend a banking crisis by allowing the U.S. government to offer more bank deposit guarantees. The debt ceiling deal may even make a revaluation of gold easier for the United States to carry out.
As is clear from Table B below, the level of BIS swaps had been significantly higher in the first half of last year, and the October and December totals were easily the lowest in more than four years.
* * *
Table A below highlights the level of gold swaps reported in the annual reports of the BIS back to 2010, when the bank’s use of gold swaps appears to have begun. At only one year-end since then, in March 2016, has the swap level been zero.
(The BIS’ half-year report to September 30, 2022, discloses that the BIS still holds 102 tonnes of its own gold and that very little of its activities in derivatives are with central banks. An assumption that the gold held by the BIS remains at 102 tonnes has been used to make the estimate of the gold swap level for December. The low level of derivatives reported by the BIS using central banks as counterparties, disclosed in the last interim report, is a reason to assume that the swaps are almost certainly done with gold bullion banks rather than central banks. Historically, the first swaps described below were done with bullion banks.)
* * *
… Historical context …
The BIS rarely comments publicly on its gold activities, but its first use of gold swaps was considered important enough to cause the bank to give some background information to the Financial Times for an article published July 29, 2010, coinciding with publication of the bank’s 2009-10 annual report.
The general manager of the BIS at the time, Jaime Caruana, said the gold swaps were “regular commercial activities” for the bank, and he confirmed that they were carried out with commercial banks and so did not involve central banks. It also seems highly likely that the BIS’ remaining swaps are still all made with commercial banks, because the BIS annual report has never disclosed a gold swap between the BIS and a major central bank.
The swap transactions potentially created a mismatch at the BIS, which may have ended up being long unallocated gold (the gold held in BIS sight accounts at major central banks) and short allocated gold (the gold required to be returned to swap counterparties). This possible mismatch has not been reported by the BIS.
The gold banking activities of the BIS have been a regular part of the services it offers to central banks since the bank’s establishment 90 years ago. The first annual report of the BIS explains these activities in some detail:
http://www.bis.org/publ/arpdf/archive/ar1931_en.pdf
A June 2008 presentation made by the BIS to potential central bank members at its headquarters in Basel, Switzerland, noted that the bank’s services to its members include secret interventions in the gold and foreign exchange markets:
https://www.gata.org/node/11012
The use of gold swaps to take gold held by commercial banks and then deposit it in gold sight accounts held in the name of the BIS at major central banks doesn’t appear ever to have been as large a part of the BIS’ gold banking business as it has been in recent years, although the recent declines suggest this is changing.
As of March 31, 2010, excluding gold owned by the BIS, there were 1,706 tonnes held in the name of the BIS in gold sight accounts at major central banks, of which 346 tonnes or 20% were sourced from gold swaps from commercial banks.
If the BIS was adopting the level of disclosures made by publicly held companies, such as commercial banks, some explanation of these changes probably would have been required by the accounting regulators. This irony may not be lost on those dealing with regulatory activities at the BIS. Presumably the shrinkage of the BIS’ gold banking business shows that even central banks now prefer to hold their own gold or hold it in earmarked form — that is, as allocated gold.
A review of Table B below highlights recent BIS activity with gold swaps, and despite the recent declines, the recent positions estimated from the BIS monthly statements have regularly been large, especially in early 2022, and the volume of trading has been significant.
No explanation for this continuing use of swaps has been published by the BIS. Indeed, no comment on the bank’s use of gold swaps has been offered since 2010.
This gold is supplied by bullion banks via the swaps to the BIS. The gold is then deposited in BIS gold sight accounts (unallocated gold accounts) at major central banks such as the Federal Reserve.
The reasons for this activity have never been fully explained by the BIS and various conjectures have been made as to why the BIS has facilitated it. One conjecture is that the swaps are a mechanism for the return of gold secretly supplied by central banks to cover shortfalls in the gold markets. The use of the BIS to facilitate this trade suggests of a desire to conceal the rationale for the transactions.
As can be seen in Table A below, the BIS has used gold swaps extensively since its financial year 2009-10. No use of swaps is reported in the bank’s annual reports for at least 10 years prior to the year ended March 2010.
The February 2021 estimate of the bank’s gold swaps (552 tonnes) was higher than any level of swaps reported by the BIS at its March year-end since March 2010. The swaps reported at March 2021 were at the highest year-end level reported, as is clear from Table A.
—–
Table A — Swaps reported in BIS annual reports
March 2010: 346 tonnes.
March 2011: 409 tonnes.
March 2012: 355 tonnes.
March 2013: 404 tonnes.
March 2014: 236 tonnes.
March 2015: 47 tonnes.
March 2016: 0 tonnes.
March 2017: 438 tonnes.
March 2018: 361 tonnes.
March 2019: 175 tonnes
March 2020: 326 tonnes
March 2021: 490 tonnes
March 2022: 358 tonnes
—–
The table below reports the estimated swap levels since August 2018. It can be seen that the BIS is actively involved in trading gold swaps and other gold derivatives with changes from month to month reported in excess of 100 tonnes in this period.
—–
Table B – Swaps estimated by GATA from BIS monthly statements of account
Month …. Swaps
& year …. in tonnes
May-23 … /188
Apr-23 … /135
Mar-23 … /78
Feb-23 … /136
Jan-23 …/103
Dec-22 … /0
Nov-22 … /105
Oct-22 ….. /7
Sep-22 …../57
Aug -22 ….. /75
Jul-22 ….. /56
Jun-22 ….. /202
May-22 ….. /270
Apr-22 ….. /315
Mar-22 …. /358
Feb-22 …. /472
Jan-22 ….. /501
Dec-21…. /414
Nov-21…. /451
Oct-21…. /414
Sep-21 …. /438
Aug-21 …. /464
Jul-21 …. /502
Jun-21 …./471
May-21 …./517
Apr-21 …. /472
Mar-21…. /490±
Feb-21 …../552
Jan-21 …. /523
Dec-20 …. /545
Nov-20 …. /520
Oct-20 …. /519
Sep-20…../ 520
Aug-20…../ 484
Jul-20 ….. / 474
Jun-20 …. / 391
May-20 …. / 412
Apr-20 …. / 328
Mar-20 …. / 326**
Feb-20 …. / 326
Jan-20 …. / 320
Dec-19 …. / 313
Nov-19 …. / 250
Oct-19 …. / 186
Sep-19 …. / 128
Aug-19 …. / 162
Jul-19 ….. / 95
Jun-19 …. / 126
May-19 …. / 78
Apr-19 ….. / 88
Mar-19 …. / 175
Feb-19 …. / 303
Jan-19 …. / 247
Dec-18 …. / 275
Nov-18 …. / 308
Oct-18 …. / 372
Sep-18 …. / 238
Aug-18 …. / 370
± The estimate originally reported by GATA was 487 tonnes, but the BIS annual report states 490 tonnes, It is believed that slightly different gold prices account for the difference.
** The estimate originally reported by GATA was 332 tonnes, but the BIS annual report states 326 tonnes. It is believed that slightly different gold prices account for the difference.
GATA uses gold prices quoted by USAGold.com to estimate the level of gold swaps held by the BIS at month-ends.
—–
As noted already, the BIS in recent times has refused to explain its activities in the gold market, nor for whom the bank is acting:
https://www.gata.org/node/17793
Despite this reticence the BIS has almost certainly acted on behalf of central banks in taking out these swaps, as they are the BIS’ owners and control its Board of Directors. Historically, the BIS has often acted on behalf of the Federal Reserve.
This refusal to explain prompts some observers to believe that the BIS acts as an agent for central banks intervening surreptitiously in the gold and currency markets, providing those central banks with access to gold as well as protection from exposure of their interventions.
As mentioned above, it is possible that the swaps provide a mechanism for bullion banks to return gold originally lent to them by central banks to cover bullion bank shortfalls of gold. Some commentators have suggested that a portion of the gold held by exchange-traded funds and managed by bullion banks is sourced directly from central banks.
—–
Robert Lambourne is a retired business executive in the United Kingdom who consults with GATA about the involvement of the Bank for International Settlements in the gold market.
END
end
4, OTHER IMPORTANT GOLD/SILVER COMMENTARIES/
Is this the start? China calls for an Internation silver market reform!
(James Anderson)
Chinese Call for International Silver Market Reform
Updated June 12, 2023
By James Anderson
Gold & Silver News
We begin with an update from China where silver bullion demand for industrial inputs and jewelry demand is outpacing diminishing silver bullion supply levels.
How is their state run media covering this ongoing, underreported story?
This week it was announced that one of China’s largest banks, the China Construction Bank is increasing its global capacity to service its local and global client base in precious metals and bulk commodity trading.
Meanwhile early this week, there was an open article written in China Bai news calling for international silver market reform. Explicitly citing the ridiculous outsized paper derivative leverage used by the COMEX and City of London’s LBMA markets in order to keep gold and especially silver values at still suppressed price levels.
The author cuts to the chase regarding diminishing silver bullion supplies stating the following.
Two weeks ago on this SD Bullion youtube channel, we showed you the record sized silver bullion withdrawal that the author was referring to at the end of his plea for higher silver values for future civilization’s industrial development.
Certainly every industry Elon Musk is involved in will require more and more industrial silver moving ahead.
END
5 a. IMPORTANT COMMENTARIES ON COMMODITIES:
end
5 B GLOBAL COMMODITY ISSUES/FOOD IN GENERAL
6.CRYPTOCURRENCY//DIGITAL CURRENCY// COMMENTARIES/
This should cause Bitcoin prices to fall: Blackrock is close to filing for a Bitcoin ETF
(zerohedge)
BlackRock Close To Filing For Bitcoin ETF: Report
THURSDAY, JUN 15, 2023 – 10:34 AM
After dumping overnight on the latest negative development in what has been a relentless onslaught of bad news for crypto – when South Korean bitcoin lending platforms Delio and Haru announced the temporary suspension of customer withdrawals “in order to safely protect the assets of customers currently in custody” – this morning the crypto space finally got some welcome news when CoinDesk reported that BlackRock, the world’s biggest asset manager, is close to filing an application for a Bitcoin ETF.
According to the report, BlackRock will be using Coinbase Custody for the ETF and the crypto exchange’s spot market data for pricing.
BlackRock began working with Coinbase to make crypto directly available to institutional investors midway through last year.
It wasn’t clear if the ETF will be spot or futures; to date, the Securities and Exchange Commission, led by political activist Gary Gensler whose primary objective is to follow Democrat demand that the US crypto industry be crippled, which oversees ETFs in the U.S., has rejected every application for a spot bitcoin ETF, though it has approved several bitcoin futures ETFs for trading.
The fact that the world’s largest asset manager is again stepping up in the crypto space is a welcome development at a time when the politicized SEC has been weaponized to execute Democrat marching orders to crush the crypto industry in the US (thereby making the future of bitcoin a key issue in the 2024 elections), and comes just one day after the FT reported that in a surprising twist, China appears to also be warming up to crypto after years of crackdowns, and that Hong Kong’s banking regulator is pressuring lenders including HSBC and Standard Chartered to take on crypto exchanges as clients, at a time of unprecedented crackdowns by US regulators on the industry.
END
1.YOUR EARLY CURRENCY VALUES/GOLD AND SILVER PRICING/ASIAN AND EUROPEAN BOURSE MOVEMENTS/AND INTEREST RATE SETTINGS/THURSDAY MORNING.7:30 AM
ONSHORE YUAN: CLOSED DOWN AT 7.1602
OFFSHORE YUAN: 7.1700
SHANGHAI CLOSED UP 23.99 PTS OR 0.74%
HANG SENG CLOSED UP 420.50 PTS OR 2.17%
2. Nikkei closed DOWN 16.93 PTS OR 0.05%
3. Europe stocks SO FAR: ALL MIXED
USA dollar INDEX UP TO 102.78 EURO FALLS TO 1.0829 DOWN 13 BASIS PTS
3b Japan 10 YR bond yield: FALLSS TO. +.424 Japan buying 100% of bond issuance)/Japanese YEN vs USA cross now at 141.22/JAPANESE YEN FALLING AS WELL AS LONG TERM 10 YR. YIELDS RISING //EVENTUALLY THIS WILL BREAK THE JAPANESE CENTRAL BANK
3c Nikkei now ABOVE 17,000
3d USA/Yen rate now well ABOVE the important 120 barrier this morning
3e Gold DOWN /JAPANESE Yen DOWN CHINESE YUAN: DOWN// OFF- SHORE:DOWN
3f Japan is to buy INFINITE TRILLION YEN’S worth of BONDS. Japan’s GDP equals 5 trillion USA
Japan to buy 100% of all new Japanese debt and NOW they will have OVER 50% of all Japanese debt.
3g Oil DOWN for WTI and DOWN FOR Brent this morning
3h European bond buying continues to push yields lower on all fronts in the EMU. German 10yr bund UP TO +2.508***/Italian 10 Yr bond yield RISES to 4.180*** /SPAIN 10 YR BOND YIELD RISES TO 3.471…** DANGEROUS//
3i Greek 10 year bond yield RISES TO 3.853
3j Gold at $1927.95 silver at: 23.34 1 am est) SILVER NEXT RESISTANCE LEVEL AT $30.00
3k USA vs Russian rouble;// Russian rouble UP 0 AND 62 /100 roubles/dollar; ROUBLE AT 83.54//
3m oil into the 69 dollar handle for WTI and 73 handle for Brent/
3n Higher foreign deposits out of China sees huge risk of outflows and a currency depreciation. This can spell financial disaster for the rest of the world/
JAPAN ON JAN 29.2016 CONTINUES NIRP. THIS MORNING RAISES AMOUNT OF BONDS THAT THEY WILL PURCHASE UP TO .5% ON THE 10 YR BOND///YEN TRADES TO 141.22 10 YEAR YIELD AFTER BREAKING .54%, RISES TO .424% STILL ON CENTRAL BANK (JAPAN) INTERVENTION
30 SNB (Swiss National Bank) still intervening again in the markets driving down the FRANC. It is not working: USA/SF this 0.9021 as the Swiss Franc is still rising against most currencies. Euro vs SF 0.9769 well above the floor set by the Swiss Finance Minister. Thomas Jordan, chief of the Swiss National Bank continues to purchase euros trying to lower value of the Swiss Franc.
USA 10 YR BOND YIELD: 3.835 UP 4 BASIS PTS…
USA 30 YR BOND YIELD: 3.906 UP 3 BASIS PTS/
USA 2 YR BOND YIELD: 4.757 UP 8 BASIS PTS
USA DOLLAR VS TURKISH LIRA: 23.66…(TURKEY SET TO BLOW UP FINANCIALLY)
GREAT BRITAIN/10 YEAR YIELD: UP 2 BASIS PTS AT 4.4605 UP 7 BASIS PTS (RATES RISING RAPIDLY)
end
2. Overnight: Newsquawk and Zero hedge:
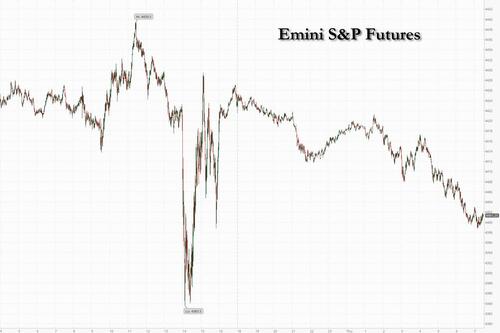
Futures Drop As Markets Reassess Fed’s Hawkish Skip; ECB Looms
THURSDAY, JUN 15, 2023 – 08:02 AM
Futures are lower, reversing much of the post-hawkish FOMC euphoria, as markets digest the Fed meeting, the decision to halt rates while projecting two more rate hikes, the increase in the terminal rate, and when the Fed begins an easing cycle, and concluding that the mix is not as bullish as they thought less than 24 hours ago. As of 7:30am, emini S&P futures were down 0.4% to 4,400 while Nasdaq futures dropped 0.7%. Treasury yields are climbing after warnings from the Fed yesterday that rates will go higher in the coming months, which also helped pull the USD higher. Commodities are seeing a modest relief rally with Ags leading while gold prices are falling, with the higher rate outlook generally a dampener on appetite for bullion, while oil and iron ore both climb. Today’s macro focus is on Retail Sales and Jobless Claims as CPI and unemployment become the two major data points ahead of the July Fed where the market is pricing ~70% chance of a 25bps hike. The next CPI is on July 12 and NFP is July 7.
In premarket trading, Tesla fell as much as 3% on course to extend losses after the world’s most valuable automaker snapped its record-setting 13-session streak of gains on Wednesday. US-listed Chinese stocks gained after China’s central bank cut interest rates again, this time on one-year loans just minutes before releasing the latest dismal economic data dump, lifting hope for more policy stimulus to come as the latest data pointed to a darkening economic picture. Crypto-related stocks fell in US premarket trading, tracking a dip in Bitcoin as worries re-emerge over the sector’s risks following news that two South Korea-linked crypto platforms have halted withdrawals. Coinbase shares fall as much as 3.6%, Riot Platforms -3.5%. Here are some other notable premarket movers:
- Coherent rose as much as 4.3% in premarket trading, set to extend Wednesday’s gains spurred by the company’s unveiling of new laser processing heads aimed at electric-vehicle manufacturing.
- Domino’s Pizza rises 2.1% in US premarket trading after Stifel upgrades the restaurant chain to buy from hold, predicting delivery sales to stabilize over the next 12 months, while carryout sales grow to new record highs
- Nikola jumps as much as 22% in premarket trading, set to extend gains for a seventh consecutive session — which would be its longest winning streak since November 2020.
- Nvidia falls as much as 1.3% in premarket trading, putting the stock on course to snap a five-day winning streak that has boosted the market value of the world’s most valuable chip company beyond $1 trillion.
- SoFi Technologies drops 3.5% in US premarket trading as Oppenheimer downgrades the online lender to perform from outperform, with the stock’s valuation now seen capturing its positive outlook
After the Fed quashed enthusiasm in markets about the potential for imminent rate cuts, investors are about to get an update from the ECB. The bank is expected to raise its deposit rate by a quarter-point to 3.5% later Thursday – even though Europe officially entered a technical recession just a few days ago – with attention mostly focused on what else officials intend to do to tackle inflation that’s still three times the 2% target.
“With the Fed’s policy rate likely to peak soon, the ECB may not want to be too far behind,” said Geoff Yu, a foreign exchange and macro strategist at BNY Mellon. “As tempting it may be to price a turn, we believe this week’s meeting is far too soon.”
Meanwhile, in a stark reminder just how fragile Europe’s inflationary picture is, concerns over European gas supplies are back on traders’ radar. Bloomberg reported that European natural gas prices spiked as the Netherlands is set to announce it will close the region’s biggest gas site later this year. Benchmark futures soared as much as 24% on Thursday to their highest level since early April.
European stocks were also on the back foot ahead of the ECB decision later today. The Stoxx 600 is down 0.4% and on course to snap a three-day winning streak as mining stocks underperform. In corporate news, SoftwareOne Holding AG surged as much as 21% after Bain Capital offered about $3.2 billion to take the Swiss IT services provider private. Global miners Anglo American and Rio Tinto fell as basic resources stocks led declines in Europe following news that Chinese economic activity softened in May. But retailers were a bright spot, with H&M and Asos Plc rallying on improving prospects. Here are the most notable European movers:
- Hennes & Mauritz shares rise as much as 6.9%, reaching the highest since April 25 and gaining for the fourth session in a row. Jefferies highlights a strong start for the fiscal year’s third quarter
- Informa gains as much as 4.3% to the highest level since February 2020, after the events and publishing firm boosts revenue and operating profit guidance ranges ahead of its AGM
- Asos shares rise as much as 16%, the most since Jan. 12, after the online fast-fashion retailer provided a 3Q sales update and kept its outlook unchanged for the year
- PostNL rises as much as 6.5% after being raised to buy from hold at ING, based on the Dutch delivery company’s 1Q beat and recovery in the parcel volume trend in March and April
- Krones advances as much as 6.4%, the most since early November, as Hauck & Aufhaeuser lifts its rating to buy, citing improving margin expansion for the maker of packaging robots
- SoftwareONE shares rise as much as 21% after Bain Capital offered 2.93 billion Swiss francs ($3.2 billion) in cash to take the company private, a bid the board said materially undervalues the business
- Halma shares drop as much as 9.4%, the most since March 2020, after the UK health and safety sensor tech firm’s FY results showed a decline in its return on sales in the second half of its FY
- Bachem falls as much as 5.7% after Baader Helvea downgrades the shares to reduce from add, giving the Belgian biotech its only negative analyst rating, one reason being currency drag
- Billerud shares fall as much as 11%, the most since May 25, before trimming most losses after the Swedish paper and pulp manufacturer flagged its second-quarter profit will be lower than previously predicted
- Bunzl shares decline as much as 2.8% after the UK distribution group’s trading update implied a slowdown in organic growth in 2Q and flagged volume weakness in its North American business
- HMS Networks falls as much as 7%, the most since December, after the industrial communications firm was downgraded to sell from hold at ABG Sundal Collier, expecting negative order growth
Earlier in the session, Asian markets traded mostly higher; Chinese equities gained after the People’s Bank of China cut a key lending rate amid speculation that more stimulus is on the way. That also boosted US-listed Chinese stocks, with Alibaba Group and Baidu among those advancing in premarket trading. The PBOC’s move also forms part of broader stimulus efforts to support real estate and domestic demand. Data showing retail sales moderated more than expected in May added to worries about further slowing in China. Industrial production was also lower, but met consensus forecasts.
- Hang Seng and Shanghai Comp. were positive with outperformance in Hong Kong after the HKMA kept rates unchanged for the first time since March 2022 in lockstep with the Fed, while the advances were led by property names amid expectations for more support measures for the industry and after Chinese House Prices returned to growth. Furthermore, the PBoC cut its 1-year MLF rates by 10bps following similar cuts to short-term funding rates although participants also digested disappointing activity data from China in which both Industrial Production and Retail Sales missed estimates.
- ASX 200 was kept afloat in rangebound trade with stellar jobs data partly clouded by yield curve inversion.
- Nikkei 225 benefitted from currency depreciation and encouraging data including Exports and Machinery Orders.
In FX, the dollar trimmed its first advance in three days, gains prompted by traders mulling prospects for further US rate hikes. The Aussie dollar is among the best-performing G10 currencies, rising 0.3% versus the greenback, after employment data smashed expectations. The euro strengthened ahead of the ECB policy announcement. Ahead of tomorrow’s BOJ rate decision, selling in the yen pushed the currency to the lowest level since November, prompting a warning from Japanese Chief Cabinet Secretary Hirokazu Matsuno that excessive movements weren’t desirable; not that Japan can do anything to contain said movements.
In rates, treasuries are lower with the US two-year yield up 3bps at 4.72% as euro-zone yields climb ahead of ECB rate decision and President Christine Lagarde’s press conference; German two-year yields add 6bps. The TSY curve is flatter with 2s10s, 5s30s spreads also rangebound. US yields are cheaper by 5bps across front-end of the curve with 2s10s, 5s30s spreads flatter by 1.2bp and 3bp on the day; 10- year yields at 3.825%, cheaper by 3.5bp vs Wednesday’s close with bunds lagging by 2.5bp in the sector ahead of ECB, while gilts mildly outperform.
In commodities, crude futures advance with WTI rising 0.5% to trade near $68.60. Spot gold falls 0.4% to around $1,938. Bitcoin is down 0.3%
To the day ahead now, and the main highlight will be the ECB’s latest policy decision, along with President Lagarde’s press conference. In addition, we’ll hear from the ECB’s Nagel and Villeroy, and BoE Deputy Governor Cunliffe. On the data side, US releases include retail sales, industrial production, and capacity utilisation for May, the Philadelphia Fed’s business outlook and the Empire State manufacturing survey for June, as well as the weekly initial jobless claims.
Market Snapshot
- S&P 500 futures down 0.4% to 4,400
- MXAP little changed at 168.42
- MXAPJ up 0.7% to 531.29
- Nikkei little changed at 33,485.49
- Topix little changed at 2,293.97
- Hang Seng Index up 2.2% to 19,828.92
- Shanghai Composite up 0.7% to 3,252.98
- Sensex down 0.3% to 63,044.94
- Australia S&P/ASX 200 up 0.2% to 7,175.33
- Kospi down 0.4% to 2,608.54
- STOXX Europe 600 down 0.2% to 463.91
- German 10Y yield little changed at 2.49%
- Euro little changed at $1.0829
- Brent Futures up 0.7% to $73.69/bbl
- Gold spot down 0.5% to $1,932.09
- U.S. Dollar Index up 0.20% to 103.15
Top Overnight News from Bloomberg
- China’s economic momentum softens, with industrial production coming in at +3.5% in May (inline with the Street, but down from +5.6% in April) and retail sales +12.7% (down from +18.4% in April and below the Street’s +13.7% forecast). BBG
- China cuts rates – as expected, China lowered the MLF (medium-term lending facility) rate by 10bp (the move follows a cut to the 7-day repo rate earlier this week, and the gov’t is widely anticipated to take the Loan Prime Rate down 10bp next week). BBG
- China grapples with rising worker unrest as factory strikes hit a 7-year high amid soft growth, weak pay, and fewer job opportunities. RTRS
- The United States played down expectations of any breakthrough from the first trip by a U.S. Secretary of State to China in five years, after a tense call with China’s foreign minister ahead Antony Blinken’s visit to Beijing next week. RTRS
- Support for giving aid to Ukraine is starting to weaken in Congress amid growing calls for fiscal austerity. NYT
- The ECB is set to deliver what may be the penultimate increase of this hiking cycle. It’s expected to lift the deposit rate by a quarter point to 3.5%, but the focus is mostly on any guidance about future increases. Consensus is for one final hike next month. Markets don’t expect much but a more hawkish tone may boost the euro. BBG
- US retail sales probably dipped 0.2% month on month in May, giving back some of April’s 0.4% gain, as consumers spent less on autos and energy, Bloomberg Economics said. Activity at restaurants and bars should show continued spending. Kroger reports sales premarket. BBG
- Washington is hoping to strike an informal deal with Iran that would limit Tehran’s nuclear activities and free American prisoners. NYT
- The jump in used-car costs that propped up US inflation last month is widely expected to swing into reverse in June, finally delivering a slowdown in one of the most-watched price gauges. Leading indicators of auto prices compiled by private firms like Manheim have already begun falling — and those declines should begin filtering into the official Bureau of Labor Statistics data for consumer prices in the next monthly report, due July 12. BBG
A more detailed look at global markets courtesy of Newsquawk
APAC stocks traded mostly higher but with gains capped in the aftermath of the FOMC where a hawkish knee-jerk reaction to the Fed’s dot plots was partially unwound during the press conference after Powell distanced himself from projections, while the attention in the region shifted to the slew of key data releases. ASX 200 was kept afloat in rangebound trade with stellar jobs data partly clouded by yield curve inversion. Nikkei 225 benefitted from currency depreciation and encouraging data including Exports and Machinery Orders. Hang Seng and Shanghai Comp. were positive with outperformance in Hong Kong after the HKMA kept rates unchanged for the first time since March 2022 in lockstep with the Fed, while the advances were led by property names amid expectations for more support measures for the industry and after Chinese House Prices returned to growth. Furthermore, the PBoC cut its 1-year MLF rates by 10bps following similar cuts to short-term funding rates although participants also digested disappointing activity data from China in which both Industrial Production and Retail Sales missed estimates.
Top Asian News
- PBoC conducted CNY 237bln in 1-year MLF lending with the rate cut by 10bps to 2.65%.
- HKMA maintained its base rate unchanged at 5.50%, as expected.
- China National Bureau of Statistics said the economic recovery is not yet solid but noted that Q2 growth will be significantly faster than Q1 and that China’s economy is resilient despite facing some pressures. China’s stats bureau also stated that pressure on employment and structural problems persist, while it added that consumption recovery faces some hurdles and China will support consumption growth.
- China’s commerce Ministry says will continue to improve consumption policies and introduce a series of policy measures to support the recovery and expansion of consumption; China faces relatively big pressure on exports.
- JP Morgan cuts China’s 2023 full year GDP growth forecast to 5.5% (prev. 5.9%).
- Japan’s opposition party is making final preparations to submit a no-confidence vote on Friday.
European bourses are somewhat mixed but have generally been edging lower throughout the morning pre-ECB & post-FOMC, Euro Stoxx 50 -0.4%. Sectors are similarly lower overall with Basic Resources lagging on base metals prices while Banks are weighed on by CJEU’s ruling on Polish mortgages; though, Retail names buck the trend after H&M’s update. Stateside, futures are lower across the board with the NQ -0.6% as yields continue to rise. Overall, the ES remains just above the 4400 mark ahead of US data and as the FOMC blackout lifts to feature Bullard, Barkin & Waller on Friday’s schedule.
Top European News
- UK PM Sunak abandoned the plan for a supermarket price cap following a backlash, according to The Telegraph.
- UK’s ONS says 17% of companies expect to increase prices in the month ahead; lowest since the series began in March 2022.
- Brussels is under pressure to impose restrictions on Chinese electric cars, over fears that imports are flooding the European market at a speed and scale that threaten the Continent’s own production of such vehicles, according to Politico.
- EU Top Court says Polish banks cannot charge for the cost of capital in FX mortgage contracts which have been deemed as invalid, consumers with such contracts can demand compensation from banks. In response, Polish Banking Regulator KNF says the CJEU ruling on Polish FX loans is negative for the Polish banking sector and the economy. Click here for details & analysis.
FX
- Hawkish dot plots help Dollar recover from pre-FOMC lows, DXY firmer within 103.380-102.910 range.
- Yen sharply lower pre-BoJ on yield and policy divergence dynamics, USD/JPY around 141.00 between 141.50-139.95 parameters.
- Euro eyeing ECB for independent direction via guidance beyond widely expected 25 bp hike, EUR/USD back above 1.0800.
- Aussie underpinned after stellar jobs data, but Kiwi undermined as NZ tech recession confirmed, AUD/USD reclaims 0.6800+ status, NZD/USD loses 0.6200 handle and AUD/NZD cross bounces almost big figure from sub-1.0950
- Norges Bank Regional Network Survey (Q2): Slightly better outlook, but wide variations. Click here for details & analysis.
Fixed Income
- Bonds extend post-Fed declines and curves remain flatter on balance on hawkish dot plot trajectory.
- Bunds pivot 133.00, Gilts sub-95.00, albeit holding up better having traded above par and T-note hovering within 112-31+/16+ range.
- ECB in focus and expected to hike 25 bp, but several top tier US data releases also ahead.
Commodities
- Commodities are generally in familiar ranges in what has been relatively quiet trade post-FOMC and pre-ECB; crude benchmarks firmer, but in familiar ranges.
- With the exception of base/industrial metals which are dented after China’s disappointing activity data whereby both industrial production and retail sales missed expectations.
- Spot gold is unable to glean any support from the modest equity pressure that has crept in throughout the European morning. Though, similarly, it hasn’t been tarnished too much by the stronger USD.
- Kremlin says it sees no positive prospects for future of Black Sea Grain Deal; parts of grain deal affected Russia remain unfulfilled, cannot go on like this forever.
US Event Calendar
- 08:30: May Retail Sales Advance MoM, est. -0.2%, prior 0.4%
- 08:30: May Retail Sales Ex Auto MoM, est. 0.1%, prior 0.4%
- 08:30: May Retail Sales Control Group, est. 0.2%, prior 0.7%
- 08:30: May Import Price Index MoM, est. -0.5%, prior 0.4%
- 08:30: May Import Price Index YoY, est. -5.6%, prior -4.8%
- 08:30: May Export Price Index MoM, est. -0.1%, prior 0.2%
- 08:30: May Export Price Index YoY, est. -8.4%, prior -5.9%
- 08:30: June Initial Jobless Claims, est. 245,000, prior 261,000
- 08:30: June Continuing Claims, est. 1.77m, prior 1.76m
- 08:30: June Philadelphia Fed Business Outl, est. -14.0, prior -10.4
- 08:30: June Empire Manufacturing, est. -15.1, prior -31.8
- 09:15: May Capacity Utilization, est. 79.7%, prior 79.7%
- 09:15: May Manufacturing (SIC) Production, est. -0.1%, prior 1.0%
- 09:15: May Industrial Production MoM, est. 0.1%, prior 0.5%
- 10:00: April Business Inventories, est. 0.2%, prior -0.1%
- 16:00: April Total Net TIC Flows, prior $56.7b
- 16:00: April Net Foreign Security Purchases, prior $133.3b
DB’s Jim Reid concludes the overnight wrap
So a dovish hike last month turned into a hawkish pause this month as the Fed ended a series of 10 successive rate hikes last night but signalled that more may well be required, especially via a more hawkish dot plot that signalled two more hikes this year. However we should say that two years ago at the June meeting the median dot for the end of 2023 was at a lowly 0.6%, so these aren’t destiny. To be fair, Chair Powell acknowledged the uncertainty in future forecasts and therefore cautioned against reading too much into the dots. If and when the facts change those dots will be forgotten. Rates and equities sold off after the statement but recovered to being broadly unchanged through the press conference and into the close. It’s only overnight that we’ve seen a more aggressive selloff in rates again, which has taken 2yr and 10yr Treasury yields up to their highest level since SVB’s collapse, although equity futures remain flat still.
In terms of the decision, holding rates was seen as allowing the committee to “assess additional information and its implications for monetary policy” and to determine “the extent of additional policy firming that may be appropriate”. The wording of the statement was largely unchanged from the last meeting, but the market initially took a clear hawkish interpretation in response to an upgrading of the Fed’s dot plot projection. This showed the median member expecting two more 25bp hikes by the end of 2023, with 12 of the 18 members at that point or above, whereas only two members pencilled in no further hikes. So a lot to talk down ahead of the next July meeting in under 6 weeks’ time. The projections also saw 2023 core PCE revised up to 3.9% (from 3.6% in March).
In the press conference, Chair Powell’s message was consistent with the Fed seeing June only as a temporary pause, noting the dot plot signal that nearly all members “expect that it will be appropriate to raise interest rates somewhat further by the end of the year”. Still, the market rallied as Powell focused on data-dependence and noted, in the context of the end-23 dot plot, that he did not “have a lot of confidence that we can see where the fed funds rate will be that far in advance”. So an admission of the uncertainties.
He also said that the Committee didn’t make any decision about “what will happen at the next meeting” or about “going to an every other meeting” approach, but emphasised that July will be a “live meeting”. Powell’s comments did contain some additional hawkish undertones, including a strong push back against the idea of rate cuts later in 2023, highlighting that “not a single person on the Committee wrote down a rate cut this year, nor do I think it is at all likely to be appropriate”, and noting that core inflation remains high and has not yet responded much to the policy tightening. Futures ended the day pricing in a 62% chance of a Fed rate hike at the July meeting, but that’s since risen to 69% this morning. Furthermore, the implied pricing for December’s meeting rose +6.0bps to 5.18%, and has risen further to 5.23% overnight, leaving it almost 150bps above its SVB lows. An interesting feature of the reaction is how markets are still sceptical that the Fed will be able to lift rates as far as the median dot implies, with futures still only expecting one more hike remaining rather than two. Our US economists have maintained their baseline for a final 25bp rate hike in July, with the Fed then remaining on hold into early 2024. See their reaction here for details.
Markets largely reversed their initial negative reaction over the course of Powell’s press conference. The S&P 500 had traded -0.7% down intra-day following the FOMC decision but recovered to eke out a marginal gain (+0.08%), making it the first time since November 2021 that the S&P 500 has advanced 5 days in a row. The equity index was split and was led by semiconductors (+2.7%), consumer durables (+2.1%), and transports (+1.5%), while healthcare (-1.8%), banks (-1.2%), and energy (-1.1%) were the biggest laggards. US 2yr yields had jumped by 17bp after the FOMC press statement but reversed around 10bp of this move to close slightly higher on the day (+2.2bp) at 4.69%. Meanwhile, US 10yr yields closed lower on the day (-2.7bp) at +3.79%, also reversing most of an 8bp post-FOMC spike. Brought together the 2s10 flattened to -90.2bps, the most inverted since 9 March. In fact it’s only closed more inverted on five days in early March of this year, over the entire last 40 years. This morning however, yields have seen a further move higher, with the 2yr yield (+5.6bps) and the 10yr yield (+4.1bps) up to 4.74% and 3.83% respectively, marking their highest level since SVB’s collapse.
Overnight in Asia, we’ve also had some significant central bank news after the People’s Bank of China cut its 1yr medium-term lending facility rate by 10bps to 2.65%. That came shortly ahead of some further downside surprises in the latest economic data for May, which showed retail sales were up +12.7% year-on-year (vs. +13.7% expected). Furthermore, YTD property investment was down by -7.2% on a year-on-year basis, which again was worse than the -6.7% reading expected by the consensus.
The presence of further stimulus has helped support risk assets in Asia this morning, with the major equity indices mostly advancing. That includes the Hang Seng (+0.83%), the CSI 300 (+0.54%), the Nikkei (+0.46%) and the Shanghai Comp (+0.09%), although the KOSPI has seen a -0.30% fall. There were also some interesting stories elsewhere in the region. For instance, the Japanese Yen weakened to 141.29 per US Dollar, which is its lowest level since November, and led to comments from Japan’s Chief Cabinet Secretary Hirokazu Matsuno that excessive movements weren’t desirable. Meanwhile in Australia, a strong employment report with +75.9k more jobs in May (vs. +17.5k expected) meant that the 3s10s yield curve inverted for the first time since 2008. Finally, we got confirmation that New Zealand’s economy had been in recession, with Q1 seeing a second consecutive contraction in the economy with a -0.1% decline.
With the Fed out of the way, attention will now turn to the ECB, who are making their own policy decision later today. In terms of what to expect, it’s widely anticipated there’ll be another 25bp hike, which would take the deposit rate up to 3.50%. So the bigger question will be what the ECB signals going forward, and whether that aligns with market pricing that expects just one more hike after today’s. Our European economists expect the message to tilt hawkish and think the ECB will emphasise the persistence of underlying inflation and ongoing risks to the upside. Indeed, even though inflation came in below consensus in May, core CPI was still running at +5.3%, and our economists expect upward momentum from tourism-related pricing in the summer. Keep an eye out for the latest ECB staff forecasts as well, which they think will show upward revisions to core inflation for 2023 and 2024. See our economists’ preview of the meeting here.
Ahead of the ECB, there’d been a decent risk-on tone among European assets. Equities moved higher across most of the continent, with the STOXX 600 (+0.36%) advancing for a 3rd consecutive day. Sovereign bonds also sold off for the most part, with yields on 10yr bunds (+2.8bps), OATs (+3.1bps) and BTPs (+3.0bps) moving higher. And for the German 2yr yield (+4.2bps), there was another milestone as it hit a post-SVB high of 2.98%.
The main exception to this pattern came from the UK, where gilts recovered some ground after their sharp selloff on Tuesday. That was evident across the curve, with yields on 2yr gilts down -7.9bps, and those on 10yr gilts down -4.1bps. However, it’s still worth noting that gilt yields have climbed sharply over the last month even with that partial recovery, and yesterday brought fresh reports that mortgage providers were withdrawing their products, which demonstrates the impact that these moves are having on the real economy. Furthermore, investors are continuing to fully price in five further 25bp rate hikes, which if realised would take Bank Rate up to 5.75%, which is the highest terminal rate priced in for the major central banks among the developed economies.
It might seem like old news now, but earlier in the day US Treasuries had rallied thanks to a downside surprise in the US PPI data. It showed headline producer prices fell by a monthly -0.3% (vs. -0.1% expected), which took the year-on-year rate down to +1.1% (vs. +1.5% expected). Bear in mind that only a year earlier, that stood a whole 10 points higher at +11.1%, and the declines take it down to its lowest since December 2020. The core PPI measure was a bit more resilient, with the monthly measure at +0.2% as expected. But even that took the year-on-year print down to +2.8% (vs. +2.9% expected), the lowest since February 2021.
Finally, when it came to yesterday’s other data, the UK’s monthly GDP growth for April was in line with expectations at +0.2%. We also had the Euro Area industrial production print for April, which grew by +1.0% (vs. +0.9% expected).
To the day ahead now, and the main highlight will be the ECB’s latest policy decision, along with President Lagarde’s press conference. In addition, we’ll hear from the ECB’s Nagel and Villeroy, and BoE Deputy Governor Cunliffe. On the data side, US releases include retail sales, industrial production, and capacity utilisation for May, the Philadelphia Fed’s business outlook and the Empire State manufacturing survey for June, as well as the weekly initial jobless claims.
end
2 b) NOW NEWSQUAWK (EUROPE/REPORT)/ASIA REPORT
Equities slip, JPY falls, AUD bid and NZD lags with metals tarnished; ECB due – Newsquawk US Market Open
THURSDAY, JUN 15, 2023 – 06:12 AM
- European bourses & US futures trade on the backfoot post-FOMC and pre-ECB
- DXY propped up, AUD outperforms following a strong jobs report whilst NZD lags as it enters a recession
- JPY majorly lags on the prospect of even wider BoJ-Fed divergence ahead of Friday’s meeting
- Core benchmarks slip and extend on post-Fed declines whilst European supply was well received
- Base/industrial metals dented on softer Chinese activity data despite a 10bp MLF cut
- Looking ahead, highlights include; ECB’s Policy announcement, Lagarde Press Conference, US IJC, US Philly Fed Business Ind, US Retail Sales MM, US Industrial Production, BoE’s Cunliffe

More Newsquawk in 3 steps:
1. Subscribe to the free premarket movers reports
2. Listen to this report in the market open podcast (available on Apple and Spotify)
3. Trial Newsquawk’s premium real-time audio news squawk box for 7 days
EUROPEAN TRADE
EQUITIES
- European bourses are somewhat mixed but have generally been edging lower throughout the morning pre-ECB & post-FOMC, Euro Stoxx 50 -0.4%.
- Sectors are similarly lower overall with Basic Resources lagging on base metals prices while Banks are weighed on by CJEU’s ruling on Polish mortgages; though, Retail names buck the trend after H&M’s update.
- Stateside, futures are lower across the board with the NQ -0.6% as yields continue to rise. Overall, the ES remains just above the 4400 mark ahead of US data and as the FOMC blackout lifts to feature Bullard, Barkin & Waller on Friday’s schedule.
- Click here and here for a recap of the main European updates.
- Click here for more detail.
FX
- Hawkish dot plots help Dollar recover from pre-FOMC lows, DXY firmer within 103.380-102.910 range.
- Yen sharply lower pre-BoJ on yield and policy divergence dynamics, USD/JPY around 141.00 between 141.50-139.95 parameters.
- Euro eyeing ECB for independent direction via guidance beyond widely expected 25 bp hike, EUR/USD back above 1.0800.
- Aussie underpinned after stellar jobs data, but Kiwi undermined as NZ tech recession confirmed, AUD/USD reclaims 0.6800+ status, NZD/USD loses 0.6200 handle and AUD/NZD cross bounces almost big figure from sub-1.0950
- Norges Bank Regional Network Survey (Q2): Slightly better outlook, but wide variations. Click here for details & analysis.
- Click here for notable OpEx for the NY Cut.
- Click here for more detail.
FIXED INCOME
- Bonds extend post-Fed declines and curves remain flatter on balance on hawkish dot plot trajectory.
- Bunds pivot 133.00, Gilts sub-95.00, albeit holding up better having traded above par and T-note hovering within 112-31+/16+ range.
- ECB in focus and expected to hike 25 bp, but several top tier US data releases also ahead.
- Click here for more detail.
COMMODITIES
- Commodities are generally in familiar ranges in what has been relatively quiet trade post-FOMC and pre-ECB; crude benchmarks firmer, but in familiar ranges.
- With the exception of base/industrial metals which are dented after China’s disappointing activity data whereby both industrial production and retail sales missed expectations.
- Spot gold is unable to glean any support from the modest equity pressure that has crept in throughout the European morning. Though, similarly, it hasn’t been tarnished too much by the stronger USD.
- Kremlin says it sees no positive prospects for future of Black Sea Grain Deal; parts of grain deal affected Russia remain unfulfilled, cannot go on like this forever.
- Click here for more detail.
CRYPTO
- Bitcoin is incrementally lower but remains relatively contained with specifics limited and markets very much focused on broader macro drives.
NOTABLE EUROPEAN HEADLINES
- UK PM Sunak abandoned the plan for a supermarket price cap following a backlash, according to The Telegraph.
- UK’s ONS says 17% of companies expect to increase prices in the month ahead; lowest since the series began in March 2022.
- Brussels is under pressure to impose restrictions on Chinese electric cars, over fears that imports are flooding the European market at a speed and scale that threaten the Continent’s own production of such vehicles, according to Politico.
- EU Top Court says Polish banks cannot charge for the cost of capital in FX mortgage contracts which have been deemed as invalid, consumers with such contracts can demand compensation from banks. In response, Polish Banking Regulator KNF says the CJEU ruling on Polish FX loans is negative for the Polish banking sector and the economy. Click here for details & analysis.
NOTABLE US HEADLINES
- US President Biden congratulated both parties after a West Coast port contract deal was reached and said port workers will finally get the pay, benefits and quality of life they deserve, according to Reuters.
- US Fed will release the results of 2023 bank stress tests on June 28th at 16:30EDT/21:30BST, according to Reuters.
- Redfin: total number of US homes for sales -6% YY, four weeks to June 11th in the biggest decline for 13-months.
GEOPOLITICS
- Israel told Russia it is highly concerned about its growing military cooperation with Iran in the war in Ukraine and the possibility it will provide Tehran with advanced weapon systems, according to Axios.
- Japanese Chief Cabinet Secretary Matsuno said Japan, Philippines and US security advisers will meet on Friday to discuss regional matters, according to Reuters.
- Russia and the US have been in direct contact on new start Nuclear Arms Treaty, according to Tass citing Russia’s Ryabkov.
- Russian Defence Ministry and Federal Security Service consider it to be possible to hold elections in Russia’s newly annexed regions, according to Tass citing Head of Electoral Commission.
APAC TRADE
- APAC stocks traded mostly higher but with gains capped in the aftermath of the FOMC where a hawkish knee-jerk reaction to the Fed’s dot plots was partially unwound during the press conference after Powell distanced himself from projections, while the attention in the region shifted to the slew of key data releases.
- ASX 200 was kept afloat in rangebound trade with stellar jobs data partly clouded by yield curve inversion.
- Nikkei 225 benefitted from currency depreciation and encouraging data including Exports and Machinery Orders.
- Hang Seng and Shanghai Comp. were positive with outperformance in Hong Kong after the HKMA kept rates unchanged for the first time since March 2022 in lockstep with the Fed, while the advances were led by property names amid expectations for more support measures for the industry and after Chinese House Prices returned to growth. Furthermore, the PBoC cut its 1-year MLF rates by 10bps following similar cuts to short-term funding rates although participants also digested disappointing activity data from China in which both Industrial Production and Retail Sales missed estimates.
NOTABLE ASIA-PAC HEADLINES
- PBoC conducted CNY 237bln in 1-year MLF lending with the rate cut by 10bps to 2.65%.
- HKMA maintained its base rate unchanged at 5.50%, as expected.
- China National Bureau of Statistics said the economic recovery is not yet solid but noted that Q2 growth will be significantly faster than Q1 and that China’s economy is resilient despite facing some pressures. China’s stats bureau also stated that pressure on employment and structural problems persist, while it added that consumption recovery faces some hurdles and China will support consumption growth.
- China’s commerce Ministry says will continue to improve consumption policies and introduce a series of policy measures to support the recovery and expansion of consumption; China faces relatively big pressure on exports.
- JP Morgan cuts China’s 2023 full year GDP growth forecast to 5.5% (prev. 5.9%).
- Japan’s opposition party is making final preparations to submit a no-confidence vote on Friday.
DATA RECAP
- Chinese Industrial Production YY (May) 3.5% vs Exp. 3.6% (Prev. 5.6%); Retail Sales YY (May) 12.7% vs Exp. 13.6% (Prev. 18.4%)
- Chinese Urban Investment YTD YY (May) 4.0% vs Exp. 4.4% (Prev. 4.7%)
- Chinese House Prices YY (May) 0.1% (Prev. -0.2%)
- Japanese Machinery Orders MM (Apr) 5.5% vs Exp. 3.0% (Prev. -3.9%); YY (Apr) -5.9% vs Exp. -8.0% (Prev. -3.5%)
- Japanese Trade Balance (JPY)(May) -1372.5B vs Exp. -1331.9B (Prev. -432.4B, Rev. -432.3B)
- Japanese Exports YY (May) 0.6% vs Exp. -0.8% (Prev. 2.6%); Imports YY (May) -9.9% vs Exp. -10.3% (Prev. -2.3%)
- Australian Employment (May) 75.9k vs Exp. 15.0k (Prev. -4.3k); Unemployment Rate (May) 3.6% vs Exp. 3.7% (Prev. 3.7%)
- Australian Participation Rate (May) 66.9% vs Exp. 66.7% (Prev. 66.7%)
- New Zealand GDP QQ (Q1) -0.1% vs. Exp. -0.1% (Prev. -0.6%, Rev. -0.7%); YY (Q1) 2.2% vs. Exp. 2.6% (Prev. 2.2%, Rev. 2.3%)
2 c. ASIAN AFFAIRS
ASIAN AND AUSTRALIAN CLOSINGS//EUROPE OPENING TRADING:
THURSDAY MORNING/WEDNESDAY NIGHT
SHANGHAI CLOSED UP 23.99 PTS OR 0.74% //Hang Seng CLOSED UP 420.50 PTS OR 2.17% /The Nikkei closed DOWN 16.93 OR 0.05% //Australia’s all ordinaries CLOSED UP 0.22 % /Chinese yuan (ONSHORE) closed DOWN 7.1602 /OFFSHORE CHINESE YUAN DOWN TO 7.1700 /Oil DOWN TO 69.10 dollars per barrel for WTI and BRENT DOWN AT 73.87 / Stocks in Europe OPENED ALL MIXED// ONSHORE YUAN TRADING ABOVE LEVEL OF OFFSHORE YUAN/ONSHORE YUAN TRADING WEAKER AGAINST US DOLLAR/OFFSHORE WEAKER
2 d./NORTH KOREA/ SOUTH KOREA/
///NORTH KOREA/SOUTH KOREA/
2e) JAPAN
JAPAN
END
3 CHINA /
CHINA/
Poor data from China sends the Yuan tumbling. What is very troubling to China is the huge jobless rate for youths 16 to 24 at over 20%
(zerohedge)
Yuan Tumbles After Chinese Economic Data Dump; Youth Jobless Rate Hits Record High
WEDNESDAY, JUN 14, 2023 – 10:34 PM
An ugly night of data from China tonight suggests the ‘re-opening’ is not gathering pace:
- China May Retail Sales disappointed, rising 12.7% Y/Y; Est. 13.7% – which is a flashing red indicator. Given the boost from the Golden Week holiday, May retail sales rising just 0.4% from April speaks to how consumer sentiment has yet to show any significant improvement.
- China May Industrial Output slowed to a 3.5% rise Y/Y; Est. 3.5%
- China Jan.-May Fixed Investment rose less than expected, up 4% Y/Y; Est. 4.4%
- China Jan.-May Property investment tumbled 7.2% from a year earlier with the value of new home sales by the 100 biggest developers falling 14.3% in May.
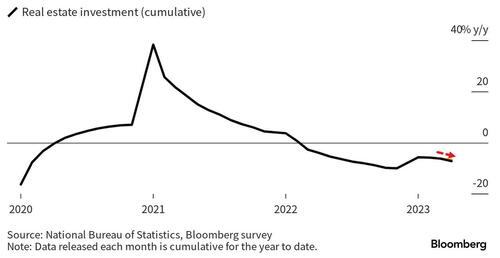
And finally, and perhaps most problematically, the jobless rate for 16-to-24 year olds hits 20.8% in May, another all-time high that is four times the national rate which stands at 5.2%…
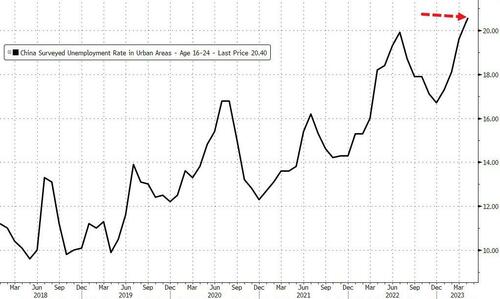
As Goldman noted, both cyclical and structural factors have contributed to the elevated youth unemployment rate in China.
- On the cyclical front, the correlation between unemployment rate and services sector output gap is much stronger for the 16-24 age group compared with the 25-59 year-olds. NBS’s labor survey shows that services industries such as hotel and catering, education, and information technology sectors tend to hire more young workers. Services sector slackening before reopening therefore contributed to the high youth unemployment rate. The improvement in service sector activity growth in Q1 should lower youth unemployment rate in Q2 by 3pp based on our estimate. While the improvement in service activity growth implies rising demand for young workers, this increase in demand could be more than offset by strong supply seasonality. As we enter the graduation season, youth unemployment rate could rise by 3-4pp and peak in summertime (usually in July or August) before starting to decline from end of Q3, if we look at the seasonal pattern in 2018 and 2019 (prior to Covid).
- Structural imbalance is another reason behind the high youth unemployment rate. Despite the fact that a rising share of unemployed persons aged 16-24 years old have higher education, there appears to be misalignment of academic disciplines with business requirements.
Ken Wong, Asia equity portfolio specialist at Eastspring Investments, said youth unemployment seems to be the big one:
“It impacts the consumption story and youth unemployment will probably continue to go up a bit more with fresh grads entering the workforce.”
The National Bureau of Statistics desperately tried to put some lipstick on this pig:
“The global environment is complex and grim, the domestic economy faces grave pressure of structural adjustment, and the economic recovery’s foundation is not yet solid.”
There is one silver- lining – the apparent oil demand rose 17.11% from a year ago in May
Critically, all of this puts more pressure on Beijing to unleash more stimulus (broader stimulus) and is sending the yuan lower…

Steven Leung, UOB Kay Hian executive director, says the data suggests more support will be needed from Beijing: “China has to announce more policies to aid the economy. Among the speculated supportive policies, markets are betting Beijing will roll out more policies to help the consumption sector given the big miss in retail sales. Those policies should be effective given Chinese citizens’ huge savings.”
Incidentally, China cuts it MLF rate by10bps earlier this evening, same as all the other secondary rate-cuts.
However, as The Wall Street Journal recently noted, the urgency to throw money at the problem could have reached its efficacy limits since after years of heavy borrowing, many in China are focused on paying down their debts this year—and the result could be weaker growth for a long time to come.
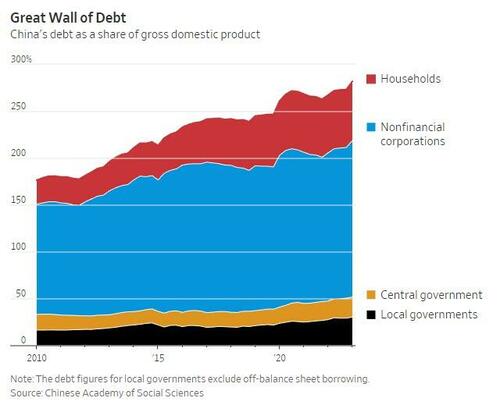
The issue isn’t the central government, whose debts are relatively low as a percentage of gross domestic product, but households, the private sector and local governments. Total debt as a share of GDP hit 295% in China last September, surpassing 257% in the U.S. and an average of 258% in the eurozone, BIS data show.
Consumers are hoarding cash, with many refusing to take out loans.
Other countries – most notably Japan – have been through similar processes, almost always painful.
As WSJ goes on to note, economists at Société Générale in a recent report said Chinese policy makers need to learn lessons from Japan and prevent a deleveraging mind-set from becoming entrenched, by restructuring more debts or offering direct income support to households to boost consumption. If not, the economists warned, China could fall into a trap in which even zero interest rates wouldn’t stimulate growth.
“Such a danger seems increasingly relevant for China,” they wrote.
The bottom line is China’s economy is struggling; Beijing knows it but the best they can do are small piece-meal stimulus measures because China (more specifically the Chinese and their corporations) are already at their limit (even greater debt loads than the US).
end
China shuns Blinken’s phone call ahead of his arrival in Beijing.
China Rebukes US In Phone Call Ahead Of Blinken’s Arrival In Beijing Sunday
WEDNESDAY, JUN 14, 2023 – 06:40 PM
A Blinken trip to China has finally been confirmed, following the latest, albeit tense, phone call between the US Secretary of State and his Chinese counterpart Qin Gang. Both sides have said Blinken will be in Beijing on Sunday and Monday. Qin told Blinken in the Wednesday call the US must stop meddling in China’s affairs.
State Dept spokesperson Matthew Miller in a new statement describing the itinerary said, “Blinken will travel to Beijing, the People’s Republic of China (PRC), and London, the United Kingdom, June 16-21.” He detailed: “While in Beijing, Secretary Blinken will meet with senior PRC officials where he will discuss the importance of maintaining open lines of communication to responsibly manage the US-PRC relationship. He will also raise bilateral issues of concern, global and regional matters, and potential cooperation on shared transnational challenges.”
In prior recent exchanges with Blinken, the Chinese FM urged US to “show respect” and stressed it must stop undermining China’s interests. Blinken, for his part, has said the US wants “to avoid miscalculation and conflict” in restoring direct dialogue with Beijing.

The more forceful new remarks from Qin (compared with the somewhat muted US readout), included a call for Washington to “stop undermining China’s sovereignty, security and development interests in the name of competition.”
Of chief importance on the minds of Beijing officials is the newly inked trade agreement between the United States and Taiwan this month which seeks to “strengthen and deepen the economic and trade relationship between.”
Chinese Foreign Ministry spokeswoman Mao Ning at the time said the deal “gravely violates” Beijing’s “one-China” policy under which it views Taiwan as a wayward province and has vowed to retake it by force, if necessary. — UPI
This newly announced weekend trip by Blinken was supposed to happen in February, but that was abruptly canceled (or perhaps just “postponed”), following the Chinese “spy balloon” shootdown incident early that month and ensuing war of words and Chinese denials of wrongdoing.
Earlier this month, Chinese Defense Minister Li Shangfu told the Shangri-La Dialogue security summit that any potential future conflict between the United States and China would bring “unbearable disaster for the world”.
But he said both rival powerful countries should be able to grow together and to avoid confrontation. His words came as the US condemned what it called unsafe and aggressive maneuvers by a Chinese PLA Navy warship in the Taiwan Strait as the American destroyer USS Chung-Hoon conducted a ‘freedom of navigation’ transit on June 3rd.
Lately, China has been ramping up its flights and naval maneuvers near Taiwan, and now somewhat routinely violates the Taiwan Strait median line. The US is at the same time sending more and more Navy warships through the strait, provoking Beijing.
end
4.EUROPEAN AFFAIRS//UK /SCANDAVIAN AFFAIRS
ECB
As expected, the ECB hikes 25 basis points. However unexpectedly it raises inflation outlook amid an EU recession
(zerohedge)
ECB Hikes Rates (As Expected), Unexpectedly Raises Inflation Outlook Amid EU Recession
THURSDAY, JUN 15, 2023 – 08:25 AM
Inflation is “projected to remain too high for too long,” the central bank said as it raised interest rates by a quarter-point, its eighth consecutive increase, but they surprised a dovish-hoping audience by increasing their inflation forecasts:
- ECB Sees 2023 Inflation at 5.4%; Prior Forecast 5.3%
- ECB Sees 2024 Inflation at 3.0%; Prior Forecast 2.9%
- ECB Sees 2025 Inflation at 2.2%; Prior Forecast 2.1%
The central bank lifted the interest rate on the main refinancing operations to 4% from 3.75%, matching the consensus estimate. The deposit facility and marginal lending facility rates were also increased to 3.5% and 4.25%, respectively – the highest since 2001.
The inflation ‘hike’ comes as hopes were rising that the trend of EU inflation was your friend (annual inflation in the euro area eased to 6.1% from 7% in April, while core inflation fell to 5.3% from 5.6%).
This is a clear signal that they will keep hiking…
“Future decisions will ensure that the key ECB interest rates will be brought to levels sufficiently restrictive to achieve a timely return of inflation to the 2% medium-term target and will be kept at those levels for as long as necessary,” the Governing Council said Thursday in a statement.
Officials also confirmed that they’ll halt reinvestments under their €3.2 trillion ($3.5 trillion) Asset Purchase Program from next month — another tightening move that was flagged at May’s policy meeting.
The kneejerk reaction in the markets is EUR strength – erasing much of yesterday’s post-Fed losses…
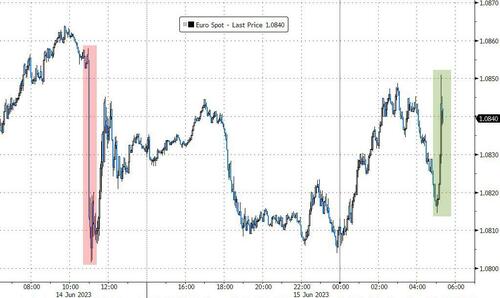
Watch ECB President Christine Lagarde explain the hawkish forecast here…
end
EU/NATURAL GAS
EU natural gas spikes again and this spells trouble to Germany and just about all businesses in Europe. The reason: Europe’s largest as field, Holland’s Groningen field is set to permantly close on orders from the Dutch government. First they order to cull their cattle and now this???
(zerohedge)
EU NatGas Spikes Again, This Time On Report Europe’s Largest Gas Field Set To Close
THURSDAY, JUN 15, 2023 – 10:25 AM
After finding a floor of around 22 euros a megawatt-hour at the start of June, European natural gas prices have jumped more than 100%. We have detailed the latest price surge in two pieces, titled “EU NatGas Soars Most In Year As Traders On Edge About ‘Possibility Of Tightening Supplies'” and “EU NatGas Jumps Again, Up 15% As Supply Fears Driven By Extended Outages In Norway.”
On Thursday morning, the month-ahead benchmark contracts skyrocketed as much as 30% to 49 euros. The multi-week rip-your-face-off rally has led to 112% gains.
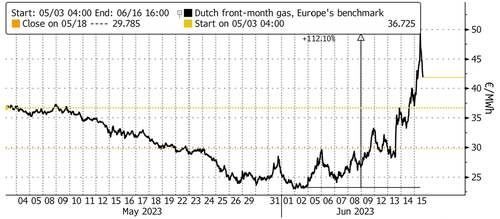
The squeeze higher is due to the prospect of tightening supplies with maintenance work continuing at major Norwegian facilities through July. There are also fears that a hot summer could drive up cooling demand, which would increase fuel use.
James Waddell, head of European gas and global LNG at consultant Energy Aspects Ltd., told Bloomberg that concerns about European LNG supplies and Norwegian outages “have been the physical triggers.” He added:
“But we have to remember that a lot of the market was short going into this month and price rises will have triggered stop- outs, thereby driving the price even higher.”
Bloomberg drove more supply fears for the continent in a note that explained the Dutch government’s plans to “permanently shut down” the Groningen gas field, Europe’s largest, in October, ahead of the winter heating season.
Even though Europe has adequate levels of NatGas storage, the price surge illustrates how fragile the market is to any threat of disruption.
In Asia, NatGas prices spiked 19% to $11.58 per million British thermal units (MMBtu), the most in six months, according to data from S&P Global Commodity.

“Asian gas prices have surged amid hot weather and supply outages in Europe, including disruptions in Norway that are expected to last through the middle of next month. That’s pushed up European prices and intensified global competition for cargoes,” Bloomberg said.
And in the US, despite high production weighing on US benchmark Henry Hub prices for months, forming a floor between the $2 – $3 MMBtu range since February, prices are moving higher to the midpoint of the range as fuel prices in Europe and Asia rise.
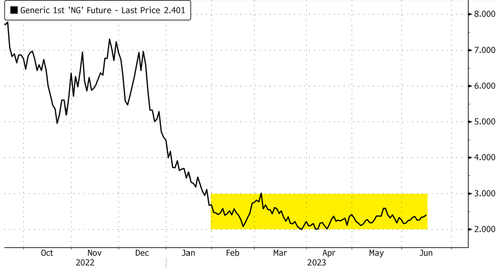
It’s still uncertain whether NatGas has reached a bottom. Though price action in recent weeks certainly looks like it.
END
5 RUSSIA//UKRAINE AND MIDDLE EASTERN AFFAIRS
UKRAINE/RUSSIA
ISRAEL/CHINA/USA
Each passing day, the USA continues to be isolated. They are trying to pressure Israel to decrease ties with China but that will fall
on deaf ears.
(zerohedge)
US Pressures Israel To Decrease Ties With China
THURSDAY, JUN 15, 2023 – 12:30 PM
Authored by Connor Freeman via The Libertarian Institute,
Washington is attempting to pressure Tel Aviv into pulling back on its ties and trade with China, according to a report in Voice of America. After the European Union and the United States, the People’s Republic is Israel’s largest trade partner.
The report discusses some developments regarding a series of joint Israeli-Chinese infrastructure projects in Israel, including a recently augmented Chinese operated shipping port in the city of Haifa. Chinese companies were also building parts of the Tel Aviv light rail system until Washington leaned on Tel Aviv to instead favor Israeli and European firms.

Hebrew University’s Yuri Pines told VOA that “China [now] has the best infrastructure in the world. China is able to export its knowledge, its know-how, its engineers, its workers, and Israel has benefited enormously.” Though, the US has pressed Israel over the relationship and Tel Aviv is reportedly curtailing some of its economic agreements with China.
Biden has escalated America’s economic war against Beijing, including by imposing harsh sanctions and attempting to cripple the Chinese semiconductor industry. At the same time, this White House has expanded the Pentagon’s vast military buildup in the Asia-Pacific, eyeing a future war between the world’s two largest economies.
Gedaliah Afterman of Reichman University says “there is growing pressure from the United States on Israel to limit its engagement with China, specifically on infrastructure and technology. And that pressure is starting to yield results.”
Beijing recently pulled off an unprecedented diplomatic feat when it brokered a normalization deal between Riyadh and Tehran. The agreement saw a full restoration of diplomatic ties between the two longtime rivals, as well as plans to expand bilateral cooperation and trade in the future.
Business between China and the Arab world is hitting all-time highs, with the total volume of trade reaching a record $430 billion last year. Saudi Arabia accounts for 25% of that massive figure, with a bilateral trade volume of $106 billion.
Over the weekend, Riyadh and Beijing signed $10 billion worth of deals spanning electric vehicles, renewable energy, agriculture, real estate, technology, metals, healthcare and tourism. Additionally, China has inked a 25-year strategic and economic partnership with Iran worth $400 billion.
According to Al Jazeera, “The [Saudi] kingdom’s officials have said more announcements can be expected, with Energy Minister Abdulaziz bin Salman Al Saud saying more energy deals would be forthcoming. He also brushed off Western criticism of growing Saudi ties with China, saying the kingdom would prioritize its business interests.”
Pines explained to Voice of America that there has been a shift in the thinking of some Israeli analysts who see China, a significant partner of Iran as well as the Palestinians, as largely benefiting the region with its actions. “It is so rare to have in the Middle East a major country which is really neutral, which It is not engaged in… it’s neither pro-Israeli, nor pro-Iranian, nor pro-Saudi, nor pro-Egyptian. It is just a neutral country interested in economic ties with all parts of this very complicated Middle East equation,” he claimed. The academic added that Beijing may be the only country in the world capable of brokering a peace deal between Israel and Iran.
China has also voiced interest in playing a positive role in facilitating talks between the Israelis and the occupied Palestinians, and has appointed a special envoy to meet with officials from both sides.
The US may be catching on that China is making gains in the Middle East as the appetite for war in the region abates. Last week, Middle East Eye reported the White House is holding secret direct talks with Iran. Negotiators are said to be working toward an interim deal which would allow Iran to partially resume oil exports and receive limited sanctions relief in exchange for not enriching uranium beyond 60% purity.
Surprisingly, according to Israel’s Channel 13, Prime Minister Benjamin Netanyahu – who has regularly threatened to attack the Islamic Republic – told the Knesset this week that Tel Aviv “could live with” this potential “mini-agreement” between Tehran and Washington.
end
ISRAEL
Israel announced the creation of a system for intercepting hypersonic missiles SkySonic
| Robert Hryniak | 1:49 PM (3 minutes ago) | ||
| to | |||
One layer will not be enough. But a step in the right direction .. also why what was hypersonic last year in Russia is now been advanced so that most current missiles are at MACH 15+ … Avanguard is a MACH20 strike weapon at the edge of space and impossible to hit.
What is used in Ukraine is already outdated missiles previously produced and from the start of this year all missiles in serial production are mach15+ and all are capable of independent flight paths to target with the ability to evade inbound defense missiles in flight.
Reality is that to strike one of the new missile systems a defensive missile would have to be faster and more nimble. And that is unlikely because the thermal heat caused by a missile would burn it but unless one has a plasma shield like Avanguard has which in turn acts to distract from any targeting.
END
6.Global Issues//COVID ISSUES/VACCINE ISSUES/
GLOBAL ISSUES//MEDICAL ISSUES
end
GLOBAL ISSUES//GENERAL
END
VACCINE/COVID ISSUES
DR PANDA:
DR PAUL ALEXANDER
Can Spike protein variants (COVID gene injection) initiate severe side effects when binding to ACE2-expressing endothelial cells in blood vessels? Yes! SEE RESEARCH SUMMARY BELOW
These soluble Spike variants may initiate severe side effects when binding to ACE2-expressing endothelial cells in blood vessels
| DR. PAUL ALEXANDERJUN 15 |

SOURCE:
https://www.researchsquare.com/article/rs-558954/v1
end
Stew Peters striking DEEP into enemy territory, DEEP, with his new video on DEPOPULATION; yes, 100 of millions of Americans lined up & demanded the vaccine that is killing them & damaging reproduction
Stopping human reproduction to achive DEPOPULATION? STERILIZATION? cogent strong argument can be made when you look at research of Dr. James Thorp, read work of Dr. Naomi Wolf etc.
| DR. PAUL ALEXANDERJUN 15 |

SOURCE:
Is the COVID mRNA technology vaccine really a means of sterilization? Who knew of this component? When?
Can the inventors of mRNA technology speak to this? Seissman? Kariko? Who?
end
“Are There Tapes That You Accepted Bribes, President Biden?” – Biden Stunned After Reporter Ambushes Him with Question on Ukraine Bribery Scheme (VIDEO); apparently there are tapes & this is why ’45’
was indicted; the indicting of Trump was to misdirect you on Biden’s 5 $ million (& Hunter’s) bribery, this is where the smart strong money is riding; what do you think? I am trying to figure out
| DR. PAUL ALEXANDERJUN 15 |
The pusillanimous weakling republican lead congress sat back as they impeached Trump twice, for nothing, saying ‘we dont hold the house’ yet now they do and Biden et al. face no impeachment. Do you understand what we mean by UNIparty and that they are all the same? Same dirty underwear, all we do is exchange seats at elections, re-arrange the bandits, but they keep the same dirty underwear, they remain same…IMO high crime bandits, most of them.

Washington reporters have been given the green light to go after Joe Biden.
Joe Biden on Tuesday afternoon walked by a group of reporters after delivering remarks at the Chiefs of Mission reception in the East Room.
A reporter ambushed Joe Biden and asked him about the Ukraine bribery scheme alleging he received a $5 million bribe from Mykola Zlochevsky, the Ukrainian oligarch who runs Burisma Holdings.
end
END
SLAY NEWS
| The latest reports from Slay News |
| WEF Pushes Plan for Humanity to Be ‘Dominated’ by ‘Emotionless’ AIOne of the highest-ranking officials in the World Economic Forum (WEF) has laid out the globalist organization’s vision for humanity to be “dominated” by artificial intelligence (AI).READ MORE |
| ‘Dead’ Woman Bangs on Coffin During Her Own Wake, Gets Rescued by Shocked SonA 76-year-old woman, who was declared dead at a hospital in Ecuador, banged on her coffin during her own wake and was rescued by her son and other mourners.READ MORE |
| Starbucks Ordered to Pay $25M to Manager Fired for Being WhiteA U.S. District Court jury in Camden, New Jersey, awarded $25.6 million to a former Starbucks manager who claimed the company fired her for being white.READ MORE |
| Elon Musk Rebukes Biden for Anti-Family Comments: ‘They Are Not Your Kids – You Are the Government’Twitter boss Elon Musk has rebuked Joe Biden after the Democrat president’s administration made the astounding communist-style anti-family claim that “LGBTQI+” children are “all our kids.” READ MORE |
| Tucker Carlson Tells Fox News To Pound Sand, Ignores Cease And Desist Letter And Drops New Episode About Trump IndictmentTucker Carlson told Fox News to pound sand and ignored the network’s cease-and-desist letter and released a new episode of his new Twitter show.READ MORE |
| Ted Cruz Grills Top FBI Official over Biden Bribery Scheme AllegationsRepublican Sen. Tex Cruz (R-TX) grilled FBI Deputy Director Paul Abbate during a Senate Judiciary Committee hearing on Tuesday.READ MORE |
| Burisma Founder, Who Allegedly Bribed Joe and Hunter Biden, Is Russian Intelligence AssetThe Ukrainian oligarch who allegedly bribed Joe and Hunter Biden with millions of dollars is reportedly an asset of Russia’s intelligence agency.READ MORE |
| Trump Drops Hammer: ‘Biden Will Be Remembered as the Most Corrupt President in the History of Our Country’President Donald Trump has taken off the kid gloves and given a blistering response to his indictment by Special Counsel Jack Smith.READ MORE |
| Elon Musk Challenges George Soros’ ‘Emperor’ Son Alex to Twitter Space DebateElon Musk has challenged the new “emperor” of George Soros’s multibillion-dollar empire, his son and heir Alex, to a public debate on Twitter.READ MORE |
| Fauci Doomed as U.S Government Sources Reveal First Covid Patients Were Wuhan Lab ScientistsDr. Anthony Fauci appears to be doomed after a new report confirmed that the very first COVID-19 patients were scientists working in the lab at China’s Wuhan Institute of Virology.READ MORE |
| Tucker Carlson Explains Real Reason Behind Trump Indictment in New Episode of Twitter ShowTucker Carlson has broken his silence on the politically motivated indictment of President Donald Trump.READ MORE |
| JD Vance Checkmates Merrick Garland over Trump Indictment: ‘We Will Grind His Department to a Halt’Republican Sen. JD Vance (R-OH) has reached his limit with Democrat President Joe Biden and Attorney General Merrick Garland for weaponizing the taxpayer-funded Justice Department against their political enemies.READ MORE |
| Jill Biden Gives Up Game: ‘It’s Shocking’ the Indictment Has Not Caused Republican Voters to Dump TrumpFirst Lady Jill Biden gave up the game when speaking to Democrat donors at a fundraiser in New York City on Monday night.READ MORE |
EVOL NEWS
VACCINE IMPACT//
Young Mother Sues Corrupt Baltimore County Social Services Who Kidnapped Her Daughter, but She Needs Your HelpJune 14, 2023 6:02 pm Last month we introduced our readers to Jennifer Guskin who was sexually trafficked as a child, suffering evils more horrible than anything else we had ever published before, with a video I put together of Jennifer sharing her story. When Jennifer first went public about her life and the horrors she suffered as a child back in 2018, the Baltimore County Department of Social Services Child Advocacy Center, working together with Howard County General Hospital, took custody of her newborn daughter on false charges of drug abuse. After an investigation cleared her of any drug abuse, they allegedly continued to hold her baby and stipulated that to get her baby back she had to “stop talking on Social Media.” Today, her daughter is 5 years old and back in their life, but Jennifer is trying to fight back and expose this corrupt business of child trafficking that is done under the color of law and referred to as “Foster Care” and “Adoption”, but is mainly a system that rakes in $billions annually to traffick children, something we have been exposing for almost a decade now through our MedicalKidnap.com website with hundreds of stories. When Jennifer states that “I am not the first” in reference to the child welfare system’s attempts to blackmail her by forcing her to take her story down off of the Internet as a requirement to get her child back, she is telling the truth, because we have been documenting many cases where this has happened for years now. The evil child welfare system does not want their crimes exposed to the public, as it is a very lucrative child trafficking business that employs hundreds of thousands of people nationwide, from social workers to attorneys to judges and many others who earn their living from this corrupt system. I myself and Health Impact News have been threatened more times than I can count, by judges, lawyers, district attorneys and others demanding that we take down certain stories that expose their corruption. This evil MUST be exposed, and I greatly admire the strength and the courage of this young mother, who herself has suffered so much, to take on this battle to fight for the abused and trafficked children suffering through government taxpayer programs that keep this system operating. But she can’t do it alone. She needs a nation of warriors committed to the truth who will not back down from evil, to expose this depth of corruption and start the process of holding them accountable.Read More…U.S. Government Bypassing 4th Amendment by Buying Your Personal Information from “Data Brokers”June 14, 2023 7:41 pm Last month we introduced our readers to Jennifer Guskin who was sexually trafficked as a child, suffering evils more horrible than anything else we had ever published before, with a video I put together of Jennifer sharing her story. When Jennifer first went public about her life and the horrors she suffered as a child back in 2018, the Baltimore County Department of Social Services Child Advocacy Center, working together with Howard County General Hospital, took custody of her newborn daughter on false charges of drug abuse. After an investigation cleared her of any drug abuse, they allegedly continued to hold her baby and stipulated that to get her baby back she had to “stop talking on Social Media.” Today, her daughter is 5 years old and back in their life, but Jennifer is trying to fight back and expose this corrupt business of child trafficking that is done under the color of law and referred to as “Foster Care” and “Adoption”, but is mainly a system that rakes in $billions annually to traffick children, something we have been exposing for almost a decade now through our MedicalKidnap.com website with hundreds of stories. When Jennifer states that “I am not the first” in reference to the child welfare system’s attempts to blackmail her by forcing her to take her story down off of the Internet as a requirement to get her child back, she is telling the truth, because we have been documenting many cases where this has happened for years now. The evil child welfare system does not want their crimes exposed to the public, as it is a very lucrative child trafficking business that employs hundreds of thousands of people nationwide, from social workers to attorneys to judges and many others who earn their living from this corrupt system. I myself and Health Impact News have been threatened more times than I can count, by judges, lawyers, district attorneys and others demanding that we take down certain stories that expose their corruption. This evil MUST be exposed, and I greatly admire the strength and the courage of this young mother, who herself has suffered so much, to take on this battle to fight for the abused and trafficked children suffering through government taxpayer programs that keep this system operating. But she can’t do it alone. She needs a nation of warriors committed to the truth who will not back down from evil, to expose this depth of corruption and start the process of holding them accountable.Read More…U.S. Government Bypassing 4th Amendment by Buying Your Personal Information from “Data Brokers”June 14, 2023 7:41 pm The US has been buying “large” amounts of commercially available data on internet users for the purposes of spying, according to a new government report. The Office of the Director of National Intelligence (ODNI) on Friday declassified(Opens in a new window) a report from January 2022 that outlines the US government’s approach to using Commercially Available Information (CAI), which can come from data brokers working in the internet ad and analytics industries. The purchased information includes details from users’ smartphones and social media accounts. Although the data is usually stripped of personal details, the report notes: “It is often possible (using other CAI) to deanonymize and identify individuals, including US persons.” The agencies buying the information include the FBI, the Department of Defense, the Defense Intelligence Agency, along with a redacted government group, which might be the CIA(Opens in a new window). But the report also concedes the same government purchases risk harming US citizens since the acquired data could be exploited to find out someone’s personal details, including their sex life. The declassification of the report prompted Sen. Wyden to call on the US government to rein in the “unchecked” surveillance. “According to this report, the ODNI does not even know which federal intelligence agencies are buying Americans’ personal data,” he said in a statement(Opens in a new window). “If the government can buy its way around Fourth Amendment due-process, there will be few meaningful limits on government surveillance.”Read More… The US has been buying “large” amounts of commercially available data on internet users for the purposes of spying, according to a new government report. The Office of the Director of National Intelligence (ODNI) on Friday declassified(Opens in a new window) a report from January 2022 that outlines the US government’s approach to using Commercially Available Information (CAI), which can come from data brokers working in the internet ad and analytics industries. The purchased information includes details from users’ smartphones and social media accounts. Although the data is usually stripped of personal details, the report notes: “It is often possible (using other CAI) to deanonymize and identify individuals, including US persons.” The agencies buying the information include the FBI, the Department of Defense, the Defense Intelligence Agency, along with a redacted government group, which might be the CIA(Opens in a new window). But the report also concedes the same government purchases risk harming US citizens since the acquired data could be exploited to find out someone’s personal details, including their sex life. The declassification of the report prompted Sen. Wyden to call on the US government to rein in the “unchecked” surveillance. “According to this report, the ODNI does not even know which federal intelligence agencies are buying Americans’ personal data,” he said in a statement(Opens in a new window). “If the government can buy its way around Fourth Amendment due-process, there will be few meaningful limits on government surveillance.”Read More… |
end
MICHAEL EVERY
7//OIL ISSUES//NATURAL GAS ISSUES/USA AND GLOBE
Global demand for oil is just not there and thus the reason for its fall
(Irina Slav/OilPrice.com)
Traders Aren’t Buying The Oil Deficit Story
THURSDAY, JUN 15, 2023 – 05:45 AM
By Irina Slav of Oilprice
Traders are not buying the oil deficit story.
That’s the conclusion that forces itself based on the latest oil and fuel buying and selling developments ahead of the latest OPEC+ meeting.

The price movements that followed that meeting were proof that this attitude was correct.
The initial price jump that every production cut announcement from OPEC+ causes fizzled out less than a day after the announcement.

Over the past six weeks, institutional traders have reduced their positions in crude oil and fuels by 238 million barrels, Reuters’ John Kemp reported earlier this week, which was one of the lowest weekly positions in those contracts since 2013.
These six weeks were marked by some strongly bearish developments reinforcing the sentiment, such as weaker than expected Chinese economic index readings and the U.S. debt ceiling negotiations.
It appears that traders have focused entirely on those economic index readings instead of the fact that Chinese crude oil demand hit a record in April despite refineries shutting down for seasonal maintenance.
They also did not really acknowledge U.S. legislators’ success in passing the debt ceiling bill that averted a federal debt default, even though the uncertainty surrounding the issue was a major driver for bullish behavior on the oil market.
Perhaps this has something to do with news about a recession in the U.S. manufacturing and freight transport sectors, which has hurt oil consumption in these industries. It seems that institutional oil traders have been focusing almost exclusively on consumption lately.
If analysts, who almost invariably predict much higher oil prices for the second half of the year, are right, this could boomerang. But if traders’ fears of a recession materialize, oil prices will be going nowhere near $100. In fact, prices might even fall further.
This would be good news for the White House: it has set a range of $67 to $72 per barrel to refill the strategic petroleum reserve.
The twist is that the moment the Department of Energy starts buying oil for the SPR, prices will jump.
It will not be good news for OPEC, however. The cartel cannot keep cutting deeper and deeper – at some point, this will start playing to the advantage of U.S. shale. In fact, according to some, it already is, with analysts predicting higher U.S. exports as Saudi Arabia trims production by another 1 million bpd.
Meanwhile, Germany has officially fallen into recession, which has likely reinforced expectations of a faster slowdown elsewhere as well, which has dampened appetite for oil, inelastic or not. And since the non-news of the German recession broke after months of upbeat messaging that the worst was over and the EU’s largest economy was in fact, recovering, hedge funds and other institutional traders have every reason to play it safe.
The U.S. is not out of the woods yet, either.
Per Reuters’ Kemp, “Only the residual strength of service sector spending has so far prevented the “industrial recession” becoming a whole-economy recession.”
That wouldn’t be a good sign for oil demand in the world’s largest consumer, and oil traders appear to be acting in anticipation of that recession.
Importantly, they are acting in this way regardless of OPEC+ actions aimed at curbing supply in a way that should return the market to balance.
end
8. EMERGING MARKETS//AUSTRALIA NEW ZEALAND ISSUES
END
YOUR EARLY CURRENCY/GOLD AND SILVER PRICING/ASIAN CLOSING MARKETS AND EUROPEAN BOURSE OPENING AND CLOSING/ INTEREST RATE SETTINGS THURSDAY MORNING 7;30AM//OPENING AND CLOSINGS
EURO VS USA DOLLAR:1.0829 DOWN 0.0013
USA/ YEN 141.22 UP 1.263 NOW TARGETS INTEREST RATE AT .50% AS IT WILL BUY UNLIMITED BONDS TO GETS TO THAT LEVEL…//YEN STILL FALLS//
GBP/USA 1.2663 DOWN 0.0007
USA/CAN DOLLAR: 1.3331 UP .0004 (CDN DOLLAR DOWN 4 BASIS PTS)
Last night Shanghai COMPOSITE CLOSED UP 23.99 PTS OR 0.74%
Hang Seng CLOSED UP 420.50 PTS OR 2.17%
AUSTRALIA CLOSED UP 0.22% // EUROPEAN BOURSE: ALL MIXED
Trading from Europe and ASIA
I) EUROPEAN BOURSES ALL MIXED
2/ CHINESE BOURSES / :Hang SENG CLOSED UP 420.50 PTS OR 2.17%
/SHANGHAI CLOSED UP 23.99 PTS OR 0.74%
AUSTRALIA BOURSE CLOSED UP 0.22%
(Nikkei (Japan) CLOSED DOWN 16.93 PTS OR 0.05%
INDIA’S SENSEX IN THE RED
Gold very early morning trading: 1929.30
silver:$23.35
USA dollar index early THURSDAY morning: 102.78 UP 26 BASIS POINTS FROM WEDNESDAY’s close.
THURSDAY MORNING NUMBERS ENDS
xxxxxxxxxxxxxxxxxxxxxxxxxxxxxxxxxxxxxxxxxxxxxxxxxxxxxxxxxxxxxxxxxxxxxxxxxxxxxxxxxxxxxxxxxxxxxxxxxxxxxxxxxxxxxx
And now your closing THURSDAY NUMBERS 11: 30 AM
Portuguese 10 year bond yield: 3.149% UP 3 in basis point(s) yield
JAPANESE BOND YIELD: +0.425 % DOWN 0 AND 1//100 BASIS POINTS /JAPAN losing control of its yield curve/
SPANISH 10 YR BOND YIELD: 3.440 UP 4 in basis points yield
ITALIAN 10 YR BOND YIELD 4.128UP 4 points in basis points yield ./ THE ECB IS QE’ ING ITALIAN BONDS (BUYING ITALIAN BONDS/SELLING GERMAN BUNDS)
GERMAN 10 YR BOND YIELD: 2.5000 UP 6 BASIS PTS
END
IMPORTANT CURRENCY CLOSES FOR THURSDAY
Closing currency crosses for day /USA DOLLAR INDEX/USA 10 YR BOND YIELD/1:00 PM
Euro/USA 1.0927 UP 0.0083 or 83 basis points
USA/Japan: 140.52 UP .551 OR YEN UP 81 basis points/
Great Britain/USA 1.2757 UP 0.0087 OR 87 BASIS POINTS //
Canadian dollar UP .0093 OR 93 BASIS pts to 1.3234
xxxxxxxxxxxxxxxxxxxxxxxxxxxxxxxxxxxxxxxxxxxxxxxxxxxxxxxxxxxxxxxxxxxxxxxxxxxxxxxx
The USA/Yuan, CNY: closed ON SHORE (CLOSED UP (7.1339)
THE USA/YUAN OFFSHORE: (YUAN CLOSED (UP)…. (7.1342)
TURKISH LIRA: 23.66 EXTREMELY DANGEROUS LEVEL/DEATH WATCH/HYPERINFLATION TO BEGIN.//ON DEATH WATCH
the 10 yr Japanese bond yield at +0.425…VERY DANGEROUS
Your closing 10 yr US bond yield DOWN 5 in basis points from WEDNESDAY at 3.745% //trading well ABOVE the resistance level of 2.27-2.32%) very problematic
USA 30 yr bond yield 3.839 DOWN 4 in basis points ON THE DAY/12.00 PM
Your 12:00 AM bourses for Europe and the Dow along with the USA dollar index closing and interest rates WEDNESDAY: 12:00 PM
London: CLOSED UP 25.52 points or 0.34%
German Dax : CLOSED DOWN 20.67 PTS OR 0.13%
Paris CAC CLOSED DOWN 37.62 PTS OR 0.51%
Spain IBEX DOWN 2.00 PTS OR 0.02%
Italian MIB: CLOSED DOWN 77.31 PTS OR 0.28%
WTI Oil price 69.99 12: EST
Brent Oil: 74.79 12:00 EST
USA /RUSSIAN /// AT: 83.73 ROUBLE UP 0 AND 44//100 RUBLES/DOLLAR
GERMAN 10 YR BOND YIELD; +2.5000 UP 6 BASIS PTS
UK 10 YR YIELD: 4.4365 UP 4 BASIS PTS
CLOSING NUMBERS: 4 PM
Euro vs USA: 1.0948 UP 0.01050 OR 105 BASIS POINTS
British Pound: 1.2781 UP .01108 or 110 basis pts
BRITISH 10 YR GILT BOND YIELD: 4.4115% UP 3 BASIS PTS//RISING FAST
USA dollar vs Japanese Yen: 140.27 UP .305 //YEN DOWN 31 BASIS PTS//
USA dollar vs Canadian dollar: 1.3215 DOWN .0112 CDN dollar, UP 112 basis pts)
West Texas intermediate oil: 70.62
Brent OIL: 75.61
USA 10 yr bond yield DOWN 9 BASIS pts to 3.713%
USA 30 yr bond yield DOWN 6 BASIS PTS to 3.826%
USA 2 YR BOND: DOWN 8 PTS AT 4.62000%
USA dollar index: 101.73 DOWN 80 BASIS POINTS
USA DOLLAR VS TURKISH LIRA: 23.65 (GETTING QUITE CLOSE TO BLOWING UP/
USA DOLLAR VS RUSSIA//// ROUBLE: 83.75 UP 0 AND 42/100 roubles
DOW JONES INDUSTRIAL AVERAGE: UP 428.73 PTS OR 1.26%
NASDAQ 100 UP 179.78 PTS OR 1.20%
VOLATILITY INDEX: 14.33 UP 0.45 PTS (3.24)%
GLD: $181.91 UP 1.27 OR 0.70%
SLV/ $21.94 DOWN .03 OR 0.03%
end
USA AFFAIRS
TODAY’S TRADING IN GRAPH FORM
Bonds, Stocks, & Bullion Bounce As Market Calls Powell’s ‘Hawkish’ Bluff
THURSDAY, JUN 15, 2023 – 04:01 PM
Overnight ugliness in China data spurred yuan weakness (pushing CNH to its weakest vs the dollar since Nov ’22), but the dollar’s weakness today (post-ECB) smashed yuan higher (its biggest jump since March) despite all those hopes of stimmies…
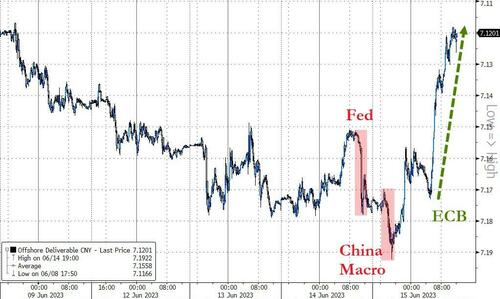
Source: Bloomberg
The ECB’s Christine Lagarde was not f**king around with nuance this morning as she hiked rates (as expected) and made it clear they will hike more – traders did not doubt her and the euro soared relative to the dollar (biggest EUR rally since early Feb)…

Source: Bloomberg
However, in US markets, traders pushed back against Powell’s apparently hawkish bluster, sending rate-change expectations dovishly lower (though still above pre-FOMC levels)…
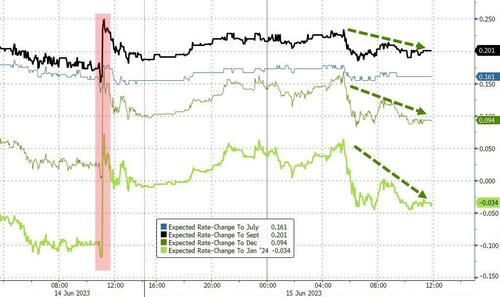
Source: Bloomberg
‘Hot‘ retail sales numbers diverged from ‘Cold‘ jobless claims data and ugly industrial production opposed a beautiful resurgence in Empire Fed’s Manufacturing survey – so take your pick of what narrative (soft, no, hard landing).
As far as stocks are concerned – it’s the ‘never landing ever’ route as everything roared higher with Nasdaq leading the way. Nasdaq was up 2% from pre-FOMC at its highs today and Small Caps ramped back into the green since FOMC…
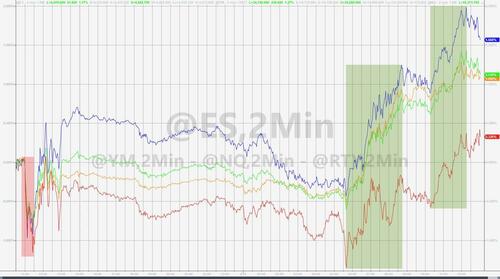
Nasdaq has now reversed almost all of its underperformance relative to Small Caps from last week…
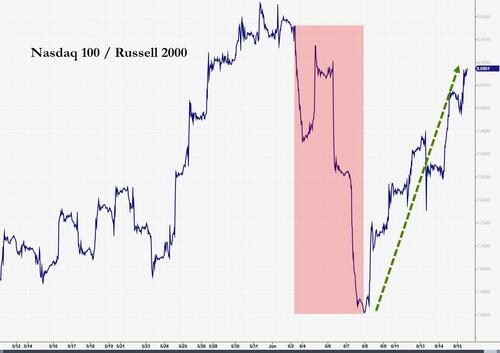
Another day, another short-squeeze…
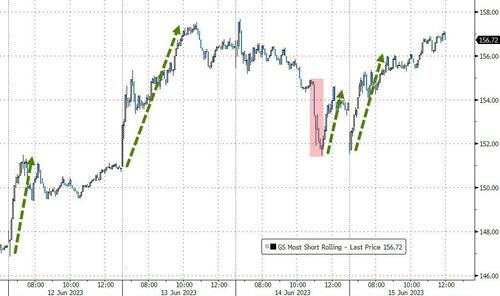
Source: Bloomberg
Ahead of tomorrow’s quad-witch, options-land was chaotic with 0-DTE traders pushing back hard against the opening ramp in stocks only to reverse it all, gamma-squeezing stocks to the day’s highs…
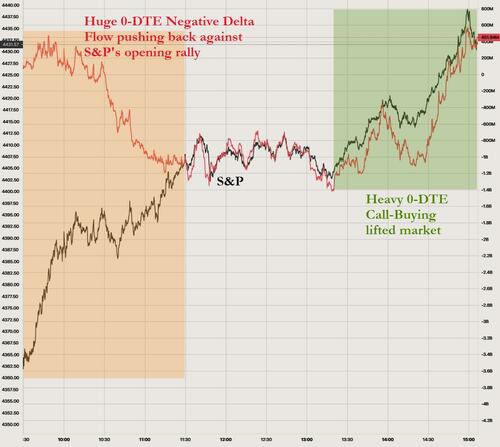
Here’s today’s winning lottery ticket (with over 350,000 contracts traded)…
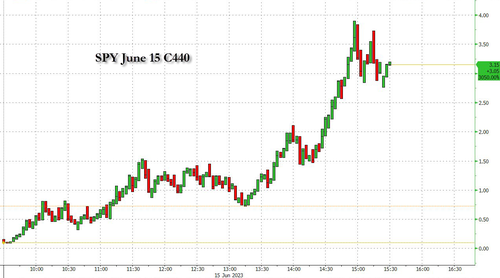
Source: Bloomberg
Do Not Panic!! NVDA closed red!

Treasuries were aggressively bid today with the belly outperforming, erasing all the post-FOMC move with the short-end underperforming overall for the last two days (though all yields are lower from Tuesday’s close)…
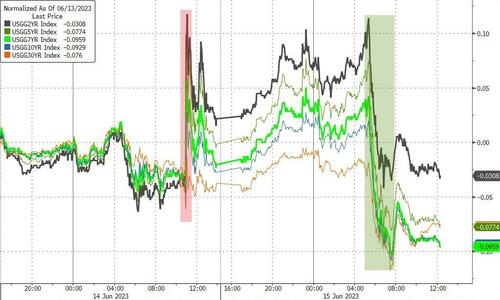
Source: Bloomberg
The dollar – mirroring the surge in the euro – plunged by the most since early Feb today, back to 6-week lows…
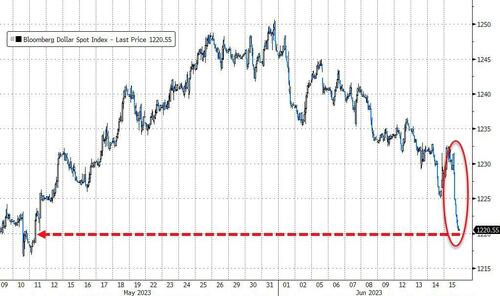
Source: Bloomberg
Bitcoin bounced back modestly from last night’s bloodbath (that dump occurred right around the cash equity close, not at the FOMC)…
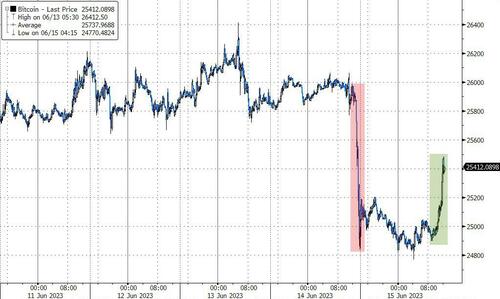
Source: Bloomberg
Gold rallied (helped by the weak dollar), erasing yesterday’s post-FOMC plunge…
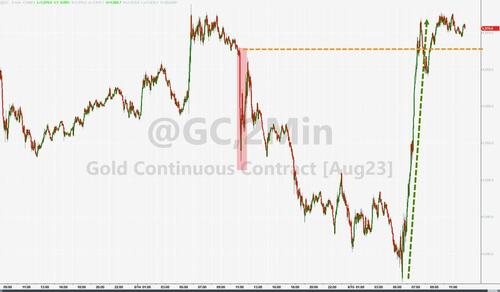
Oil prices rallied today, reversing yesterday’s losses with WTI back above $71…

Finally, was today’s pump and dump in NVDA the top?
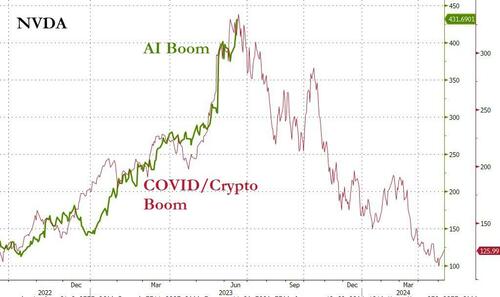
Source: Bloomberg
And, with quad-witching tomorrow, we thought this little chart from Nomura’s Charlie McElligott was worth noting…

Point-being, McElligott explains, despite a local Vol suppressing outcome from the Fed yesterday, a “higher for longer” message only increases the attractiveness of “left tail” hard-landing trades in both -SOFR and -VIX Call Spreads in coming months.
Translation: this is as good as it gets – brace!
b) THIS AFTERNOON TRADING/
end
END
i c Morning/
end
II) USA DATA/
Retail Sales Unexpectedly Surge In May Led By Autos and Building Materials
THURSDAY, JUN 15, 2023 – 08:39 AM
While consensus expectations for retail sales data this morning were expected to contract (headline) or grow very modestly (core); BofA’s seemingly omnipotent analysts warned that numbers could be considerably hotter than expected – perhaps due to the recent near-record surge in credit card debt, or maybe it’s just because stocks have caught a bid rising and Americans are looking at their rising 401k balances and feeling wealthier.
BofA was – once again – correct as Retail sales data smashed expectations across the board. Headline retail sales rose 0.3% MoM (-0.2% exp) while core (ex-Autos and Gas) rose 0.4% MoM (vs +0.2% MoM)…
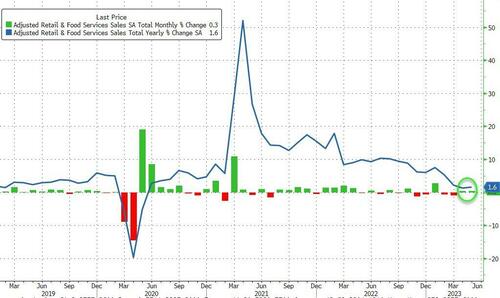
Source: Bloomberg
Under the hood, Gasoline stations and Miscellaneous Store Retailers saw sales slow as Building Materials and Motor Vehicle sales soared…
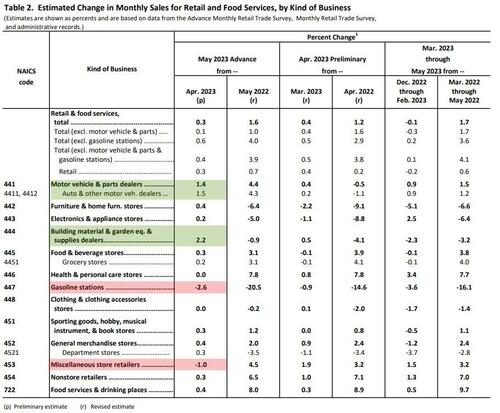
On YoY basis, both headline and core retail sales growth
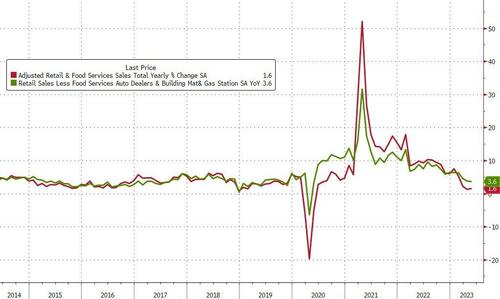
Source: Bloomberg
The control group – which is used in the GDP calculation – rose 0.2% MoM as expected (a slowdown from April’s +0.6% MoM move, but still rising.
The death of the consumer (and his credit card) are greatly exaggerated.
end
Initial claims at its highest since Oct 2021
(zerohedge)
Initial Claims At Highest Since Oct 2021 As Texas Jobless Count Soars
THURSDAY, JUN 15, 2023 – 08:45 AM
After the prior week’s surprise surge in initial jobless claims (to the highest since Oct 2021), last week was expected to see a modest slowdown from 261k to 245k. However, things remain troublesome with 262k Americans filing for unemployment benefits for the first time last week (the same as an upwardly revised 262k the week before)…
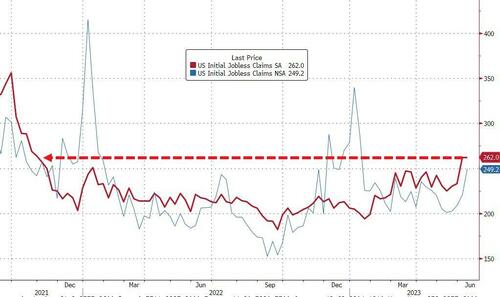
Source: Bloomberg
Texas was the major outlier for the rise in jobless claims
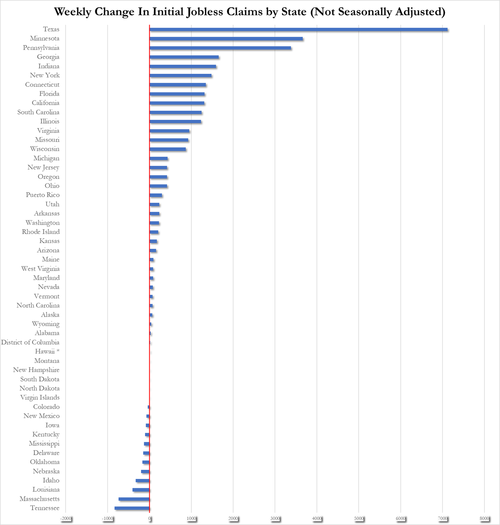
But with initial claims hovering at their highest since October 2021, continuing claims is refusing to follow trend, rising only modestly from 1.755mm to 1.775mm…
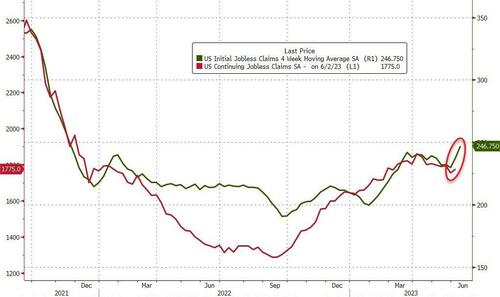
Source: Bloomberg
But is it about to turn up?
end
New York Empire State, Philadelphia Fed factory indexes mixed but show signs of optimism
June 15, 2023 at 8:40 a.m. ET
MarketWatch
New York Empire state indicator surges while Philadelphia manufacturing weakens slightly
The numbers: Two U.S. regional gauges of manufacturing sentiment showed signs in June that they may be improving after a rough patch, according to data released Thursday.
The Philadelphia Federal Reserve’s manufacturing index slipped further to a reading of negative 13.7 in June from negative 10.4 in the prior month, but economists had expected a reading of negative 14.8, according to a Wall Street Journal survey of economists. This is the tenth straight negative reading.
The New York Federal Reserve’s Empire State Index, meanwhile, jumped to a reading of 6.6 in June from negative 31.8 in the prior month, the New York Fed said. Economists had expected a reading of negative 16, according to the Wall Street Journal. The index had in negative territory for five of the past six months.
Any reading below zero indicates deteriorating conditions.
Key details: In key subcomponents in the Philadelphia survey, new orders fell to negative 11 in June from negative 8.9 in the previous month. On the positive side, shipments in Philadelphia rose to 9.9 from negative 4.7 in May. In addition, the index of future activity jumped to 12.7 in June from negative 10.3 in the prior month.
New orders in the New York region rebounded 31.1 points to 3.1 in June. Shipments jumped 38.4 points to 22 in the region. The index for future business conditions increased 9.1 points to 18.9. suggesting firms have become more optimistic.
Big picture: U.S. manufacturing has been struggling in recent months even though the impact on supply chains from the pandemic has eased.
Economists use the regional data to get early read on the national U.S. ISM factory index.
In May, the ISM dipped to 46.9%, signaling contraction in the manufacturing sector for the seventh consecutive month. The June data will be released in two weeks.
What are they saying? ” The big picture in manufacturing appears to be that the deterioration is over, but the sector remains in recession,” said Ian Shepherdson, chief economist at Pantheon Macroeconomics.
-END-
U.S. industrial output falls 0.2% in May after two straight gains
June 15, 2023 at 9:30 a.m. ET
MarketWatch
Index for manufacturing ticked up 0.1%
The numbers: U.S. industrial production fell 0.2% in May after two straight months of gains, the Federal Reserve reported Thursday.
The decline was below expectations of a flat reading, according to a survey of economists by The Wall Street Journal.
Capacity utilization slipped to 79.6 in May from 79.8 in the prior month.
The capacity utilization rate reflects the limits to operating the nation’s factories, mines and utilities.
The drop in capacity utilization was in-line with forecasts.
Key details: Manufacturing rose 0.1% in May after a sharp 0.9% gain in the prior month.
Motor vehicles and parts output, which has been a strong contributor to production, rose 0.2% after a 9.8% jump in the prior month. Excluding autos, total industrial output fell 0.2%.
Utilities output fell 1.8% in May. Mining output, which includes oil and natural gas, fell 0.4% after a 0.3% gain in the prior month.
Big picture: Manufacturing has been struggling with weak demand and higher interest rates. The sector is 0.3% below its year-earlier levels.
Outside of transportation there is little support for the manufacturing sector, said Richard Moody, chief economist at Regions Financial Corp.
III) USA ECONOMIC STORIES
Even though new truck sales are robust..due to a backlog on orders, we are still experiencing a trucking bloodbath
(Freightwaves//Fuller)
New Truck Sales Are Robust – But There’s Still A Trucking Bloodbath
WEDNESDAY, JUN 14, 2023 – 07:00 PM
By Craig Fuller, CEO of FreightWaves
In the past week, several Twitter users have pointed to government data on retail sales of heavy-duty trucks as one reason why a recession is far off.

Two examples:
The context of their posts is that because of robust truck orders, the freight market must also be robust. And since the freight market is robust, they believe, it means that the U.S. economy is also robust. They have good reason for believing this. After all, new truck orders are at very high levels and, in a normal cycle, there is a correlation between robust truck orders and freight demand.
However, FreightWaves readers likely know better. The freight market is not robust. In fact, it is one of the most difficult freight markets in recent years, with comparisons to the 2009 economy among some fleet executives.
The Twitter posters can be forgiven.
They are likely just pulling random data charts and drawing their conclusions with little to no freight industry experience and little context.
But why are new truck orders robust?
COVID screwed up the heavy-duty production cycle
There is a backlog of heavy-duty truck orders. Therefore, the data is not telling us what some think it does.
In a normal economy, the health of the freight market is correlated with new truck order data. Not this time. The collapse in the freight market is well-documented from a range of sources, including leading industry surveys and bank reports on nationwide freight expenditure.
New truck orders are continuing at robust levels, while the freight market collapses. This shouldn’t happen, so why is this cycle different?
Mid-sized and large fleets — 100 trucks or more — buy their trucks at regular intervals, regardless of the economy. In fact, some increase purchases during recessions — thanks to incentives from original equipment manufacturers and easy access to drivers.
Forty-two percent of the trucks on the road are held by fleets with more than 100 trucks.
From 2020-2022, mid-sized and large fleets were not able to get new truck allotments due to supply chain shortages and a strong retail truck market.
The mid-size and large fleets also held on to trucks longer than usual — two years longer than normal. Some fleets delayed orders in 2020 because of the unprecedented uncertainty and then continued to hold off in 2021 because of the inability to find truck drivers to “seat their trucks.”
Now, truck drivers are much easier to find, uncertainty about an “apocalypse” is long forgotten and those trucks they held onto for two extra years are worn out.
The largest fleets also know that with the availability of truck drivers (so long “shortage”), they will be able to grow market share. So what is occurring in truck order data is not related to robust freight demand, but rather a bulking of orders from the COVID economy among mid-sized and large fleets.
The OEMs are aware that the freight market is in recession. This is why they aren’t ramping up production to burn off the backlog. OEMs will keep production at current levels, hoping to time the cycle just in time for a rebound.
It is possible that the truck OEMs will miss the recession this time around.
END
New York
The doomsday scenario for NY office space. In two years there will be a revenue shortfall of 322.7 million dollars. It will take many years to recover
(zerohedge)
CRE “Doomsday” Event In Office Spaces Won’t Crush NYC Revenues, Comptroller Reports
THURSDAY, JUN 15, 2023 – 06:30 AM
New York City’s office space utilization remains depressed, primarily due to the accelerated transition to remote or hybrid work for many office jobs. Given the significant influence that commercial real estate and the office market play on NYC’s economy and tax base, the city’s Comptroller, Brad Lander, has published a new “doomsday” scenario showing the potential effects of a CRE downturn impacting the city’s revenue through the end of the decade.
Under Lander’s most pessimistic scenario, there would be a 40% plunge in office space property from 2023 to 2029. This could cause a revenue shortfall for the city of around $322.7 million in the fiscal year 2025, increasing to $1.2 billion in 2027. This only makes up 3% of the property tax level and only 1.3% of all city tax revenues.
Real estate taxes is one of the most significant contributors to the city’s coffers, providing about 30% of its $109 billion budget revenue. Offices account for 20% of the property tax revenue and 10% of the overall revenue. The current CRE downturn is gaining momentum as “record high” vacancy rates surpass levels during the 2001 and 2008 recessions.
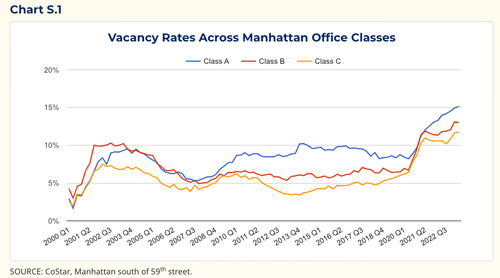
A CRE downturn in the early 1990s took years for recovery to manifest. If history is about to repeat itself, the office space market could be in a multi-year downturn.
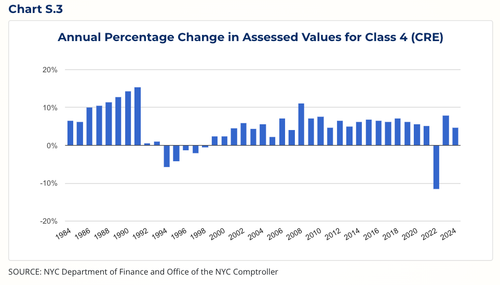
Based on the report, Lander assumes the office market values would slide 6% annually from fiscal 2025 through fiscal 2027, with additional declines until 2031.
A depressed office space market with high vacancy rates will impact the local economy, such as restaurants, bars, nail salons, theaters, etc., that rely on office workers to spend money. “Going forward, though, a major and growing concern is its effect on tax revenues and thus the City’s fiscal situation,” Lander said.
However, Lander warned, “Downward pressure on office building valuations could also adversely affect lenders if a significant number of property owners were to default on their loans or mortgages.”
We already see this playing out in San Fransico, as hotels and malls have had loans defaulted on by property owners in the last few weeks.
While even in the most pessimistic scenario, a CRE downturn won’t tank NYC’s revenue, its effects on the local economy would stymie any economic recovery for years.
END
USA// COVID
As we have outlined to you: many excess deaths in all developed countries due to the use of the vaccine. The USA is worse compared to other countries
(Heyvekube.the Conversation.com)
Annual US Excess Deaths Relative To Other Developed Countries Are Growing At An Alarming Rate
WEDNESDAY, JUN 14, 2023 – 10:20 PM
Authored by Patrick Heuveline via TheConversation.com,
The big idea
People in the U.S. are dying at higher rates than in other similar high-income countries, and that difference is only growing. That’s the key finding of a new study that I published in the journal PLOS One.

In 2021, more than 892,000 of the 3,456,000 deaths the U.S. experienced, or about 1 in 4, were “excess deaths.” In 2019, that number was 483,000 deaths, or nearly 1 in 6. That represents an 84.9% increase in excess deaths in the U.S. between 2019 and 2021.
Excess deaths refer to the actual number of deaths that occur in a given year compared with expected deaths over that same time period based on prior years or, as in this study, in other countries.
In my study, I compared the number of U.S. deaths with those in the five largest countries in Western Europe: England and Wales, France, Germany, Italy and Spain. Those five countries make for a good comparison because they are nearly, if not quite, as wealthy as the U.S. and their combined population is similar in size and diversity to the U.S. population.
I also chose those countries because they were used in an earlier study from another research team that documented a 34.5% increase in excess deaths in the U.S. between 2000 and 2017.
The acceleration of this already alarming long-term trend in excess deaths in the U.S. was exacerbated by the fact that the U.S. experienced higher death rates from COVID-19 compared with similar countries. However, COVID-19 alone does not account for the recent increase in the number of excess deaths in the U.S. relative to comparison countries.
Why it matters
Rising living standards and medical advances through the 20th century have made it possible for people in wealthy countries to live longer and with a better quality of life. Given that the U.S. is the largest economic power in the world, with cutting-edge medical technology, Americans should have an advantage over other countries in terms of life span and death rates.
But in the last 50 years, many countries around the world have outpaced the U.S. in how fast death rates are declining, as revealed by trends in life expectancy.
Life expectancy is an average age at death, and it represents how long an average person is expected to live if current death rates remain unchanged throughout that person’s lifetime. Life expectancy is based on a complex combination of death rates at different ages, but in short, when death rates decline, life expectancy increases.

Compared to about 20 other high-income countries, since around the mid-1970s the U.S. life expectancy has been slipping from about the middle, or median, to the lowest rungs of life expectancy. So the relative stagnation in life expectancy in the U.S. compared with other countries is directly related to the fact that death rates have also declined more slowly in the U.S.
The U.S. has higher death rates than its peer countries due to a variety of causes. Cardiovascular disease prevalence has been an important driver of life expectancy changes across the globe in recent decades. But while death rates from cardiovascular disease have continued to decline in other parts of the world, those rates have stagnated in the U.S..
A key reason for this trend is the rise in obesity, as research shows that obesity increases the risk of death from cardiovascular disease. High prevalence of obesity in the U.S. also likely contributed to the relatively high death rates from COVID-19.
Another cause is that the U.S. has disproportionately high death rates from intentional injuries in the form of homicides, in particular those caused by firearms. Moreover, it also has high death rates from unintentional injuries, in particular drug overdoses.
People are being exposed to fentanyl without knowing it, and because the synthetic opioid is so highly potent, people are dying in unprecedented numbers.
What other research is being done
While these specific causes of deaths should clearly be health policy priorities today, there might be more fundamental causes to the elevated U.S. death rates.
In the early 1990s, young people in the U.S. between the ages of 15 and 34 were already dying at higher rates than their peers in other countries from a combination of homicides, unintentional injuries – in large part from motor vehicle accidents – and deaths from HIV/AIDS.
Research is underway to understand the more fundamental societal causes that may explain the vulnerability of the U.S. population to successive epidemics, from HIV/AIDS and COVID-19 to gun violence and opioid overdoses.
These include racial and economic inequalities, which combined with a weaker social security net and lack of health care access for all may help explain larger health and death disparities compared to European countries.
end
SWAMP STORIES
There must be willful intent on Trump’s retention of the documents and Garland will be hard pressed to find one
(EpochTimes)
Trump Indictment Rests On Untested Legal Theory, Experts Say
WEDNESDAY, JUN 14, 2023 – 09:40 PM
Authored by Petr Svab via The Epoch Times (emphasis ours),

The indictment of former President Donald Trump for holding military documents and obstructing the government from taking them is built on a novel legal theory that has multiple weaknesses, according to several lawyers and other experts.
The case has been portrayed in the media as being about Trump’s retaining classified documents from his presidency. However, the charges sidestep that issue and instead use a clause in the Espionage Act that criminalizes a failure to hand over national defense information. The indictment further alleges that Trump and staffer Waltine Nauta hid some documents when the government demanded them through a subpoena.
The alleged Espionage Act violations impose a high burden of proof and raise the question of whether the statute should have been applied to begin with and, if not, whether the underlying investigation should serve as a basis for obstruction charges, some lawyers told The Epoch Times.
“The key legal issue here is the interplay between the Presidential Records Act and the Espionage Act,” said Will Scharf, a former federal prosecutor.
The Presidential Records Act of 1978 stipulates that after a president leaves office, the National Archive and Records Administration (NARA) takes custody of all his official records.
The law allows former presidents to keep personal documents such as “diaries, journals, or other personal notes” not used for government business.

“If a former President or Vice President finds Presidential records among personal materials, he or she is expected to contact NARA in a timely manner to secure the transfer of those Presidential records to NARA,” NARA’s website states.
However, the Presidential Records Act isn’t a criminal statute. If a former president refuses to turn over some documents or claims obviously official documents as personal, the worst he could face is a civil lawsuit.
There’s little case law on such matters. In 2012, Judicial Watch tried to force former President Bill Clinton to turn over dozens of interview tapes he kept from his presidency. Clinton claimed the tapes were personal and the court sided with him. Judge Amy Berman Jackson, an appointee of President Barack Obama, went so far as to argue that the court had no way to second-guess a president’s assertion of what is and isn’t personal.
“Since the President is completely entrusted with the management and even the disposal of Presidential records during his time in office, it would be difficult for this Court to conclude that Congress intended that he would have less authority to do what he pleases with what he considers to be his personal records,” Jackson wrote.
However, the Department of Justice (DOJ) is now arguing that former presidents can be charged under the Espionage Act of 1917 for possession of documents that they kept from their presidencies.
“That’s a totally novel legal issue,” Scharf said. “It’s never been tested before. The Espionage Act has never been used to prosecute in this sort of a setting.”

Some lawyers believe the Espionage Act can’t be used this way because it wasn’t meant to be used in such a fashion. Before 1978, former presidents owned all documents from their presidencies, including any national defense information. There’s never been any suggestion that their holding on to such documents violated the Espionage Act.
“Congress has been very, very clear … that the act that applies to presidents and former presidents is the Presidential Records Act. The act that applies to everyone else is the Espionage Act, which has different requirements,” said Jesse Binnall, a lawyer that represented Trump in another matter.
Mike Davis of the conservative Article III Project voiced a similar opinion.
“Even if President declassifies his presidential records and takes them when he leaves office, he can still get charged under Espionage Act. … Promise that theory won’t fly with Supreme Court,” he said in a tweet.
Criminal Intent
Much of the indictment rests on the allegation that Trump kept national defense documents “willfully”—with criminal intent.
Yet the document falls short in providing evidence for such intent.
On May 11, 2022, the DOJ obtained a subpoena compelling Trump to turn over all documents with classification markings, including electronic ones.
One of the key claims is that Trump instructed Nauta to move boxes of documents around before his lawyer came to search the boxes for documents in response to the subpoena.
Nauta allegedly moved 64 boxes out of a storage room where Trump kept items and documents from his presidency and moved them to Trump’s residence at the resort. Nauta then moved back 30 boxes shortly before Trump’s then-lawyer, Evan Corcoran, searched the storage room for the subpoenaed documents, according to the indictment, which refers to security camera footage obtained from Trump’s Mar-a-Lago resort via a subpoena.
Read more here…
end
THE KING REPORT
| The King Report June 25, 2018 Issue 5784 | Independent View of the News |
| Like May CPI, May PPI was better (-0.3% m/m & 1/1% y/y) than expected (-0.1% m/m 1.5% y/y) mostly due to declines in energy prices, and secondarily to food prices. Core PPI m/m was the expected 0.2% m/m and 2.8% y/y (2/9% expected). Goods prices, which rose 0.2% in April, were last month depressed by a 6.8% tumble in energy prices. Gasoline prices plummeted 13.8%, accounting for 60% of the decrease in goods prices. Food prices fell 1.3%, declining for a second straight month as eggs and vegetables cost less… https://www.reuters.com/markets/us/us-producer-prices-fall-more-than-expected-may-energy-costs-2023-06-14/ WSJ’s Greg IP: Stock Market to Fed: You Haven’t Done Enough – Bullish stocks, low bond yields and recovering housing market suggest interest rates aren’t that restrictive (Pay wall) https://www.wsj.com/articles/stock-market-to-fed-you-havent-done-enough-45c7a23e ESUs rallied modestly on the release of the May PPI Report but quickly rolled over into a decline that lasted until the NYSE opening. Then, the usual suspects did want they almost always due, pour into ESUs and stocks. ESUs rallied to 4432.50 at 10:40 ET, a 19-handle rally from the NYSE opening. ESUs then vacillated in a large range until a rally spurt occurred at 11:04 ET. ESUs hit 4439.50 five minutes before the European close. ESUs then sank 15 handles by 12:05 ET. A modest Noon Balloon ended at 12:19 ET. ESUs sank to 4418.00 (+1.25 for the day) at 13:31 ET. Did someone have non-public info about the FOMC Communique or Powell’s prepared remarks? ESUs then traded in a tight range as traders awaited the FOMC Communique release at 14:00 ET and Powell’s 14:30 ET Press Conference. FOMC Communique Highlights (FOMC Communique at link)As expected, the Fed paused at 5% to 5.25%; but most see two more rate hikes (DOT Plots)Lifted end of 2023 target fed funds to 5.6% (9 of 18 members) from 5.1%Sees Fed Funds Rate at a median of 4.6% at end of 2024Sees 4.1% Unemployment at end of 2023, down from 4.5%; 4.5% Unemployment at end of 20243.2% inflation and 3.9% core inflation at end of 2023; 2.5% and 2.6% at end of 2024“Recent indicators suggest that economic activity has continued to expand at a modest pace. Job gains have been robust in recent months, and the unemployment rate has remained low. Inflation remains elevated…” https://www.federalreserve.gov/newsevents/pressreleases/monetary20230614a.htmFed DOTS: https://twitter.com/zerohedge/status/1669045633003446282/photo/1 ESUs tumbled to 4383.50 (-33.25 for day) at 14:08 ET on the more hawkish than expected FOMC Communique. Fed Swaps no longer see rate cuts in 2023. ESUs bounced to 4401.75 at 14:10 ET; but they quickly retreated and hit 4384.00 at 14:25 ET. Powell Press Conference HighlightsRemain strongly committed in bringing inflation down to 2% goalFull effect of tightening has yet to be felt.Most members believe more rate hikes will be appropriate this year.Sees real GDP growth at 1.0% this year.Housing activity remains weak.Labor demand substantially exceeds supply of workers.Inflation has moderated somewhat since middle of last year.Economy faces headwinds from tighter credit conditionsExtent of effects of tightening remain uncertain ESUs & stocks rallied during Powell’s press conference because Jay was NOT hawkish. The Fed CEO’s remarks were measured. Powell obviated that he did NOT want to convey any message to the market. Powell Q&A Highlights There was no discussion about July rate hikes.I expect July meeting will be ‘live’ meeting.We see “only earliest signs” of service disinflation.I can’t tell you I ever have a lot of confidence where fed funds rate will be far in advance.We have moved closer to a sufficiently restrictive level on rates.We still think inflation risks are to upside.Too early to assess full extent of credit tighteningFed forecasters have been wrong on forecasting lower inflation for the last 2 years.“When you look at Core Inflation, we’re just not seeing a lot of progress… and we want to see it move down decisively.”Wouldn’t put too much weight on forecasts, too much uncertaintyNo FOMC member sees rate cuts this yearWe’re talking a couple of years out for rate cuts ESUs jumped to 4414.75 on Powell’s services disinflation remark, even though he tried to mitigate the comment with an ‘ONLY” qualifier. Once again, traders will eagerly buy on the flimsiest excuse. ESUs extended their rally during Powell’s Q&A session, hitting 4429.00 at 15:07 ET. Yes, Virginia, part of this move was the usual late manipulation. After Jay’s latter hawkish responses to reporters’ questions, ESUs tanked to 4404.75 at 15:16 ET. ESUs and stocks rebounded after Powell’s appearance ended. The modest rally ended at 15:26 ET. ESUs sank to 4398.75 at 15:50 ET. Someone then juiced ESUs to 4421.75 by the close. While Powell and his associates continue to assert and warn that the full effects of Fed tightening have yet to be felt, we fear that the full effects of decades of Fed monetary promiscuity, as well as the mind-addling US deficit spending, have yet to be felt. Positive aspects of previous session The DJTA soared on aggressive buying of land transportation stocks NY Fang+ Index jumped 1.43% on expiry-related and momo buying Bonds rallied moderately Negative aspects of previous session The DJIA was relatively weak all session due to United Health’s 7.15% tumble (CEO cited rising costs) Industrial commodities rallied moderately Ambiguous aspects of previous session The dollar got hammered before the FOMC Communique release. Gold hit an all-time high in terms of yuan. First Hour/Last Hour Action [S&P 500 Index]: 1st Hour from NYSE Open: Up; Last Hour: Up Pivot Point for S&P 500 Index [above/below indicates daily trend to traders]: 4367.42 Previous session High/Low: 4391.82; 4337.85 Retail CEOs Signal Rising Alarm as Theft Eats Away Billions in SalesExecutives and analysts discuss shrink at record rateBut CEOs fear they’re largely powerless to stop shopliftingEarlier this year, the National Retail Federation calculated that lost inventory cost retailers nearly $94.5 billion in 2021, up from $90.8 billion the prior year… https://english.alarabiya.net/business/economy/2023/06/11/US-retail-CEOs-signal-rising-alarm-as-large-scale-theft-eats-away-billions-in-sales @Callum_Thomas: US equity speculative futures positioning ticking up from near-record lows as the market runs away.… minds are starting to change as FOMO kicks in and price speaks louder than macro. Looking more like 2011 (vs 2007) https://t.co/Y2EnV9A6FA @RyanDetrick: Current positioning relative to the past 20 years shows fund managers love bonds and hate stocks. History isn’t full of too many times the crowd was right. https://t.co/GGqqkY8Hhy Amazon shuts down customer’s smart home for a week after delivery driver claimed he heard racist slur through Ring doorbell – even though no one was home – Jackson, who is black, said most of the neighborhood and its delivery drivers are also African American and it would be ‘highly unlikely that we would make such remarks.’… https://t.co/tbntW6YNwL Rep. Kiley slams HHS for ‘forcing’ mask mandates on 2-year-olds during the COVID-19 pandemic ‘Did forcing 2-year-olds to wear masks save lives?’ Kiley asked HHS secretary during the hearing https://www.foxnews.com/politics/watch-rep-kiley-slams-hhs-forcing-mask-mandates-2-year-olds-during-covid-19-pandemic Unmasking The CDC’s Medical CIA The swampy origins and foreign interests of the Epidemic Intelligence Services of the CDC need to be exposed… In May of 2021, Walensky also failed to mention that “true hero” Nancy Messonnier was an officer of the Epidemic Intelligence Service (EIS), the CDC’s elite team of “disease detectives,” patrolling the world to prevent epidemics from arriving on American soil… As Peter Duesberg noted in Inventing the AIDS Virus, the EIS functions as a “medical CIA,” a support network for the CDC in government, academia, and media… The CDC’s Epidemic Intelligence Service is actually a multinational body that includes “officers” from the People’s Republic of China. Embattled Americans might wonder which nation’s interests the Chinese EIS officers represent, and if any were on the CDC “team” working with China for many years… https://t.co/Hkb4G5gYm0 Canadian Mounties Probing China’s Alleged Targeting of Lawmaker https://www.usnews.com/news/world/articles/2023-06-13/canadian-mounties-probing-chinas-alleged-targeting-of-lawmaker @StephenMoore: $400,000,000,000.00 – That’s how much in COVID-19 relief was lost or stolen. The biggest financial fraud in world history. Today – The hawkish FOMC Communique thwarted the Weird Wednesday manipulation. Ergo, traders will be determined to affect the expiry manipulation to squeeze expiry June calls today. Fangs rallied sharply in late trading on expiry-related buying. Fangs should be a key to market direction today. Expected economic data: May Retail Sales -0.2% m/m, Ex-Autos 0.1%, Ex-Autos & Gas 0.2%; Initial Jobless Claims 245k, Continuing Claims 1.768m; May Import Price Index -0.5% m/m & -5.6% y/y, ex-Petro -0.1% m/m; Export Price Index -0.1% m/m & -8.4% y/y; Empire Manufacturing -15.1; Phil Fed Business Outlook -14.0; May Industrial Production 0.1% m/m, Mfg. Production -0.1%, Capacity Utilization 79.7%; April Business Inventories 0.2%; ESUs are +2.00 at 20:30 ET. S&P 500 Index 50-day MA: 4168; 100-day MA: 4096; 150-day MA: 4040; 200-day MA: 3980 DJIA 50-day MA: 33,557; 100-day MA: 33,347; 150-day MA: 33,426; 200-day MA: 32,785 (Green is positive slope; Red is negative slope) S&P 500 Index – Trender trading model and MACD for key time frames Monthly: Trender and MACD are negative – a close above 4514.50 triggers a buy signal Weekly: Trender and MACD are positive – a close below 4031.46 triggers a sell signal Daily: Trender and MACD are positive – a close below 4283.06 triggers a sell signal Hourly: Trender and MACD are negative – a close above 4405.09 triggers a buy signal GOP Lawmakers Question Who Gave Joe Biden’s Corporation Nearly $10M in 2017 https://www.breitbart.com/politics/2023/06/14/gop-lawmakers-question-joe-biden-corporation-10m-2017/ @WendellHusebo: GOP demands transparency from Biden regarding his 2017 tax returns His entity, “CelticCapri Corp,” listed nearly $10M without specifying revenue line items, raising concerns about who paid the entity and for what in the wake of $5M “bribery” scheme. Biden could be hiding his alleged $5M payment from Bursima in his entity “CelticCapri” & Jill Biden’s entity “Giacoppa Corp.” The numbers below in his 2017 tax return don’t provide revenue line items accounting for about $10M. Joe Biden must disclose who paid him & for what @HansMahn>https://www.revolver.news/2023/06/steven-d-antuono-former-head-of-fbi-jan-6-pipe-bomb-investigation-comes-clean-with-stunning-admission/ DeSantis campaign, Elon Musk tear into Biden White House over LGBTQ-themed tweet about ‘our kids’ – ‘Our kids are not fodder for the government,’ Musk tweeted https://www.foxnews.com/politics/desantis-campaign-elon-musk-tear-biden-white-house-tweet-our-kids @seanmdav: Yes, the Biden White House actually said this. Joe Biden, who won’t even acknowledge his own granddaughter because his dirtbag son doesn’t want to pay child support, says your kids are actually his kids. These people are pure evil. Trump slams ‘sham’ federal indictment as ‘election inference,’ the ‘most heinous abuse of power’ in US history – Trump said President Biden will “forever be remembered as not only the most corrupt president in the history of our country, but perhaps more importantly, the president, together with the band of his closest thugs, misfits and Marxists trying to destroy American democracy, channeling real anger and charging the President of the United States under the Espionage Act of 1917.”… “The Presidential Records Act does not confer any mandate, duty or even discretional authority on the archivist to classify records under the statute,” Trump said. “This responsibility is left solely to the President of the United States—so that’s the decision taken here.” He added: “In other words, whatever documents the president decides tot are with him, he has the right to do so—it’s an absolute right. This is the law.”… “Hillary Clinton broke the law and she didn’t get indicted,” Trump said. “Joe Biden broke the law, and in many other ways, we’re finding out, and so far has not gotten indicted.”… Trump pointed to former President George W Bush, saying his White House “lost 22 million emails,” and said the National Archives “cannot ensure a complete transfer of any of the Bush records.” “The horrific violations of my rights by Crooked Joe Biden’s weaponized department of Injustice,” Trump said. Shifting back to Special Counsel Jack Smith, Trump called him a “thug.” “I’ve named him deranged Jack Smith,” he said. “He does political hit jobs…He looks like a thug.”… https://www.foxnews.com/politics/trump-slams-sham-federal-indictment-election-inference-most-heinous-abuse-power-in-us-history “Bill Clinton lost the nuclear codes, the Bush’s lost 22 million emails, and Hillary took hundreds of thousands of dollars worth of furniture, china, and rugs and she was never prosecuted.” – Donald Trump https://twitter.com/RealAmVoice/status/1668791013022810114 Trump outlines legal defense in post-arraignment speech: ‘We will win bigger than ever before’ Trump: ‘Today we witnessed the most evil and heinous abuse of power in the history of our country’… “The president enjoys unconstrained authority to make decisions the disposal of documents,” Trump said. https://justthenews.com/government/courts-law/trump-outlines-legal-defense-post-arraignment-speech-we-will-win-bigger-ever @LizCrokin: Trump says Hillary Clinton set up an illegal and private server in her basement so “she could hide her pay-for-play scandal or whatever” and some of the classified information stored on her server leaked onto Anthony Weiner’s laptop. “You don’t want to be on his computer,” Trump said. What was found on Weiner’s computer?… This is Pizzagate! https://t.co/LiDqGcpL6m The information about Hillary Clinton, the Clinton Foundation, & “crimes against children” is on page 294 of the 2018 IG Report — check it out here for yourself please: FBI Agent Coleman told us that he kept regularly took notes in a journal. Coleman’s notes from October 4 contained the following entry: (1) Anthony Wiener [sic] (2) [Unrelated] (3) Wiener [sic] – texting 15 yo – Sexually Explicit 9/26 – Federal SW – IPhone/IPAD/Laptop Initial analysis of laptop – thousands emails Hillary Clinton & Foundation Crimes Against Children https://justice.gov/file/1071991/download @Rothbard1776 tweeted at 10:52 PM on Wed, Mar 24, 2021: James Comey & the FBI tried to bury the discovery of new Hillary Clinton emails sent on her illegal server. The only reason he was finally forced to hold a presser was because members of the NYPD threatened to go public after reviewing the disturbing contents on the Weiner laptop. @paulsperry_ : How Comey Covered Up Classified Hillary Emails Discovered on Anthony Weiner Laptop by NYC Sex Crimes Agent Who Blew Whistle on Huge New Cache: Despite Comey Assurances, Vast Bulk of Weiner Laptop Emails Were Never Examined 8/23/18 Comey later told Congress that “thanks to the wizardry of our technology,” the FBI was able to eliminate the vast majority of messages as “duplicates” of emails they’d previously seen. Tireless agents, he claimed, then worked “night after night after night” to scrutinize the remaining material. But virtually none of his account was true, a growing body of evidence reveals… https://t.co/yRlk2NyZyd @KevinTober94: Fox’s @BretBaier airs a montage of left-wing media figures mocking the idea of a lab leak in Wuhan China as the source of COVID. A “conspiracy theory” that has reportedly turned out to be true. https://twitter.com/KevinTober94/status/1669108089528655874 PBS Slaps Banner on Trump Live Event That Proves State Media Cannot Be Trusted: “Experts warn that inflammatory rhetoric from elected officials or people in power can prompt individual actors to commit acts of violence.”… https://beckernews.com/pbs-slaps-banner-on-trump-live-event-that-proves-state-media-cannot-be-trusted-50665/ Maddow Comes Up with Absurd Excuse Not to Cover Live Event of Trump Defending Himself from Federal Charges – He might say something “untrue.” (Unlike Biden?) https://beckernews.com/maddow-comes-up-with-absurd-excuse-not-to-cover-live-event-of-trump-defending-himself-from-federal-charges-50663/ @KevinTober94: Irony alert! CNN’s Jake Tapper told his audience that the network wouldn’t air Trump’s speech because live because “he says a lot of things that are not true and sometimes potentially dangerous.” Keep in mind 20 minutes prior he had on Russia collusion hoaxer Andrew McCabe. Kari Lake Attorney: Maricopa County’s Chain of Custody Docs Show 18,000 Illegal Ballots Were Injected the Day After the Polls Closed In 2020 https://t.co/iUMVPICF6n L.A. City Councilmember Curren Price charged with embezzlement and perjury Price, a 10-year veteran of the City Council, is accused of having a financial interest in development projects that he voted on, and receiving tens of thousands of dollars in medical benefits from the city for his now wife while he was still married to another woman, according to… the L.A. County district attorney’s office. He was charged with five counts of grand theft by embezzlement, three counts of perjury and two counts of conflict of interest, according to a criminal complaint made public Tuesday. https://www.latimes.com/california/story/2023-06-13/l-a-city-councilmember-curren-price-charged-with-embezzlement-perjury @houmanhemmati: The majority of the LA City Council has now been charged with and/or convicted of major corruption. At the point, we should presume every elected official in LA City AND LA County is corrupt and have a permanent @FBILosAngeles office inside city hall & county offices. ‘We’re setting them up to fail’ | How Maryland has changed high school graduation requirements The Maryland State Department of Education has changed high school graduation requirements, it says, to help more students earn diplomas. But some say, the changes could be setting students up for failure.. From 2020 to 2023, students no longer had to pass state assessments to graduate. They just needed to take them. And next year, new standards take effect again… https://foxbaltimore.com/news/project-baltimore/were-setting-them-up-to-fail-how-maryland-has-changed-high-school-graduation-requirements# (CA) State Senator Tells Parents to Flee His Own State amid Bill That Would Take Kids Away from Non-’Affirming’ Parents https://www.dailysignal.com/2023/06/13/state-senator-tells-parents-flee-own-state-law-take-kids-away-non-affirming-parents/ | |
GREG HUNTER
I will see you on FRIDAY


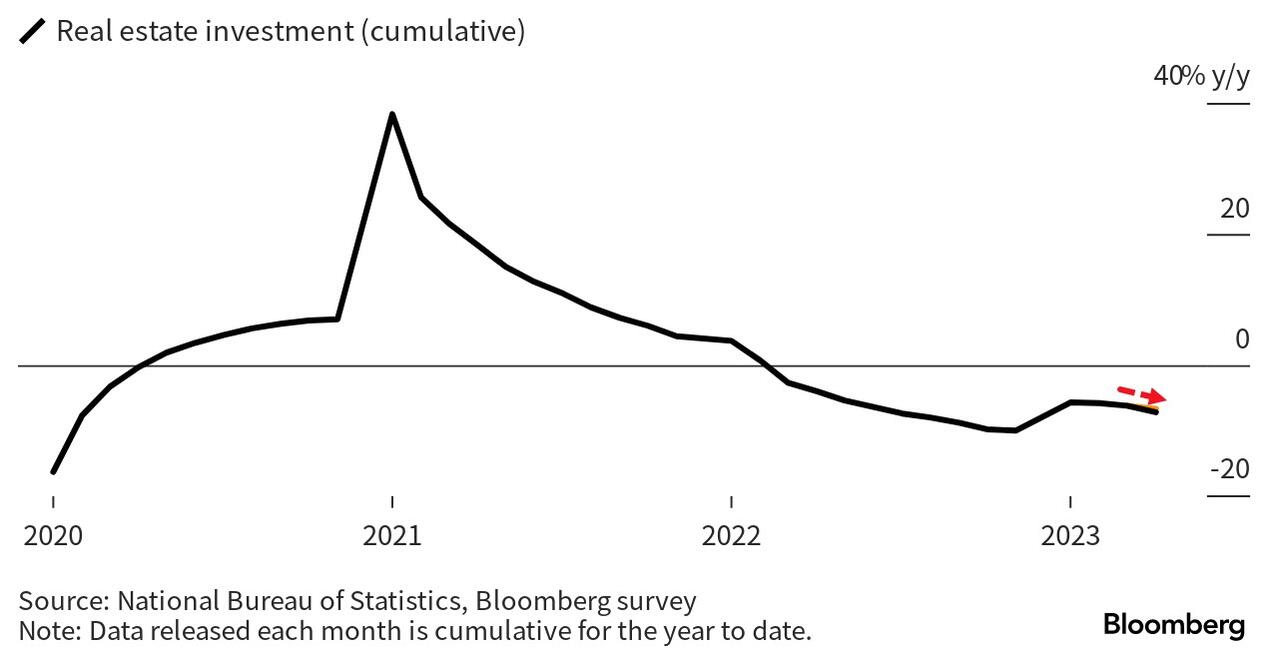
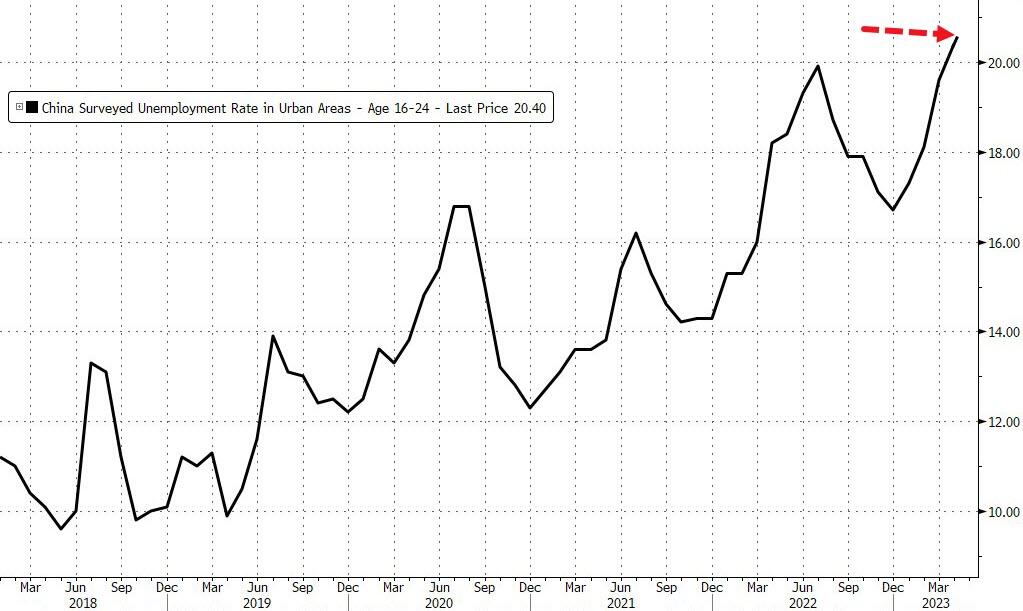
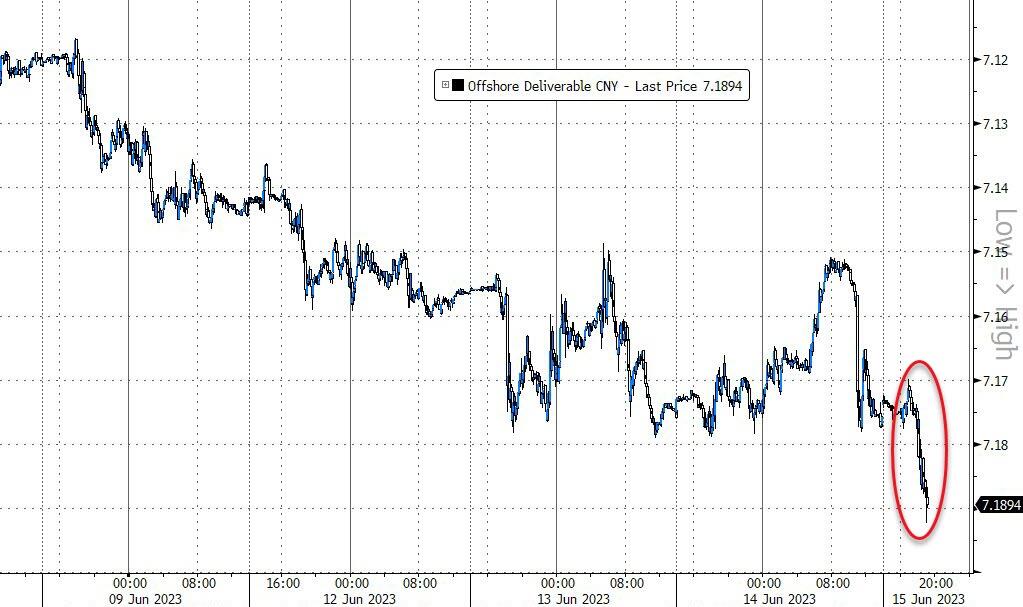
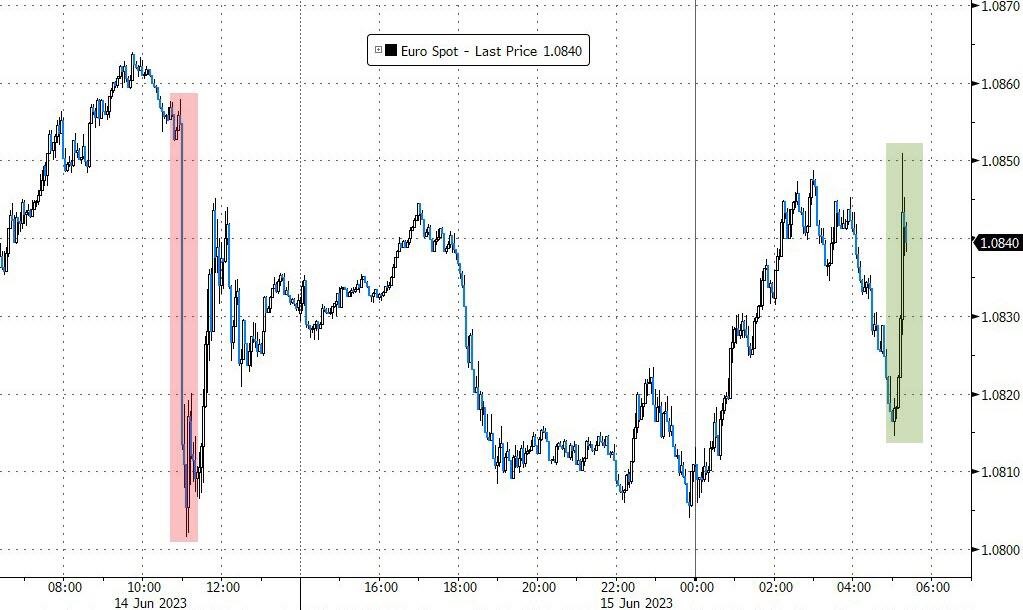
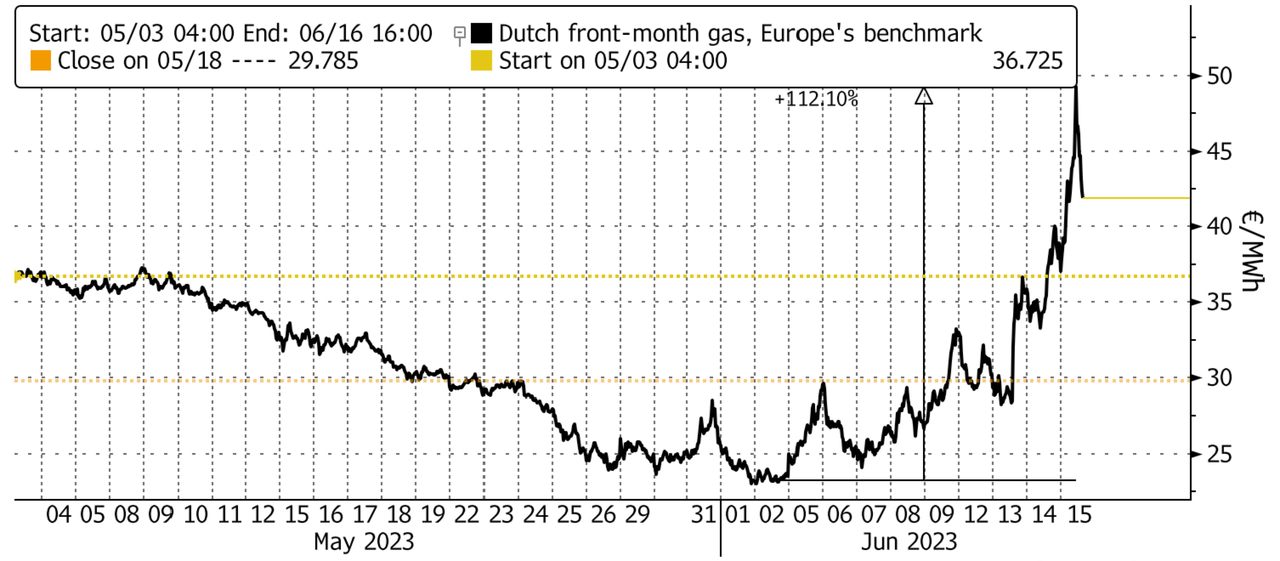
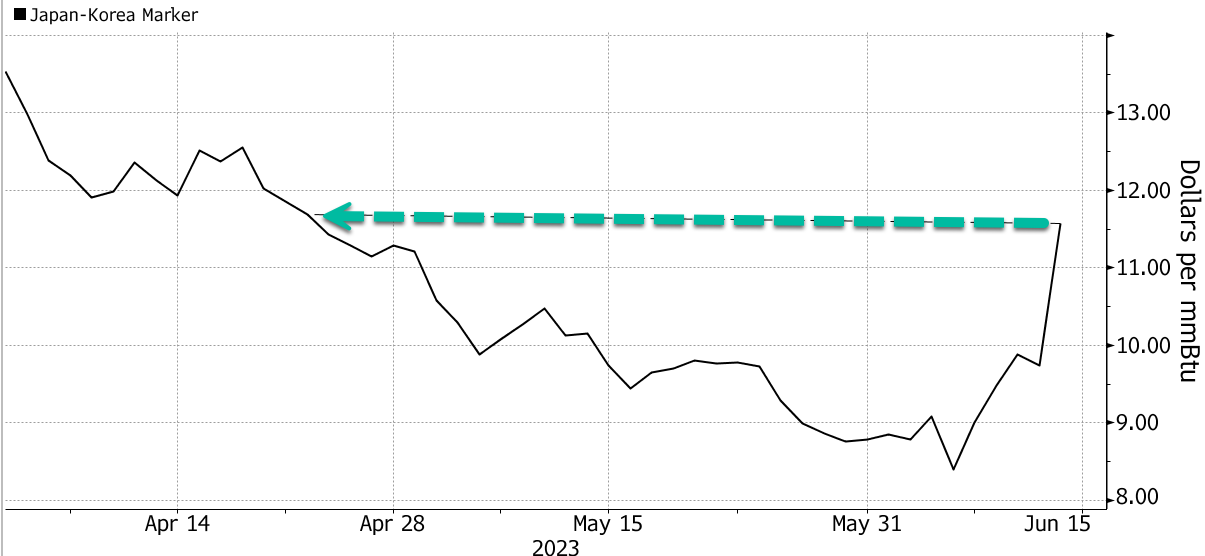
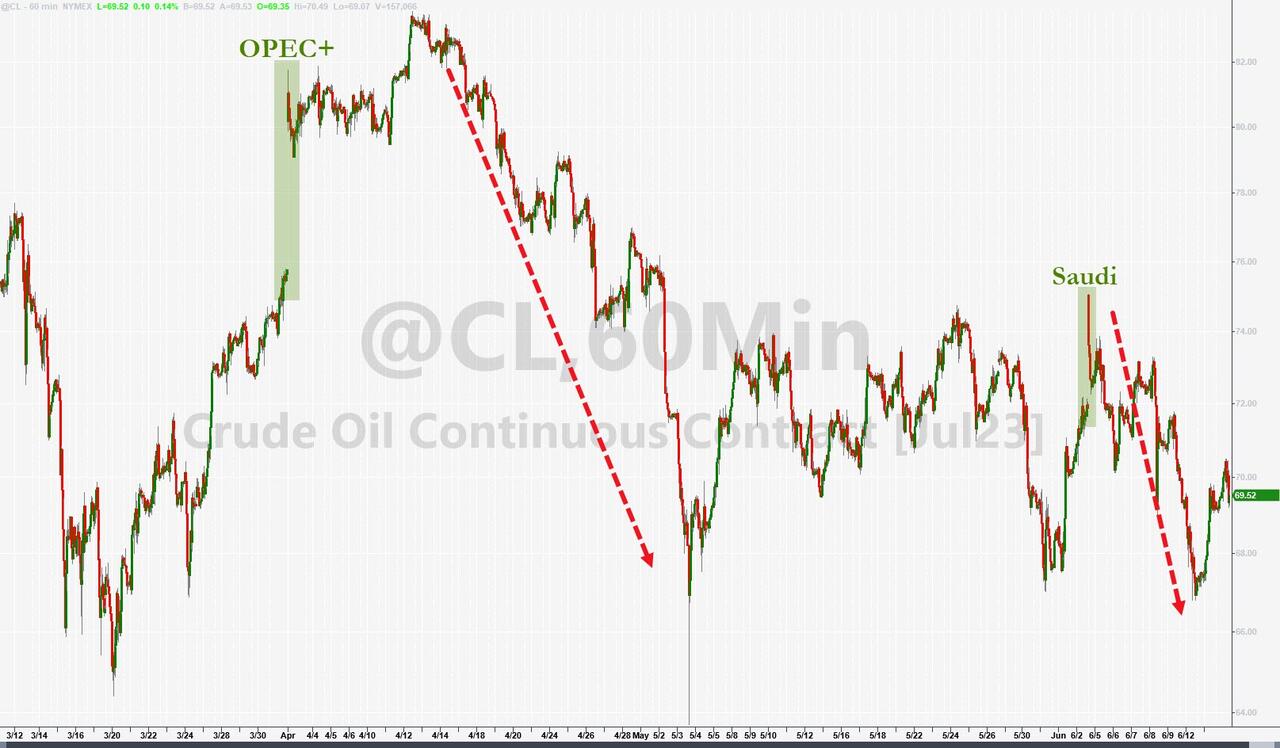
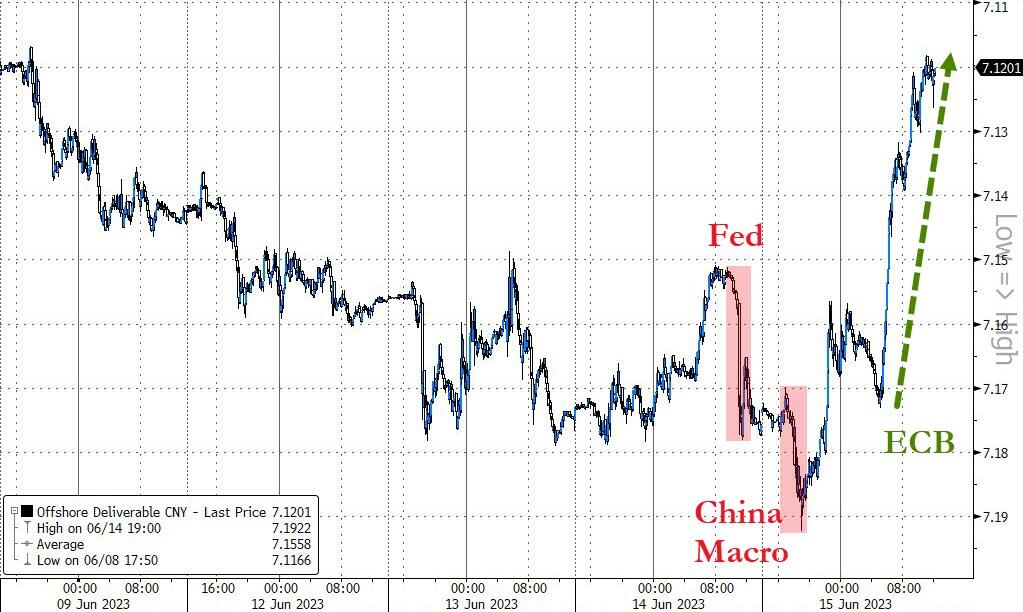
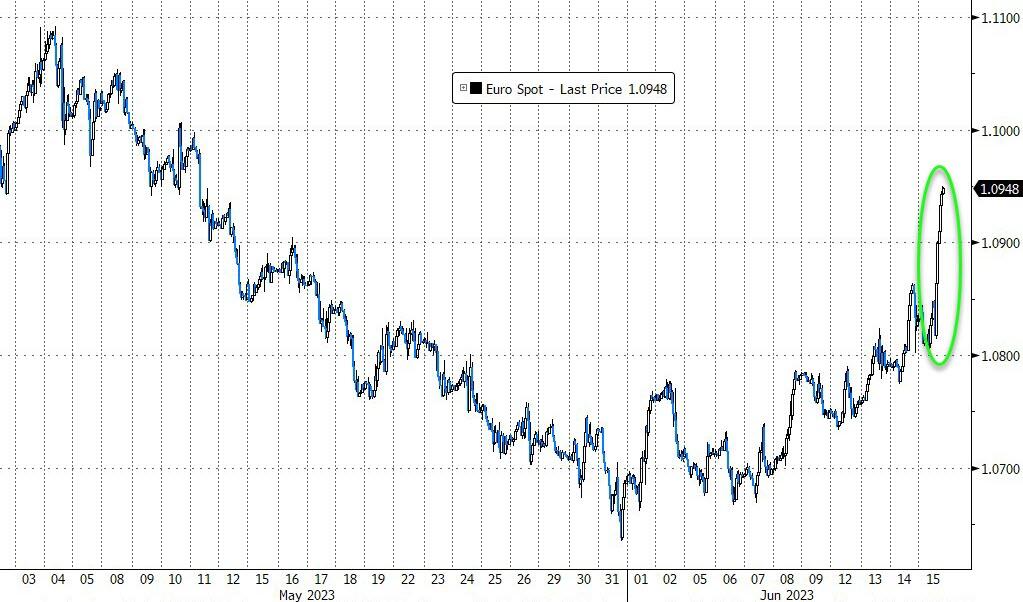
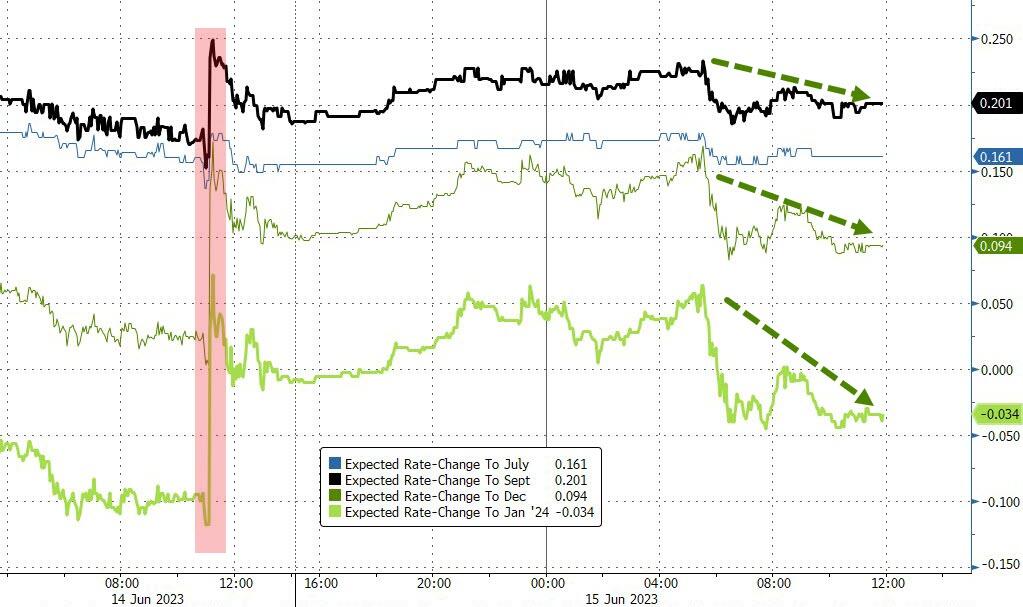
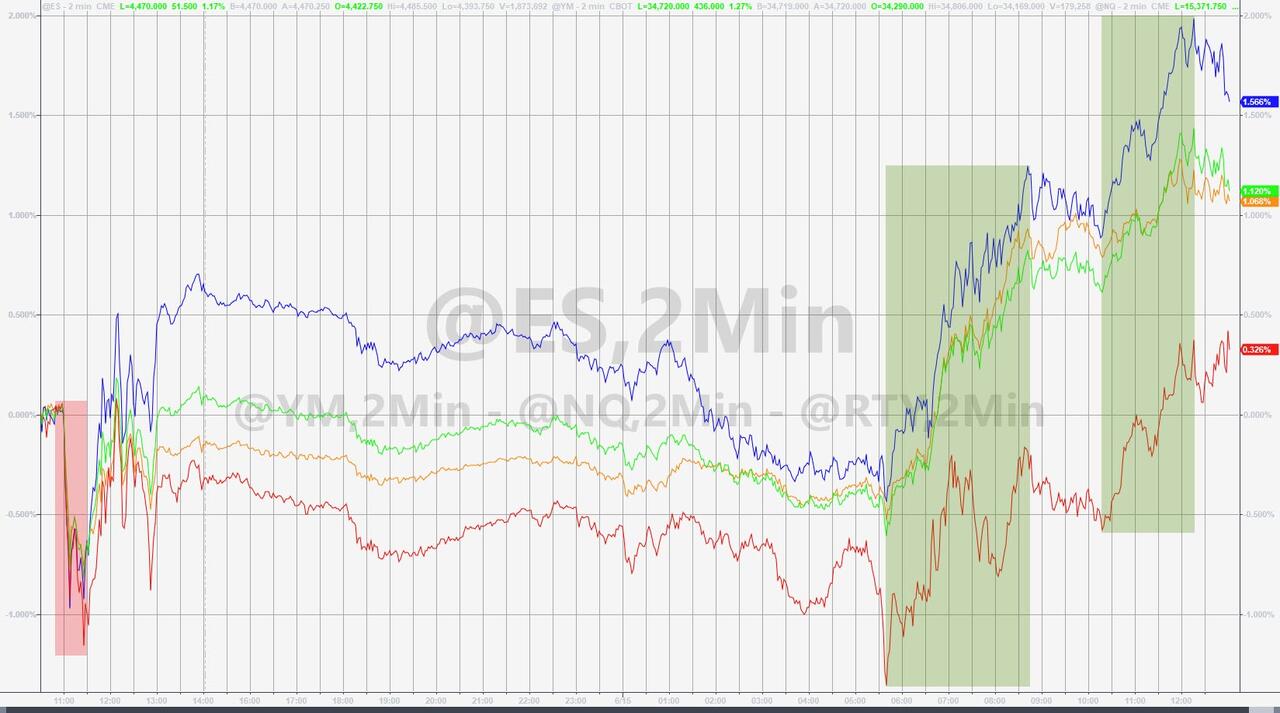
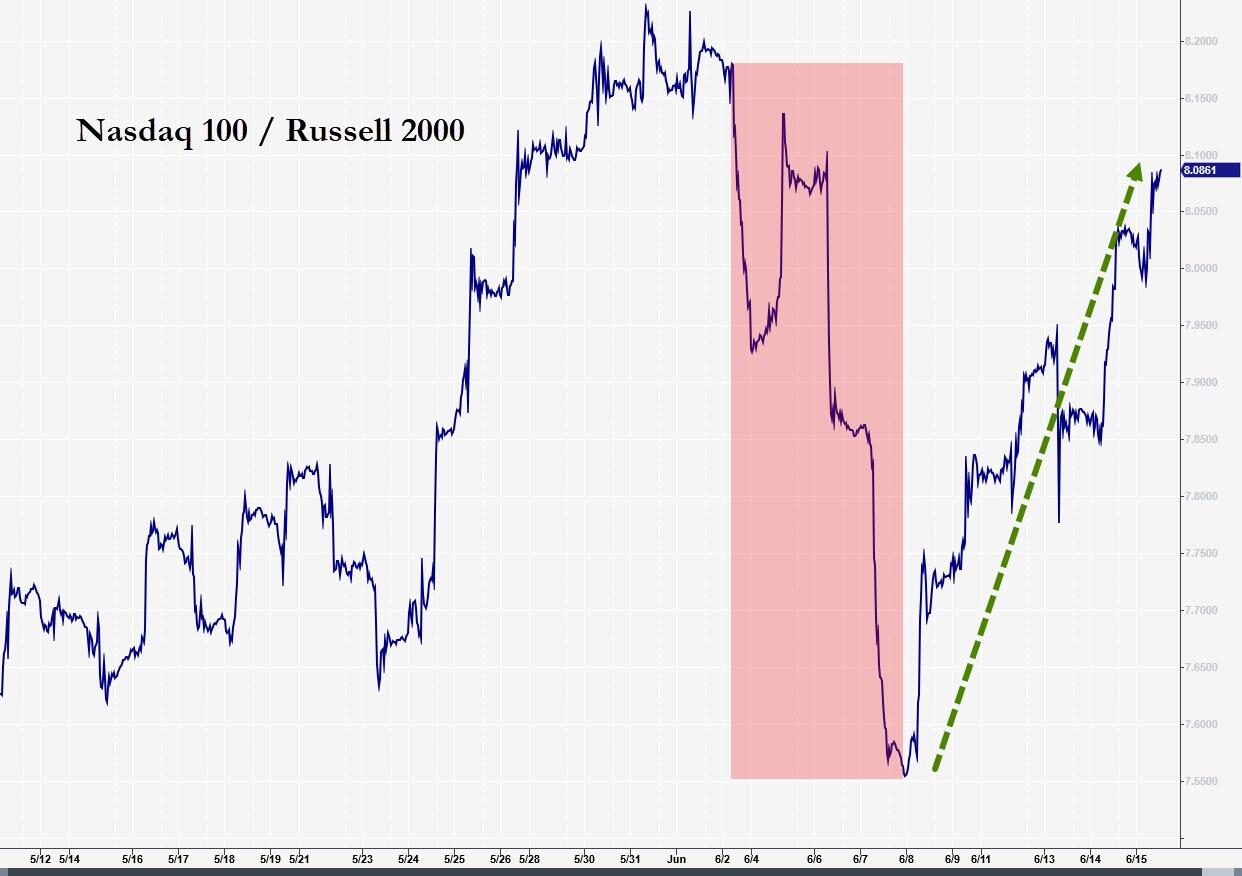
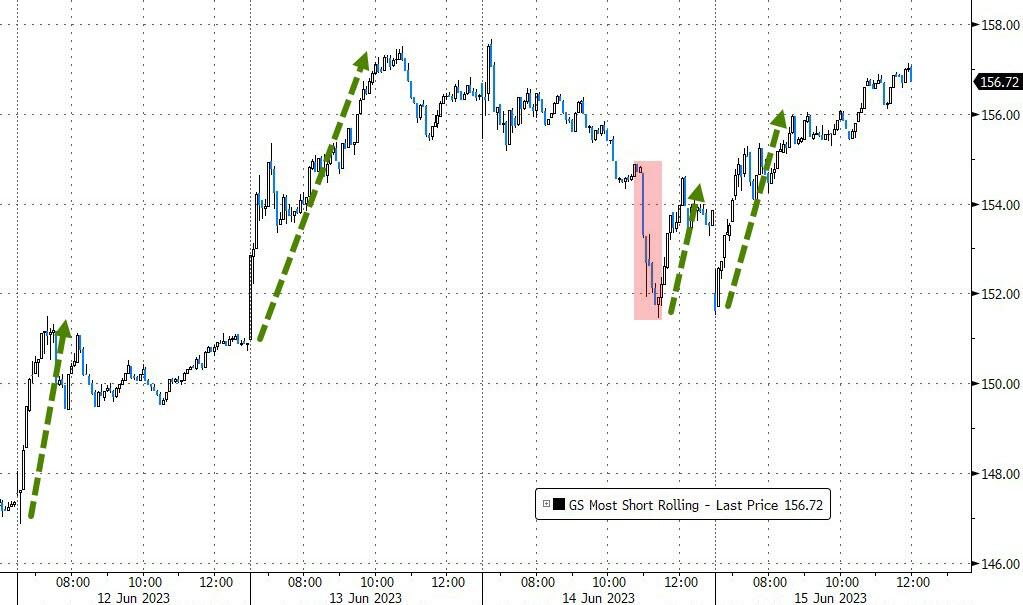
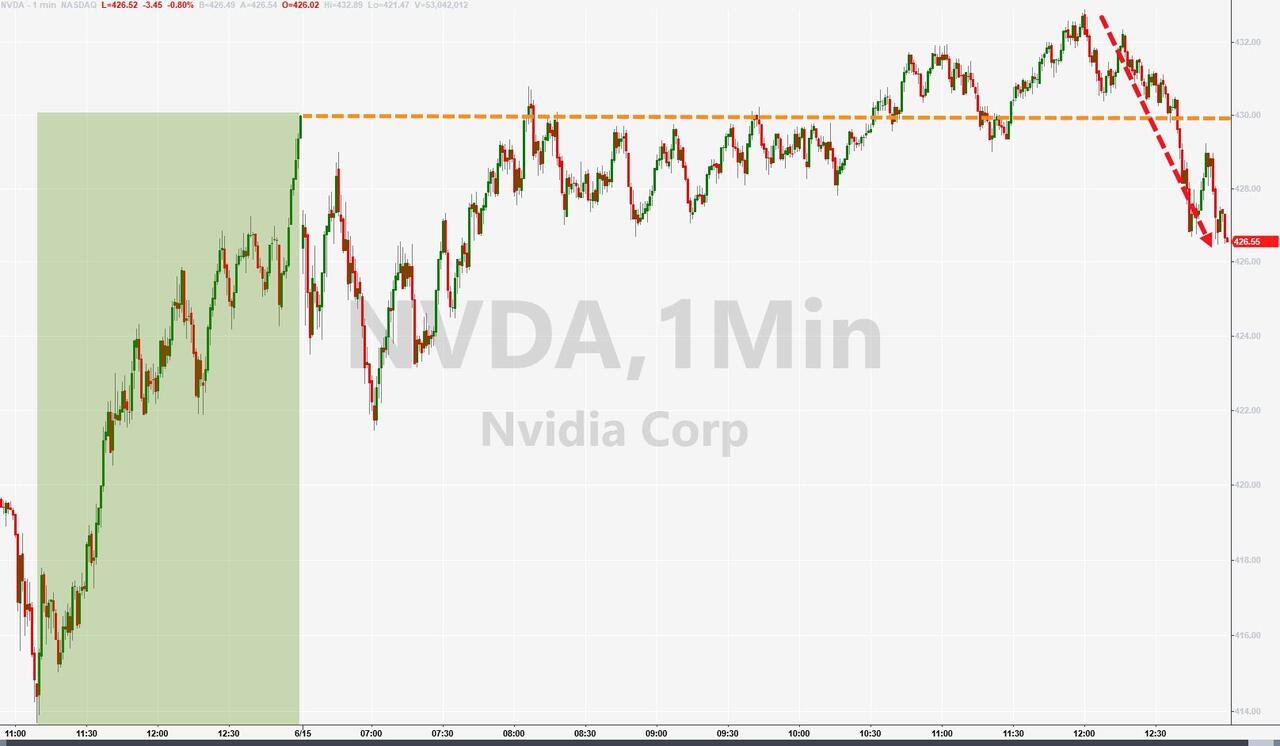
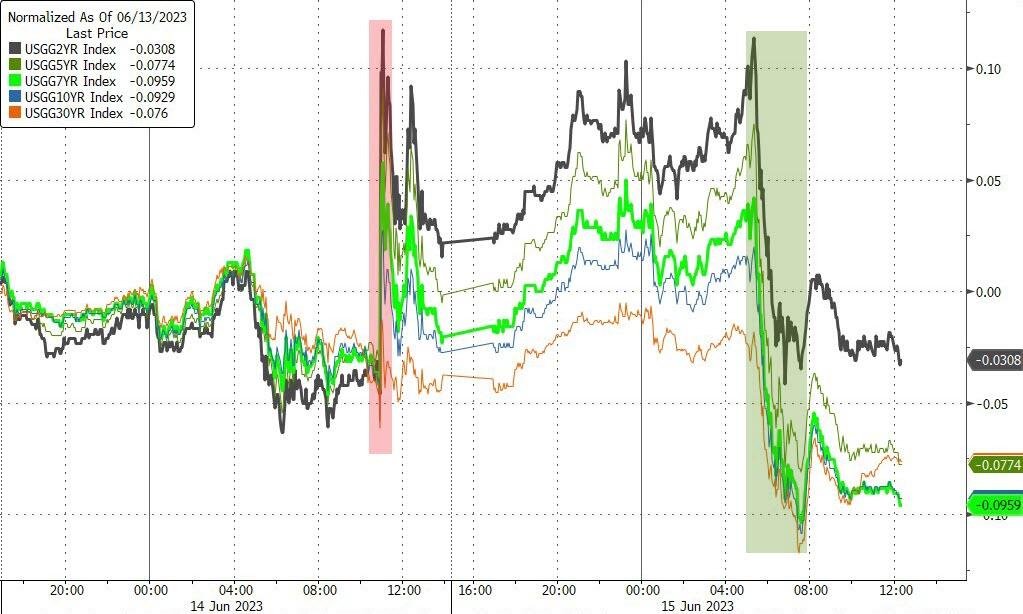
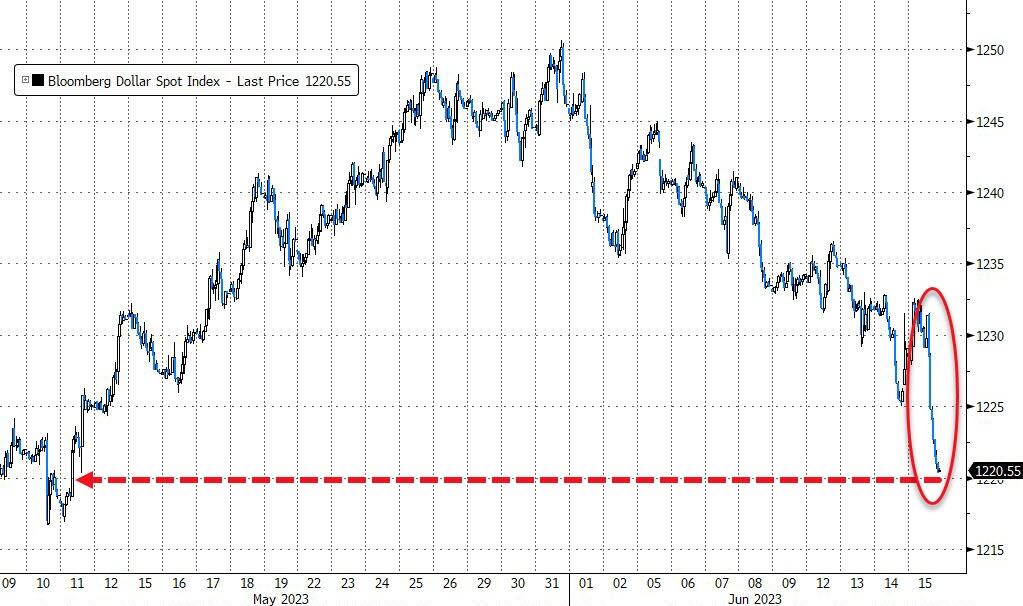
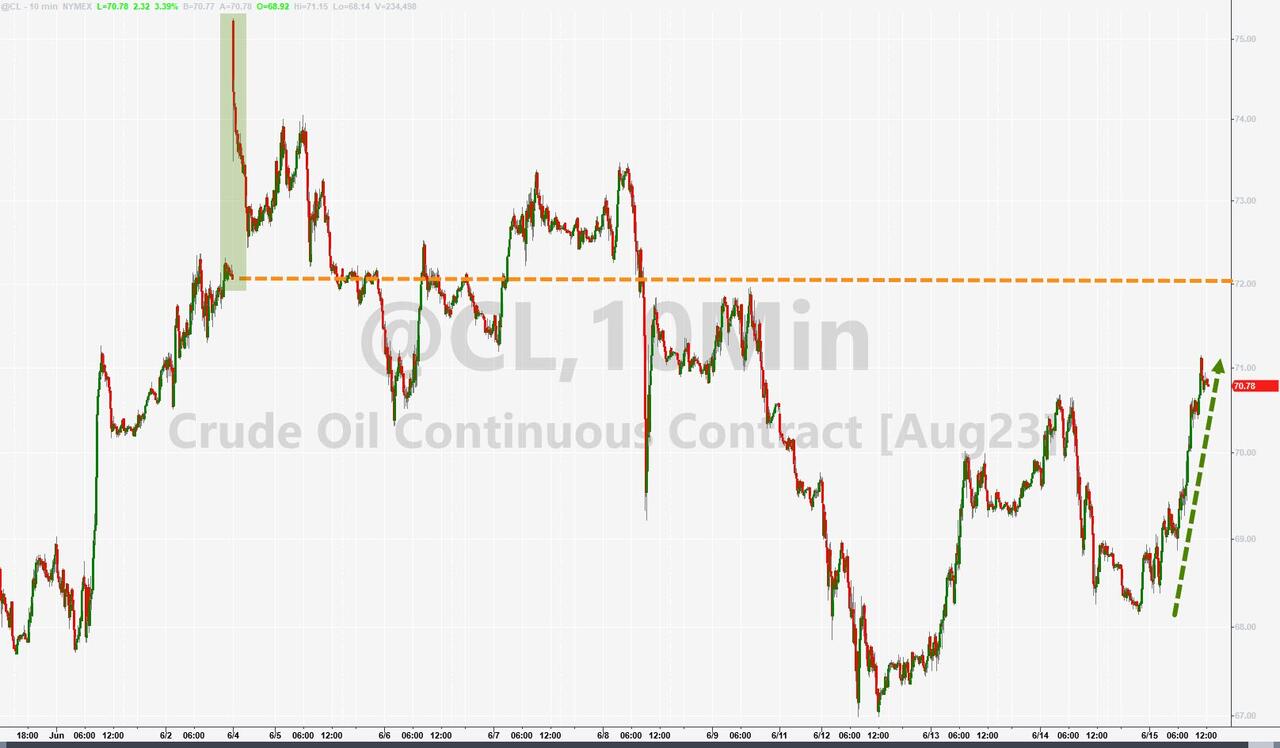
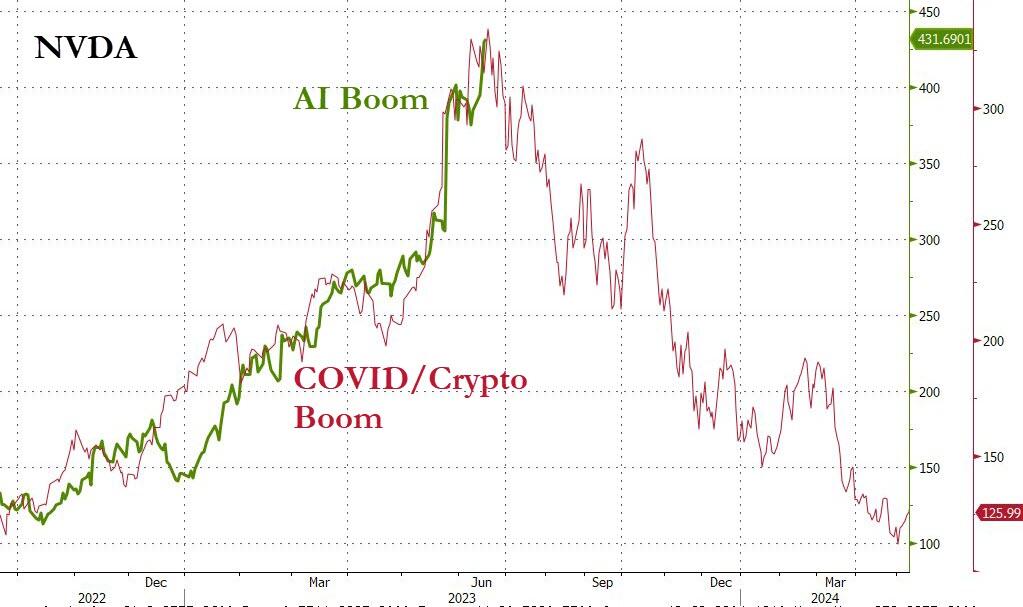
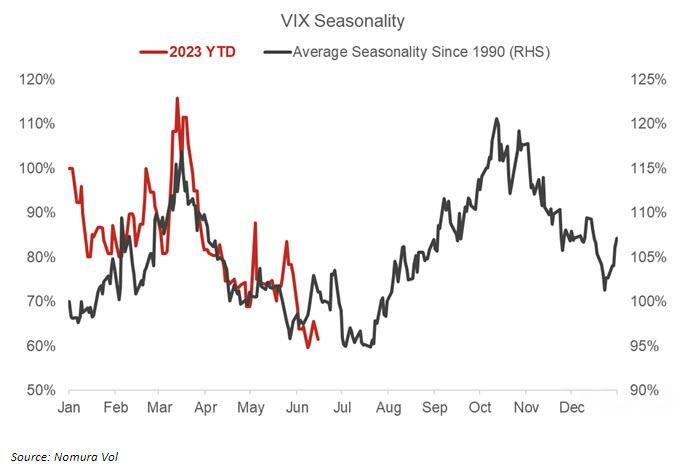
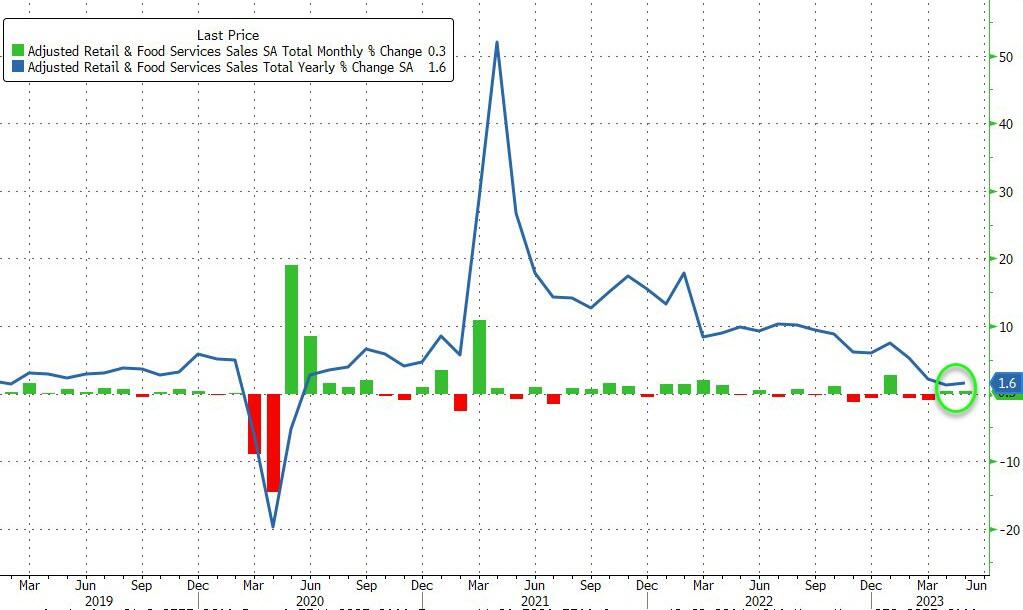
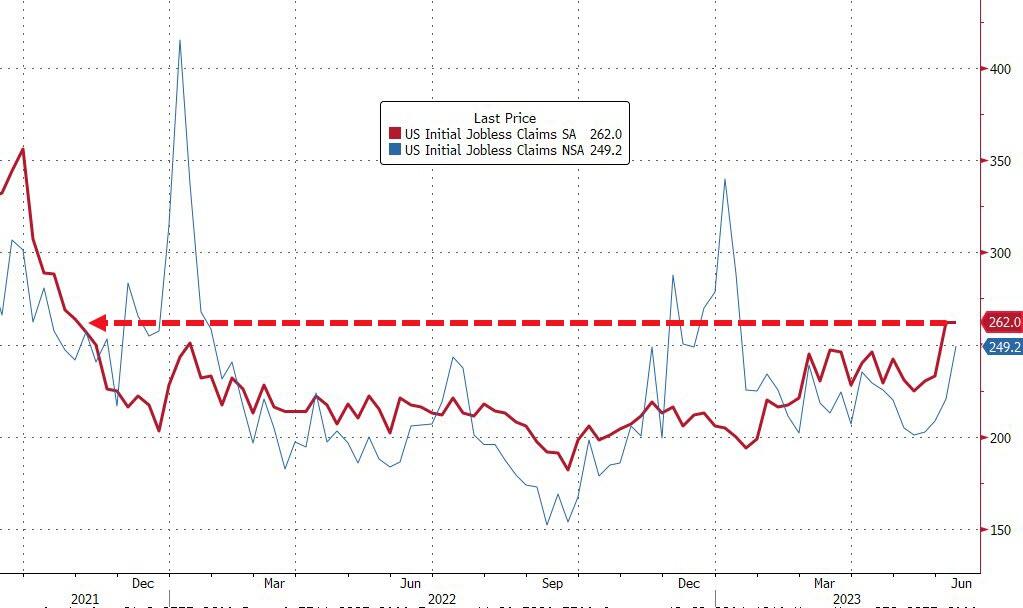
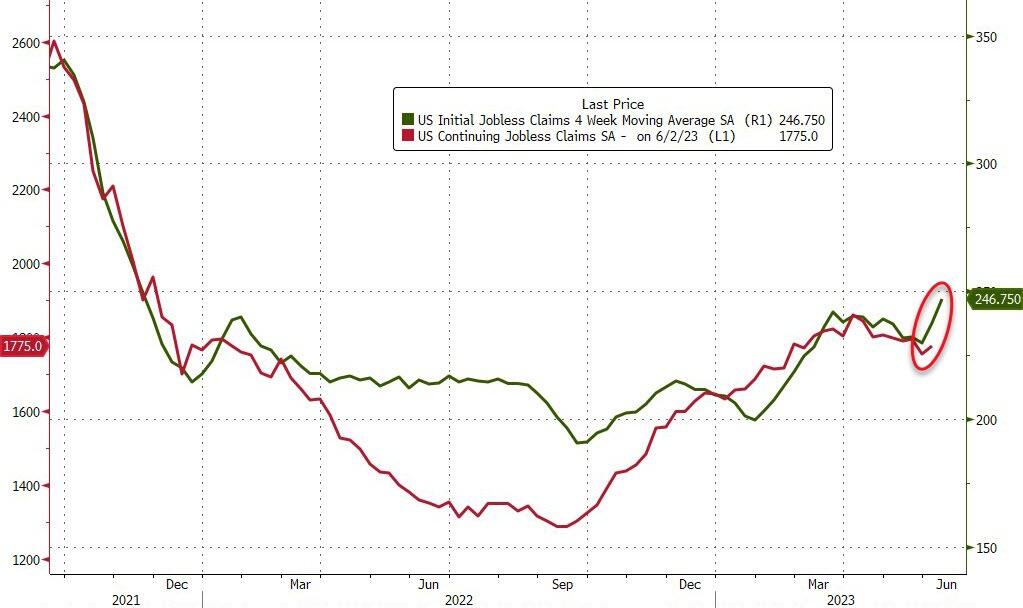
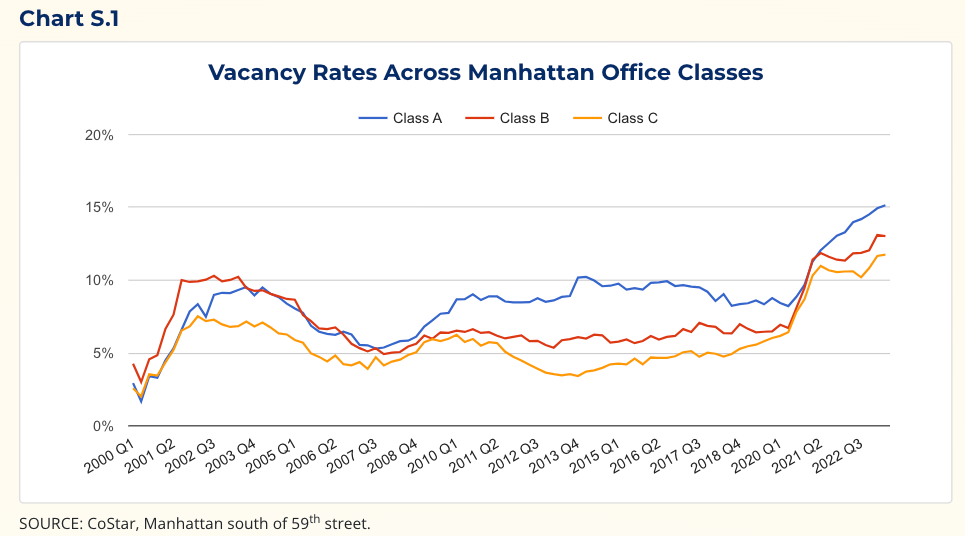
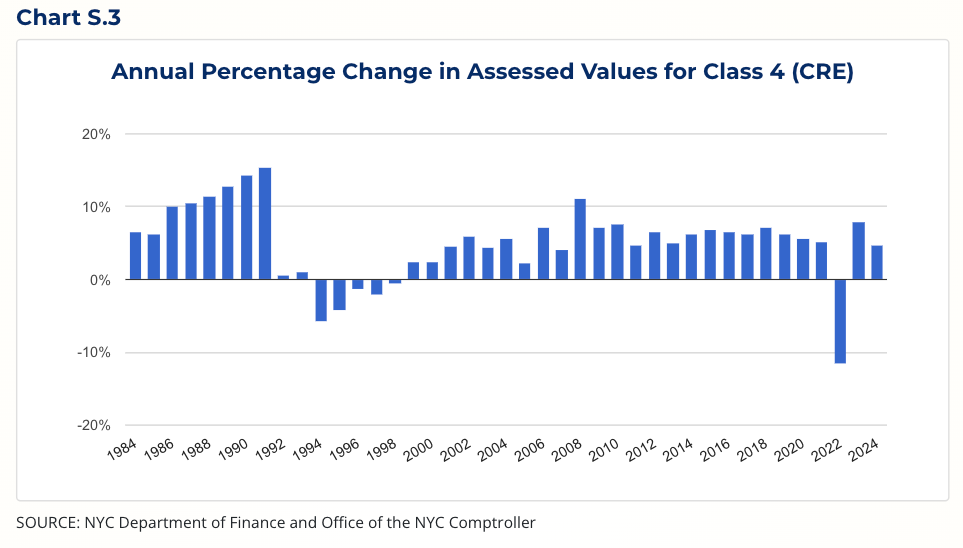
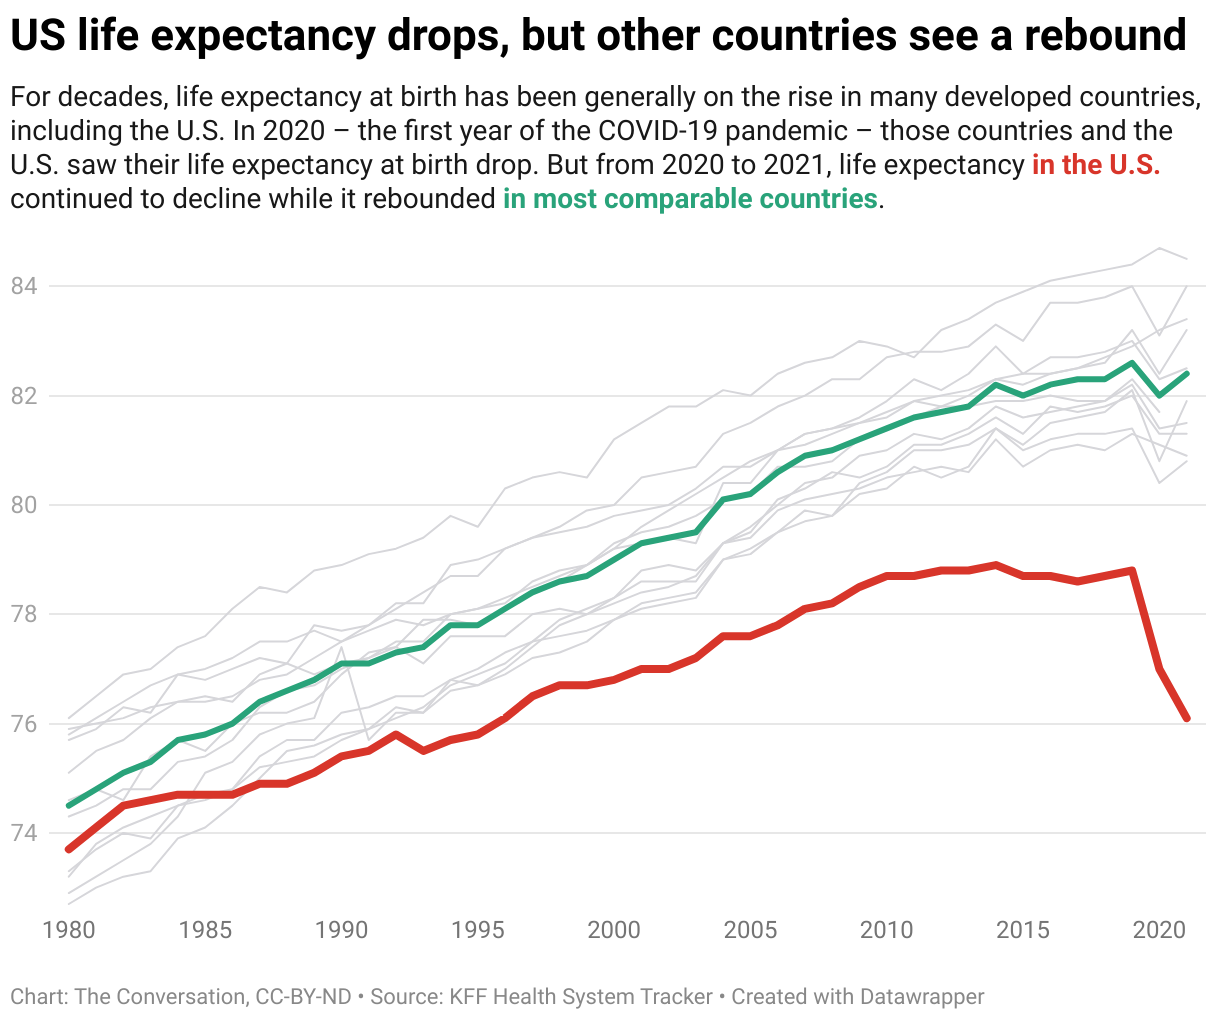
Harvey: More pro Russian horse shit from Robert Hryniak.
Mach. 15 missiles. It’ s obvious you do not care about the accuracy of the ‘news’ posted on this site. Are you actually pro Russian Harvey or just pro controversy?
LikeLike