
Good evening Ladies and Gentlemen:
Here are the following closes for gold and silver today:
Gold: $1109.50 up $7.30 (comex closing time)
Silver $14.64 up 7 cents.
In the access market 5:15 pm
Gold $1111.75
Silver: $14.70
Today’s quote from our good friend Dennis Gartman:
*Dennis Gartman…
“We also note a rising sense of interest on the part of the
Gold Bugs that there is a growing dichotomy between
deliverable supplies of gold against the COMEX futures
and the futures themselves. We do not often allow
ourselves to “throw in” with the Bugs, but in this instance
there may be something to the speculation.”
something stimulated his brain today!!
First, here is an outline of what will be discussed tonight:
At the gold comex today we had a poor delivery day, registering 1 notice for 100 ounces Silver saw 136 notices for 680,000 oz.
Several months ago the comex had 303 tonnes of total gold. Today, the total inventory rests at 218.81 tonnes for a loss of 84 tonnes over that period.
In silver, the open interest rose by 308 contracts despite the fact that silver was down in price by 18 cents yesterday. Again, our banker friends tried to use the opportunity to cover as many silver shorts as they could but failed. The total silver OI now rests at 155,923 contracts In ounces, the OI is still represented by .779 billion oz or 111% of annual global silver production (ex Russia ex China).
In silver we had 136 notices served upon for 680,000 oz.
In gold, the total comex gold OI fell to 417,895 for a loss of 3,837 contracts. We had 1 notice filed for 100 oz today.
Last last night we had a huge change in tonnage at the GLD, namely a withdrawal of 4.41 tonnes/ thus the inventory rests tonight at 678.18 tonnes. The appetite for gold coming from China is depleting not only gold from the LBMA and GLD but also the comex is bleeding gold. It sure looks like 670 tonnes will be the rock bottom inventory in GLD gold. It looks to me that China has taken the last amounts of physical gold from the GLD. I guess the only place left for China to receive physical gold will be the FRBNY and the comex. In silver, we had no changes in silver inventory at the SLV /Inventory rests at 322.06 million oz.
We have a few important stories to bring to your attention today…
1. Today, we had the open interest in silver rise by 308 contracts up to 155,923 despite the fact that silver was down by 18 cents in price with respect to yesterday’s trading. The total OI for gold fell by 3837 contracts to 417,895 contracts, as gold was down by $18.20 yesterday due to the massive raid orchestrated by our crooked bankers.
(report Harvey)
2.Gold trading overnight, Goldcore
(/Mark OByrne)
3. Trading overnight from China commencing at 9:30 pm est last night
4. Yuan devalues onshore yet the POBC raises yuan rate offshore, as the central bank tries to bring both rates closer together.This causes huge amounts of USA treasuries to be sold (zero hedge)
10. USA stories/Trading of equities NY
a) Odd trading behaviour at 6:12 am (zero hedge)
b) High inventory over sales screams of recession in the USA (zero hedge)
c) Weekly jobless claims constant at 275,000 (Reuters/BLS)
d) Today’s wrap up with David Stockman on faulty Goldman index used by the Fed
11. Physical stories:
- Something snapped at the comex again (zero hedge)
- Gold demand and silver demand rising in India. Gold imports for this year should hit 1000 tonnes and silver 300 million oz (Koos Jansen)
- Gold nowhere to be found in London (Koos Jansen)
- Is gold really being drained from NY comex or is the data completely fabricated (Chris Powell/GATA)
- Gold bars to be used as collateral for expanded SGE trading (GATA/Bloomberg)
- India starts its gold monetization scheme/it has zero chance of succeeding (Bloomberg/zero hedge)
and well as other commentaries…
Let us head over and see the comex results for today.
September contract month:
Initial standings
September 10.2015
| Gold |
Ounces
|
| Withdrawals from Dealers Inventory in oz | nil |
| Withdrawals from Customer Inventory in oz | 37,841.624 oz
Manfra, Scotia HSBC |
| Deposits to the Dealer Inventory in oz | nil |
| Deposits to the Customer Inventory, in oz | nil oz |
| No of oz served (contracts) today | 1 contract
(100 oz) |
| No of oz to be served (notices) | 159 contracts (15,900 oz) |
| Total monthly oz gold served (contracts) so far this month | 17 contracts
(1,700 oz) |
| Total accumulative withdrawals of gold from the Dealers inventory this month | nil |
| Total accumulative withdrawal of gold from the Customer inventory this month | 191,682.5 oz |
Total customer deposit: nil oz
JPMorgan has only 0.6133 tonnes left in its registered or dealer inventory. (19,718.722 oz) and only 863,683.63 oz in its customer (eligible) account or 26.86 tonnes
September silver initial standings
September 10 2015:
| Silver |
Ounces
|
| Withdrawals from Dealers Inventory | nil |
| Withdrawals from Customer Inventory | 1,726,340.491 oz
(CNT,Scotia, Delaware, Brinks) |
| Deposits to the Dealer Inventory | nil |
| Deposits to the Customer Inventory | 1,142,980.798 JPMorgan |
| No of oz served (contracts) | 136 contracts (680,000 oz) |
| No of oz to be served (notices) | 590 contracts (2,750,000 oz) |
| Total monthly oz silver served (contracts) | 943 contracts (4,715,000 oz) |
| Total accumulative withdrawal of silver from the Dealers inventory this month | nil |
| Total accumulative withdrawal of silver from the Customer inventory this month | 9,591,427.8 oz |
Today, we had 0 deposits into the dealer account:
total dealer deposit; 0 oz
total customer deposits: 1,142,980.798 oz
total withdrawals from customer: 1,726,340.491 oz
And now SLV:
Sept 10.2015: we had no changes in silver inventory at the SLV/rests tonight at 322.06 million oz
Sept 9.2015:
we had another huge withdrawal of 1.336 million oz of silver from the vaults of the SLV/Inventory rests at 322.06 million oz
Sept 8/we had a huge withdrawal of 1.524 million oz of silver from the SLV/Inventory rests tonight at 323.396 million oz.
Sept 4.2015:no changes in inventory at the SLV/rests tonight at 324.923 million oz
sept 3/we had a small withdrawal of 140,000 oz of silver from the SLV/Inventory rests at 324.923 million oz
Sept 2: we had a small withdrawal of 859,000 oz of silver from the SLV vaults/inventory rests tonight at 325.063 million oz
September 1/no change in inventory over at the SLV/Inventory rests tonight at 325.922 million oz
August 31.a huge addition of 954,000 oz were added to inventory today at the SLV/Inventory rests at 325.922 million oz
August 28.2015: no change in inventory at the SLV/Inventory rests tonight at 324.698 million oz
August 27.no change in inventory at the SLV/Inventory rests at 324.698 million oz
Sprott formally launches its offer for Central Trust gold and Silver Bullion trust:
SII.CN Sprott formally launches previously announced offers to CentralGoldTrust (GTU.UT.CN) and Silver Bullion Trust (SBT.UT.CN) unitholders (C$2.64) Sprott Asset Management has formally commenced its offers to acquire all of the outstanding units of Central GoldTrust and Silver Bullion Trust, respectively, on a NAV to NAV exchange basis. Note company announced its intent to make the offer on 23-Apr-15 Based on the NAV per unit of Sprott Physical Gold Trust $9.98 and Central GoldTrust $44.36 on 22-May, a unitholder would receive 4.45 Sprott Physical Gold Trust units for each Central GoldTrust unit tendered in the Offer. Based on the NAV per unit of Sprott Physical Silver Trust $6.66 and Silver Bullion Trust $10.00 on 22-May, a unitholder would receive 1.50 Sprott Physical Silver Trust units for each Silver Bullion Trust unit tendered in the Offer. * * * * *
(courtesy/Mark O’Byrne/Goldcore)
Gold Bullion Allowed As Collateral in China
China’s Shanghai Gold Exchange said it will allow physical gold to be used as collateral on futures contracts from September 29, according to a statement posted on its website this morning as reported by Reuters.
Physical gold will be permitted to be used for up to 80 percent of margin value, according to the statement.
Reuters then corrected the story and the second refiled story was changed and given a different focus:
The Shanghai Gold Exchange said on Thursday it will allow A-shares, exchange-traded funds and treasuries to be used as collateral for gold trading.

Reuters then corrected the story and the second refiled story was changed and given a different focus:
The Shanghai Gold Exchange said on Thursday it will allow A-shares, exchange-traded funds and treasuries to be used as collateral for gold trading. The move comes as Beijing unleashes a slew of measures to stave off a collapse in its stock market and restricts trading in stock index futures.
With counterparty and sovereign risk remaining high although unappreciated, gold is no longer being seen simply as a commodity – particularly in China, India and Asia. Rather, it is increasingly viewed by more astute market participants as an important asset and a currency with no counterparty risk.
Gradually, we are seeing the re-monetization of physical gold as it is being reincorporated into the modern financial and monetary system. Keynes’s ‘barbaric relic’ is becoming less barbaric by the day.
The development is an important one for the gold market and is bullish for the “pet rock.” It shows, once again, that gold is slowly but surely becoming a cash equivalent and as money again.
Gold’s re-monetisation in the international financial and monetary system continues.
Read the Reuters articles here and here
DAILY PRICES
Today’s Gold Prices: USD 1107.75, EUR 989.73 and GBP 720.32 per ounce.
Yesterday’s Gold Prices: USD 1122.30, EUR 1002.50 and GBP 730.38 per ounce.
(LBMA AM)
Gold fell 1.4% yesterday, the biggest loss in two months, to test support at $1,100 per ounce. It slid to $1,101.11, its lowest since August 11. Silver fell 1.1% and gave up some of its recent gains.

Silver in USD – 10 Years
Singapore gold was marginally higher and in early European trading gold has moved marginally higher again to $1,108 per ounce. Gold broke lower out of its recent trading range yesterday as technically driven traders liquidated positions.
Silver, platinum and palladium are all higher this morning too, outperforming gold. Silver’s losses yesterday were smaller than gold’s and this is encouraging the view that silver may have bottomed.
IMPORTANT NEWS
Gold at 4-week low as stocks rally, dollar rises – Reuters
Gold futures log lowest settlement in a month – MarketWatch
India’s Modi Moves Closer to Tapping Gold Hoard to Cut Imports– Bloomberg
Gold futures slightly lower, on track for a fifth straight losing session – MarketWatch
Gold ring found during roadworks in Ireland declared 12th century treasure – Independent.ie
IMPORTANT COMMENTARY
Something Just Snapped At The Comex (Updated) – Zero Hedge
Silver Bullion -NEW 100 oz poured silver bars to be available from Asahi – COINWeek
South African Gold on the Brink With Half of Mines Losing Money– Bloomberg
India’s gold monetization schemes met with skepticism – MINING.com
Druckenmiller, Soros, Icahn, Faber Like Commodities and Precious Metals – GoldSeek.com
end
India imported 126 tonnes of gold in August and they are on tap to import close to 1000 tonnes. I would also like to remind you that smuggled gold is not included in these figures and that number is huge.
In silver, the tonnage brought into India so far this year is 6782 tonnes or 218 million oz. They should hit 300 million oz for the year or 42% of annual global production ex China ex Russia.
India Precious Metals Import Explosive – August Gold 126t, Silver 1,400t
In the month of August 2015, India imported 126 tonnes of gold and 1,400 tonnes of silver, according to data fromInfodrive India. Gold import into India is rising after a steep fall due to government import restrictions implemented in 2013.
Year-to-date India has imported 654 tonnes of gold, which is 66 % up year on year. 6,782 tonnes in silver bars have crossed the Indian border so far this year, up 96 % y/y.
Gold import is set to reach an annualized 980 tonnes, which would be up 26 % relative to 2014 and would be the second highest figure on (my) record – my record goes back to 2008.

Silver import is on track to reach an annualized 10,172 tonnes, up 44 % y/y! This would be a staggering 37 % of world mining.

August trade data is preliminary and will be revised. However, these revisions are usually not significant. On 24 March 2015, I wrote an article based on preliminary data that suggested March silver import would transcend 130 tonnes, a few months later official data from the DGCIS disclosed that the Indian silver import figure for March was 132 tonnes.
India Gold Import Is Rising
When the gold price made its famous nosedive in April 2013, demand from the East – India and China – exploded. The Chinese government counted its blessings and encouraged its populace to import an unprecedented 1,500 tonnes. In contrast, the Indian government was not willing to allow its people to satisfy themselves in buying gold. The reason being, a current account deficit.
The Indian government decided in June 2013 to raise the import duty on gold from 4 % to 8 % and in August 2013 from 8 % to 10 %. Additionally, in August the 80/20 rule was implemented – forcing traders to export 20 % of all imported gold. As a result (official) gold import dropped from an all-time high in May 2013 at 165 tonnes, to a mere 16 tonnes in September 2013. We can only speculate how much was smuggled into India at the time.

The restrictions shocked the Indian precious metals market and premiums on local gold skyrocketed to 25 % (including the 10 % import duty) in December 2013. When the market eventually found a way within the existing framework to supply those in demand, premiums came down and official imports rose; illustrating the Indian people are not likely to stop buying gold, as they’re aware “their rulers are thieves”.
Finally, the 80/20 rule was withdrawn in November 2014 allowing gold to be imported more easily. The premium at Indian bullion shops over the international gold price (XAU/USD) has been slightly above the 10 % gold import duty this year.

The next strategy from the Indian government and the World Gold Council is to monetize gold “to reduce reliance on import” (click to read the proposal). The most recent draft describes how people can deposit their gold at a bank for interest and the banks can use this gold to lend out, though the exact workings of the renewed scheme are still unclear. In my humble opinion monetizing gold in India will not succeed and imports will not be dampened. The Indian people don’t want to lend their gold and they don’t want to melt their inherited emotionally-critical wealth.

India Silver Import Is Rising
When the Indian government raised the import duty on gold in 2013, it simultaneously raised the import duty on silver to 10 %. However, the premium on silver didn’t reach 25 % like gold. Many people switched to purchase silver instead of gold. Import since 2013 has increased dramatically.

Last May India imported a record 1,542 tonnes of silver, in August an estimated 1,400 tonnes was shipped in, which would be the second highest number on record – my record goes back to 2008.
This year India is set to import 37 % of global silver mining output. Perhaps more interesting, annualized import equates to 18 % of total above ground silver inventory, based on numbers from GFMS.
Gold is hardly used in industries, more so hoarded by investors and central banks and has a high stock to flow ratio. GFMS estimates there is 180,000 tonnes of above ground gold of which India is set to import 980 tonnes (1 % of above ground stock). Silver has many industrial applications, is used up and is not anymore hoarded by central banks. Resulting in relative low above ground stocks which are partially being imported by India – not likely to be exported any time soon. Potentially creating scarcity at current prices. In a forthcoming post we will zoom in on the supply and demand metrics of the Indian silver market.
Koos Jansen
E-mail Koos Jansen on: koos.jansen@bullionstar.com
end
this was brought to your attention yesterday. It has zero chance of succeeding. The citizens of India know the difference between paper gold and physical gold
(courtesy Bloomberg/zero hedge)
Gold-Backed Bonds: Is This The Start Of India’s Gold Confiscation
On April 5, 1933, FDR signed Executive order 6102 which made illegal “the Hoarding of gold coin, gold bullion, and gold certificates within the continental United States” in the process criminalizing the possession of monetary gold by any individual or corporation.
This was de facto gold confiscation; De jure it wasn’t, because as compensation for the relinquished gold, Americans would receive 20.67 in freshly printed US dollars for every troy ounce. Anybody who objected faced a fine of $10,000 (just under $200,000 in inflation-adjusted dollars) and up to 10 years in prison.
Once the government was confident it has confiscated enough gold, it turned around and raised the official price of a gold ounce to $35 (about $600 in today’s dollars) devaluing the US Dollar by 40% overnight at a time when currencies were still backed by hard assets.
Fast forward 82 years to a time when the barbarous relic continues to be seen as the safest store of value among India’s vast population (roughly 20% of the world’s total), not to mention the main source of financial headaches for local authorities, one of the biggest importers of gold due to its “traditional” values and where relentless Indian demand for offshore purchases of the shiny yellow metal so plagues the government’s current account and capital flow strategy, that the government may be preparing to pull a page right out of the FDR playbook.

Yesterday, Prime Minister Narendra Modi’s cabinet implemented the selling of “gold-backed bonds” when it approved the gold monetization plan and sale of sovereign bonds proposed several months ago by the Reserve Bank of India, the government said in a statement. The plans were first announced by Finance Minister Arun Jaitley in February as measures to woo Indians away from physical gold. As Jaitley explained yesterday, the deposited gold would be auctioned, used to replenish the Reserve Bank of India’s reserves or be lent to jewelers. Subsequently, gold “depositors” can redeem in gold or cash depending on the tenure. Said otherwise, an attempt to “fractionally-reserve” gold, which would then be used a source of gold rehypothecation in the country that despite all the government’s efforts, remains starved for physical gold.
What does the proposal entail?
As Bloomberg summarizes, an estimated 20,000 metric tons or more of bullion – more than double holdings in the U.S. – is stashed in India’s homes and temples, according to the government. It is this gold that India is scrambling to move from private hands to the public ledger.
As covered here extensively in the past, India is desperately looking for a long-term solution to curb gold imports after the current-account deficit widened to a record $190 billion in 2013 and the rupee slumped to an all-time low.
As the chart below shows, after declining to a 5 year low in 2014 following the implementation of numerous gold capital controls such as hiking the duty on imports to a record high 10%, which however also led to a record surge in gold smuggling, gold imports soared in 2015, and this year may be the highest in gold imports on record, surpassing 1000 tons.

Which is why a closer look at what the gold monetization scheme reveals Executive Order 6102 overtones: the plan will allow Indians to deposit their jewelry or bars with banks and earn interest, while the banks will be free to sell the gold to jewelers, thereby boosting supply. The deposits can be for a period of one year to 15 years with the interest on short-term commitments to be decided by the banks and those on long-term deposits by the government in consultation with the central bank.
The sovereign gold bonds are aimed at people buying the precious metal as an investment. The securities may help shift a part of the estimated 300 metric tons a year investment demand, the government said in a separate statement. The bonds will be issued in denominations of 5 grams, 10 grams, 50 grams and 100 grams for a term of five years to seven years with a rate of interest to be calculated on the value of the metal at the time of investment, it said.
But before foreigners rush to Bombay with hopes of monetizing those bars of physical in exchange for cash flow streams, the bond purchases will be limite only to local citizens and capped a just 500 grams per person annually:
In other words, very much like FDR’s proposal, what India is hoping to do is entice the population to hand over its gold only not in exchange for a cash payment “here and now”, but to use it as a monetary, interest-bearing asset, oh feel free to mock anyone who repeats the old adage that “gold pays no dividends” – in India it now pays interest.
Will the plan work?
Some are skeptical. “It is unclear if a gold monetisation plan will be able to curb imports. A similar plan launched in 1999 had failed partly due to low interest rates, and bankers fear a repeat unless the government funds lenders to implement the programme. Jaitley declined to give details on how the government will make it attractive for banks.”
To be sure, the government can urge banks to ramp up the “deposit” interest making gold that much more attractive a monetary “investment” than mere cash, in effect confirming that this is nothing but a gold confiscation ploy (or asset swap as the purists may claim) not to mention an admission that there is something disturbingly wrong with the Indian financial system and/or economy.
But the one thing to watch for is a shift in the posture of the Indian government: for now participation in the gold monetization scheme is voluntary, and largely geared to the general public with the 500 gram/year limit. But if and when the Modi cabinet starts “urging” the population, and certainly when threats of fines and/or prison time emerge, that is when we will finally have confirmation that the second coming of Executive Order 6102 has arrived. By then, however, the ratio of paper claims to deliverable gold at the Comex should be in the 5 or more figures so at least the price of “pet rocks” should be laughable at best.
* * *
More here: “In India, Gold Is Not Only Money But Now Pays Interest.”
The full “scheme” as proposed is laid out below.
end
Now Koos Jansen confirms what we have been telling you: it is virtually impossible to get physical gold in London:
(courtesy Koos Jansen)
It’s virtually impossible to get physical gold in London
Just after my colleague Ronan Manly wrote a very extensive article on how much gold is left in London (not much), Petropavlovsk Chairman and Co-Founder Peter Hambro discusses gold at Bloomberg Television. He, like Manly, concludes there is very little physical gold left in London. From Mr Hambro:
My baseline is they [the Chinese] have been buying and the Indian have been buying in enormous quantities. It’s virtually impossible to get physical gold in London to ship to those countries. We get permanent requests from Russia, would we please sell our physical gold to India and China. Because there is no physical, only endless promises. And I really worry that the market, that paper market, could be stamped on and people will say “sorry we’ll have a financial close out”, and it’s all over.
Perhaps this quote explains why UK gold export directly to China in June was not a net outflow from the UK – because there is little gold left in London (Manly, Hambro) and thus the UK had to ramp up import from the US in June to send forward to China.

Click here to watch the full interview with Mr Hambro.
The Financial Times reported on similar gold shortages in London. From the FT (2 September):
The cost of borrowing physical gold in London has risen sharply in recent weeks. That has been driven by dealers needing gold to deliver to refineries in Switzerland before it is melted down and sent to places such as India, according to market participants.
“[The rise] does indicate there is physical tightness in the market for gold for immediate delivery,” said Jon Butler, analyst at Mitsubishi.
I’ve also asked BullionStar CEO Torgny Persson in Singapore what he’s currently seeing in the precious metals markets. He replied there are shortages in both the gold and silver market. From Mr Persson:
I just got off the phone with A-Mark which is one of the world’s largest wholesalers. They are reporting that they have no gold and silver at all live available, that they have stopped taking orders for Silver Maples and Silver Philharmonics altogether and that Silver Eagles are available first in the end of November. ForPamp, there is similarly long delivery times for all minted gold bars.
We still have most products in stock because we stocked up as massively as we could in the last weeks but for many products, we are unable to replenish as of now when we run out.
Big squeeze with shortages starting now both on the wholesale/retail level and at the bulk level… Unless the paper price is reverting up, it may not subside this time around and then the paper fiat mess (including paper prices of gold and silver) is in trouble. If it goes to the point of shortages at the bulk level like 1kg gold bars and 1000 oz silver bars, the emperor will stand without clothes.
To be continued…
Koos Jansen
E-mail Koos Jansen on: koos.jansen@bullionstar.com
https://platform.twitter.com/widgets/follow_button.3476cd70032ff6b94ecc9ea63ab78a8b.en.html#_=1441904160926&dnt=false&id=twitter-widget-0&lang=en&screen_name=BullionStar&show_count=true&show_screen_name=true&size=m
https://platform.twitter.com/widgets/follow_button.3476cd70032ff6b94ecc9ea63ab78a8b.en.html#_=1441904160929&dnt=false&id=twitter-widget-1&lang=en&screen_name=KoosJansen&show_count=true&show_screen_name=true&size=m
Extremely important commentary….
(courtesy Chris Powell/GATA)
Is Comex gold really being critically drained?
Submitted by cpowell on Thu, 2015-09-10 04:46. Section: Daily Dispatches
12:58a ET Thursday, September 10, 2015
Dear Friend of GATA and Gold:
Zero Hedge reports tonight that the gold ready for delivery from Comex warehouses against Comex gold futures contracts has fallen to the lowest amount on record, leaving 207 ounces in paper gold claims for every ounce of real metal ready for delivery:
http://www.zerohedge.com/news/2015-09-09/something-just-snapped-comex
Your secretary/treasurer would like to believe that this signifies that the gold available to the paperhanging market riggers is nearly exhausted and that the exchange will resort to cash settlement within hours. But to believe this: (1) you would have to believe that Comex data is accurate and not contrived to give false impressions;(2) that the U.S. government won’t keep advancing official-sector gold through its agent bullion banks as necessary; and 3) that such advances aren’t easily implemented by, among other mechanisms, borrowing custodial gold from the vault of the Federal Reserve Bank of New York and moving it across the street (or, rather, under the street) to the vault of JPMorganChase & Co., the U.S. government’s agent in all sorts of surreptitious market interventions. (Harvey: this is my belief)
Yes, if, as many of us suspect, the paper gold game has been terribly overplayed and will implode eventually, as the London Gold Pool imploded on March 15, 1968, then the Comex will declare force majeure and that will be the end of gold futures in the United States and gold market rigging by the government will either cease or, more likely, come out into the open, through an upward revaluation of gold by international agreement or confiscation of gold by the most threatened governments.
With infinite time, other things may happen as well: Christ may come back, the Dodgers may return to Brooklyn, and the mainstream financial news media may investigate government intervention in the gold and commodity markets.
But international currency revaluations usually are announced on Sunday nights, before markets open for the new week. And if, in thrall to the U.S. government, Western central banks are willing to risk their last ounces of monetary metal to prevent free markets from returning, the day of deliverance could still be far off and thus it still could use hastening by clamor from gold and silver mining companies, commodity-producing countries, and investors generally.
So turn out the lights tonight hoping, as always, to awaken to a better world in the morning, but be ready to face the same old one, wherein “sufficient unto the day is the evil thereof.”
CHRIS POWELL, Secretary/Treasurer
Gold Anti-Trust Action Committee Inc.
CPowell@GATA.org
end
I have already reported the following to you last night. Zerohedge provides the update of the removal of 16,000 oz from the dealer side over to the customer side:
(courtesy zero hedge/comex data 3;00 pm Wednesday night)
Something Just Snapped At The Comex (Updated)
Update: Earlier today, we said that we would “keep a close eye on today’s Comex update to see if JPM reverses this “adjustment” and adds at least a few more tons of deliverable gold to its vault.” Moments ago we got thedaily update form the Comex and not only did JPM not reverse its registered to eligible adjustment, but more curiously, the second largest vault, that of Scotia Mocatta (behind only HSBC) saw a comparable adjustment, whereby 16,644 ounces of gold, or about half a ton, and 14% of its vault total, were adjusted away from “registered” and into the “eligible” category.
This means that the already record low total registered holding across the Comex system, declined once again this time by 8.3% and hit a new all time low of 185,315, or less than 6 tons.

This means that what was already a record dilution factor, with over 200 ounces of paper gold claims for every ounce of deliverable gold, just soared even more, and following today’s 8% drop, there is now a unprecedented 228 ounces of paper claims for every ounce of deliverable “registered” gold.

For those who missed the full story from earlier today, please read on.
* * *
Just over one month ago, when looking at the latest changes in registered gold held at the Comex ,we were stunned not only by the collapse in this series to a record low of just over 350k ounces or barely over 10 tons, but also by the surge in “gold coverage”, or the amount of paper gold claims on physical gold, which exploded to a record high 124 per ounce.
This is what we said on August 3:
While on its own, gold open interest – which merely represents the total potential claims on gold if exercised – is hardly exciting, as we have shown previously it has to be observed in conjunction with the physical gold that “backs” such potential delivery requests, also known as the “coverage ratio” of deliverable gold.
It is here that things get a little out of hand, because as the chart below shows, all else equal, the 43.5 million ounces of gold open interest and the record low 351,519 ounces of registered gold imply that as of Friday’s close there was a whopping 123.8 ounces in potential paper claims to every ounces of physical gold.
This is an all time record high, and surpasses the previous period record seen in January 2014 following the JPM gold vault liquidation.
Another way of stating this unprecedented ratio is that the dilution ratio between physical gold and paper gold has hit a record low 0.8%. Indicatively, the average paper-to-physical coverage ratio since January 1, 2000 is a “modest” 19.1x. As of Friday it had soared to more than 6 times greater.
One month ago we showed this record surge in gold claims as follows:

But if last month was shocking, then what the COMEX revealed yesterday was absolutely jaw-dropping.
Here is the most recent update provided by the CME on eligible and registered gold.

What it reveals is that while JPM saw another 90,000 ounces of gold once again withdrawn from its vault, this time in the eligible category, for some reason a whopping 121,124 ounces of registered gold were reclassified as eligible. In doing so, JPM’s registered gold (red line in chart below) tumbled to a record low of just 19,718 ounces – an 86% collapse in just one day – and well under 1 ton of gold, some 600 kilos of physical gold available to meet delivery requests to be specific!

JPM’s dramatic adjustment also meant that total Comex registered gold has likewise tumbled to the lowest in history of just 202,054 ounces – just over 6 tons – available for delivery.

Zooming in only on the registered gold since 2014:

Not surprisingly, the latest collapse in registered gold took place while the gold open interest remained flat, and in fact has been modestly rising in the past year as seen below:

Which brings us to the punchline chart: the Comex gold “coverage” ratio, or the amount of paper claims for every ounce of physical. As of Friday this number was literally off the chart (it would not have fit on the previous chart shown up top), soaring to a mindblowing 207 ounces of paper gold claims for every ounce of deliverable gold. This also means that the dilution ratio between physical gold and paper gold has hit a new all-time low of just 0.48%!

And while we know what caused this epic surge in potential claims on gold – namely the relentless outflow in registered gold – what we don’t know is whether this is a systemic event, one which threatens the next Comex gold delivery request with an “insufficient product” response, and a potential default, or simply a one day abnormality.
What we do know is that, if only for one day, something at the Comex has snapped.
We will keep a close eye on today’s Comex update to see if JPM reverses this “adjustment” and adds at least a few more tons of deliverable gold to its vault, and if not, perhaps a phone call or two may be in order.
end
Shanghai Gold Exchange expands trading collateral to help volume
Submitted by cpowell on Thu, 2015-09-10 14:50. Section: Daily Dispatches
From Bloomberg News
Thursday, September 10, 2015
The Shanghai Gold Exchange, the world’s largest physical bullion marketplace, plans to expand trading collateral to precious metals, foreign exchange, and securities from local currency now, according to statements posted on its website Thursday. The move is designed to “boost market services,” it said.
Starting Sept. 29, trading members will be allowed to use certified gold bars as margin to open contracts, the exchange said in a statement dated Aug. 25. The eligible assets will extend to silver, foreign currency, yuan-denominated stocks, and bonds and other securities, according to a separate statement. …
… For the remainder of the report:
http://www.bloomberg.com/news/articles/2015-09-10/shanghai-gold-exchange…
end
1 Chinese yuan vs USA dollar/yuan lowers in value, this time at 6.3768/Shanghai bourse: red and Hang Sang: red
2 Nikkei down 470.89 or 2.51.%
3. Europe stocks all in the red despite USA/Yen ramp /USA dollar index up to 96.08/Euro up to 1.1188
3b Japan 10 year bond yield: falls to .357% !!!!(Japan buying 100% of bond issuance)/Japanese yen vs usa cross now at 121.24
3c Nikkei now just above 18,000
3d USA/Yen rate now well above the important 120 barrier this morning
3e WTI: 44.45 and Brent: 47.77
3f Gold up /Yen down
3gJapan is to buy the equivalent of 108 billion uSA dollars worth of bond per month or $1.3 trillion. Japan’s GDP equals 5 trillion usa.
Japan to buy 100% of all new Japanese debt and by 2018 they will have 25% of all Japanese debt. Fifty percent of Japanese budget financed with debt.
3h Oil up for WTI and up for Brent this morning
3i European bond buying continues to push yields lower on all fronts in the EMU. German 10 yr bund falls to .680 per cent. German bunds in negative yields from 4 years out
Greece sees its 2 year rate rises to 10.40%/Greek stocks this morning up by 3.11%: still expect continual bank runs on Greek banks /
3j Greek 10 year bond yield falls to : 8.47% (ridiculous!!)
3k Gold at $1106.60 /silver $14.67 (8 am est)
3l USA vs Russian rouble; (Russian rouble up 34/100 in roubles/dollar) 68.20,
3m oil into the 45 dollar handle for WTI and 48 handle for Brent/Saudi Arabia increases production to drive out competition.
3n Higher foreign deposits out of China sees huge risk of outflows and a currency depreciation (already upon us). This can spell financial disaster for the rest of the world/China forced to do QE!! as it lowers its yuan value to the dollar.
30 SNB (Swiss National Bank) still intervening again in the markets driving down the SF. It is not working: USA/SF this morning .9762 as the Swiss Franc is still rising against most currencies. Euro vs SF is 1.0938 well above the floor set by the Swiss Finance Minister. Thomas Jordan, chief of the Swiss National Bank continues to purchase euros trying to lower value of the Swiss Franc.
3p Britain’s serious fraud squad investigating the Bank of England/
3r the 4 year German bund now enters in negative territory with the 10 year moving closer to negativity to +.680%
3s The ELA lowers to 89.1 billion euros, a reduction of .6 billion euros for Greece. The bank withdrawals were causing massive hardship to the Greek bank. the Greek referendum voted overwhelming “NO”. Greece votes again and agrees to more austerity even though 79% of the populace are against.
4. USA 10 year treasury bond at 2.21% early this morning. Thirty year rate below 3% at 2.98% / yield curve flatten/foreshadowing recession.
5. Details Ransquawk, Bloomberg, Deutsche bank/Jim Reid.
(courtesy Jim Reid/Bloomberg/Deutsche bank/zero hedge)
Futures Surge Overnight As Deteriorating Economic Data Unleashes Blur Of Central Bank Interventions And QE Rumors
Following yesterday’s perfectly expected, yet totally shocking Brazil downgrade to junk status by the S&P, the Emerging Market took its next leg down over concerns that the so far relatively contained BRIC contagion will spread to the rest of the Emerging Markets. The result was that Malaysia’s ringgit, Indonesia’s rupiah and South Korea’s won all lead Asian currencies lower as regional equities initially dropped in a kneejerk response to the news while the New Zealand Dollar crashed by 2% after the RBNZ was the latest central bank to cut rates for the third time in three policy meetings.
The economic weakness stretched over to Japan, whose corporate goods price index plunged the most since 2009 while its machinery orders crashed -3.6% on expectations of a +3.0% rebound putting in play another Japanese recession scenario (its 5th in the past 7 years). The early result was a plunge in the Nikkei dragged lower by USDJPY (which also impacted US equity futures down), and then the Yen crashed, and the USDJPY soared instantly, when Japan had no choice but to pull out the QE card after Bloomberg headlines hit just before 1am eastern that ruling Liberal Democratic Party lawmaker Kozo Yamamoto, one of Japan’s permadoves who has advised Prime Minister Shinzo Abe on economic policy, said the BOJ should boost QE – again – and increase annual pace of asset purchases by at least 10t yen, adding that the BOJ’s Oct. 30 meeting would be “good opportunity” for further easing. And just like that horrible news is great news again.
The result is shown in the chart below: the USDJPY surged, then faded all gains, then proceeded to rise again and to trip all the upside stops set by the earlier spike…

… in the process dragging S&P from 1935 early in the session as high as 1966: a 30 point move on no liquidity, and no news, just more hope that the global economy is so bad, more easing will be required.

The move in S&P500 equity futures higher due to USDJPY correlation algos was so violent, the E-Mini was halted for 10 seconds at 6:12:45 am Eastern as central banks apparently don’t know their own strength.
All this happened just as China’s central bank once again intervened in the FX market, the offshore Yuan this time, when after devaluing the onshore Yuan the most in 4 weeks, “someone” scrambled to send the offshore Yuan soaring, and the USDCNH plunging by the most on record.
According to Reuters, China’s yuan shot higher in offshore markets on Thursday on suspected intervention by Chinese state banks, putting the offshore rate on track for its biggest daily gain on record. The intervention caught the market wrong-footed and was seen by traders as another bold gesture by Chinese authorities to shake out speculators and dampen expectations for further depreciation in the yuan following its devaluation in August.The offshore yuan spot rate strengthened more than 1 percent to 6.39 per dollar from 6.4698 earlier in the day as the suspected intervention prompted those betting on yuan depreciation to cover their positions.

At this point it has become virtually impossible to differentiate between actual central bank intervention, hopes of central bank intervention, and how the two interplay on what was once the “market” but is now merely the place where money printers duke it out every day in some pretense of price discovery set by those who literally print money.
Elsewhere in Asia equity markets traded lower following the weak close on Wall Street as indices were pressured by a slump in commodities. Nikkei 225 (-2.5%) underperformed amid profit taking following yesterday’s stellar gains where it posted its best day since 2008, while the unexpected decline of Japanese core machine orders (-3.60% vs. Exp. 3.00%) which printed its lowest since November 2014, added to the negative tone. ASX 200 (-2.4%) and Chinese bourses (Shanghai Comp. -1.4%) traded in negative territory, weighed heavily by the energy sector, following the declines seen in crude. JGBs traded in positive territory as the risk off sentiment in the region boosted demand for safer assets, while the 5yr JGB auction failed to trigger price action in the 10yr after b/c (3.49 vs 3.45) and tail in price printed relatively in line to the prior reading. Chinese Premier Li said China is to expand domestic demand and is to have a more active policy in regards to imports. Li added that China is to set up a cross border CNY payment system and is to allow foreign banks in its onshore forex market.
Cautious sentiment dominated the price action in early European trade as market participants reacted to yet another round of uninspiring data from China, as well as Europe, this time out of France (Manufacturing Production M/M -1.00% vs. Exp. 0.40%, Industrial Production M/M -0.80% vs. Exp. 0.20%), and also positioned for the key risk event — BoE monetary policy announcement. As a result, the more defensive sectors such as health care outperformed, with the French CAC index (-0.4%) also outperforming given the heavy weighting of the sector in the index. At the same time, the Spanish benchmark IBEX-35 index (-0.9%) underperformed its peers, with SP/GE lOy bond yield spread also wider, as market participants continue to price in risks stemming from the upcoming elections in Catalonia on September 27th.
Demand for safe-haven assets, which in turn resulted in Bunds outperforming USTs on the back of policy divergence flow, failed to weigh on USD/JPY which remained bid amid the growing expectation of further easing by the BoJ, with Japan LDP lawmaker Yamamoto stating that the BoJ should increase asset purchases by at least JPY 10trl and added that October 30th BoJ meeting is a good opportunity for additional easing.
Aggressive move lower by offshore CNY prompts speculation of an intervention by the PBOC in order to close the spread between offshore and onshore CNY. The move was said to be linked to the overnight statement by China’s Li who said that China is to allow foreign central banks in onshore forex market.
AUD continued to be supported by the strength in copper prices and better than expected employment data, which advanced to its highest level since mid-July, with the pair trading at its highest level since late August. While New Zealand saw the RBNZ cut the OCR by 25bps and added that further easing seemed likely and will be data dependant.
In commodities, WTI has seen a pull back from yesterday’s API driven losses despite the risk off sentiment as the EIA have decreased their crude oil production forecast for 2015 and 2016, furthermore Cushing inventories decreased by 1.15mln bbl last week despite API crude supplies showing a build 2.1 min. Elsewhere, the metals complex has seen copper continue to benefit from the closure of two of Glencore’s African mines and trades at its highest level since mid-July, with AUD finding strength in sympathy with the base metal, trading at its highest level since late August. Looking ahead, today sees the EIA natural gas storage change data and the weekly DoE inventories update.
On the US calendar we have import price index, initial jobless claims and wholesale inventories and trade sales data all due.
Overnight Bulletin Summary from RanSquawk and Bloomberg.
- Cautious sentiment dominated the price action in early European trade as market participants reacted to yet another round of uninspiring data from China, as well as France.
- Demand for safe-haven assets, which in turn resulted in Bunds outperforming USTs on the back of policy divergence flow, failed to weigh on USD/JPY which remained bid amid the growing expectation of further easing by the BoJ.
- Today sees the latest monetary policy announcement by the BoE, US weekly jobs data, EIA natural gas storage change data and the weekly DoE inventories update
- Treasuries decline for a third day despite losses in global stocks as week’s auctions conclude with $13b long bonds; WI yield 2.985% vs. 2.880% in August.
- “The flight-to-quality trade has become overwhelmed with selling as investors use higher prices to liquidate positions before a possible Fed rate hike or as central banks need reserves to support their currencies,’” ED&F Man head of rates Tom diGaloma writes in note
- China’s yuan strengthened 1% in Hong Kong, poised for the biggest one-day advance since offshore trading began five years ago, spurring speculation PBOC intervened in the market
- China will open its domestic forex market to overseas central banks, making it easier for other nations to hold yuan assets as it pushes for the currency to win IMF reserve status
- China’s consumer prices rose at the fastest pace in a year as a pork supply crunch drives up the cost of the staple while factory-gate deflation deepened to the worst in almost six years, compounding challenges for policy makers
- BOJ should expand its monetary easing program by at least 10t yen ($83b), ruling Liberal Democratic Party lawmaker Kozo Yamamoto said, adding that its Oct. 30 policy meeting would be a “good opportunity” to add stimulus.
- S&P cut Brazil’s credit rating to junk, a decision underscoring the nation’s worsening economic and political prospects and which threatens President Dilma Rousseff’s ability to avoid further deterioration
- Sovereign 10Y bond yields mixed. Asian and European stocks fall, U.S. equity- index futures rise. Crude oil and coppper rise, gold little changed; copper gains
DB’s Jim Reid completes the overnight market wrap
The story of the last 24 hours has been the huge swing in sentiment between the 7.71% rise in the Nikkei yesterday morning and the immediate halo effects to the eventual turnaround that saw the S&P 500 close -1.39% lower. The sharp turnaround in US equities is being attributed largely to weakness in energy stocks as we saw a decent selloff in the Oil complex with Brent (-3.92%) and WTI (-3.90%) both tumbling despite a forecast cut for US crude oil production in 2015 and 2016 from the EIA, although the subsequent justification is that the void may be filled from higher OPEC production. Apple also weighed on sentiment yesterday as the latest product launch appeared to disappoint investors, but before we dig deeper into yesterday’s moves, it’s straight to China where we’ve got more data to digest.
August inflation readings this morning have made for some contrasting reading. China’s CPI has risen four-tenths from July to +2.0% yoy, ahead of expectations of a rise to +1.8% and up to the highest level in 13 months. However there’s been no let up in deflationary pressures at the factory gate where PPI has fallen five-tenths to -5.9% yoy (vs. -5.6% expected), marking the 42nd consecutive month of deflation. The uptick in CPI however is seemingly being blamed on higher pork prices, rising +19.6% yoy while food prices alone were up +3.7% yoy in August. In fact taking food and energy out of the equation, CPI has remained unchanged for the past three months at 1.7%.
Bourses in China have weakened as we head into the midday break with the Shanghai Comp currently -0.96%. After the huge rally we saw in Japanese equities yesterday, the Nikkei and Topix have tumbled -3.30% and -2.43% respectively, while the Hang Seng (-2.15%) and ASX (-2.20%) have also seen some decent falls. EM currencies have weakened modestly this morning, while Oil is down another 1.5%. Meanwhile the NZD has fallen 2% after the RBNZ cut rates by 25bps to 2.75% as expected, but signalling further easing may be ahead.
Back to markets yesterday. US credit indices also succumbed to a turnaround in sentiment with CDX IG eventually finishing the session 1.7bps wider after an early 2bps rally. The bigger story however was a bumper and record breaking day for primary market issuance across the pond. Marking the end of a summer lull in style and on the back of a busy Tuesday, 17 deals priced yesterday which tied for the most of all time, while total volume of $26.8bn was the second busiest of the year and fourth busiest day of all time according to the FT. Meanwhile the 33 tranches priced yesterday easily surpassed the previous record of 29 set in November last year. Some impressive numbers all round and its interesting that despite a bad year for performance, the US market remains open for supply.
With the Treasury market also adjusting to the deluge of issuance yesterday, the benchmark 10y did touch an intraday high in yield of 2.252% – the highest since August 6th – before a 10y Auction later in the day, which drew the highest yield since June, saw yields decline sharply, eventually finishing at 2.201% (and up a modest +1.8bps on the day). The data flow was supportive with a better than expected JOLTS job openings print for July (5.75m vs. 5.30m expected), up 430k from the previous month in the single biggest monthly gain since April 2010, although markets were little changed following the data. In the FX space the Dollar had a volatile session but the Dollar index eventually pared all of its intraday gains to finish more or less unchanged (-0.02%). September liftoff expectations remain unchanged versus this time yesterday, still priced at 28%.
On that subject, DB’s Chief US Economist Joe Lavorgna yesterday shifted his view for liftoff timing from the September meeting to October, listing seven reasons for a change of view. Those reasons are listed as follows; 1) Global equity markets are fragile, for example the S&P 500 declined 11% over a six-day span last month. 2) The broad trade-weighted dollar continues to make new highs, so having an appreciable negative effect on net exports and real GDP in Fed models. 3) Financial markets are not discounting a Fed hike this month and history is clear that policymakers are loathe to disappoint financial markets. 4) Several key FOMC voters appear to be subtly backing away from a September move, namely Lockhart, Dudley and Williams. 5) There are still two more FOMC meetings in 2015 after next week, meaning the Fed could wait to see if financial markets settle down and if there is any negative impact on business and consumer confidence from recent market gyrations. 6) The Fed will not believe it loses market credibility, at least in its own collective mind, if policymakers refrain from a hike this month. 7) Inflation continues to undershoot the Fed’s target with little evidence of a near-term reversal in trend.
Prior to the selloff in US equities yesterday, European markets had enjoyed a reasonably strong session on the back of the gains in Asia with the Stoxx 600 closing up 1.33%. On the back of last week’s ECB meeting and Draghi comments, ECB board member Praet said yesterday that the asset purchase program is ‘largely producing its desired effects’ and that ‘we judge that the recent volatility in financial markets has not materially affected this picture, although close monitoring and continuous assessment are warranted from a monetary policy perspective’. Praet also added that the effectiveness of these asset purchases would be enhanced by complementary measures from other policymakers, particularly through structural reforms.
Away from the comments, the focus of the data yesterday was one of some soft production numbers out of the UK. Industrial production declined 0.4% mom in July, well below expectations of a +0.1% gain. Manufacturing production was also weak meanwhile, falling 0.8% mom during the month (vs. +0.2% expected) and dragging the annualized rate down to -0.5% yoy, from a +0.5% reading. That was the first negative yoy reading since August 2013 and DB’s George Buckley noted that much of the fall was due to capital goods and earlier than usual motor production shutdowns. He did however note that he would not be surprised to see a rebound in August, but nevertheless a strong Q3 is now trickier to achieve given the sharp downturn during July.
Before we take a look at today’s calendar, surprising the market late last night was the sooner than expected news that S&P had downgraded Brazil’s sovereign rating to junk (from BBB- to BB+). The move was attributed to the pressure of political challenges weighing on the government’s ability and willingness to submit a 2016 budget to Congress consistent with the policy correction signalled by President Rousseff. The rating has been left on negative outlook and in the process Brazil has now joined Russia in being the second BRIC economy with a junk rating at S&P.
Turning over to today’s calendar now. Data wise in Europe this morning the only releases of note are out of France where we get industrial and manufacturing production readings. This is before the BoE meeting around midday today. Over in the US this afternoon the calendar picks up a bit with the import price index, initial jobless claims and wholesale inventories and trade sales data all due.
end
Losses from the US session extended following comments in one of the government’s official mouthpieces that“China doesn’t need massive stimulus.” A Central Bank of New Zealand rate cut (blaming China’s devaluation) sent Kiwi tumbling, Ringgit hit a fresh 17 year low against the USD, Japanese stocks collapsed over 650 points so far, and Chinese stocks are opening notably lower. Volume remains de minimus (99% below average) in Chinese futures trading as China devalues the Yuan by the most since Aug 13 and injects another 80 billion Yuan liquidity.
US weakness did not help but once this hit early on in the Asia session…
- CHINA DOESN’T NEED MASSIVE ECONOMIC STIMULUS: FINANCIAL NEWS
Adding:
- *CHINA FACES DOWNWARD PRESSURE IN 2-3 YEARS: PBOC ADVISOR HUANG
- *CHINA YET TO FIND NEW GROWTH PILLARS: PBOC ADVISOR
Losses grew.
* * *
The Bank of New Zealand cut rates:
- *NEW ZEALAND CUTS KEY INTEREST RATE TO 2.75% FROM 3.00%
- *WHEELER: SIGNIFICANT YUAN DEVALUATION WOULD BE BIG WORRY
- *RBNZ SAYS FURTHER NZD DEPRECIATION IS APPROPRIATE
Slamming Kiwi lower…
- *NEW ZEALAND DOLLAR DROPS MORE THAN 2% FOLLOWING RBNZ RATE CUT

The Maysian Ringgit dropped another 1% in the early trading – to its weakest since 1998…
- *MALAYSIA’S KEY STOCK INDEX OPENS DOWN 0.7% AT 1,592.16
- *MALAYSIAN RINGGIT DROPS 1% TO 4.3728 PER DOLLAR

Japanese stocks opened down 550 points at the cash open having fallen all day during the US session… Now down 650 points

Broad AsiaPac stocks are lower…
- *MSCI ASIA PACIFIC INDEX DROPS 2.2%, EXTENDING LOSS
And China opens weaker (despite Fink’s help)…
- *CHINA’S CSI 300 STOCK-INDEX FUTURES FALL 0.5% TO 3,308.4

As China injects another 80 billion Yuan…
- *PBOC TO INJECT 80B YUAN WITH 7-DAY REVERSE REPOS: TRADER
And then devalues The Yuian by th emost since 8/13…
- *CHINA SETS YUAN REFERENCE RATE AT 6.3772 AGAINST U.S. DOLLAR
- *CHINA WEAKENS YUAN FIXING BY 0.22% TO 6.3772/USD

Perhaps the recent Treasury selling gave them enough to hold the Yuan down here?
Charts: Bloomberg
end
Another big story: During the night just after the POBC devalued its onshore yuan, they intervened in the market place and raised the offshore yuan dramatically. The Chinese want to lower the spreads between the two yuan values. Before the intervention, the offshore yuan was 6.46 yuan to the dollar and the onshore was 6.36. Now the two rates are only .4% apart. Speculators who have gone short offshore yuan were annihilated.
(courtesy zero hedge)
Yuan Soars Most On Record In Offshore Market As PBoC Intervenes
“The continued devaluation of the yuan is definitely not conducive to the currency becoming internationalised. This is not our policy preference.”
That’s from Chinese Premier Li Keqiang who spoke on Wednesday at the World Economic Forum in the northeastern port city of Dalian. Li also announced that China is set to allow foreign central banks access to the onshore interbank FX market, a move designed to buoy the country’s bid for SDR inclusion and hasten the currency’s internationalization.
Here’s what Irene Cheung, a currency strategist at Australia & New Zealand Banking Group in Singapore had to say about the above (via Bloomberg):
“This is a step toward internationalization of the yuan [but] the gap between onshore and offshore yuan will narrow only when China’s economic fundamentals get better.”
Or when the PBoC gets fed up and decides to intervene. Read on.
As the $94 billion FX reserve burn in August made clear, the yuan has come under continuous pressure in the wake of the PBoC’s switch to a new currency regime on August 11, reflecting the market’s expectation of a continually weaker currency. That pressure has manifested itself in the spread between the onshore and offshore spot which Beijing is keen on narrowing as part of the broader effort to rein in speculation that the yuan will continue to drop.

Late last month, in a kind of roundabout effort to narrow the spread, China slapped a 20% reserve requirement on FX forwards. That move, analysts said, was unlikely to do the trick. “The spread on CNY and CNH may not substantially narrow on this move alone, as global demand on dollar remains high and China economic growth remains slow,” Andy Ji, a Singapore-based currency strategist at CBA told Bloomberg at the time.
As we’ve seen with China’s efforts to arrest the SHCOMP’s terrifying slide and as is abundantly clear from the PBoC’s willingness to intervene heavily in the onshore FX market, China is perfectly willing to force the issue when things aren’t going its way, which is why it shouldn’t come as that big of a surprise that the PBoC looks to have intervened in the offshore spot market overnight (via agency banks of course) on the way to triggering the biggest CNH rally in history. Here’s Bloomberg:
The yuan was headed for a record gain in the freely-traded offshore market, spurring speculation China’s central bank intervened to deter bets against its currency.
The yuan strengthened 1 percent to 6.4013 per dollar as of 6 p.m. in Hong Kong, poised for the biggest one-day advance since offshore trading began five years ago, according to data compiled by Bloomberg. The currency closed little changed in Shanghai at 6.3772 and its discount in the offshore market shrank to 0.4 percent from 1.4 percent.
“There is talk of intervention driving the offshore yuan,” said Khoon Goh, a Singapore-based strategist at Australia & New Zealand Banking Group Ltd. “It would seem that they are trying to dampen depreciation expectations and drive a narrowing of the onshore-offshore spread,” he said, noting that it is unusual for the People’s Bank of China to intervene outside of the domestic market.
Yes, “talk of intervention”. For those curious as to why traders are “talking”, here’s the chart:

“China wants to converge the three yuan rates: the fixing, the onshore and offshore spot rates,” Tommy Ong, managing director for treasury and markets at DBS Bank Hong Kong told Bloomberg, adding that “the fight has been quite extreme. There’s been quite a number of short yuan trades and volatility has jumped a lot, especially for the offshore yuan.”
In what looks like confirmation of the above, traders reported “Chinese-named” banks selling USD/CNH, likely on behalf of the PBoC. Here’s a bit more color from Reuters:
The intervention caught the market wrong-footed and was seen by traders as another bold gesture by Chinese authorities to shake out speculators and dampen expectations for further depreciation in the yuan following its devaluation in August.
The offshore yuan spot rate strengthened more than 1 percent to 6.39 per dollar from 6.4698 earlier in the day as the suspected intervention prompted those betting on yuan depreciation to cover their positions. Offshore traded volumes spiked as much as 10 times their monthly average, Thomson Reuters data showed.
The jump took the offshore yuan rate to its strongest level since early August when the central bank surprised markets by devaluing the currency nearly 2 percent.
“The big picture is that policy makers are doing everything they can do to dampen expectations that the yuan will depreciate much,” said Mark Williams, an economist at Capital Economics in London.
“There’s been rumours before of state entities acting on behalf of the central bank offshore. It shows that policymakers are unwilling to relax control of key variables that now include the offshore currency.”
The offshore yuan discount to the onshore yuan spot market narrowed to 0.47 percent after the suspected intervention, from 1.56 percent on Wednesday.
“In the very extreme moment of the buying, we saw a rare reverse market quote in the Chinese currency which is an indicator that the buyers wanted to push up the value of the yuan at any cost,” said the head of local currency trading at a U.S. bank in Hong Kong.
A “reverse market quote” refers to when the bid price is higher than the offer price, which traders said pointed to intervention.
“There are some Chinese banks steadily buying large amounts of yuan,” said a trader at an Asia commercial bank in Hong Kong.
“But even if it is intervention by the central bank, I don’t think it will change the expectation on the depreciation of yuan.”
Maybe not, but it sure is amusing to watch. Note the rationale here: this is China intervening in the hopes that said intervention will make further intervention unecessary. That is, rampant speculation that the yuan will continue to depreciate is forcing the PBoC to intervene in the onshore market and at an extremely high cost both in terms of the country’s FX reserves and in terms of the deleterious effect the reserve liquidation has on liquidity. Devaluation expectations are at least partly manifesting themselves in the offshore spot market so ultimately, the PBoC figures it will try intervening there in the hopes that narrowing the spread will mean it has to intervene less in the onshore market.
Summarizing the above in four words: one more spinning plate.
* * *
Bonus: color from Nomura on further efforts to reduce the onshore/offshore spread
The PBoC has relaxed the requirements for multinational corporations in China to participate in the cross-border RMB cash-pooling scheme. Under the scheme, MNCs in the Shanghai Free Trade Zone and several pilot cities are able to pool RMB cash to centralize and standardize risk management, debt service, and working capital transfers.
With these changes, revenue requirements for participating companies’ onshore and offshore entities have been reduced to RMB1bn and RMB200mn respectively, from RMB5bn and RMB1bn previously. This enlarges the number of companies that can now participate.
More significant in our view, is that the PBoC has increased the upper limit for the net amount of inflow to the RMB cash pool 5 times by raising the Macro Prudent Policy Index to 0.5 from 0.1 previously.
For CNH, the increase in capacity for corporates to remit RMB back into the onshore RMB cash pool will pressure USD/CNH lower [and] this measure will help to reduce the gap between onshore spot USD/CNH over spot onshore USD/CNY.

Earlier this year, China announced that they intend to create a competing gold market to the West by setting precious metal prices in the Yuan rather than the dollar. And in a new move announced on Sept. 9, the Shanghai International Energy Exchange appears to be planning a new oil futures market that will not only go head to head with the current Brent and WTI markets, but will be a direct attack against the petro-dollar system as they intend to denominate their contracts using the Yuan as the sole currency.
China’s energy markets have exploded after they signed a historic oil and gas contract with Russia to receive natural gas and petroleum from them over the next 30 years. And since that initial agreement took place, both Russia and China have agreed to bypass the dollar as the medium of exchange for the selling of this oil and gas, and instead transact their agreements using the Yuan.
China is planning to launch its own oil benchmark in October, similar to Brent and WTI, striving for a more important role in establishing crude prices. Unlike the Western benchmarks, the Chinese contracts will be nominated in the yuan, not the US dollar.
Shanghai International Energy Exchange sent a draft futures contract to market players in August, Reuters reported quoting sources.
A Shanghai-based contract will compete in the crude futures market, which is worth of trillions of dollars and is dominated by two contracts, London’s Brent, seen as the global benchmark, and WTI, the key U.S. price. – Russia Today
Over the past three years China has accelerated their move towards ending the dollar as the singular reserve currency for international trade, and they have done this by replicating nearly every financial market and institution governed currently by the West. From the Asian Infrastructure Investment Bank to replace the functions of the IMF, to the BRICS Bank that works similar to the World Bank, their creation of a new gold pricing platform that is to be coupled with an oil futures market will provide the world economies a choice in whether to remain with the dollar standard, or move towards a more stable and direct currency to engage in trade with without having to use the global reserve as a middleman.
It is said that oil is the true global reserve currency, and that those who control the production, distribution, and pricing are the real masters of global finance. And ever since 1973 when the U.S. signed an agreement with OPEC to denominate oil sales in dollars, Washington has held sway over the global financial system. But now 42 years later, this hegemony appears to be finally breaking, and China is firing its strongest salvo in attempting to break the petro-dollar once and for all by setting up a new and competing market for the pricing of oil.
end
This is very worrisome as even Krugman believes that Abenomics has killed Japan;
(courtesy zero hedge)
Paul Krugman Is “Really, Really Worried” That He Might Have Screwed Up Japan
Late last year, a very important and very “powerful” man took a field trip to Japan to observe Keynesian insanity prowling around in its natural habitat…

That’s right, last November Paul Krugman – the mere mention of whom is enough to strike terror in the hearts and minds of the sane – found himself in a limousine with Japanese economist Etsuro Honda who was intent on securing the Nobel laureate’s help in convincing Prime Minister Shinzo Abe to delay a planned (and prudent) sales tax hike. As a reminder, here’s how Bloomberg described the “historic” series of events:
When Japanese economist Etsuro Honda heard that Paul Krugman was planning a visit to Tokyo, he saw an opportunity to seize the advantage in Japan’s sales-tax debate.
With a December deadline approaching, Prime Minister Shinzo Abe was considering whether to go ahead with a 2015 boost to the consumption levy. Evidence was mounting that the world’s third-largest economy was struggling to shake off the blow from raising the rate in April, which had triggered Japan’s deepest quarterly contraction since the global credit crisis.
Honda, 59, an academic who’s known Abe, 60, for three decades and serves as an economic adviser to the prime minister, had opposed the April move and was telling him to delay the next one. Enter Krugman, the Nobel laureate who had been writing columns on why a postponement was needed.
It was in a limousine ride from the Imperial Hotel that Honda told Krugman, 61, what was at stake for the meeting. The economist, who’s now heading to the City University of New York from Princeton University, had the chance to help convince the prime minister that he had to put off the 2015 increase.
The concept of outside opinion influencing Japanese decision-making is known as gaiatsu, or foreign pressure, in Japanese, and has historical precedent since at least the arrival of U.S. Commodore Matthew Perry’s squadron in 1853 in Tokyo Bay, which led to an opening in the nation’s trade policies. Gaiatsu also has been used as cover by Japanese officials when they’ve pushed through controversial measures.
Krugman plays down his role, saying the Nov. 6 meeting with Abe “was very straightforward.”
But Honda tells a different story:
“That nailed Abe’s decision — Krugman was Krugman, he was so powerful.”
Yes, “Krugman was Krugman,” which means everyone in attendance was subjected to 40 minutes of crisply-worded nonsense and unlike Deputy Riksbank Governor Per Jansson – who, earlier this year,suggested that Krugman “write fewer articles and have more of a look at the data” after Krugman essentially accused Sweden’s central bank of being an evil cabal of job-hating heretics motivated by an overwhelming (not to mention completely inexplicable) desire to perpetuate global inequality by enriching creditors at the expense of impoverished debtors – no one had the good sense to tell him to shut up.
Sure enough, the tax hike was delayed.
Just days earlier, Krugman penned the following laughably ridiculous words in a blog post explaining why Japan should avoid doing anything that could be mistaken for a rollback of Abenomics:
When I see, say, the IMF inserting into its latest Japan survey a section titled “Maintaining focus on fiscal sustainability” my heart sinks (and so, maybe, does Abenomics); [even though] it’s hard to argue against sustainability.
It sure is, but Krugman will do it and powerful people will unfortunately listen and by the time everyone realizes that efforts to micromanage economic outcomes and smooth out the business cycle by cranking up the printing presses and gluing rates to the zero lower bound have failed it will be far, far too late to normalize which of course is precisely what’s unfolding across the world today.
We retold the story presented above because on Thursday a very funny thing happened: Paul Krugman told an audience in Tokyo that he is “really, really worried” that Abenomics might fail. Here’sBloomberg:
Nobel laureate Paul Krugman said risks of failure are growing for Prime Minister Shinzo Abe’s “Abenomics” campaign to end Japan’s two-decade slump.
“I’m still really, really worried,” Krugman said at a conference in Tokyo on Wednesday. A big problem remains building enough momentum in the economy to escape deflation, he said.
“Japan has spent a long time in this deflationary trouble,” said Krugman, who helped convince Abe to delay another planned increase in the nation’s sales tax after a hike in April last year pushed the world’s third-biggest economy into a recession.
Japan needs to reach a point where everyone believes that it has pulled out of deflation, he said. “And then if that can be believed, then it may be able to stay out of trouble thereafter,” he said.
Reading that, we’re reminded of BoJ cheif Haruhiko Kuroda, who, back in June, hilariously likened himself and his fellow DM central bankers to Peter Pan when he said the following about what’s needed to perpetuate the central bank omnipotence myth:
“I trust that many of you are familiar with the story of Peter Pan, in which it says, ‘the moment you doubt whether you can fly, you cease forever to be able to do it.’ Yes, what we need is a positive attitude and conviction.”
What Krugman and Pan are both tacitly admitting, is that Abenomics has demonstrably failed and the only thing that can save Japan now is for everyone to suspend disbelief in the face of voluminous evidence that what Kuroda and Abe (at Krugman’s behest) are doing simply isn’t working.
And because “Krugman is Krugman”, we’re never more than one Google search away from a hilarious soundbite from the New York Times blog archives, and so it’s with great pleasure and with everything said above in mind, that we leave you with the following excerpt from a Krugman classic entitled “Why Keynes Is Slowing Winning” ca. 2014:
“Why does the tide finally seem to be turning? Partly, I think, it’s just a matter of time; after six years it’s becoming hard not to notice that the anti-Keynesians have been wrong about everything. And the refusal of almost everyone on the anti-Keynesian side to admit any kind of error has gradually made them look ridiculous.”
Austrian Central Bank Warns Fed, “Rate Hikes Will Slow Global Growth”
The World When The Fed Raises Rates
The United States Federal Reserve is the world’s most powerful bank, and its most powerful component is the Federal Open Market Committee (FOMC), the twelve men and women who meet eight times a year to determine – essentially by setting interest rates – the monetary policy of the world’s largest economy. The last time the Fed raised interest rates was in 2006, before the growth-sapping impact of the global financial crisis persuaded it and other central banks to lower rates effectively to zero and to employ so-called quantitative easing (QE) to pump money into advanced economies.
But this year, for the first time since 2007, every advanced economy in the world is growing – including America’s. And that means that the FOMC, fearful of asset bubbles, will at some point decide that America’s interest rates must rise. That may (or may not, depending on the timing) be good for the US economy, but what will it mean for the rest of the world?
Our research shows why the world, especially emerging countries, will be paying nervous attention. In mid-2013, when the Fed announced that it would gradually reduce its unconventional monetary-policy measures (for example, large-scale purchases of mortgage-backed securities), emerging markets suffered large capital outflows. In other words, when the Fed even hints at tightening monetary policy, other countries suffer. Depending on just how much the FOMC decides to tighten at a future meeting, we foresee negative effects on world GDP in the medium term, not only for emerging markets but also for industrialized economies.
Since the Fed started to curb its QE program, there has been constant speculation over just when its current accommodative monetary policy will end. Market participants, be they lenders or borrowers, know that “easy money” has an expiry date. They can see that after three large asset-purchase programs, the Fed’s balance sheet has more than quadrupled since 2007, totaling about $4.5 trillion in February 2015.
However, when assessing what the FOMC intends to do, it is important to bear in mind that the Fed’s mandate is to advance America’s national economic goals. This means that it has to consider not just the desirable rate of inflation (the target is a 2% annual rate), but also the state of the labor market – and its judgment has global implications.
That is why the Fed’s talk in mid-2013 about a gradual exit from unconventional monetary policy led to a so-called “taper tantrum” among investors, triggering a surge in global volatility and a shift in market sentiment against emerging markets. The question now is whether future changes by the FOMC in the federal funds rate (the interest rate at which banks lend each other their overnight money deposited at the Fed) will have similar, or indeed worse, effects.
To narrow any gap between its expectations for the economy and those of the public, the Fed publishes each FOMC member’s view of the range of interest rates that should be expected over the next few years. A member with a positive assessment of the US economy’s growth prospects will expect a rise in the federal funds rate; a pessimist will expect the rate to stay close to zero for a longer period.
Using information released by the Fed in March, we have constructed two scenarios: “lift-off” is based on the maximum projected interest rates, while “delayed lift-off” is based on the minimum. To see the impact beyond America on GDP, consumer prices, exchange rates, and interest rates, we then apply the scenarios to a total of 36 emerging and advanced economies that together account for 90% of global output.
Assuming a phased rise in the federal funds rate to 4% by 2017, we believe that economic growth in all regions except Latin America will slow in 2016, and then slow even more in 2017. The cumulative loss in this “lift-off” scenario is about ten times as large as any lost economic output under the “delayed lift-off” alternative of only minimal changes to rates over the next couple of years.
Our research shows that any monetary tightening by the Fed will affect the rest of the world, but to differing degrees. Those emerging markets that were hit severely during the “taper tantrum” episode – for example, Brazil, Indonesia, and Turkey – will certainly suffer. But the greatest negative impact will be on countries such as Canada and Mexico, which have close trade links with the US economy or those, like Germany, Japan, and Singapore, that are deeply integrated into the global economy.
In other words, though emerging markets – through their dependence on capital inflows – will be at risk when America’s monetary policy eventually returns to “normal,”the same will be true for advanced economies.
end
US Warns Of “Unprecedented” Russian Military Buildup In Syria: “It’s Starting To Look Like Crimea”
On Wednesday, we brought you an in-depth look at the latest from Syria where Russia is apparently in a mad dash to send reinforcements to Assad and his depleted army at Latakia (or at least that’s the narrative being pushed rather hard by Western media).
Meanwhile, France and Britain have apparently decided that the best way to stem the flow of refugees to Western Europe is to bomb the country from which the refugees are fleeing, which means that in relatively short order, the skies above Syria will be filled with French, British, American, Turkish, and Russian jets, a situation which quite clearly has the potential to cause an “accident.”
With the war drums now beating loudly, the media is keen on documenting anything that even sounds like it might be incremental which, in combination with the fact that situation on the ground truly is rather fluid, means we get more color on the situation with each passing hour. Case in point, from Reuters:
Russian forces have begun participating in military operations in Syria in support of government troops, three Lebanese sources familiar with the political and military situation there said on Wednesday.
The sources, speaking to Reuters on condition they not be identified, gave the most forthright account yet from the region of what the United States fears is a deepening Russian military role in Syria’s civil war, though one of the Lebanese sources said the number of Russians involved so far was small.
And here’s more from the Kremlin, where spokeswoman Maria Zakharova offered a damning (not to mention amusingly accurate) indictment of how Washington has sought to characterize Moscow’s relationship with Damascus:
Russia has decried the U.S. pressure over the flights as “international boorishness” and dismissed reports of a build-up in Syria in general terms.
But Russian officials have repeatedly dodged questions over whether there has been a recent increase in military assistance to Assad and Moscow has not unequivocally denied any build-up of its forces in Syria.
“First we were accused of providing arms to the so-called ‘bloody regime that was persecuting democratic activists’,” said Maria Zakharova, spokeswoman for the Russian foreign ministry.
“Now it’s a new edition – we are supposedly harming the fight against terrorism. That is complete rubbish.”
All of that comes on the heels of reports out on Wednesday which suggested that Moscow had sent tank landing ships and additional cargo planes to the country prompting Washington to remind the Kremlin that any efforts to prop up the Assad regime are absolutely unacceptable:
“We would welcome constructive Russian contributions to the counter-ISIL effort, but we’ve been clear that it would be unconscionable for any party, including the Russians, to provide any support to the Assad regime,” White House spokesman Eric Schultz said.
Reuters’ unnamed Lebanese sources also suggested that Russia has moved to establish an inland forward operating base, a move they say “indicates the Russians have decided to join the war against terrorism”, a war which, as discussed here on Wednesday, no foreign military seems very interested in fighting as evidenced by the fact that rebels battling Islamic State near Marea told WSJ they are “fighting ISIS by themselves.”
And speaking of ISIS, the group is apparently close to taking one of Assad’s last strongholds in the east (via Reuters):
Dozens of Syrian government troops and Islamic State fighters have been killed in fighting around a government-held air base in eastern Syria in a region that is a stronghold for the jihadists, a monitoring group said on Thursday,
Islamic State used at least two car bombs in its latest assault on the air base near the city of Deir al-Zor, where government troops are holed up, the Syrian Observatory for Human Rights said.
It said at least 18 soldiers and 23 Islamic State fighters had been killed. The base is one of President Bashar al-Assad’s last footholds in eastern Syria. There was no mention of the attack on state media.
So while all of the multifarious rebels, “freedom fighters”, “moderate” jihadists, “radical” jihadists, and makeshift contingents do exactly what they were intended to do from the start (i.e. destabilize the Assad regime) both the West and Russia are busy preparing for the possibility that realizing their respective visions for Syria’s political future may ultimately mean open warfare and make no mistake, warhawks in Washington are happy to perpetuate the narrative as is the GOP’s media mouthpiece. Here’s Fox News:
U.S. officials are expressing growing concern about Russia’s military build-up in Assad-controlled Syria, calling it “unprecedented.”
“It’s beginning to look like Crimyria [sic],” the official told Fox News.
Yes, it’s starting to look like “Crimyria” and by that we assume Fox means “Crimea”, and if they’re right, the Kremlin may be on the verge of taking the “proxy” out of the Syrian proxy war.
end
Russian forces have begun participating in military operations in Syria in support of government troops, three Lebanese sources familiar with the political and military situation there said on Wednesday.
The sources, speaking to Reuters on condition they not be identified, gave the most forthright account yet from the region of what the United States fears is a deepening Russian military role in Syria’s civil war, though one of the Lebanese sources said the number of Russians involved so far was small.
U.S. officials said Russia sent two tank landing ships and additional cargo aircraft to Syria in the past day or so and deployed a small number of naval infantry forces.
The U.S. officials, who also spoke on condition of anonymity, said the intent of Russia’s military moves in Syria was unclear. One suggested the focus may be on preparing an airfield near the port city of Latakia, a stronghold of Syrian President Bashar al-Assad.
U.S. officials have not ruled out the possibility that Russia may want to use the airfield for air combat missions.
U.S. Secretary of State John Kerry spoke to his Russian counterpart for the second time in four days to express concern over reports of Russian military activities in Syria, warning that it could fan more violence.
The White House said it was closely monitoring the situation.
Russia says the Syrian government must be incorporated into a shared global fight against Islamic State, the Islamist group that has taken over large parts of Syria and Iraq. The United States and Assad’s regional foes see him as part of the problem.
“We would welcome constructive Russian contributions to the counter-ISIL effort, but we’ve been clear that it would be unconscionable for any party, including the Russians, to provide any support to the Assad regime,” White House spokesman Eric Schultz said, using an acronym for Islamic State.
SYRIAN TROOPS PULLING BACK
Assad’s forces have faced big setbacks on the battlefield in a four-year-old multi-sided civil war that has killed 250,000 people and driven half of Syria’s 23 million people from their homes.
Syrian troops pulled out of a major air base last Wednesday, and a monitoring group said this meant government soldiers were no longer present at all in Idlib province, most of which slipped from government control earlier this year.
Moscow confirmed it had “experts” on the ground in Syria, its long-time ally in the Middle East.
But Russia has declined to comment on the scale and scope of its military presence. Damascus denied Russians were involved in combat, but a Syrian official said the presence of experts had increased in the past year.
Reflecting Western concern, Germany’s foreign minister warned Russia against increased military intervention, saying the Iran nuclear deal and new U.N. initiatives offered a starting point for a political solution to the conflict.
NATO Secretary General Jens Stoltenberg said reports of growing Russian military activity in Syria were a cause for concern, while France said it made finding a political solution to the crisis more complicated.
Two of the Lebanese sources said the Russians were establishing two bases in Syria, one near the coast and one further inland which would be an operations base.
“The Russians are no longer just advisors,” one of the sources said. “The Russians have decided to join the war against terrorism.”
RUSSIAN NAVAL BASE
Moscow’s only naval base in the Mediterranean is at Tartous on the Syrian coast in territory held by Assad, and keeping it secure would be an important strategic objective for the Kremlin.
Another of the Lebanese sources said that so far any Russian combat role was still small: “They have started in small numbers, but the bigger force did not yet take part … There are numbers of Russians taking part in Syria but they did not yet join the fight against terrorism strongly.”
The Syrian official said: “Russian experts are always present but in the last year they have been present to a greater degree.”
Officials in the United States, which is fighting an air war against the Islamist militant group Islamic State in Syria and also opposes Assad’s government, have said in recent days that they suspect Russia is reinforcing to aid Assad.
Washington has put pressure on countries nearby to deny their air space to Russian flights, a move Moscow denounced on Wednesday as “international boorishness”.
Russia has set out the case for supporting Assad in the most forthright terms yet in the past few days, likening the Western approach to Syria to failures in Iraq and Libya.
Part of the diplomatic quarrel has centred around use of air space for flights, which Moscow says bring humanitarian aid but U.S. officials say may be bringing military supplies.
U.S. officials, speaking on condition of anonymity, told Reuters on Wednesday that multiple Russian flights have passed over the airspace of Iran and Iraq to reach Syria.
RUSSIAN OVERFLIGHTS
The State Department said Russian use of Iranian airspace would not be surprising, given Tehran’s past support for Assad.
Spokesman John Kirby said the United States had advised “partners and our friends to ask the Russians tough questions about” overflight requests. He did not elaborate, saying only: “I’m not gonna detail diplomatic conversations.”
To avoid flying over Turkey, one of Assad’s main enemies, Russia has sought to fly planes over Balkan states, but Washington has urged them to deny Moscow permission.
On Tuesday, Bulgaria refused a Russian request to use its airspace citing doubts about the cargo on board. It said on Wednesday it would allow Russian supply flights to Syria to use its airspace only if Moscow agreed to checks of their cargo at a Bulgarian airport.
Turkey has not officially confirmed a ban on Russian flights to Syria but says it considers any requests to fly over its air space to Syria on a case by case basis.
Thus far in the war, Iran and its Lebanese ally Hezbollah have been Assad’s main sources of military support. The momentum turned against Assad earlier this year.
In the latest setback, state television reported government troops had surrendered an air base in northwestern Syria to a rebel alliance after nearly two years under siege.
This meant the last government troops had withdrawn from central Idlib province, according to the Syrian Observatory for Human Rights, a UK-based group that monitors the conflict. (Additional reporting by Suleiman al-Khalidi in Amman; Mark Hosenball and Lesley Wroughton in Washington; Writing by Tom Perry, Sylvia Westall, Peter Graff and Phil Stewart; Editing by Giles Elgood, David Storey, Grant McCool)
end
Your humour story of the day:
(courtesy zero hedge)
Abu Dhabi Can’t Find $1.4 Billion It Supposedly Received From Malaysia PM’s Slush Fund
Late last month, tens of thousands of Malaysians donning banned yellow attire took to the streets in Kuala Lumpur to call for the ouster of Prime Minister Najib Razak whose government has been accused of obstructing an investigation into how some $700 million from 1Malaysia Development Berhad mysteriously ended up in Najib’s personal bank account.
The story behind 1MDB would be hard to believe if it weren’t so familiar to anyone who understands how the inextricable link between politics and finance fosters deep seated corruption across the globe. Here’s the story, as told here last month:
MDB was set up by Najib six years ago and has been the subject of intense scrutiny for borrowing $11 billion to fund questionable acquisitions. $6.5 billion of that debt came from three bond deals underwritten by Goldman, whose Southeast Asia chairman Tim Leissner is married to hip hop mogul Russell Simmons’ ex-wife Kimora Lee who, in turn, is good friends with Najib’s controversial wife Rosmah Manso. What Goldman did, apparently, is arrange for three private placements, one for $3 billion and two for $1.75 billion each back in 2013 and 2012, respectively. Goldman bought the bonds for its own book at 90 cents on the dollar with plans to sell them later at a profit (more here from FT). Somewhere in all of this, $700 million allegedly landed in Najib’s bank account and the going theory is that 1MDB is simply a slush fund. So you can see why some folks are upset, especially considering Rosmah has a habit of having, how shall we say, rich people problems, like being gouged $400 for a home visit by a personal hairstylist.
As it turns out, the story goes well beyond Goldman, Najib, and Kimora Lee. As WSJ reports, the 1MDB debacle takes us deep into the shadowy world of sovereign wealth funds where it appears as though someone told a $1.4 billion lie:
The corruption scandal around an economic-development fund in Malaysia is spilling beyond the country’s borders, as officials at a United Arab Emirates state investment vehicle raise questions about more than a billion dollars in money that they said is missing.
Abu Dhabi has long been a source of support for the fund, 1Malaysia Development Bhd., which was set up six years ago by Malaysian Prime Minister Najib Razak to develop new industries in the Southeast Asian country. Now, as 1MDB tries to fend off a cash crunch, its backers in Abu Dhabi are asking what happened to a $1.4 billion payment the fund said it made but which they never received, two people familiar with the matter said.
The disputed payments are related to the purchase of power plants around the world by the Malaysian fund in 2012. A state investment fund in Abu Dhabi, the International Petroleum Investment Co., or IPIC, guaranteed the $3.5 billion in bonds that 1MDB issued to finance the purchase, according to the bond offering documents. In return, IPIC was to receive options to buy a 49% stake in the power plants as well as collateral for the bond.
According to 1MDB’s financial statements, the Malaysian fund made a collateral payment of $1.4 billion. A draft report into 1MDB’s activities by Malaysia’s auditor general, reviewed by The Wall Street Journal, said the payment went to a subsidiary of IPIC called Aabar Investments PJS.
IPIC’s consolidated financial statements, however, contain no reference to the receipt of the payment. Two people familiar with the matter said IPIC and Aabar never received the money. It isn’t clear what happened to the funds. 1MDB didn’t respond to requests for comment.
The dealings between the two countries shines a rare light on the workings of sovereign-wealth funds, which have increased significantly in size and are backed by wealthy governments but often lack transparency. The interactions between the two funds also are attracting scrutiny in Malaysia.
“This relationship is beyond a normal business relationship,” said Tony Pua, a member of the Malaysian opposition Democratic Action Party who sits on a parliamentary committee that also is investigating 1MDB.
As it turns out, UAE dismissed IPIC’s manager earlier this year and new management is apparently taking a close look at exactly what’s going on between the investment fund and 1MDB. The Journal goes on to say that IPIC has now taken over the bonds at the center of the dispute, along with the assets they were issued to finance and has also injected $1 billion into 1MDB.
More interesting still is this:
Aabar, the IPIC subsidiary, also helped 1MDB during a disputed audit. According to the Malaysia auditor general’s draft report, 1MDB fired KPMG LLP as its auditor in late 2013 after the firm declined to sign off on 1MDB’s accounts unless it received more details about $2.32 billion the fund said was invested in a Cayman Islands account.
Aabar stepped in and guaranteed the Cayman Islands funds, an official for Deloitte Touche Tohmatsu Ltd., which took over as 1MDB’s auditor, told a closed-door meeting of the parliamentary committee probing 1MDB, according to a transcript of the proceedings reviewed by the Journal. This guarantee was never made public. Deloitte later signed off on the fund’s accounts. KPMG and Deloitte declined to comment.
So in short, a subsidiary of an Abu Dhabi investment fund whose manager was fired this year has lost track of a $1.4 billion payment it supposedly received from 1MDB and this very same subsidiary guaranteed $2.3 billion in mystery money that may or may not be parked in the Cayman Islands in order to secure a sign-off from Deloitte after KPMG was dismissed as 1MDB’s auditor for asking too many questions.
Nope, nothing suspicious going on there.
Finally, as The Journal reported last week, Swiss authorities have frozen “tens of millions” in funds linked to 1MDB and have opened a criminal investigation into two executives and some other folks the identities of whom they will decide on later:
The Office of the Attorney General has frozen the money held in Swiss bank accounts linked to 1Malaysia Development Bhd., or 1MDB, on suspicion of corruption and money laundering, a spokesman said. He declined to give an exact figure for the amounts involved, but said it amounted to several tens of millions of dollars.
On Aug. 14, the OAG launched criminal proceedings against two executives of the fund, as well as what it called “persons unknown,” for suspected corruption of foreign officials, suspected misconduct in a public office and suspected money laundering, the spokesman said. The inclusion of “persons unknown” means the matter could grow to encompass other people.
What all of this suggests – beyond the rather obvious implication that a whole lot of people have been skimming money from 1MDB for pretty much as long as it’s existed – is that Najib’s political future in Malaysia is now in serious doubt.
The more information the public gets about corruption at 1MDB, the louder will be the calls for Najib’s head (figuratively speaking we hope), and the larger will be the street protests. Throw in the fact that the loudest calls for Najib’s exit come from former Prime Minister Mahathir Mohamad and it seems like a very good bet that the political (not to mention social) upheaval in Malaysia is just getting started and that is precisely what the country does not need as it desperately tries to hang on to its stash of hard fought FX reserves in the face of a plunging currency and looming financial crisis.
* * *
A picture of 1MDB begins to emerge…
Brazil Cut To Junk By S&P, ETF Falls 5% Post-Mkt
It’s not as if the writing wasn’t on the wall, and don’t say we didn’t warn you.
Brazil, whose economy officially slid into recession in Q2 – a quarter during which Brazilians suffered through the worst inflation-growth outcome (i.e. stagflation) in over a decade – and whose efforts to plug a yawning budget gap are complicated by political infighting and a growing public outcry against embattled President Dilma Rousseff, has been cut to junk by S&P.
- BRAZIL CUT TO JUNK BY S&P; OUTLOOK NEGATIVE
Unsurprisingly, the iShares MSCI Brazil ETF is trading sharply lower AH on the announcement:

S&P’s move comes as the country’s finance minister fights for his political life and as deficits on both the current and fiscal accounts paint a bleak picture, especially in the face of persistently low commodity prices, China’s move to devalue the yuan, and the impossible dilemma facing the central bank which, like its “LA-5” counterparts, can’t hike to combat a plunging currency for fear of exacerbating FX pass through inflation and can’t cut to boost the economy for fear of jeopardizing the 2016 4.5% target.

Expect this to get far, far worse before it gets better. Here’s the headline dump:
- S&P SEES BRAZIL REAL GDP CONTRACTION OF ABOUT 2.5% THIS YEAR
- S&P SEES BRAZIL REAL GDP CONTRACTION OF 0.5% IN ’16
- S&P SEES BRAZIL REAL GDP MODEST GROWTH IN 2017
- BRAZIL GOVT DEFICIT TO RISE TO AVG 8% GDP IN ’15, ’16, S&P SAYS
- BRAZIL WON’T HAVE PRIMARY FISCAL SURPLUS IN ’15, ’16: S&P
Here’s a look at the country’s twin deficits:

And here’s S&P with more color:
The negative outlook reflects our view that there is a greater than one–in–three likelihood that we could lower our ratings on Brazil again. We anticiapte that within the next year a downgrade could stem in particular from a further deterioration of Brazil’s fiscal position, or from potential key policy reversals given the fluid political dynamics, including a further lack of cohesion within the cabinet. A downgrade could also result from greater economic turmoil than we currently expect either due to governability issues or the weakened external environment.
“Junked” Brazil Is Falling Apart At The Seams; Cancels Bond Auction
Exactly one month ago, in the aftermath of the Chinese devaluation announcement, we made a simple prediction.
Today, following the overdue, long anticipated, and yet “shocking” downgrade of Brazil by the S&P to junk, this prediction is coming true.
First, here is the currency, which is plunging to a fresh YTD low of just below 3.91, and which has a long way to go at least according to SocGen which now sees the USDBRL rising to 4.4 over the next 8 weeks: a whopping 15% devaluation over the next 2 months!

In other words, it could get worse fast, and as Bloomberg notes the next step could be a circuit breaker: “Continued selloff in DIs would risk triggering circuit break, which kicks in when rates rise/fall 80bps vs prior day’s official BM&F fixing intraday. Trading of BM&F’s USD/BRL 1st future will be halted if price hits 4060.33, equivalent to a 6% move vs yday’s official closing at 3830.57; while spot BRL would continue to trade, liquidity likely to be very poor given dominant role of futures trading.”
* * *
Next, the Braziling ETF, the EWZ, is already pricing said devaluation in and was about 5% down as of this moment.

The Bovespa futures are looking very ungreen this morning.

But the biggest risk event for Brazil and its soaring double deficits, is that suddenly the entire nation which for years was so dependent on Chinese growth and is now giving it all back in spades, is that it is about to be locked out of the markets. Here’s why:
- BRAZIL TREASURY CANCELS LTN BOND AUCTION TODAY
This is the second LTN bond auction canceled in 1 week, and will lead many to ask: just how will Brazil – with its foundering economy (which we warned first about back in late 2014), and suddenly suddenly locked out capital markets, fund itself?
end
WTI Tumbles On Crude’s Biggest 2-Week Inventory Build In 5 Months Despite Production Tumble
Following last night’s 2.1mm barrel build forecast from API, DOE reported a bigger than expectd 2.6mm barrel inventory build. This is the largest 2-week build in crude stocks since April and has sent crude prices tumbling. On the other side, US production levels continue to drop (-0.9% this week) to its lowest level since January 2nd 2015.
Biggest 2-week inventory build in 5 months…

Sparking a reversal in this morning’s momo rally…

Which of course drags US equities lower…

Even as production levels tumble…

Charts: Bloomberg
Euro/USA 1.1188 down .0029
USA/JAPAN YEN 121.24 up .992 (provides the necessary ramp for stocks)
GBP/USA 1.5399 up .0043
USA/CAN 1.3243 down .0037
Early this Thursday morning in Europe, the Euro fell by 29 basis points, trading now well above the 1.11 level falling to 1.1188; Europe is still reacting to deflation, announcements of massive stimulation, a proxy middle east war, and the ramifications of a default at the Austrian Hypo bank, an imminent default of Greece and the Ukraine, rising peripheral bond yields, flash crashes and today crumbling bourses. Last night the Chinese yuan lowered in value . The USA/CNY rate at closing last night: 6.3768, rising .0162 (Yuan falling)/ Bourses were stimulated by the huge ramp in the USA/YEN to no avail last night.
In Japan Abe went all in with Abenomics with another round of QE purchasing 80 trillion yen from 70 trillion on Oct 31. The yen now trades in a southbound trajectory as settled down again in Japan up by 99 basis points and trading now just above the 120 level to 121.24 yen to the dollar.
The pound was well up this morning by 43 basis points as it now trades well above the 1.53 level at 1.5399.
The Canadian dollar reversed course by rising 37 basis points to 1.3243 to the dollar. (Harper called an election for Oct 19)
We are seeing that the 3 major global carry trades are being unwound. The BIGGY is the first one;
1. the total dollar global short is 9 trillion USA and as such we are now witnessing a sea of red blood on the streets as derivatives blow up with the massive rise in the rise in the dollar against all paper currencies and especially with the fall of the yuan carry trade. The emerging market which house close to 50% of the 9 trillion dollar short is feeling the massive pain as their debt is quite unmanageable.
2, the Nikkei average vs gold carry trade (blowing up)
3. Short Swiss franc/long assets (European housing/Nikkei etc. This has partly blown up (see Hypo bank failure).(blew up)
These massive carry trades are terribly offside as they are being unwound. It is causing global deflation ( we are at debt saturation already) as the world reacts to lack of demand and a scarcity of debt collateral. Bourses around the globe are reacting in kind to these events as well as the potential for a GREXIT>
The NIKKEI: this Thursday morning: up by 470.89 or 2.51%
Trading from Europe and Asia:
1. Europe stocks all in the red despite/(USA/Yen ramp)
2/ Asian bourses all in the red … Chinese bourses: Hang Sang red (massive bubble forming) ,Shanghai red (massive bubble ready to burst), Australia in the red: /Nikkei (Japan)red/India’s Sensex in the red/
Gold very early morning trading: $1107.50
silver:$14.70
Early Thursday morning USA 10 year bond yield: 2.21% !!! up 1 in basis points from Wednesday night and it is trading well below resistance at 2.27-2.32%. The 30 yr bond yield rises to 2.98 up 2 basis points.
USA dollar index early Thursday morning: 96.08 up 14 cents from Wednesday’s close. (Resistance will be at a DXY of 100)
USA/Chinese Yuan: 6.3768 up .0162 (Chinese yuan down/on shore)
Stocks Double-Dump As Dollar Slumps & Crude Pumps
If you did not use this phrase today at least once then you ar enot paying attention…
It all started with some manic manipulation overnight… in Asia…

And The US – S&P e-minis were halted twice…

But the equity algos flip-flopped between JPY and WTI Crude as the momentum igniters on the day… until NYMEX closed and ruinbed the game…

Trannies gapped higher at the open (but closed below their opening print) but everythijng faded in the afternoon

Note that it appears S&P/Dow’s failure to break overnight highs saw the rollover in stocks…

On the week, everything is green with Trannies soaring…

Avon may be sums up the craziness in today’s market…

But everyone’s favorite hedge fund hotel saw losses accelerate…

VXX (VIX ETF) saw another short squeeze in the afternoon (ahead of OPEX tomorrow)… but then eveything went nuts again in the last few minutes and VXX was crushed…

VIXSmash algo losing its mojo!!

Treasury yields were in general a one-way street despite the pump and dumps in stocks – some strength in bonds on weak inventories…

The US Dollar lost ground from the moment weak inventories data hit…

Crude surged (after the algos actually read the DOE data and saw production dropped), copper gained and silver and gold lifted on weaker dollar…

Charts: Bloomberg
Bonus Chart: Everyone looked at Brazil charts today.. so here is one you didn;t look at – Petrobras recently issued 100Y Bonds… which are now trading at 70c on the dollar – still “money good’?

Average:
What Happened At 6:12 AM This Morning?
Anyone waking this morning will glance at US equity futures and happily note its unchanged-ness relative to weakness in Asia overnight. But behind the scenes of the last 12 hours was a total and utter farce of price discovery failure. S&P 500 e-mini futures have been halted twice (0551ET anbd 0612ET) in what one market observer exclaimed “looks like manipulation to me.” So what exactly happened at 6:12am?
“unchanged”

As Nanex’s Eric Hunsader exposes “looks like manipulation to me…”

It appears the “markets” are starting to run our of excess room for th evarious central bank manipulations to take place without being utterly exposed for all to see.
As Nanex notes – liquidity has disappeared…
US weekly jobless claims total 275,000 vs 275,000 estimate
Reuters
the number of Americans filing new applications for unemployment benefits fell last week, suggesting a moderation in job growth in August was an aberration.
Initial claims for state unemployment benefits dropped 6,000 to a seasonally adjusted 275,000 for the week ended Sept. 5, the Labor Department said on Thursday. It was the 27th straight week that claims remained below the 300,000 threshold, which is usually associated with a strengthening labor market.
Claims for the prior week were revised to show 1,000 fewer applications received than previously reported. Economists had forecast claims falling to 275,000 last week.
A Labor Department analyst said there were no special factors influencing the data and only claims for Hawaii had been estimated.
The four-week moving average of claims, considered a better measure of labor market trends as it irons out week-to-week volatility, ticked up 500 to 275,750 last week.
The economy added 173,000 jobs in August, the fewest in five months. Economists, however, dismissed the step-down from July’s gain of 245,000 jobs as a technical distortion. A report on Wednesday showed job openings surged to a record high in July, suggesting solid labor demand in the near term.
Thursday’s claims report showed the number of people still receiving benefits after an initial week of aid rose 1,000 to 2.26 million in the week ended Aug. 29.
-END-
Record Gap Between US Inventories And Sales Screams Recession
The Wholesale Inventories-to-Sales ratio has now been stuck deep in recession territory since January as the malinvestment boom-driven deflation-beckoning dream of “if we build it they will come” inventory surges smashes into the ugly reality of peak-debt-based lack of consumption worldwide.Inventories dropped 0.1% in July (notably lower than the 0.3% rise expected and the biggest drop since May 2013), but worse still Wholesale Sales tumbled 0.3% (missing expectations of a 0.1% rise). So inventories dropped (bad for Q3 GDP) and sales dropped more (even worse) leaving July’s 1.30x inventories-to-sales ratio remains a flashing red beacon of over-capacity and looming production cuts (especially in Automakers).
Recession looms…

The absolute dollar size of the gap between Inventories and Sales has never been bigger and is the biggest flashing red light that an economic recession is now inevitable as part of the massive destocking, likely at deflationary dumping prices, that has to take place.

Led by Automakers over-building:

And sending ominous signals for Q3 GDP…

In short, the Fed’s timing for a rate hike couldn’t be better.
Charts: Bloomberg
This Is Bad News For Market Manipulators
It appears the “go to” manipulation to rig stocks higher –the so-called VIXtermination algo – has lost its juice…
A 1.5 vol crush in VIX managed a mere 6 point rise in the S&P 500 (20% of what would have been expected!!)
Riggers – you have a problem! Paging Larry Fink some new ideas…
Charts: Bloomberg
Why The Keynesian Chorus Is Cackling Like Chicken Little
Submitted by David Stockman via Contra Corner blog,
This is getting way too stupid. The Keynesian Chorus has launched a full blast trilling campaign, emitting an increasingly shrill cackle of warnings against a Fed rate hike. Yes, 80 months of pumping free money into the canyons of Wall Street is not enough.
Why?
Well, this is hard to type with a straight face, but according to the cackling gaggle of Keynesian Chicken Littles, the Fed has already tightened too much!
Paul Kasriel, the former chief economist at Northern Trust who now writes “The Econtrarian” blog, argues that “in recent months Fed monetary policy has become downright restrictive.”
Would that Kasriel could be dismissed as merely a Wall Street shill, but its seems that he’s taking his cues directly from John Maynard Keynes’ very vicar on earth. That would be Larry Summers, who yesterday blogged an identical bit of tommyrot:
I believe the case against a rate increase has become somewhat more compelling even than it looked two weeks ago…..First, markets have already done the work of tightening. The U.S. stock market is worth $700 billion less than it was 2 weeks ago and credit spreads have widened noticeably. Financial conditions as measured by Goldman Sachs or the Chicago Fed index have tightened in the last 2 weeks by the impact equivalent of more than a 25 BP tightening. So even if resisting inflation required a 25 BP tightening as of two weeks ago, this is no longer the case.
You can’t make this stuff up! And you don’t have to mince any words, either. This whole mantra that free money is actually tight money is the product of a tiny circle of academic scribblers and Wall Street hirelings who have invented what amounts to an alternate vocabulary of economic newspeak.
Exhibit number one is the Goldman Sachs Financial Conditions Index. As shown below, it purportedly has surged sharply toward “tightening” during the last 15 months.
In fact, using this index Professor Summers twists economic logic into a corkscrew. By his lights, today’s deeply negative real interest rates at -1.52% are actually far tighter than 30 years ago when real interest rates were +2.13%!
I am not exaggerating. That’s exactly what the man said:
The figure below makes a crucial point. It shows that even though the federal funds rate is very low (negative one and a half percent after adjusting for inflation, financial conditions are helping the economy less than in previous years when interest rates were much higher.
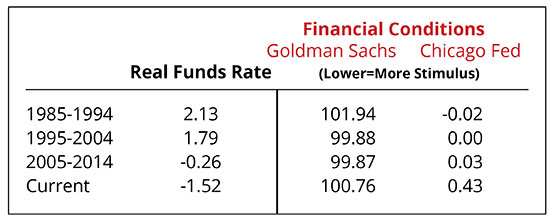
Here’s the thing, however. Would you actually buy a used car from Goldman Sachs?
It turns out that this purportedly scientific measuring rod is just a goal-seeked data concoction put together by none other than the B-Dud. Back when Bill Dudley was Goldman’s chief economist, he needed a convenient metric to signal whether or not Greenspan was pleasuring the Wall Street gamblers with “moar” money at any given point in time.
So he came up with a four-factor indicator based on interest rates, credit spreads, equity market prices and the value of the US dollar.
That is to say, the Goldman index consists of financial variables that are so powerfully influenced by Fed policy that they comprise the next closest thing to an auto loop. And a perverse one at that.
To wit, when the Fed is heavily pumping monetary juice into Wall Street and the gamblers are in a full throttle “risk on” stampede, what happens to the components of this purportedly scientific index?
Why the dollar weakens, as it is sold short into the offshore and EM carry trades; credit spreads between risk-free treasuries and junk bonds tighten, since its risk-on time and money managers are desperate for yield; equity prices rise because the casino is rocking; and interest rates are pegged at zero because the FOMC has essentially expropriated/nationalized the money market.
But when the resulting financial bubble finally reaches its apogee, as it did in the spring of 2000 and during the fall of 2008, the gamblers eventually succumb to a spat of “risk-off”, causing three of the four indicators to beat a panicked retreat.
Accordingly, credit spreads blow-out, as junk and other risky credits are dumped; the dollar soars, as off-shore markets scramble to cover the immense dollar short; and equity markets fall, as leveraged trading in the casino is unwound.
So wouldn’t you know it. The inevitable collapse of the Fed’s bubble cycle causes the Goldman Sachs Financial Conditions Index to go vertical in the direction of “tightening”!
In a word, the Goldman gamblers have constructed a junk economics index that tells the Fed not to tighten because the arrival a modicum of sanity in the casino is evidence that it has already tightened.

It is not surprising, therefore, that the Fed almost always has its hand on the Easy Button. Indeed, during the last 25 years, it has been cutting or holding money market rates constant at (mostly) ultra low levels 80% of the time.
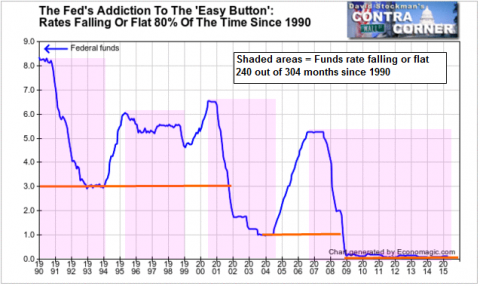
All of this perpetual easing, of course, is done in the name of filling the Keynesian economic bathtub with that invisible economic ether called “aggregate demand”. But under conditions of peak debt in the household sector and the dynamics of bubble finance in the C-suite, drastic interest rate repression, such as embodied in 80 straight months of ZIRP, does not fuel an outbreak of borrowing and spending in either sector.
In fact, upwards of 90% of households are tapped out and can’t borrow more regardless of the interest rate.
Likewise, the C-suite of corporate American has become so addicted to harvesting stock option gains that virtually any and all incremental borrowings have gone into stock buybacks and other financial engineering maneuvers. That is, into inflating the secondary markets for existing financial assets, not funding an increased call on real plant, equipment, software and other productive assets.
That the Fed’s massive emission of central bank credit never leaves the canyons of Wall Street under a regime of bubble finance is readily evident in the real economic facts. That is, the plain trends in nominal borrowing and spending show a complete absence of credit-fueled stimulus or any elevation of “aggregate demand”.
Thus, even as the Fed has resorted to progressively more extreme money printing sprees with each bubble cycle, the actual growth of the business system has slowed. Since the mid-2008 peak, for example, business sales have expanded at only a 1.1% annualized rate—-a small fraction of the 4-6% annual gains which occurred during the two prior cycle.
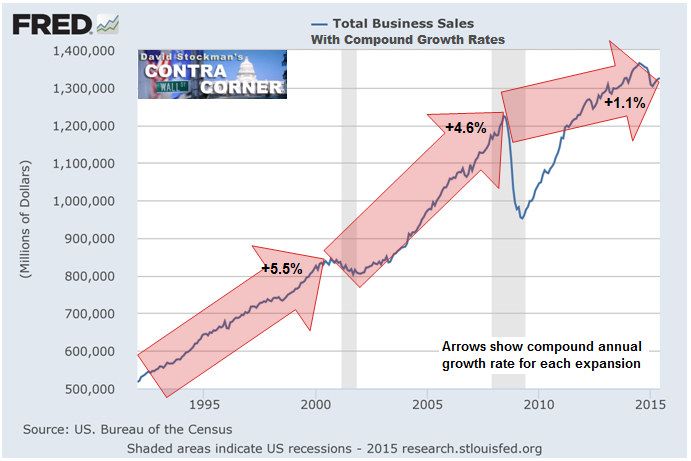
The crucial point about the above chart which covers net production in the entirety of the US business economy——-mining, energy, manufacturing, wholesale and retail trade—–is that it is expressed in actual nominal dollars which ring at the cash register.
By contrast, all of the Keynesian jawing about real interest rates, real GDP growth, real consumer borrowing and spending etc. assumes that “inflation” can be measured accurately by the primitive techniques of the Washington statistical mills; and that the whole system of national income and product accounts which is predicated on these “deflators” actually reflects reality.
No it doesn’t. The Keynesian alternate vocabulary of economic newspeak often creates the appearance of growth and gains in the macro-aggregates by the presumptions of theory, not the tabulation of empirics at the cash register.
For example, the GDP accounts provide for steady “real growth” of upwards of $3 trillion of “imputations” that do not even exist, such as spending on rents by owners who live in their own houses; or by increasing the reported numbers for software and other technology spending by up to 10X on the grounds that improved quality and function should be registered in deeply negative “deflators”.
At the end of the day, however, main street households and businesses do not spend “real” or deflated dollars as computed by the Washington statistical mills; they spend the nominal dollars they have earned or saved, taking into account their own subjective views on the rate at which its purchasing power is being eroded by the rising cost of living.
In this regard, “real interest” rates are an unadulterated fiction. Households borrow based on the monthly cost of carry and the capacity of their incomes to support the contractual debt service required by the marketplace. Professor Summers’ hooey that real interest rates are negative but too tight never crosses the mind of any real world borrowers.
What does cross their mind, by contrast, is debt service carry-capacity and the penalty spreads they might face based on their credit histories. In that regard, here is the collective verdict of America’s 115 million households as reflected in their nominal dollars of mortgage, credit card, auto, student and other consumer debt.
To wit, after exploding by 5X between 1987 and 2008, household debt has gone flat as a pancake since the financial crisis, and, in fact, is nearly $400 billion or 3% lower than it was in early 2008.
That’s right. During that very same period, the Fed’s balance sheet exploded from $800 billion to $4.5 trillion or by more than 9X. Yet all that monetary stimulus had no impact whatsoever on household spending and borrowing. Self-evidently, professor Summers negative real interest rates, which are still too tight by his lights, did not induce tapped-out households to borrow and spend up a Keynesian storm.
![]()
The same is true of business. The Fed could not have made the nominal carry cost of interest any cheaper over the last 80 months, regardless of how corporate financial executive might compute the “real” interest rate.
Yet after consuming their depreciation allowances on replacement capital, US business did not spend up a storm on productive capital investment as predicated by ZIRP. In fact, net business investment in Q2 2015 at $562 billion was actually lower than it was in the second quarter of the year 2000.
![]()
In short, ZIRP has not caused a credit fueled inflation of either the business or household sectors of the main street economy. Its inflationary impact has been exclusively realized in the canyons of Wall Street where is have fueled the third and greatest financial bubble of this century.
Needless to say, its impending crash is unavoidable because that’s what artificial monetary bubbles always do. Unfortunately, if the Fed heeds the advice of the cackling gaggle of Keynesian Chicken Little’s now importuning it, a new short-lived run at the old May 2015 highs is likely to ensue in the casino, thereby insuring that the ultimate reckoning will be all the more disruptive and destructive.
And that baleful eventuality is all because by the lights of the ruling posse of Keynesian pettifoggers, 80 month of free money is still too tight. That unadulterated nonsense is the scariest part of all.


[…] by Harvey Organ Harvey Organ’s Blog […]
LikeLike