
Gold: $1,272.60 up $15.40 (comex closing time)
Silver 15.55 up 19 cents
In the access market 5:15 pm
Gold $1273.50
silver: 15.56
Today the bums had gold and silver in their sights as they whacked gold down to $1239.65 and silver to $15.22 at 8 am with the Draghi announcement of an increase in NIRP and more QE. Then gold had a terrific outside day reversal climbing to a high of $1273.00 (and it closed at $1272.60). Silver finished up 19 cents to $15.55
At the gold comex today, we had a poor delivery day, registering 0 notices for nil ounces and for silver we had 7 notices for 35,000 oz for the active March delivery month.
Several months ago the comex had 303 tonnes of total gold. Today, the total inventory rests at 212.04 tonnes for a loss of 91 tonnes over that period.
In silver, the open interest fell by only 253 contracts to 169,622 despite the massive raid orchestrated by our crooks. In ounces, the OI is still represented by .849 billion oz or 122% of annual global silver production (ex Russia ex China).
In silver we had 7 notices served upon for 35,000 oz.
In gold, the total comex gold OI fell by 10,066 contracts to 489,044 contracts as the price of gold was down $6.70 with yesterday’s trading.(at comex closing). I do not think that the bankers are too happy as the liquidation was small for the tumultuous raid orchestrated by them. With the huge reversal in gold today, I would suspect that the OI returned to its previous highs.
We had another rather large change in gold inventory at the GLD, a deposit of 2.08 tonnes of gold from the GLD/ thus the inventory rests tonight at 792.82 tonnes. The appetite for gold coming from China is depleting not only gold from the LBMA and GLD but also the comex is bleeding gold. Our 670 tonnes of rock bottom inventory in GLD gold has been broken. It looks to me that China has taken the last amounts of physical gold from the GLD. I guess the only place left for China to receive physical gold, after they deplete the GLD will be the FRBNY and the comex. In silver,/we had no change in inventory/this time and thus the Inventory rests at 322.632 million oz
.
First, here is an outline of what will be discussed tonight:
1. Today, we had the open interest in silver fell by 253 contracts down to 169,622 as the price of silver was down 2 cents with yesterday’s trading. The total OI for gold fell by 10,066 contracts to 489,044 contracts as gold was down $5.50 in price from yesterday’s level.
(report Harvey)
2 a) Gold trading overnight, Goldcore
(Mark OByrne)
3. ASIAN AFFAIRS
i)Late WEDNESDAY night/ THURSDAY morning: Shanghai closed DOWN BY 58.20 POINTS OR 2.03% ON A LAST HR PLUMMET, / Hang Sang closed DOWN by 11.84 points or 0.06% . The Nikkei closed UP 210.15 or 1.26%. Australia’s all ordinaires was DOWN 0.14%. Chinese yuan (ONSHORE) closed UP at 6.5105. Oil GAINED to 38.38 dollars per barrel for WTI and 40.83 for Brent. Stocks in Europe so far MOSTLY THE GREEN RESPONDING TO THE OIL RAMP UP AND WAITING DRAGHI’S DECISION ON INTEREST RATES . Offshore yuan trades 6.5175 yuan to the dollar vs 6.5105 for onshore yuan/ LAST WEDNESDAY, MOODYS DOWNGRADES CHINA’S CREDIT FROM STABLE TO NEGATIVE. At the big people’s congress where they meet to set a 5 year plan, the leaders failed to deliver a major fiscal stimulus package. However instead they made very promises.
ii)report from China:
Food prices explode in China. However PPI or producer prices slump for the 47th straight month:
( zero hedge)
iii) The big story of the day other than the Draghi announcement of an increase in NIRP: Today the Chinese government floated a trial balloon whereby the banks will nationalize all of the Non Performing Loans. (NPL). In essence this is nationalizing the insolvent companies. This will free up more cash for the banks to lend and no doubt that the Chinese debt to GDP will rise exponentially from its existing 350: 1
ii)The full announcement:
iii)However Draghi’s all important inflation forecast was just thrown out the window
iv)Draghi then blew it by stating he does not anticipate any more rate cuts.
v)Today, the world just lost faith in the 3rd central bank, the ECB. It lost faith with the USA rate hikes first, then the Japanese QE and now with Draghi’s bazooka. Gold responded in kind:
vi)We have been pointing out that the ECB is running out of room with respect to bonds to monetize. Thus the reason that the ECB chose to increase QE through 1 trillion euros worth of investment grade corporate bonds
vii)Then the German DAX tanked:
i) We knew that this was coming:No Meeting for OPEC/non OPEC in March
ii)Saudi Arabia even today is increasing its rig count as opposed to the USA which is declining in rig counts. Thus Saudi Arabia has no intention to end the oil glut
i) Morons!! these guys do not read…New Gold hedges all of its remaining 2016 output
ii)This is no surprise to us at all. The Indian government’s plan to take physical gold from its citizens and turn it into paper gold fails again( GATA/Business Standard New Delhi)
iii)It now looks like China will have more control over the price of silver as one of their largest bank, China Construction Bank will become a member of the LBMA and also they will set the silver fix along with Bank of NoVA SCOTIA, HSBC and JPMorgan.Our banker friends are not happy campers lately with respect to silver as the comex OI refuses to buckle under the weight of raids.
iv)The largest primary silver mine is the Fresnillo Mine in Zacatecas Mexico. They have been mining at this site since 1824. Now the grades are faltering and this will no doubt become a problem for them. They do mine gold at over locations but not at its flagship operation in Zacatecas.
v)Bill Holter explains to all of us why a revision to the gold price is necessary.( Holter/Sinclair collaboration)
USA STORIES WHICH WILL INFLUENCE THE PRICE OF GOLD/SILVER
i) Initial claims tumble???? to 259,000 and near 43 yr lows!!! Yet the employment components of both manufacturing and service ISM data have completely collapsed!!
ii)The yield curve is the flattest since Dec 2008 as it signifies not a healthy USA economy:
iv) Dave Kranzler of IRD touches on two important points with respect to today’s USA data releases:
Let us head over to the comex:
The total gold comex open interest fell to 489,044 for a loss of 10,066 contracts as the price of gold was down $5.50 in price with respect to yesterday’s huge raid.As I explained above, the bankers needed a much larger contraction in OI and they much to their angst, are not happy especially on today’s outside day reversal. For the past two years, we have strangely witnessed two interesting developments with respect to the gold open interest: 1) total gold comex collapse in OI as we enter an active delivery month or for that matter an inactive month, and 2) a continual drop in the amount of gold standing in an active month. Today, only the first scenario was in order as we actually gained in number of ounces standing for March. The front March contract month saw its OI rise by 17 contracts up to 17.We had 0 notices filed upon yesterday, and as such we gained 17 contracts or an additional 1700 oz will stand for delivery. Somebody must be in urgent need of physical gold. After March, the active delivery month of April saw it’s OI fall by 18,258 contracts down to 276,650. Approximately 8,000 of those contracts rolled into June.The estimated volume today (which is just comex sales during regular business hours of 8:20 until 1:30 pm est) was 293,847 which is excellent. The confirmed volume yesterday (which includes the volume during regular business hours + access market sales the previous day was very good at 266,613contracts. The comex is not in backwardation .
March contract month:
INITIAL standings for MARCH
March 10/2016
| Gold |
Ounces
|
| Withdrawals from Dealers Inventory in oz | nil |
| Withdrawals from Customer Inventory in oz nil | 1,678.106 oz
(DELAWARE SCOTIA) includes 43 kilobars
|
| Deposits to the Dealer Inventory in oz | 46.45 oz ????
Brinks
|
| Deposits to the Customer Inventory, in oz | 396.772 OZ
DELAWARE |
| No of oz served (contracts) today | 0 contract (nil oz) |
| No of oz to be served (notices) | 113 contracts(11,300 oz) |
| Total monthly oz gold served (contracts) so far this month | 576 contracts (57,600 oz) |
| Total accumulative withdrawals of gold from the Dealers inventory this month | nil |
| Total accumulative withdrawal of gold from the Customer inventory this month | 105,817.7 oz |
we had 0 adjustment
.
MARCH INITIAL standings/
March 10/2016:
| Silver |
Ounces
|
| Withdrawals from Dealers Inventory | nil |
| Withdrawals from Customer Inventory | 523,597.923 oz (Delaware) |
| Deposits to the Dealer Inventory | 1,138,185.0000 oz
BRINKS ???? |
| Deposits to the Customer Inventory | 527,133.800 oz (SCOTIA,Delaware) |
| No of oz served today (contracts) | 7 contracts 35,000 oz |
| No of oz to be served (notices) | 1513 contract (7,565,000 oz) |
| Total monthly oz silver served (contracts) | 346 contracts (1,730,000 oz) |
| Total accumulative withdrawal of silver from the Dealers inventory this month | nil oz |
| Total accumulative withdrawal of silver from the Customer inventory this month | 8,415,633.2 oz |
Today, we had 1 deposits into the dealer account:
i) Into Brinks: EXACTLY 1,138,185.000 oz
how could be get an exact amount like the above and over 1 million oz???
total dealer deposit; 1,138,185.000 oz
we had 0 dealer withdrawals:
total dealer withdrawals: nil
we had 2 customer deposit
i) Into Scotia: 482,304.400 oz
2. Into Delaware; 44829.400 oz
:
total customer deposits: 527,133.800 oz
total withdrawals from customer account nil oz
we had 2 adjustments
i) Out of Delaware:
50,199.373 oz was adjusted out of the customer account and this landed into the dealer account of Delaware
ii) Out of the International Depository Services of Delaware:
26,071.000 oz ????? was adjusted out of the customer Delaware and into the dealer Delaware.
how could this transaction occur???
And now the Gold inventory at the GLD:
March 10/a deposit of 2.08 tonnes of gold into the GLD/Inventory rests at 702.82 tonnes
March 9/a withdrawal of 2.38 tonnes of gold from the GLD/Inventory rests at 790.74
March 8/no changes in inventory at the GLD/Inventory rests at 793.12 tonnes
MARCH 7/a tiny loss of .21 tonnes of gold probably to pay for fees/inventory 793.12 tonnes
MARCH 4/another mammoth sized deposit of 7.13 tonnes of gold into GLD/Inventory rests at 793.33 tonnes. This is no doubt a “a paper addition” and not physical
MAR 3/another good sized deposit of 2.37 tonnes of gold into the GLD/Inventory rests at 788.57 tonnes
MAR 2/another mammoth paper gold addition of 8.93 tonnes of gold into the GLD/Inventory rests at 786.20 tonnes.
March 1/a mammoth 14.87 tonnes of gold deposit into the GLD/inventory rests at 770.27 tonnes
FEB 29/another deposit of 2.08 tonnes of gold into the GLD/Inventory rests at 762.40 tonnes
Feb 26./no change in gold inventory at the GLD/Inventory rests at 760.32 tonnes
Feb 25./we had a huge deposit of 7.33 tonnes of gold into the GLD/Inventory rests at 760.32 tonnes. No doubt that this is a paper gold deposit/not real as the price of gold hardly moved on that huge amount of deposit.
FEB 24/no change in gold inventory at the GLD/Inventory rests at 752.29 tonnes
FEB 23./another huge addition of 19.3 tonnes of gold into its inventory/Inventory rests at 752.29 tonnes. Again how could they accumulate this quantity of gold with backwardation in London/this vehicle is nothing but a fraud
Feb 22/A huge addition of 19.33 tonnes of gold to its inventory/Inventory rests at 732.96 tonnes/ How could this happen: a huge addition of gold coupled with a huge downfall of 20 dollars in gold.
xxxxxxxxxxxxxxxxxxxxxxxxxxxxxxxxxxxxxxxxxxxxxxxxxxxxxxxxx
March 10.2016: inventory rests at 792.82 tonnes
end
end
And now your overnight trading in gold, THURSDAY MORNING and also physical stories that may interest you:
Silver Cheapest To Gold In 7 Years – ETF Holdings Surge
Silver hasn’t been so cheap relative to gold for more than seven years and with silver ETF holdings having surged in recent days, silver coin and bar demand very robust and mine supplies forecast to contract this year, there are signs that silver is set to resume its bull market and outperform gold once again.

Eddie Van Der Walt and Ranjeetha Pakiam write in Bloomberg today:
Mine production of silver will probably drop in 2016 for the first time in over a decade and demand is set to outstrip supply for a fourth straight year, says Standard Chartered Plc. Much of the world’s silver is extracted from the ground with other minerals, and output cuts announced by the biggest miners will hurt supplies of the metal as well as others such as copper and zinc.
Silver’s 10 percent advance this year has trailed gold’s 18 percent surge as financial turmoil and worries about a global slowdown sent investors flocking to the yellow metal as a haven. An ounce of gold bought about 83 ounces of silver last month, more than any time since the financial crisis of 2008. That’s a signal to some that it’s relatively undervalued and will narrow the gap.
More than 50 percent of demand comes from industry, including about a quarter from electronics, and to some extent silver’s fortunes follow those of industrial raw materials such copper, zinc and lead. The London Metal Exchange index of six metals has climbed about 14 percent since slumping to the lowest level in more than six years in January.
Silver may climb about 18 percent to about $18 an ounce by the end of 2017, according to Julian Jessop, head of commodities research at Capital Economics Ltd. in London. Assuming the world economy avoids a sharp downturn and prices of industrial metals continue to recover, he predicts that silver will outperform gold and the ratio could return to 70.

Read full article on Bloomberg here
LBMA Gold Prices
10 Mar: USD 1,247.25, EUR 1,137.04 and GBP 876.67 per ounce
09 Mar: USD 1,258.25, EUR 1,146.69 and GBP 884.16 per ounce
08 Mar: USD 1,274.10, EUR 1,155.69 and GBP 894.35 per ounce
07 Mar: USD 1,267.60, EUR 1,156.96 and GBP 896.13 per ounce
04 Mar: USD 1,271.50, EUR 1,158.67 and GBP 898.93 per ounce
Gold News and Commentary
Gold prices dip further in Asia as China CPI data higher than expected – Investing.com
Gold dips as stocks, dollar strengthen ahead of ECB meeting – Reuters
U.S. Stocks Gain With Commodities as Euro Fluctuates Before ECB – Bloomberg
Jewelers in India Losing $150 Million a Day as Strike Continues – Bloomberg
Indian government calls meeting on gold monetization scheme’s lack of success – Business Standard
If Gold Has Turned Bullish, Can Silver Be Far Behind? – Seeking Alpha
Gold looks overbought – but it just keeps going up – Frisby – Money Week
82-year old argument for gold at $8,000 per ounce – MW via YouTube
Global Leading Indicators Fall Sharply Into 2016 – Financial Sense
China’s Global Gold Strategy – Middelkoop – Epoch Times
Read more here

‘7 Real Risks To Your Gold Ownership’ – New Must Read Gold Guide Here
Please share our website with friends, family and colleagues who you think may benefit from it.
Thank you

New Gold hedges nearly all its remaining 2016 gold output
Submitted by cpowell on Thu, 2016-03-10 01:24. Section: Daily Dispatches
From Reuters
Wednesday, March 9, 2016
New Gold Inc. has hedged nearly all of its remaining 2016 gold production to ensure cash flow for its Rainy River project, the company said, an unusually large amount for a miner after bullion made its biggest rally in 4 1/2 years.
The miner said on Tuesday that it hedged 270,000 ounces of gold for the remaining nine months of the year through options contracts at a cost of $2 million, starting in April, giving them a minimum price of $1,200 an ounce and maximum at $1,400 an ounce.
That breaks down to 30,000 ounces each month and accounts for 90-100 percent of New Gold’s production forecast.
Hedging, which can be put in place through options contracts as well as forward or deferred sales, allows miners of the metal to lock in prices for their output. …
… For the remainder of the report:
http://www.reuters.com/article/new-gold-hedging-idUSL1N16H268
END
This is no surprise to us at all. The Indian government’s plan to take physical gold from its citizens and turn it into paper gold fails again
(courtesy GATA/Business Standard New Delhi)
Indian government calls meeting on gold monetization scheme’s lack of success
Submitted by cpowell on Thu, 2016-03-10 01:41. Section: Daily Dispatches
Government Calls Meeting to Review Gold Monetization Scheme
By Rajesh Bhayani
Business Standard, New Delhi
Wednesday, March 9, 2016
MUMBAI, India — Following a tardy progress in the most ambitious gold monetization scheme since its launch on November 5 last year by Prime Minister Narendra Modi, the Finance Ministry has called another meeting of all stakeholders on March 18 to discuss why the scheme is not gaining momentum.
Until February a little over 1 tonne of gold was mobilized under the scheme compared to nearly 4 tonnes of sale of sovereign gold bonds in first two tranches while the third tranche is still open.
Interestingly, at a time when jewellers are on a strike opposing imposition of excise duty in the Union budget, the government has preferred not to invite all trade bodies. Hence only Indian Bullion and Jewellers Association has been called to meeting while the Gems and Jewellery Foundation has not been invited. From the refiners’ side, many representatives have been asked to attend. …
… For the remainder of the report:
http://www.business-standard.com/article/markets/government-calls-meet-t…
China Is Now In Control Of Global Silver Prices
Submitted by Dave Forrest via OilPrice.com,
China has been an unofficial price-setter for most metals over the past decade. And this week, the country became an official participant in setting prices for one of the world’s most important precious metals markets.
That’s the London Bullion Market silver price. Where one of China’s largest banks just became a member of an elite group of players that controls fluctuations in this key metal.
CME Group, which runs the process for price setting of silver in London, said Sunday that China Construction Bank will officially join as a member of the silver price process. Putting it alongside existing participants HSBC, JPMorgan Chase, The Bank of Nova Scotia, Toronto Dominion Bank, and UBS.
These groups will now participate in price bids that go into setting the official London silver price. The first time that China will have direct influence on this process.
The expansion into China in itself is significant. And the entry of China Construction Bank into the market could also have some other important consequences for precious metals.
Especially when it comes to currencies. With the Chinese bank having said it will support the development of renminbi-denominated futures contracts for physical delivery in London.
Such products would represent the first time that physical silver can be bought and sold here in China’s home currency. A move that could reduce the longstanding relationship between the U.S. dollar and precious metals prices.
This is also a sign that precious metals markets are increasingly going international. Which makes sense, given that the world’s top consumers are places like China, India, Russia and Turkey.
This could be the start of further moves to increase metals markets influence in these parts of the world. Watch for more announcements, and for a possible breakdown in the USD/silver correlation as the renminbi contracts get going.
Here’s to a silver line-up…

Largest Primary Silver Mine Productivity Falls To Lowest Ever
The largest primary silver mine in the world saw its average yield fall to the lowest level ever in 2015. Matter-a-fact, the primary silver mine’s yield fell nearly 16% compared to last year. This is a substantial decline in productivity from the world’s largest mine in Mexico that starting production in 1824.
Actually, the area where this mine is located– Zacatecas, Spaniards start producing silver all the way back in 1540. When initial production at the Great Fresnillo Mine started in 1824, Mexico was producing 55% of the world’s silver production . The ore grades were much higher in those days.
For example, average yields for silver production in the United States and Australia in the late 1800’s was 40-50 oz per ton (oz/t). However, as the world continued to consume greater amounts of silver over the next century, average yields in its primary silver mining industry fell precipitously.
Fresnillo Mine Average Yield Fell To Lowest Level Ever
Fresnillo LLC has several mines in production. Their flagship operation, is the Fresnillo Mine. In 2005, the Fresnillo Mine was producing silver at an average yield of 15.2 oz/t, but this fell 57% over the following decade. In 2015, Fresnillo’s average silver yield was a paltry 6.5 oz/t…. a loss of 8.7 oz/t:
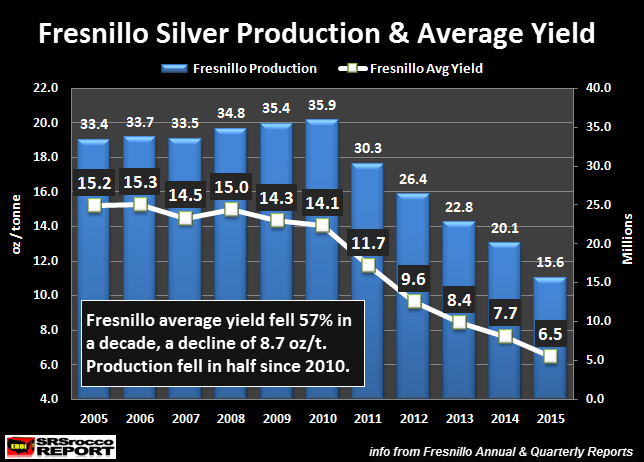
Not only did the Fresnillo Mine average yield fall considerably over the past five years, silver production fell by more than half. In 2010, the Fresnillo Mine produced 35.9 million oz (Moz) of silver at an average yield of 14.2 oz/t. However, silver production from the mine fell to 15.6 Moz while the average yield dropped to 6.5 oz/t.
Now, the downside to falling silver yields is the increased cost of production. For example in 2010, Fresnillo processed 2.5 million tonnes of ore to produce that 35.9 Moz versus processing 2.4 million tonnes of ore in 2015 to extract 15.6 Moz of silver from the mine. Basically, the amount of processed ore remained about the same (close to it), while silver production fell by 56%.
The company realized the ore grades at its flagship Fresnillo Mine were going to fall, so they have been spending a lot of capital to bring on new primary silver mines. The company’s second primary silver mine that came on production in 2009 was its Saucito Mine. Ramp up of production of its Saucito Mine helped to offset losses from the Fresnillo Mine. However, the average yield of these two primary silver mines also declined in 2015.
The Fresnillo & Saucito Mine’s Combined Average Yield Fell In 2015
This next chart shows the combined production of the Fresnillo and Saucito Mine along with their average yield. As we can see the average yield of these two mines was 14.2 oz/t in 2009, but this declined to 7.9 oz/t in 2015:
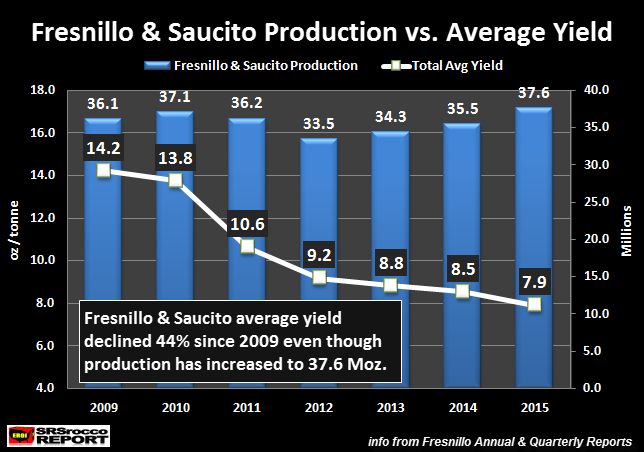
Even though overall production from these two mines is higher at 37.6 Moz in 2015 compared to 36.1 Moz in 2009, the average yield has fallen 44%. Thus, the company only had to process 2.5 million tonnes of ore in 2009 to produce 36.1 Moz, but this jumped to 4.7 million tonnes last year to extract 37.6 Moz.
Let’s put that increase of processed ore into perspective:
2009 Fresnillo Cost Per Tonne = $36.5
2009 Fresnillo Processed Ore = 2,471,657
2009 Fresnillo Production Cost = $90.2 million
2015 Fresnillo & Saucito Avg Cost Per Tonne = $45.34
2015 Fresnillo & Saucito Processed Ore = 4,749,129
2015 Fresnillo & Ssucito Production Cost = $215.3 million
So, what do these figures show??? The company spent $90.2 million in 2009 to produce 35.4 Moz (Fresnillo only) of silver versus $215.3 million to produce 37.6 Moz in 2015. By adding the Saucito Mine to offset silver supply losses from the Fresnillo Mine, the overall production cost DOUBLED… LOL.
Another interesting TIDBIT is the increased cost per tonne of production. The average price of Brent Crude in 2009 was $62 versus $52 in 2015. So, even with a $10 lower price of oil in 2015 compared to 2009, the average production cost per tonne from the two mines is up nearly $9 a tonne… a 25% increase during the five year time period.
Lastly, Fresnillo LLC has ramped up its gold production significantly over the past several years. For example, total gold production from the company increased from 596,000 oz in 2014 to 762,000 oz in 2015. This has impacted its revenue mix. In 2014, gold sales accounted for 47% of total revenues, while silver sales followed close behind at 46%… the remainder was in zinc and lead. However, this changed remarkably in 2015 as the company’s gold sales accounted for 52% of the total revenue whereas silver fell to 39%.
Regardless, when the prices of gold and silver move up much higher over the next several years, Fresnillo LLC stock holders will be greatly rewarded as their profits will explode. Even with lower gold and silver prices in 2015, the company still made a $70 million profit.
The primary silver mining companies that produce more gold than base metals will be the best performing stock prices in the future.
end
Bill Holter explains to all of us why a revision to the gold price is necessary.
(courtesy Holter/Sinclair collaboration)
Broken Bazookas!
First it was the Fed, then it was the Bank of Japan, now the ECB (and maybe even China). Mario Draghi finally let loose this morning with everything left in his monetary “bazooka” and gone as far as the Bundesbank will let him. He also has to face the BIS restrictions in the next three weeks which are far from certain to be in favor of his actions.http://www.zerohedge.com/news/2016-03-10/draghi-whips-out-bazooka-ecb-announces-surprise-refi-marginal-lending-rate-cuts-boos
Looking backward first, the Fed unsettled markets in mid December with a rate hike. Japan lit gold’s fuse in January with the announcement of negative interest rates. Today, Mario Draghi spent and fired his last shot, it will be seen as a blank. Now we will get to see what sort of reaction is received from the markets. Initially the markets went in the “favored” directions, that only lasted for about an hour. The Euro is again strengthening, gold going higher and stock markets have turned negative as if asking “now what? Do you have anything else”?Before going further I want to break down what they are trying to do into its most basic form. Systemically (including Europe) the world ran into “debt saturation” back in 2007. The plan was to cure too much debt with …more and more debt. The “experiment” has not worked and will not work …and Mario Draghi just ran into a wall where this is it, he has no more room to “experiment”. No doubt this is being done now to try to support the Italian (Spanish and others) debt that has gone bad.There is another little problem that few are talking about, the BIS. The Bank for International Settlements has warned Mr. Draghi not to go to this wall of negative interest rates and further outright monetization. The BIS has the ability to force Draghi to not only stop the madness but also reverse it. So not only are the markets asking “what’s next?”, it is also wondering whether or not the BIS will step in.We also have another piece to add to this puzzle, China. They just announced they will http://www.zerohedge.com/news/2016-03-10/china-proposes-unprecedented-nationalization-insolvent-companies-banks-will-equitize begin to take equity stakes for non performing loans via the banking system. “Nationalization” no matter what they call it. It had been speculated China would have to devalue the yuan in an effort to make their massive corporate debt payable and industry more competitive. I would suggest this is simply wiping out current debt in an effort to make room available to create more debt and to reflate. We will see how this works out but I do not believe this is any more credible than any of the other “serial reflators”.Many times it is said “OK, so you see the problem but what’s the answer”? The answer is obvious and we will get to it after looking at the true problem. The world hit debt saturation in 2007, sovereign treasuries and central banks stepped in and sacrificed (destroyed) their own balance sheets in an effort to reflate. We know it has not worked and the global economy (pie) is no longer growing. The ONLY way for a country or region to “grow” is by taking an inordinate size of the pie and the only way to do this is by devaluing currency faster than your competitors.The problem today is ALL currencies are competing against each other in debasing (devaluing). If you devalue too slowly you lose. If you devalue but not enough, again you lose. This is the problem with and misunderstanding of the USDX index, the currencies are all valued against each other and NONE OF THEM ARE REAL! The “answer” as it was back in 2008 is still the same, rather than race “against” each other THEY ALL need to collectively devalue! The only way to do this is to collectively devalue against “something” …and that something is what it always has been, GOLD!A collective devaluation will do several things. First, it will create “inflation” and thus make the existing debt payable if the devaluation is deep enough. Business will get “reflated” and main street will actually participate in the better business conditions. Most importantly, for those nations who actually do hold gold, their balance sheet holes will be filled up and patched. Sovereign treasuries with gold will suddenly see their coffers filled. There is of course the problem of nations who either do not hold gold or have lied and no longer hold what they said they did. In this case, these nations become the world’s new “cheap labor” and begin to dig their way out via industrial/commercial production. This is a very long and hard process which also involves a huge drop in the standard of living.Do I know what the level needs to be for gold to perform its function as central bank reserve? No, the number could be $25,000, $50,000 or $5 million or more, I do not have the answer. The biggest holder(s) of gold on the planet could simply “mandate” a price or do it via the physical markets over a reasonable period of time …but they will do this as it is the only viable solution.We now have a situation where central banks have lost their credibility. This will lead to a loss of confidence in all things paper. Either the central banks revalue their balance sheets with a wildly high gold price or the markets will do this for them by voting with their feet so to speak. We are on the cusp of absolutely wild market gyrations and obscene price levels for gold. So obscene you will either be in or you will be out forever. Do not try to time anything, these last bazookas fired with blanks will be seen as a very large starting gun!Standing watch,Bill HolterHolter-Sinclair collaborationComments welcome, bholter@hotmail.com
:
1 Chinese yuan vs USA dollar/yuan DOWN to 6.5105 / Shanghai bourse IN THE RED, DOWN 58.20 OR 2.03% : / HANG SANG CLOSED DOWN 11.84 POINTS OR 0.06%
2 Nikkei closed UP 210.15 OR 1.26%
3. Europe stocks MOSTLY IN THE GREEN /USA dollar index UP to 97.34/Euro DOWN to 1.0981
3b Japan 10 year bond yield: RISES TO -.016% AND YES YOU READ THAT RIGHT !!!!(Japan buying 100% of bond issuance)/Japanese yen vs usa cross now at 113.63
3c Nikkei now well below 17,000
3d USA/Yen rate now well below the important 120 barrier this morning
3e WTI:: 37.01 and Brent: 40.34
3f Gold DOWN /Yen DOWN
3g Japan is to buy the equivalent of 108 billion uSA dollars worth of bond per month or $1.3 trillion. Japan’s GDP equals 5 trillion usa.
Japan to buy 100% of all new Japanese debt and by 2018 they will have 25% of all Japanese debt. Fifty percent of Japanese budget financed with debt.
3h Oil UP for WTI and UP for Brent this morning
3i European bond buying continues to push yields lower on all fronts in the EMU. German 10 yr bund RISES to 0.230% German bunds in negative yields from 8 years out
Greece sees its 2 year rate FALL to 9.67%/:
3j Greek 10 year bond yield FALL to : 9.63% (YIELD CURVE NOW BACK TO BEING FLAT)
3k Gold at $1247.50/silver $15.27 (7:15 am est)
3l USA vs Russian rouble; (Russian rouble UP 97/100 in roubles/dollar) 70.12
3m oil into the 38 dollar handle for WTI and 40 handle for Brent/
3n Higher foreign deposits out of China sees huge risk of outflows and a currency depreciation (already upon us). This can spell financial disaster for the rest of the world/China forced to do QE!! as it lowers its yuan value to the dollar/expect a huge devaluation imminently from POBC.
JAPAN ON JAN 29.2016 INITIATES NIRP
30 SNB (Swiss National Bank) still intervening again in the markets driving down the SF. It is not working: USA/SF this morning .9982 as the Swiss Franc is still rising against most currencies. Euro vs SF is 1.0963 well above the floor set by the Swiss Finance Minister. Thomas Jordan, chief of the Swiss National Bank continues to purchase euros trying to lower value of the Swiss Franc.
3p BRITAIN STARTS ITS CAMPAIGN AS TO WHETHER EXIT THE EU.
3r the 8 year German bund now in negative territory with the 10 year RISES to + .230%
/German 8 year rate negative%!!!
3s The Greece ELA NOW at 71.4 billion euros,
The bank withdrawals were causing massive hardship to the Greek bank. the Greek referendum voted overwhelming “NO”. Next step for Greece will be the recapitalization of the banks and that will be difficult.
4. USA 10 year treasury bond at 1.87% early this morning. Thirty year rate at 2.66% /POLICY ERROR)
5. Details Ransquawk, Bloomberg, Deutsche bank/Jim Reid.
(courtesy Jim Reid/Bloomberg/Deutsche bank/zero hedge)
All Eyes On Draghi: Markets Unchanged, Poised To Pounce Or Plunge
Global stocks and U.S. equity futures are fractionally higher (unchanged really) this morning (despite China’s historic NPL debt-for-equity proposal) as traders await the main event of the day: the ECB’s 1:45pm CET announcement, more importantly what Mario Draghi will announce during the 2:30pm CET press conference, and most importantly, whether he will disappoint as he did in December or finally unleash the bazooka that the market has been desperately demanding.
Recall that for the past month, it has been a case of deferred expectations when first the Shanghai G-20 meeting let traders down, then it was the Chinese Congress last weekend, and now it is all up to the ECB: it is all downhill from here, as next week we get the BOJ, which after the NIRP fiasco won’t do anything, and the Fed which if anything, may be unexpectedly hawkish.
All economists in a Bloomberg survey expect a rate cut, and 73 percent forecast the ECB will boost the amount of money put into the financial system through bond purchases. “We are waiting in anticipation of what Draghi will say– there is a good chance that the market could rally a bit on that,” said Allan von Mehren, chief analyst at Danske Bank A/S in Copenhagen. “There has been some positioning ahead of the ECB meeting but there are also investors waiting on the side-lines. So there will be more cash ready to put to work if the ECB actually delivers on both a the rate cut and an increase of QE.”
Below, courtesy of @bondvigilantes, is a summary of what the major investment banks expect today from the European Central Bank:

As Bloomberg notes, stocks have become more and more responsive to ECB updates, with the moves in the Euro Stoxx 50 Index on rate-decision days exceeding the monthly average since last July. In December, when investors were disappointed by the extent of additional stimulus, the gauge swung 4.9 percent intraday, the most since at least 2012.

In other words, Draghi better not disappoint or a replay of the December market reaction is almost assured.
Aside from US futures which are modestly up, Europe trades little changed ahead of ECB meeting, Asian equities gain for first day in four. Oil, copper, gold, most food commodities fall.
The Stoxx Europe 600 Index is up 0.1% as of this moment. It earlier erased a gain of as much as 0.4 percent to fall 0.2 percent. The benchmark has rebounded 12 percent from a 2013 low reached last month, helped by a rally in miners and speculation of further ECB stimulus, a possibility signaled by Draghi in January.
Below is a snapshot of where key markets stood before the ECB:
- S&P 500 futures up 0.3% to 1985
- Stoxx 600 down less than 0.1% to 339
- FTSE 100 down 0.4% to 6122
- DAX up less than 0.1% to 9725
- German 10Yr yield down 3bps to 0.22%
- Italian 10Yr yield down 2bps to 1.39%
- Spanish 10Yr yield down 2bps to 1.54
- MSCI Asia Pacific up 0.5% to 126
- Nikkei 225 up 1.3% to 16852
- Hang Seng down less than 0.1% to 19984
- Shanghai Composite down 2% to 2805
- S&P/ASX 200 down 0.1% to 5150
- US 10-yr yield down 2bps to 1.86%
- Dollar Index up 0.19% to 97.35
- WTI Crude futures down 0.9% to $37.94
- Brent Futures down 1% to $40.64
- Gold spot down 0.4% to $1,249
- Silver spot up less than 0.1% to $15.30
Looking at regional markets, we start in Asia where the Nikkei 225 (+1.2%) outperformed as exporter names benefitted from JPY weakness, while ASX 200 (-0.1%) failed to hold onto its early energy-led advances amid profit-taking in defensive stocks. Chinese markets traded mixed following the latest inflation data where CPI rose to its highest in 19 months but PPI declined for the 48th consecutive month, with the Shanghai Comp (-2.0%) pressured after the PBoC kept its inter¬bank liquidity injections reserved and reports that China is seeking to rein in on property prices. 10yr JGBs initially traded with mild gains amid short-covering following yesterday’s significant declines and ahead of the 5yr auction. However, prices then returned flat on resumed selling following a relatively in-line auction.
Chinese CPI (Feb) Y/Y 2.30% vs. Exp. 1.80% (Prey. 1.80%); highest in 19-months. – PPI (Feb) Y/Y -4.90% vs. Exp. -4.90% (Prey. -5.30%); 48th consecutive monthly decline.
Top Asian News
- Shanghai Authorities Said to Discuss Ways to Cool Housing Market: Possible steps weighed incl. tightening mortgage policies for 2nd-home buyers
- How Global Investors Turn Negative Japan Yields Into Big Returns: Discount offered to yen borrowers reaches record 102.5 basis points this week
- Abe Aide Honda Says BOJ Will Add Easing Soon, But Not Next Week: Etsuro Honda says BOJ should use negative rate, asset purchase “combination”
- Swire Properties Sees Weaker Demand for Retail Space, Housing: Drop in tourist spending, falling retail sales at Hong Kong malls hurt developer
- Lenders Seek to Claw Back $1 Billion From India Beer Tycoon: Court case to bar flamboyant former billionaire’s travel abroad comes days too late
- Daewoo Shipbuilding Says Worst Is Over, Sees Profit This Quarter: World’s second-largest shipbuilder is aiming to win $10.8b in orders this year
European trading has seen a slow start, as many would have expected given the heavy focus on the ECB rate decision later today with European equities trading relatively mixed/flat. In terms of a sector specific basis, materials and energy names lead the way lower with Asian equity markets failing to inspire sentiment overnight. Fixed income markets illustrate the tentative sentiment felt today, as Bunds trade around 162.50 after drifting higher throughout the morning amid particularly light newsflow. In a similar fashion, with many remaining on the sidelines for now.
Top European News
- Draghi Marks a Year of QE With Suspense of ‘No Limits’ Stimulus: Investors expect at least a 10 basis-point cut in deposit rate to minus 0.4 percent, as indicated by swaps on the euro overnight index average.
- Merkel Threat Lurks in Baden-Wuerttemberg From AfD Party: Having made her case for open borders in Europe, Merkel faces test of her stance Sunday when 3 states vote.
- Carrefour Maintains Plan for IPO of Property Unit Carmila: Unit still plans an IPO, CFO Pierre-Jean Sivignon said on a call to reporters.
- Apple’s Privacy Fight Could Be Even Worse in Europe: Law enforcement has generally counted on cooperation from the private sector in obtaining data for police investigations.
In FX, ahead of the key ECB meeting today, few were expecting any fireworks in the market, with the EUR pairs notably quiet as pre decision positioning extremely light. EUR/USD continues to hold the upper 1.0900’s, with 1.1000+ levels clearly too rich under the circumstances, The is market ready for some disappointment, and will be looking for more than the 10bp cut in the deposit rate, though changes to the APP are unquantifiable. EUR/GBP has also been resisting .7700 on the downside, which in turn is limiting Cable upside, though not for the want of trying. NZD/USD has recovered some ground after the surprise RBNZ rate cut, though topping out around .6680-85 for now. AUD/USD is holding off .7500 in the meantime. The JPY pairs have all eased off better levels, though the lead USD rate still looking comfortable on a 113.00 handle. Oil steady, so CAD ranges kept tight accordingly.
In commodities, price action in Oil has been choppy this morning but Brent crude has managed to stay above the pivotal USD 40/bbl level with WTI staying above USD 37/bbl respectively. Gold has moved lower by USD 3.00/oz but many traders will be looking ahead to the ECB rate announcement and meeting later today. Iron ore is still extending its gains after a minor reprieve yesterday with many analyst citing profit taking as for that brief decline.
In addition to the ECB announcement, today on the US calendar we have the latest US initial jobless claims data along with the February Monthly Budget Statement.
Bulletin Headline Summary From RanSquawk and Bloomberg
- European markets have seen a tentative start to the session with all eyes firmly fixated on the ECB
- Overnight saw mixed inflation data from China with CPI rising to its highest level in 19 months but PPI declining for the 48th consecutive month
- Looking ahead today’s highlights include ECB Rate Decision, ECB’s Draghi’s (Dove) press conference and US Initial Jobless Claims
- Treasuries higher in overnight trading; global equity markets mostly lower ahead of ECB rate announcement; week’s auctions conclude with $12b 30Y bonds, WI 2.65% vs 2.50% in Feb., was lowest 30Y auction stop since record low 2.430% in Jan. 2015.
- Given the pressure on current 10Y, 30Y in repo, it’s likely “both issues will trade special even after their auction settlements on March 15,” according to Stone & McCarthy
- The ECB is forecast to ease policy via measures including an interest-rate cut and an expansion of its quantitative easing, according to economists surveyed by Bloomberg. That would add to a wave of global monetary stimulus this year
- The euro weakened, cementing its position as the world’s worst-performing major currency over the past month, as traders braced for the European Central Bank’s decision on whether to expand stimulus
- China’s central bank is preparing new regulations to allow commercial banks to directly swap non-performing loans with firms for shares in their cos, Reuters reports, citing 2 unidentified people with direct knowledge of the new policy
- New Zealand’s central bank unexpectedly cut interest rates to a fresh record low and said further easing may be needed, joining global counterparts in adding stimulus to an economy struggling to generate inflation
- Foreign banks including HSBC and Deutsche Bank are pushing back against the Federal Reserve’s proposals on implementing rules designed to end too-big-to-fail, saying they are burdensome and unfair to the U.S. units of the world’s biggest lenders
- Goldman Sachs hired the daughter of an ally to Malaysian Prime Minister Najib Razak around the time the firm’s bankers were pitching business to the country’s government investment fund, the Wall Street Journal reported, citing unidentified people
- The Sao Paulo state prosecutor’s office on Wednesday charged Luiz Inacio Lula da Silva on allegations of hiding assets, delivering a second blow to the former president in less than a week
- John Gutfreund, who was proclaimed the “King of Wall Street” in 1985 for harnessing the egos and fiefdoms of Salomon Brothers into one of the most profitable investment- banking firms, has died. He was 86
- $8b IG corporates priced yesterday; WTD $40.895b, 4th straight week to top $40b; MTD $82.72b, YTD $376.97b
- Sovereign 10Y bond yields mixed; European, Asian markets mixed; U.S. equity-index futures rise. WTI crude oil, copper drop, gold rises
DB’s Jim Reid concludes the overnight event wrap
As we head into the big event, the last 24 hours or so have proven to be relatively constructive for risk, with price action yesterday a bit of a mirror image relative to that risk-off move which had swept over Tuesday’s session. In line with the recent trend, much of the focus was on the resumption of gains across the energy space after we saw WTI (+4.90%) more than wipe out the prior day losses to surge above $38/bbl and in the process settle at the highest level since December 4th. A greater than expected decline in gasoline stockpiles last week was attributed to the move. It was a positive day across much of the metals space too with Copper (+1.38%), Zinc (+2.10%) and Nickel (+3.49%) all in rebound mode. Iron ore (-8.82%) did however manage to give up some of those huge gains from Monday while the FT ran an interesting/amusing story suggesting that a horticultural show in the Chinese industrial city of Tangshan was the major cause of that rally as steel mills rushed to buy before being forced to close in order to keep skies blue for the show!
By the closing bell last night the S&P 500 had edged up +0.51% meaning this month the index has closed higher on six of the seven trading days so far. European equity markets closed up similar amounts with the Stoxx 600 announcing the 1y anniversary of the start of ECB QE with a +0.49% gain. Unsurprisingly some of the more volatile moves came in the form of the Euro which was at one stage down 0.6% versus the Dollar, before paring all of that move into the close to finish more or less unchanged around 1.10 (although it is a touch softer this morning). Rates markets were weaker on the whole, although that appeared to reflect a reversal in the price action for JGB’s after that big rally the day prior. 10y Bund yields in particular closed nearly 6bps higher yesterday and are hovering around 0.239%.
Flipping our focus over to the latest in Asia now where the attention this morning is on China with the latest inflation numbers having been released. Last month saw an uptick in prices with CPI printing at +1.6% mom. That’s helped nudge the YoY rate up to +2.3% (vs. +1.8% expected) and by fivetenths relative to January, with the print now the highest since July 2014. The move higher does however appear to be driven by a big surge in food prices (+7.3% yoy vs. +4.1% in January) with much of the commentary attributing this to the timing of Chinese New Year. Services inflation on the other hand slowed last month. Encouragingly PPI also saw an uptick to -4.9% yoy (as expected) from -5.3% in the prior month.
Bourses in China have seemingly reacted negatively to the data with the Shanghai Comp (-0.48%) and CSI 300 (-0.39%) both down just after the break, although we warn that markets there have been especially volatile again recently post the midday break that occurs as we go to print. Elsewhere markets are largely following the lead from the US last night and trading with a positive tone. The Nikkei (+1.42%), Hang Seng (+0.57%) and Kospi (+1.18%) in particular all up, while Oil markets are little changed.
There’s also been some focus on New Zealand after a surprising rate cut out of the RBNZ late last night (25bps cut to 2.25%). That caught the vast majority of commentators by surprise with only 2 of 17 economist estimates on Bloomberg forecasting a cut. The Kiwi Dollar is down 2% (vs. the Dollar) from the moments prior to the cut, with the bond curve rallying in tune. This comes after the Bank of Canada left rates unchanged yesterday (as expected). In terms of yesterday’s data, the January wholesale inventories report for the US saw an unexpected +0.3% mom rise, after expectations had been for a – 0.2% decline. That said, trade sales were much weaker than expected during the month (-1.3% mom vs. -0.3% expected) which has pushed the inventoryto- sales ratio to the highest since April 2009. Meanwhile, during the European session yesterday we saw the January industrial production data from the UK modestly undershoot expectations with a +0.3% mom rise (vs. +0.4% expected), although manufacturing production (+0.7% mom vs. +0.2% expected) was markedly better than consensus.
Taking a look at today’s calendar, this morning in Europe we’ll be kick off in Germany where we’ll get the January trade numbers including the export and import data. Swiftly following this will be the January industrial production data out of France before market attention turns towards the ECB meeting at 12.45pm GMT. As a reminder we’ll also hear from ECB President Draghi shortly after. Away from that the latest US initial jobless claims data is due along with the February Monthly Budget Statement.
Let us begin;
ASIAN AFFAIRS
Late WEDNESDAY night/ THURSDAY morning: Shanghai closed DOWN BY 58.20 POINTS OR 2.03% ON A LAST HR PLUMMET, / Hang Sang closed DOWN by 11.84 points or 0.06% . The Nikkei closed UP 210.15 or 1.26%. Australia’s all ordinaires was DOWN 0.14%. Chinese yuan (ONSHORE) closed UP at 6.5105. Oil GAINED to 38.38 dollars per barrel for WTI and 40.83 for Brent. Stocks in Europe so far MOSTLY THE GREEN RESPONDING TO THE OIL RAMP UP AND WAITING DRAGHI’S DECISION ON INTEREST RATES . Offshore yuan trades 6.5175 yuan to the dollar vs 6.5105 for onshore yuan/ LAST WEDNESDAY, MOODYS DOWNGRADES CHINA’S CREDIT FROM STABLE TO NEGATIVE. At the big people’s congress where they meet to set a 5 year plan, the leaders failed to deliver a major fiscal stimulus package. However instead they made very promises.
end
report on China:
Food prices explode in China. However PPI or producer prices slump for the 47th straight month:
(courtesy zero hedge)
China Food Inflation Explodes To 4 Year Highs As Producer Prices Slump For 47th Straight Month
For the 47th month in a row, China’s Producer Prices have fallen year-over-year – a record deflationary streak. CPI rose 2.3% YoY – the fastest pace since May 2014(against expectations of a 1.8% rise in consumer prices, and at the upper end of the +1.5% to +2.4% range). PPI printed as expected with a 4.9% YoY plunge in producer prices (-4.5% to -5.5% range). However, what is most disturbing – from both a social unrest and economic-stimulus-hope basis, is that Food prices exploded 7.3% YoY – the most in 4 years.
CPI accelerating and PPI slumping..

“The uptick in consumer prices is certainly striking,” Bloomberg Intelligence economists Tom Orlik and Fielding Chen wrote in a report. “But with virtually the entirety of the increase coming from food prices, it’s not an increase that’s likely to be sustained for long. Food prices are subject to supply shocks and seasonal blips.”
But, it looks like Food-flation is here to stay… China Pork prices were up 18.8% YoY in January (we can’t wait to see the Feb data now)

As Bloomberg noted recently,
“It’s really a problem of lack of domestic growth and domestic demand,”John Zhu, an economist at HSBC Holdings Plc in Hong Kong, said in a Bloomberg Television interview. “The longer you get negative PPI, the more the risk that inflation expectations get dragged lower.”
Factory-gate deflation will probably moderate to about 5 percent in the first quarter, according to Niu Li, an economist at the State Information Center, a research arm of the National Development and Reform Commission, the nation’s chief planning agency.
“The producer-price index is still much lower than what we thought, indicating severe difficulties in the industrial sector,” Niu said in an interview. “The PBOC is unlikely to impose any major change in its monetary policies because of the reading.”
And so with PPI tumbling and CPI surging – expectations for some yuuge stimulus package are wishful thinking.
Yuan is tumbling on the data…

And if anyone needed a lesson in market “efficiency”, Dow Futures spiked 70 points on this decidedly bearish (i.e. no stimulus) data – note that the momentum started early and then snapped it higher on the data… only to fade back…

Charts: Bloomberg
China Proposes Unprecedented Nationalization Of Insolvent Companies: Banks Will Equitize Non-Performing Loans
In what may be the biggest news of the day, and certainly with far greater implications than whatever Mario Draghi will announce in a few hours when we will again witness the ECB doing not “whatever it takes” but “whatever it can do”, moments ago Reuters reported that China is preparing for an unprecedented overhaul in how it treats it trillions in non-performing loans.
Recall that as we first wrote last summer, and as subsequently Kyle Bass made it the centerpiece of his “short Yuan” investment thesis, the “neutron bomb” in the heart of China’s impaired financial system is the trillions – officially at $614 billion but realistically anywhere between 8% and 20% of China’s total $35 trillion in bank assets – in non-performing loans. It is the unknown treatment of these NPLs that has been the greatest threat to China’s just as vast deposit base amounting to well over $20 trillion, which has been the fundamental catalyst behind China’s record capital flight as depositors have been eager to move their savings as far from China’s domestic banks as possible.
As a result, conventional thinking such as that proposed by Bass, Ray Dalio, KKR and many others, speculated that China will have to devalue its currency in order to inflate away what is fundamentally an excess debt problem as the alternative is unleashing a massive debt default tsunami and “admitting” to the world just how insolvent China’s state-owned banks truly are, not to mention leading to the layoffs of tens of millions of workers by these zombie companies.
However, China now appears to be taking a surprisingly different track, and according to aReuters report China’s central bank is preparing regulations that would allow commercial banks to swap non-performing loans of companies for stakes in those firms. Reuters sources said the release of a new document explaining the regulatory change was imminent.
According to Reuters, the move would represent, “on paper, a way for indebted corporates to reduce their leverage, reducing the cost of servicing debt and making them more worthy of fresh credit.”
It gets better.
It would also reduce NPL ratios at commercial banks, reducing the cash they would need to set aside to cover losses incurred by bad loans. These funds could then be freed up for fresh lending for investment in the new wave of infrastructure products and factory upgrades the government hopes will rejuvenate the Chinese economy.
It is certainly possible that this is merely a trial balloon, one which as was the case repeatedly during Europe’s crisis uses Reuters as a sounding board to gauge the market’s reaction, however the reality is that China may truly be desperate enough to pursue this option.
Because what is lacking in the Reuters explanation is that this proposal entails nothing short of a nationalization on a grand scale, one which gives China’s impaired commercial banks – all of which are implicitly state controlled – the “equity keys” to the companies to which they have given secured loans, loans which are no longer performing because the underlying assets are clearly impaired, and where the cash flow generated can’t even cover the interest payments.
In effect, the PBOC is proposing the biggest debt-for-equity swap ever seen. What it also means is that since the secured lender, which is at the top of the capital structure will drop all the way down, it wipes out the existing equity and unsecured debt, and make the banks the new equity owners, and as such China’s commercial banks will no longer be entitled to interest payments or security collateral on their now-equity investment.
Finally, while this move does free up loss reserves, it essentially strips banks of their security and asset protection which they enjoyed as secured lenders.
So why is China doing this?
As Reuters correctly noted, by equitizing trillions in bad loans, it frees up the corporate balance sheets to layer on fresh trillions in bad debt, the same debt that pushed these zombie companies into insolvency to begin with.
What this grand equitization does not do, is make the underlying business any more profitable or viable: after all the loans are bad because the companies no longer can generate even the required cash interest payment – as a result of China’s unprecedented excess capacity and low commodity prices which prevent corporate viability. It has little to do with their current balance sheet.
That, however, is irrelevant to the PBOC which is hoping that by taking this step it can magically eliminate trilliions in NPL from commercial bank balance sheets in what is not only the biggest equitization in history, but also the biggest diversion since David Copperfield made the statue of liberty disappear, as instead of keeping the bad loans on the asset side as NPLs, thus assuring at least some recoveries, the banks are crammed down and when the next NPL wave hits, their exposure will be fully wiped out as mere equity stakeholders.
So why are banks agreeing to this? Because they know that as quasi (and not so quasi) state-owned enterprises, China’s commercial banks are wards of the state and when the ultimate impairment wave hits and banks have to write down trillions in “equity investments”, Beijiing will promptly bail them out.
Essentially, in one simple move, Beijing is about to “guarantee” trillions in insolvent Chinese debt.
In short, as pointed out earlier, what the PBOC has proposed is the biggest “shadow nationalization” in history, one which will convert trillions in bad loans in insolvent enterprises into trillions in equity investments in the same enterprises, however without any new money actually coming in! Which means it will be up to new credit investors to prop up these failing businesses for a few more quarters before the reorganized equity also has to be wiped out.
Going back to the Reuters, it reports, that “the new regulations would be promulgated with special approval from the State Council, China’s cabinet-equivalent body, thus skirting the need to revise the current commercial bank law, which prohibits banks from investing in non-financial institutions.”
Of course the reason why commercial bank law prohibited banks from investing in non-financial institutions is precisely because it is a form of nationalization; only this time it will be worse – China will be nationalizing its most insolvent, biggest zombie companies currently in existence.
Reuters also observes that in the past Chinese commercial banks usually dealt with NPLs by selling them off at a discount to state-designated asset management companies. “The AMCs would turn around and attempt to recover the debt or resell it at a profit to distressed debt investors.” That China has given up on this approach confirms that there is just too much NPL supply and not nearly enough potential demand to offload these trillions in bad loans, hence explaining what may be the biggest nationalization in history.
Finally, Reuters concludes that “the sources did not have further detail about how the banks would value the new stakes, which would represent assets on their balance sheets, or what ratio or amount of NPLs they would be able to convert using this method.” Which is to be expected: in this grand diversion the last thing China would want is to reveal the proper math which would show how both China’s commercial banks, and the government itself, are about to guarantee trillions in insolvent assets.
While this is surely good news for the very short run, as it allows the worst of the worst in China’s insolvent corporate sector to issue even more debt, in the longer run it means that China’s total debt to GDP, which is already at 350% is about to surpass Japan’s gargantuan 400% within a year if not sooner.
END
Bunds, Euro Tumble As Super Mario Sends Stocks, Credit Soaring
“Whatever it takes” has morphed to “throw everything at it and pray.” In a bigger-than-expected bazooka, Mario Draghi sent EURUSD tumbling, Bund yields rising, and stock prices surging (along with considerable bond spread compression). Bank stocks are limit up in various regions but the real question is – what happens if this “doesn’t work”?
EUR tumbles (but only to one week lows)

Despite the uber QE, Bunds are disappointed with only a 10bps cut…

DAX is surging…

Bank stocks are soaring (led by limit-up moves in Italy)

Credit spreads are collapsing…

And of course, US equities are loving it… because all stimulus is fungible (and useless)

Charts: Bloomberg
Draghi Delivers The Bazooka: ECB Announces Surprise Refi, Marginal Rate Cuts; Boosts QE To €80BN, Adds IG Bonds
Well, the people wanted a “bazooka-sized” surprise from Draghi, and they got it.
Moments ago the ECB announced not only a 10 bps cut to the deposit rate expected pushing it to -40%, but also announced a 5 bp rate cut to the refinance (pushing it to 0.00%) and the marginal lending rate (now at 0.25%), and also boosted QE by €20bn to €80 billion per month, the addition of a four new targeted TLTROs each with a maturity of 4 years, but the most surprising announcement was that the ECB would also for the first time include investment grade euro-denominated bonds issued by non-bank corporations along the list of assets that are eligible for regular purchases.
In other words, Draghi finally delivered his bazooka.
Monetary policy decisions
At today’s meeting the Governing Council of the ECB took the following monetary policy decisions:
(1) The interest rate on the main refinancing operations of the Eurosystem will be decreased by 5 basis points to 0.00%, starting from the operation to be settled on 16 March 2016.
(2) The interest rate on the marginal lending facility will be decreased by 5 basis points to 0.25%, with effect from 16 March 2016.
(3) The interest rate on the deposit facility will be decreased by 10 basis points to -0.40%, with effect from 16 March 2016.
(4) The monthly purchases under the asset purchase programme will be expanded to €80 billion starting in April.
(5) Investment grade euro-denominated bonds issued by non-bank corporations established in the euro area will be included in the list of assets that are eligible for regular purchases.
(6) A new series of four targeted longer-term refinancing operations (TLTRO II), each with a maturity of four years, will be launched, starting in June 2016. Borrowing conditions in these operations can be as low as the interest rate on the deposit facility.
The President of the ECB will comment on the considerations underlying these decisions at a press conference starting at 14:30 CET today.
More from Draghi in 45 minutes.
end
The ECB’s Embarrassing Inflation Forecast Implodes
Three months ago, when the ECB released its latest quarterly inflation expectations, we mocked that “there is a bit of a hockeystick” going from 2015 to 2016, when HICP inflation was expected to soar from 0.1% to 1.0%.
“in March 2014, the ECB predicted 2016 year end inflation would be 1.5%. It now predicts it will rise to 1.0%, decidedly lower than the 1.5% predicted in June, and yet in our humble opinion, still about 1% higher than where it will end up.”
Visually:

We were right, because moments ago the ECB reveled its latest, 2016 year-end inflation forecast, which suffered a spectacular implosion, plunging from December’s 1.0%, to a laughable 0.1%, still technically 0.1% above our modest prediction which once again was essentially spot on… and the ECB was dead wrong.

Draghi Blew It – Euro, Stocks Retrace Bazooka Bounce
Within an hour of unleashing the yuuge bazooka, Draghi blew it by failing Central Planning 101:
- *DRAGHI DOESN’T ANTICIPATE MORE RATE CUTS BASED ON CURRENT VIEW
As we tweeted – you never close an open-ended monetary stimulus package…
EURUSD has entirely retraced the plunge and Dow futures are tumbling back to reality…

From hero to zero! And it’s getting worse…

And worser…

Banging The USD Index back below its 200-day moving-average…

end
Did Draghi Just Blow His Bazooka’s Wad: Gold Soars, EUR Spikes
Did we just witness peak bullshit?
From omnipotent to impotent in an hour…

Sending gold soaring – after 4 slams in the last 2 days…

So first Yellen… Gold +18% since the rate hike (stocks lower)

Then Kuroda… (JPY strength and stock weakness)

And now Draghi (EUR strength) – the centrally-planned world is losing faith in its ‘leaders’.
This Is The $1 Trillion In European IG Bonds Which The ECB Is Now Buying
Ever since the start of ECB’s QE, one of the biggest concerns has been how will the ECB continue monetizing €60 billion in debt in a market that is increasingly illiquid and running out of collateral. Moments ago we got the answer when the ECB not only went even deeper into negative rates territory, cutting all three of its main rates, but boosted QE by €20BN.
To be sure, if the ECB had maintained the universe of eligible assets as currently, it would immediately drain the govie market of what little liquidity there was, sending the Bund curve negative until the 30Y. Recently Goldman Sachs Group estimated that had it boosted QE by just €10 billion with the same collateral pool, the ECB would run out of German government debt to buy in 10 to 12 months.
Which is why the ECB had no choice but to expand its universe of eligible securities to include EUR-denominated, European non-financal Investment Grade bonds.
In doing so Draghi has officially opened the Pandora’s box of purchasing not only sovereign securities but corporate ones, something the BOJ has been doing for years with REITs and ETFs, and leads to the question: once the bonds the ECB holds are equitized (along the lines of what China announced earlier today), will the European Central Bank be an active, or passive, equity shareholder. Better: if the ECB is buying IG bonds, why not Junk, or stocks, or oil, or anything else?
Actually, there is no definitive answer, which is why sooner or later the ECB will do just that.
Here are some more thoughts from Bloomberg:
The next target for the European Central Bank’s expanding asset purchase program: the region’s 900 billion-euro ($980 billion)corporate-bond market.
The ECB will buy investment grade euro-denominated bonds issued by non-bank corporations established in the euro area, according to a press release on Thursday.
Corporate bonds are the latest assets to be added to a growing list of securities, from government debt to mortgage-backed notes, the central bank is snapping up to combat weak growth and inflation. Buying company bonds may also demonstrate a greater tolerance for risk at the central bank as the securities are typically unsecured.
The ECB has bought 786.8 billion euros of assets since October 2014. It expanded its purchasing target to 80 billion euros a month starting in April, according to the statement. Government bonds have accounted for the largest portion of ECB acquisitions, at 77 percent, while asset-backed securities account for less than 3 percent.
The central bank has already dipped its toe into the water of corporate debt markets by adding state-backed company bonds, including securities from Italian utility Enel SpA, to the list of assets eligible for purchase last year.
The following, however, is paramount, because there is no such thing as a free lunch, especially when Central Banks are going all in into a market which no longer has any liquidity:
ECB purchases of company securities could serve to limit liquidity in a market where investors say it’s become harder to trade after banks cut their bond holdings to preserve capital in response to tougher rules.
Finally here, courtesy of Goldman, is a snapshot of the total size of Europe’s Investment Grade market: this is where the ECB’s trading desk will now be actively buying. Of the €1.6 Trillion in total IG bonds, €700 billion is in financials, meaning Draghi has about $1 trillion in total non-fin IG bonds to monetize until he moves on to Junk bonds, equities and of course oil.

It is unclear what happens to those IG bonds that the ECB has purchased if and when they get downgraded to junk.
Within 6-9 months we expect to add a chart showing Europe’s junk bond market which will be next on the monetization menu, followed shortly after by equities and kitchen sinks.
The only thing the ECB will never monetize, however, is gold – perhaps because it is the only asset class that does not need central bank support?
DAX Crashes 500 Points From Draghi Highs
Well that escalated quickly…
From 9,700 to 10,000 to 9,500 in 4 hours…

end
Goldman Turns Bearish: “Relief Rally Was Too Fast, We Do Not Feel Comfortable Taking More Risk”
The market’s volatile swing are clearly too much for the central banker-incubating hedge fund known as Goldman Sachs, because just three days after Goldman said there has “never been a better time to buy S&P calls”, when it said that “our GS-EQMOVE model estimates there is a 21% probability of a 5% up-move over the next month based on the current levels of S&P 500 Free Cash Flow yield, Return on Equity, ISM new orders and US Capacity Utilization“…

… moments ago the same Goldman announced that:
“the recent relief rally might be short-lived, especially with oil prices now at the upper end of our commodities team’s forecast range for 1H 2016.“
and adding that “we make no changes to our asset allocation at this stage as the relief rally has been too fast, in our view. We still do not feel comfortable taking more risk in equities until valuation or growth becomes more attractive.”
Gartman flip-flopping within 3 days is normal, but Goldman? As for the “relief rally” being short-lived, it might be even shorter if Goldman’s various divisions for some reason are unable to communicate with each other on how to best fleece muppets.
This is what else Goldman thinks in its latest “recommendation”:
We make no changes to our asset allocation at this stage as the relief rally has been too fast, in our view. We still do not feel comfortable taking more risk in equities until valuation or growth becomes more attractive. Although we believe the market has been too pessimistic, we think a key driver of the relief has been higher oil prices. With oil at the upper end of our commodities team’s forecast range for 1H 2016, it could drive further volatility as we do not believe oil weakness is necessarily over. We still believe credit remains attractive, particularly in Europe, where further ECB easing and good credit fundamentals remain supportive. Although US high yield has rallied recently, over the near term we remain Neutral US HY within credit. Despite seeing fundamental value in US HY spread levels, downside risk to oil makes us tactically cautious (see Global Markets Daily: Oil and HY redux, March 8, 2016). We remain Underweight bonds given the relatively low level of yields, potential for reflation, and our economists’ expectation that the Fed rate hike cycle continues in June. We retain our relative preference for German Bunds over US Treasuries as policy divergence should play out over the coming months and drive the Treasury-Bund rate differential significantly wider.
Some more observations:
Volatility potential in a central bank filled month…should not be too unfamiliar given past moves
The ECB meets this Thursday (March 10), with the BoJ and Fed meeting next week…. Measuring how frequent extreme asset price movements have been in the past, the figure on the left below plots the average number of days over the prior 12 months with return moves (positive or negative) of 3 standard deviations or more by asset class, using rolling 1-year standard deviations. Since 1986, no period besides 2008-09 has had a larger number of relatively extreme asset price movements than we have experienced recently. This has been particularly true for the 10-year government bond and FX markets.The figure on the right breaks down extreme movements by region by taking averages of 3-SD return days in Europe and the US across equity, 10y bonds, and IG and HY credit. We find that, of late, large asset price movements in Europe have become more prevalent than in the US, which is somewhat unsurprising given the higher volatility of those markets. EUR/USD has seen significant movements around the period of QE (both in the US and Europe) as policy drove near-term rate differentials and currency moves.
Notably, assets moving from a low- to high-vol regime are most likely to have a large number of 3-SD return days, as relatively extreme movements are easier to achieve when trailing vol is low, but these extreme days then contribute to raising realized vol. Thus, a decrease in a large number of 3-SD return days may actually signal a transition has occurred from a low- to a higher-volatility regime. We believe we will remain in a high-volatility regime, with no particular asset being immune, until a combination of policy, oil prices and growth stabilise.

How the ECB plays into this:
In our view, before the ECB may still be too early to enter the front end of the European equity vol curve. Should the ECB meet expectations or surprise, it is likely that short-dated equity vol may come down further, which we think could present an opportunity to go long shorter-dated equity vol in Europe.
Since it is safe to say the ECB massively disappointed, it is now time to play short-dated equity vol, which once again has a green light to surge higher.
Your early morning currency/gold and silver pricing/Asian and European bourse movements/ and interest rate settings/THURSDAY morning 7:00 am
Euro/USA 1.0981 down .0004
USA/JAPAN YEN 113.63 UP .410 (Abe’s new negative interest rate (NIRP)a total bust
GBP/USA 1.4212 UP .0009 (threat of Brexit)
USA/CAN 1.3266 UP.0018
Early THIS THURSDAY morning in Europe, the Euro FELL by 4 basis points, trading now JUST above the important 1.08 level falling to 1.0981; Europe is still reacting to deflation, announcements of massive stimulation (QE), a proxy middle east war, and the ramifications of a default at the Austrian Hypo bank, an imminent default of Greece, Glencore, Nysmark and the Ukraine, along with rising peripheral bond yield further stimulation as the EU is moving more into NIRP, and the threat of continuing USA tightening by raising their interest rate / Last night the Chinese yuan was UP in value (onshore) The USA/CNY DOWN in rate at closing last night: 6.5105 / (yuan UP but will still undergo massive devaluation/ which will cause deflation to spread throughout the globe)
In Japan Abe went BESERK with NEW ARROWS FOR HIS Abenomics WITH THIS TIME INITIATING NIRP . The yen now trades in a SOUTHBOUND trajectory RAMP as IT settled DOWN in Japan by 41 basis points and trading now well BELOW that all important 120 level to 113.04 yen to the dollar. NIRP POLICY IS A COMPLETE FAILURE AND ALL OF OUR YEN CARRY TRADERS HAVE BEEN BLOWN UP
The pound was UP this morning by 9 basis points as it now trades WELL ABOVE the 1.40 level at 1.4212.
The Canadian dollar is now trading DOWN 18 in basis points to 1.3396 to the dollar.
Last night, Chinese bourses were ALL DOWN/Japan NIKKEI CLOSED UP 210.15 POINTS OR 1.26%, HANG SANG DOWN 11.84 OR 0.06% SHANGHAI DOWN 58.20 OR 2.03% ON LAST HOUR PLUMMET / AUSTRALIA IS LOWER / ALL EUROPEAN BOURSES ARE MIXED, as they start their morning/.
We are seeing that the 3 major global carry trades are being unwound. The BIGGY is the first one;
1. the total dollar global short is 9 trillion USA and as such we are now witnessing a sea of red blood on the streets as derivatives blow up with the massive rise in the rise in the dollar against all paper currencies and especially with the fall of the yuan carry trade. The emerging market which house close to 50% of the 9 trillion dollar short is feeling the massive pain as their debt is quite unmanageable.
2, the Nikkei average vs gold carry trade (blowing up and the yen carry trade HAS BLOWN up/and now NIRP)
3. Short Swiss franc/long assets blew up ( Eastern European housing/Nikkei etc.
These massive carry trades are terribly offside as they are being unwound. It is causing global deflation ( we are at debt saturation already) as the world reacts to lack of demand and a scarcity of debt collateral. Bourses around the globe are reacting in kind to these events as well as the potential for a GREXIT>
The NIKKEI: this THURSDAY morning: closed UP 210.15 OR 1.26%
Trading from Europe and Asia:
1. Europe stocks MOSTLY THE GREEN
2/ CHINESE BOURSES ALL IN THE RED/ : Hang Sang CLOSED IN THE RED. ,Shanghai IN THE RED/ Australia BOURSE IN THE RED: /Nikkei (Japan)GREEN/India’s Sensex in the RED /
Gold very early morning trading: $1249.60
silver:$15.29
Early THURSDAY morning USA 10 year bond yield: 1.87% !!! DOWN 2 in basis points from last night in basis points from WEDNESDAY night and it is trading WELL BELOW resistance at 2.27-2.32%. The 30 yr bond yield falls to 2.66 DOWN 1 in basis points from WEDNESDAY night.
USA dollar index early THURSDAY morning: 97.34 UP 17 cents from WEDNESDAY’s close.(Now below resistance at a DXY of 100)
This ends early morning numbers THURSDAY MORNING
Portuguese 10 year bond yield: 3.13% DOWN 3 in basis points from WEDNESDAY
Oil Plunges As OPEC/NOPEC “Freeze Production” Meeting Reportedly Unlikely To Happen
When it rains impotence, it pours. All that lying, hope, and hype and now this:
- OPEC, NON-OPEC MEETING UNLIKELY TO HAPPEN ON MARCH 20 AS IRAN YET TO COMMIT TO OIL PRODUCTION FREEZE – SOURCES…
And oil is tumbling…

And yet the Nigerians were so sure…or just outright lying!!

Why Saudi Arabia Has No Intention To End The Oil Glut
Submitted by Dwayne Purvis via OilPrice.com,
In the geopolitical and oligopolistic global oil market, purely financial supply and demand has often been a secondary force, acting when it is allowed to act. It is the strategic behavior of the producing titans,not their talk or the slow-motion supply-demand balance, which has the real power to move markets.That is the case in the last two years and remains the case in 2016.
The behavior of Saudi Arabia since 2014 has demonstrated the intent to increase both capacity and supply, a pattern not yet mitigated despite a distracting news feed from OPEC and the kingdom.

(Click to enlarge)
Figure 1: Rig counts in US (oil-directed) and Saudi Arabia.
Figure 1 shows the rig counts in Saudi Arabia and the United States from 2009 to last week. (footnote: The U.S. count is oil-directed rigs while it is the total rig count in Saudi Arabia which produces mainly associated gas and exports none.) The data is shown on two different scales in such a way that the curves are equivalent during 2012 and 2013 as this was a relatively stable baseline with Saudi running 80 to 85 rigs, and 1300 to 1400 were drilling for oil in the US. What is most interesting are the actions since then.
As the shale oil revolution had sustained momentum at prices near $100 /bbl, Saudi Arabia began the second most rapid rig count expansion in its history starting in late 2013. During 2014, while the potential for oversupply was clearly known and even as prices turned sharply down in the latter half of the year, Saudi continued ramping up its rig count.
In late November 2014, the semi-annual OPEC meeting turned dissentious, and the group closed without even the pretense of a target production volume. Starting in November and continuing through March, the Saudi rig count grew in its third largest expansion in history, increasing 15 percent in four months.
At the same time, U.S. rig count was falling. Slowly at first in 2014, the rig count responded modestly to reductions in price. After the November 2014 OPEC meeting, though, the U.S. rig count began its freefall, retracing the path of the 2008 downturn. The contrast shows boldly in Figure 1. As the U.S. imploded, Saudi Arabia was ramping up.
For comparison, Saudi Arabia had a couple of times in history, though not always, reduced its rig count as the U.S. rig count dropped. Most notably, Saudi Arabia reduced then stabilized its rig count following its price war of 1986. For most of the 1990s and early 2000s the Saudi rig count tracked the same kind of pattern as the oil-directed rigs in the U.S. During the collapse of 2008-2009, Saudi Arabia again curtailed its rig count.
Of course, rig count alone doesn’t mean nearly as much in the Saudi command-based supply; rig count reveals more about intent and planning than current action. The real test is how the presumed increased capacity is used. Figure 2 shows that behavior, tracing Saudi production alongside oil prices. The market, presumably watching the implosion of rig count, responded by lifting WTI oil prices back into the $60s/bbl, and Saudi Arabia then responded by promptly increasing its supply, sending prices back down again. Even as prices slowly descended close to inflation-adjusted, long-term lows, the Saudi rig count slowly ramped up, and moderated its production only somewhat.

(Click to enlarge)
Figure 2: Oil production by Saudi Arabia and WTI spot market price as a proxy for world oil prices.
Talk of a consensus action to freeze production was rumored in January, and word of a partial agreement including Russia and Saudi Arabia hit the news in mid-February, marking the beginning of a rally in prices. It is ironic that news of a cap on further increases should be a signal for price increase in a widely oversupplied market with slow changes in demand and U.S. production. A cap on production would possibly shorten the extended period of oversupply, but certainly not alleviate it anytime soon.
Perhaps influenced by short-covering by financial speculators and perhaps influenced by dropping exchange rates for the dollar, the rally does not, in any event, mark a change to the outlook for either supply-demand fundamentals or strategic behavior of the titans. The behavior of all parties is likely to follow the thinking explained recently the Kuwaiti oil minister—if Iran doesn’t participate, then they plan to produce at full capacity. Iran has called the idea of a cap on increases “ridiculous,” and, even if they were to agree to a cap, the Saudi oil minister says rightly that there is little trust among OPEC members.
In the meantime, the rig count suggests that Saudi Arabia continues to plan for higher levels of supply. While Saudi Arabia and OPEC have talked intermittently about increasing demand and decreasing supply, about minute increases for use during Ramadan and even about the possibility of caps on production, their actions have not always comported with the distracting, laissez-faire attitude suggested by their commentary. The February rig count was only one rig shy of the kingdom’s all-time high set in December, an increase of four rigs over its January count. And its January production was higher than December by a volume roughly equal to the downward effect of all of the forces of supply and demand on U.S. production.
Gold Soars As Draghi “Dud” Unleashes Chaos In Bonds, Stocks, & FX
You get nothing…”
This was not the day many had planned on…After the initial “as expected” move,everything went pear-shaped for the central planners when Draghi committed the ultimate sin – closing an open-ended monetary policy…

The USD was hammered, gold surged, and stocks and oil gave up gains…

Then The PPT stepped in to save the world, ramped us back to VWAP…

And Dow back to 17,000…unfriggingbelievable!!

* * *
Surveying some of the damage (that was unable to benefit from US manipulation)…
Let’s start with the worst…EURUSD screamed almost 400 pips off the post-Draghi lows…

As Bespoke notes, today is the largest positive reversal (3.2%) off an intraday decline of at least 1% in the history of the Euro.

We could show all kinds of epic fail European markets, but Italian banks – with their exploding NPLs – are the best example. After smashing to a halt limit-up, they fell back to earth to practically unchanged by the close…

* * *
After yesterday’s idiotic ramp to perfectly end Dow at 17000, things went a little bit turbo today…until the late-day re-emergence of America’s own National Team…

The plunge stalled when Europe closed – went sideways – then ripped higher to unch as NYMEX closed…to get the S&P 500 perfectly unchanged!

Look at the utter panic VIX slams to get Dow back to 17,000 (just like yesterday)…

As Shorts were once again squeezed…

Treasury yields all rose on the day (with the belly underperforming and 30Y outperforming after a strong auction all the way back to yields lower on the week)…

Dragged higher in yield by Bund weakness (as Draghi disappointed expectations for the rate cut)

Early in the day, the TSY yield curve collapsed to its lowest since Dec 2008…

Not boding well for the Dimon Bottom?

The USD Index was monkey-hammered as EURUSD’s initial drop exploded into an avalanche of short-covering… The biggest daily drop in over a month..

Gold ansd Silver outperrformed on the day as crude and copper slipped lower…

Gold recovers its quintuple whammy slams…

And oil rallied back as Europe closed for absolutely no good reason at all…

Finally, Oil Vol remains notably “cheap” relative to equity protection (for now)…

Charts: Bloomberg
Jobless Claims Joke Chart Of The Day
Initial jobless claims tumbles to 259k (from a revised 277k) near 43 year lows, leaving the smoother 4-week average lower at 267.5k. What we find “odd” about this seasonally-adjusted data is that the employment components of both the Manufacturing and Services ISM data has completely collapsed in the last few months. So what sector of the economy is maintaining the illusion?
Not The Onion…

Not even China tries this level of shenanigans.
Charts: Bloomberg
US Treasury Curve Collapses To Dec 2008 Lows
The spread between the 30Y US Treasury yield and 2Y has plunged by 7.5bps this morning (as 2Y sells off and 30Y rallies post-Draghi) to 175bps. This is the flattest curve since Dec 2008 lows (at 172bps) which can only bode poorly for financials…
30Y bonds are bid (juicy yield compared to Europe) and 2Y yields are surging (room for a Fed rate hike)…
Still buying the Dimon Bottom?
Charts: Bloomberg
end
US Treasury Yields Jump As Europeans Dump Bunds
Well we warned you. Bund yields were extremely optimistic about Draghis’ bazooka.. and were disappointed.

As traders dumped their Bund bets so this has sent Treasury yields jumping to the highs of the day (compressing the UST-Bund spread by 12bps)…

as it appears Draghi has driven a great rotation (for now) into IG credit from Treasuries.

But it seems the flow has stopped (as yields leg higher)
2008 Redux Times 10 Is Brewing
Using the “jobless claims” metric, the financial media and snake oil salesmen would have us believe that the Government-compiled jobs market metrics indicate “sustained strength in the labor market that should further dispel fears of a recession” – Reuters’ Animal Farm.
A reader asks: “if the jobs market is so good why did my bilingual daughter, who graduated with a 3.8 GPA from Ga. Tech [Dr. Paul Craig Roberts’ undergrad school], not get a job offer for two months until someone I know hired her?”
A funny thing, those Government compiled, manipulated and propagated reports. I answered with: “She was fishing in the wrong fishing hole for jobs – she should have been sending her resume to Burger King and Starbucks. But it sounds like the service sector is starting to shed jobs as well. I honestly don’t know how they are coming up with their jobs reports. As for the jobless claims, it makes sense that the claims are dropping like this. As the labor force shrinks, especially the component that would qualify for jobless benefits, the number of people who file for jobless benefits shrinks, right?”
The first time I read “1984,” I tried to imagine Orwell’s vision superimposed on the United States. Now I don’t have to imagine. Instead of Big Brother spying on us through our televisions (and they might through “smart” tvs), the Government monitors us through our cell phones, emails and web-browsing. It’s truly frightening and it’s quite stunning how so few in this country understand – or are willing to accept – the degree to which it occurs on a daily basis.
While the Ministry of Propaganda spins its wheels convincing the public of a new bull market in stocks and a robust economic recovery are both in process – bolstered by a job market with more alleged openings than bodies willing to fill those alleged openings – the underlying structure of the economic and financial system is quickly rotting away.
Zerohedge reports today that the yield spread between 2-yr and 30-yr Treasuries is at its lowest (the difference between the yield on the 2yr Treasury and the 30yr Treasury) since its low-point in 2008 – A Flat Yield Curve Spells Recession. There’s yet another comparison between 2008 and now.
The fundamental problems which caused the 2008 de facto financial collapse were never fixed. Instead, they were “treated” with money printing and the massive expansion of credit. While this enabled the operators benefiting from these subtle and insidious this wealth transfer mechanisms, it also seeded the next big systemic earthquake, which has the potential to be 10x worse than 2008.
Notwithstanding the Fed’s omnipresent intervention in the interest rate markets (Treasuries, repos, Fed funds and interest rate swap derivatives), the Fed has been unable to prevent a “flattening” of the yield curve. A flat yield curve is the Treasury market’s signal that the U.S. is going into a recession. Without that Fed intervention the Treasury would be inverted, a market event that verifies a deep recession in process.
While treating the problems with negative interest rates, money printing, debt creation and the continuous effort to systematically control the markets may temporarily cover up the symptoms of the underlying problems, it is analogous to rubbing Neosporin on melanoma. Eventually that cancerous mole will manifest as untreatable lymphoma.
The U.S. economic and political system is on the verge of a systemic disruption that will make life difficult for the entire population. It’s anyone’s guess when the catalyst hits that pushes that button, but the force with which the next 2008 times 10 hits will likely even shock and awe those of us who can see that something ugly is about to hit.
Harvey


[…] MARCH 10/GOLD AND SILVER SOAR AFTER AN OUTSIDE DAY REVERSAL/GOLD RISES TO $1272.60 UP $15.60/SILVER … […]
LikeLike
[…] by Harvey Organ, HarveyOrganblog: […]
LikeLike