
Gold: $1246.10 UP $12.50
Silver: $17.55 UP 15 cents
Closing access prices:
Gold $1245.00
silver: $17.55
XXXXXXXXXXXXXXXXXXXXXXXXXXXXXXXXXXXXXXXXXXXXXXXXXXXXXXXXXXXX
SHANGHAI GOLD FIX: FIRST FIX 10 15 PM EST (2:15 SHANGHAI LOCAL TIME)
SECOND FIX: 2:15 AM EST (6:15 SHANGHAI LOCAL TIME)
SHANGHAI FIRST GOLD FIX: 1242.36 DOLLARS PER OZ
NY PRICE OF GOLD AT EXACT SAME TIME: 1229.35
PREMIUM FIRST FIX: $13.01
xxxxxxxxxxxxxxxxxxxxxxxxxxxxxxxxxxxxxxxxxxxxxx
SECOND SHANGHAI GOLD FIX: 1245.73
NY GOLD PRICE AT THE EXACT SAME TIME: 1229.50
Premium of Shanghai 2nd fix/NY:$16.23
xxxxxxxxxxxxxxxxxxxxxxxxxxxxxxxxxxxxxxxxxxxxxxxxxxx
LONDON FIRST GOLD FIX: 5:30 am est 1232.05
NY PRICING AT THE EXACT SAME TIME: 1231.25
LONDON SECOND GOLD FIX 10 AM: 1241.60
NY PRICING AT THE EXACT SAME TIME. 1241.60
For comex gold:
MARCH/
NOTICES FILINGS TODAY FOR MARCH CONTRACT MONTH: 0 NOTICE(S) FOR NIL OZ. TOTAL NOTICES SO FAR: 72 FOR 7200 OZ (0.2239 TONNES)
For silver:
For silver: MARCH
118 NOTICES FILED TODAY FOR 590,000 OZ/
Total number of notices filed so far this month: 3418 for 17,090,000 oz
Today caught the bankers totally offside as they were in the process of raiding gold and silver throughout the night. Unbeknownst to them there would be trouble in the USA House getting the Trumpcare bill passed. The estimated volume today was 313,000 contracts for the gold comex and you can probably add another 100,000 for the final as they add the previous access market for their final calculations which will be published tomorrow. I will be very interested to see the preliminary and final open interest for both gold and silver of which I will report to you
Let us have a look at the data for today
.
xxxxxxxxxxxxxxxxxxxxxxxxxxxxxxxxxxxxxxxxxxxxxxxxxxxxxxxxxxxxxxxxxxxxxxxxxx
In silver, the total open interest ROSE BY 546 contracts UP to 187,069 with the RISE IN PRICE ( 2 CENTS) WITH RESPECT TO YESTERDAY’S TRADING. In ounces, the OI is still represented by just less THAN 1 BILLION oz i.e. 0.936 BILLION TO BE EXACT or 134% of annual global silver production (ex Russia & ex China).
FOR THE NEW FRONT MARCH MONTH: THEY FILED: 118 NOTICE(S) FOR 590,000 OZ OF SILVER
In gold, the total comex gold also ROSE BY 1096 contracts WITH THE RISE IN THE PRICE OF GOLD ($3.80 with YESTERDAY’S TRADING). The total gold OI stands at 430,386 contracts.
we had 0 notice(s) filed upon for NIL oz of gold.
xxxxxxxxxxxxxxxxxxxxxxxxxxxxxxxxxxxxxxxxxxxxxxxxxxxxxxxxxxxx
With respect to our two criminal funds, the GLD and the SLV:
GLD:
We had a huge change in tonnes of gold at the GLD: a deposit of 4.15 tonnes
Inventory rests tonight: 834.40 tonnes
.
SLV
We had no changes in inventory at the SLV/
THE SLV Inventory rests at: 332.504 million oz
CONTRAST THE GLD INVENTORY LOSS WITH THE SLV SILVER INVENTORY GAIN!!
end
.
First, here is an outline of what will be discussed tonight:
1. Today, we had the open interest in silver ROSE BY 546 contracts UP TO to 187,069 AS SILVER WAS UP 2 CENT(S) with YESTERDAY’S trading. The gold open interest ROSE BY 1,096 contracts UP to 430,386 WITH THE RISE IN THE PRICE OF GOLD OF $3.80 (YESTERDAY’S TRADING).
(report Harvey
.
2.a) The Shanghai and London gold fix report
(Harvey)
2 b) Gold/silver trading overnight Europe, Goldcore
(Mark O’Byrne/zerohedge
and in NY: Bloomberg
3. ASIAN AFFAIRS
i)Late MONDAY night/TUESDAY morning: Shanghai closed UP 10.80 POINTS OR .33%/ /Hang Sang CLOSED UP 91.13 POINTS OR 0.37% . The Nikkei closed down 65.71 .34% /Australia’s all ordinaires CLOSED DOWN 0.03%/Chinese yuan (ONSHORE) closed DOWN at 6.8890/Oil rose to 49.32 dollars per barrel for WTI and 51.99 for Brent. Stocks in Europe ALL IN THE GREEN EXCEPT LONDON ..Offshore yuan trades 6.87743 yuan to the dollar vs 6.8890 for onshore yuan.THE SPREAD BETWEEN ONSHORE AND OFFSHORE NARROWS CONSIDERABLY AGAIN/ ONSHORE YUAN STRONGER AS IS THE OFFSHORE YUAN AND THIS IS COUPLED WITH THE HUGELY WEAKER DOLLAR. CHINA SENDS HER DISPLEASURE SIGNAL TO WASHINGTON
3a)THAILAND/SOUTH KOREA/NORTH KOREA
i)NORTH KOREA
This must give you a very warm and fuzzy feeling: North Korea reveals a propaganda video of them blowing up a USA aircraft
( zerohedge)
ii)Ladies and gentlemen: Kim is a madman and must be taken out:
he threatens the USA with a “first strike” nuclear iCBM
( zero hedge)
b) REPORT ON JAPAN
c) REPORT ON CHINA
4. EUROPEAN AFFAIRS
This is interesting: the German Federal Auditor group is calling for an audit of the ECB as they need more supervision
( zero hedge)
5. RUSSIAN AND MIDDLE EASTERN AFFAIRS
6.GLOBAL ISSUES
7. OIL ISSUES
i)This is how OPEC lost the battle against the shale boys as our American friends learned how to lower their cost curve and break even points;
( zero hedge)
ii)Russia mentions production cut ( of which it does not mean) and up goes oil and then it fails
( zerohedge)
iii)API reports bigger and expected crude and a much bigger buildup at Cushing. However gasoline did have a drawdown. Oil initially rose and then plummeted on the news:
( zero hedge)
8. EMERGING MARKETS
Venezuela stops publishing money supply data. Who would have thought that they could do such a horrible act?
(courtesy zero hedge)
9. PHYSICAL MARKETS
i)Although the West slowed their appetite for gold and silver, China and Russia did not. In Feb the withdrawals (equals demand) at the Shanghai Gold Exchange showed 179 tonnes. If we extrapolate that demand for the coming year we would obtain a demand equal to 2200 tonnes or greater. China is back in demand for gold in a big way:
( Steve St Angelo/SRSRocco report)
ii)As many of you know, I am not a fan of technical analysis especially with manipulation occurring continually on the paper gold and silver markets. However very long term charts are quite intriguing as it is does give meaningful direction for these markets;
( Kingworldnews/James Turk)
10.USA STORIES
i)Early trading
ii)Then this: bank shares plummet, gold rises bond yields rise (bond prices fall) as Trumpcare vote is now in doubt:
( zerohedge)
iii)Then: liquidity collapses! as stocks tumble!!
(zero hedge)
iv)The GOP unveils changes to the Health bill but it looks like it is not enough. A failure on Thursday will be devastating to the House. Even if it does pass, it will not pass the Senate
v)Trump issues a threat to Freedom Caucus member of the Republican House who still will vote no to the bill( zerohedge)
vi)Somehow the current account deficit beats by a huge 8 standard deviations and it shrinks to only 112 billion. This would be a positive to revisions to 4th quarter GDP
( zero hedge)
vii)And now the truth behind Trump’s skiiny budget and why everything will fail:
( David Stockman/Daily Reckoning/ContraCorner)
viii) Meet the 26 holdouts to the Trumpcare bill
( zero hedge)
Let us head over to the comex:
The total gold comex open interest ROSE BY 1096 CONTRACTS UP to an OI level of 430,386 WITH THE RISE IN THE PRICE OF GOLD ( $3.80 with YESTERDAY’S trading). WE PROBABLY AGAIN HAD SOME MORE SHORT COVERING BY THE BANKERS. We are now in the contract month of MARCH and it is one of the poorer delivery months of the year. In this MARCH delivery month we had a LOSS of 15 contract(s) DOWN to 17. We had 13 contact(s) served ON FRIDAY, so we LOST 2 CONTRACT(S) or AN ADDITIONAL 200 ounces will NOT stand for delivery. The next active contract month is April and here we saw it’s OI LOST 7335 contracts DOWN TO 172,575 contracts.
For comparison purposes, the April 2016 contract at this time had an OI of 237,867 contracts. At the end of April/2016 only 12.3917 tonnes stood for physical delivery, although 21.306 tonnes stood initially at the beginning of April 2016.
The non active May contract month GAINED 136 contract(s) and thus its OI is 1088 contracts. The next big active month is June and here the OI ROSE by 7,261 contracts up to 161,531.
We had 0 notice(s) filed upon today for NIL oz
We are in the active delivery month is March and here the OI decreased by 4 contracts down to 549 contracts. We had 0 notices served upon yesterday so we LOST 4 CONTRACTS OR AN ADDITIONAL 20,000 OZ WILL NOT STAND in this active delivery month of March.
For historical reference: on the first day notice for the March/2016 silver contract: 19,020,000 oz stood for delivery . However the final amount standing at the end of March 2016: 6,755,000 oz as the banker boys were busy convincing holders of many silver contracts to cash settle just like they did today.
The April/2017 contract month GAINED 6 contract(s) to 1009 contracts. The next active contract month is May and here the open interest GAINED 445 contracts UP to 140,706 contracts.
FOR COMPARISON
Initially for the April 2016 contract, 1,180,000 oz stood for delivery. At the end of April 2016: 6,775,000 oz as bankers needed much silver to fill major holes elsewhere.
We had 118 notice(s) filed for 590,000 oz for the MARCH 2017 contract.
VOLUMES: for the gold comex
Today the estimated volume was 313,387 contracts which is very good.
Yesterday’s confirmed volume was 145,762 contracts which is very poor
volumes on gold are getting higher!
| Gold | Ounces |
| Withdrawals from Dealers Inventory in oz | nil |
| Withdrawals from Customer Inventory in oz |
nil OZ
|
| Deposits to the Dealer Inventory in oz | nil oz
|
| Deposits to the Customer Inventory, in oz |
32,976.96 oz
HSBC
|
| No of oz served (contracts) today |
0 notice(s)
NIL oz
|
| No of oz to be served (notices) |
17 contracts
1700 oz
|
| Total monthly oz gold served (contracts) so far this month |
72 notices
7200 oz
0.1835 tonnes
|
| Total accumulative withdrawals of gold from the Dealers inventory this month | NIL oz |
| Total accumulative withdrawal of gold from the Customer inventory this month | 57,961.1 oz |
Today, 0 notice(s) were issued from JPMorgan dealer account and 0 notices were issued from their client or customer account. The total of all issuance by all participants equates to 0 contract(s) of which 0 notices were stopped (received) by jPMorgan dealer and 0 notice(s) was (were) stopped/ Received) by jPMorgan customer account.
March 2016: 2.311 tonnes (March is a non delivery month)
| Silver | Ounces |
| Withdrawals from Dealers Inventory | nil |
| Withdrawals from Customer Inventory |
181,774.05 oz
Brinks
Scotia
|
| Deposits to the Dealer Inventory |
531,570.75 oz
CNT
|
| Deposits to the Customer Inventory |
667,044.965 oz
CNT
JPM
|
| No of oz served today (contracts) |
118 CONTRACT(S)
(590,000 OZ)
|
| No of oz to be served (notices) |
431 contracts
(2,155,000 oz)
|
| Total monthly oz silver served (contracts) | 3418 contracts (17,090,000 oz) |
| Total accumulative withdrawal of silver from the Dealers inventory this month | NIL oz |
| Total accumulative withdrawal of silver from the Customer inventory this month | 3,744,030.1 oz |
end
And now the Gold inventory at the GLD
March 21/a deposit of 4.15 tonnes of gold into the GLD/Inventory rests at 834.40 tonnes
March 20/WE HAD A MASSIVE 6.81 TONNE WITHDRAWAL FROM THE GLD/INVENTORY RESTS AT 830.25 TONNES/THIS GOLD MUST BE ON ITS WAY TO SHANGHAI. WITH GOLD RISING THESE PAST FEW DAYS, IT MAYS NO SENSE WHATSOEVER ON GOLD LIQUIDATION.
March 17/a huge withdrawal of 2.37 tonnes from the GLD/Inventory rests at 837.06 tonnes
March 16/no changes in gold inventory at the GLD/Inventory rests at 839.43 tonnes
March 15/ANOTHER HUGE DEPOSIT OF 4.44 TONNES/inventory rests at 839.43 tonnes
March 14/strange they whack gold and yet the GLD adds 2.93 tonnes of gold./inventory rests at 834.99 tonnes
March 13/a deposit of 6.78 tonnes of gold into the GLD/Inventory rests at 832.03 tonnes
March 10/ a withdrawal of 4.886 tonnes from the GLD/Inventory rests at 830.25
this tonnage no doubt is off to Shanghai
March 9/a withdrawal of 2.67 tonnes from the GLD/Inventory rests at 834.10
March 8/no change in gold inventory at the GLD/inventory rests at 836.77 tones
march 7/a huge withdrawal of 3.81 tonnes from the GLD inventory/inventory rests at 836.77 tonnes
March 6/No change in gold inventory at the GLD/Inventory rests at 840.58 tonnes
March 3/ a huge withdrawal of 2.96 tonnes of gold from the GLD/Inventory rests at 840.58 tonnes
March 2/a deposit of 2.37 tonnes of gold into the GLD/Inventory rests tat 843.54 tonnes
March 1/no change in gold inventory at the GLD/Inventory rests at 841.17 tonnes
FEB 28/no changes in gold inventory at the GLD/Inventory rests at 841.17 tonnes
feb 27/no change in gold inventory at the GLD/Inventory rests at 841.17 tonnes
Feb 24/no changes in gold inventory at the GLD/Inventory rests at 841.17 tonnes
FEB 23/no changes in gold inventory at the GLD/Inventory rests at 841.17 tonnes
FEB 22/no changes in gold inventory at the GLD/Inventory rests at 841.17 tonnes
FEB 21/no changes in gold inventory at the GLD/Inventory rests at 841.17 tonnes
feb 17/a withdrawal of 2.37 tonnes of gold from the GLD/Inventory rests at 841.17 tonnes
FEB 16/we had no changes in the GLD inventory today/Inventory rests at 843.54 tonnes
Feb 15./another deposit of 2.67 tonnes of gold into the GLD inventory despite another attempted whacking of gold/inventory rests at 843.54 tonnes
FEB 14/another deposit of 4.14 tonnes of gold into the GLD inventory/rests at 840.87 tonnes
FEB 13/another deposit of 4.15 tonnes of gold into the GLD/Inventory rests at 836.73 tonnes
Feb 10/no changes at the GLD/Inventory rests at 832.58 tonnes
feb 9/no changes at the GLD/Inventory rests at 832.58 tonnes
end
NPV for Sprott and Central Fund of Canada
will update later tonight the central fund of Canada figures
Sprott’s hostile 3.1 billion bid to take over Central Fund of Canada
(courtesy Sprott/GATA)
Sprott makes hostile $3.1 billion bid for Central Fund of Canada
Submitted by cpowell on Thu, 2017-03-09 01:19. Section: Daily Dispatches
From the Canadian Press
via Canadian Broadcasting Corp. News, Toronto
Wednesday, March 8, 2017
http://www.cbc.ca/news/canada/calgary/sprott-takeover-bid-central-fund-c…
Toronto-based Sprott Inc. said Wednesday it’s making an all-share hostile takeover bid worth $3.1 billion US for rival bullion holder Central Fund of Canada Ltd.
The money-management firm has filed an application with the Court of Queen’s Bench of Alberta seeking to allow shareholders of Calgary-based Central Fund to swap their shares for ones in a newly-formed trust that would be substantially similar to Sprott’s existing precious metal holding entities.
The company is going through the courts after its efforts to strike a friendly deal were rebuffed by the Spicer family that controls Central Fund, said Sprott spokesman Glen Williams.
“They weren’t interested in having those discussions,” Williams said.
Sprott is using the courts to try to give holders of the 252 million non-voting class A shares a say in takeover bids, which Central Fund explicitly states they have no right to participate in. That voting right is reserved for the 40,000 common shares outstanding, which the family of J.C. Stefan Spicer, chairman and CEO of Central Fund, control.
If successful through the courts, Sprott would then need the support of two-thirds of shareholder votes to close the takeover deal, but there’s no guarantee they will make it that far.
“It is unusual to go this route,” said Williams. “There’s no specific precedent where this has worked.”
Sprott did have success last year in taking over Central GoldTrust, a similar fund that was controlled by the Spicer family, after securing support from more than 96 percent of shareholder votes cast.
The firm says Central Fund’s shares are trading at a discount to net asset value and a takeover by Sprott could unlock US$304 million in shareholder value.
Central Fund did not have any immediate comment on the unsolicited offer. Williams said Sprott had not yet heard from Central Fund on the proposal but that some shareholders had already contacted them to voice their support.
Sprott’s existing precious metal holding companies are designed to allow investors to own gold and other metals without having to worry about taking care of the physical bullion.
end
Major gold/silver trading/commentaries for TUESDAY
GOLDCORE/BLOG/MARK O’BYRNEet.
Silver 1/ 70th The Price of Gold” – Silver Eagles Sales Jump
By Mark O’Byrne March 21, 2017
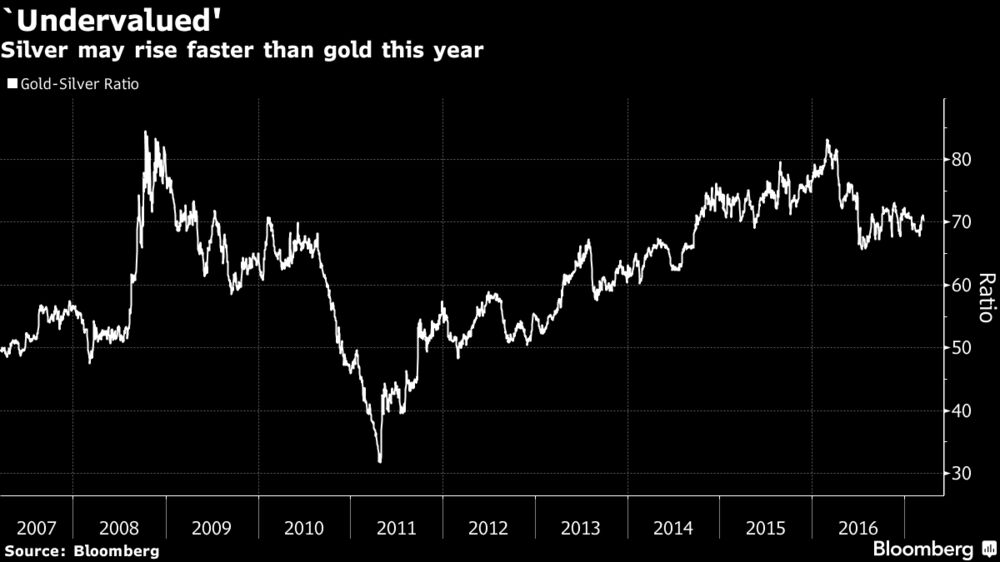
– Silver just 1/70th the price of gold
– Silver at $17.50 per ounce set to rise “faster than gold”
– Silver Eagles (1 oz) buying jumps to 715,000 this week
– “Supply may drop following mine closures” – Standard Chartered
– Industrial demand “will remain strong” – CPM Group
– Silver is substantially undervalued versus gold
– Gold silver ratio to fall back below 30
Silver looks set to outperform gold again in the coming months due to falling mine supply and continuing robust global demand.
 Source: Bloomberg
Silver at just $17.50 per ounce remains about 1/ 70th of the price of gold at $1,230/oz today. This gold silver ratio of 70.3 continues to drive silver ‘stackers,’ value investors and those seeking a better return than gold to accumulate silver at what are seen at these still relatively cheap levels.
This is seen in continuing robust demand for the very popular silver bullion coin this week. The U.S. Mint sold 715,000 of Silver Eagles ( 1 oz) this week, to bring the year to date sales totals for 2017 to a robust – 7,557,500 Silver Eagle coins.
|
US Mint Bullion Coin Sales (Number of coins) |
|||||
|
Monday Sales |
Last Week |
Feb Sales |
Mar Sales |
2017 Sales |
|
| Silver Eagles (1 oz) |
715,000 |
220,000 |
1,215,000 |
1,215,000 |
7,557,500 |
| Gold Eagles (1 oz) |
4,000 |
2,500 |
21,000 |
10,000 |
117,500 |
| Gold Buffalos (1 oz) |
1,500 |
2,500 |
15,000 |
4,500 |
51,500 |
Source: GoldCore via Coin News
We have seen very robust demand for silver again this year, especially from clients in the UK and Ireland buying silver bullion coins (now VAT free) such as Silver Eagles. We are seeing even greater demand for Silver Maples and Silver Philharmonics.
The increasingly favorable supply and demand fundamentals of the silver market were reported on by Bloomberg in an article entitled ‘Silver Seen Climbing Faster Than Gold as Yellen Wakens Bulls’.
According to Bloomberg:
Investors may be better off with silver rather than gold. The Federal Reserve’s pledge to stick to its dovish outlook on U.S. monetary policy has fueled a rally in precious metals and silver usually beats its more valuable peer in a rising market.
After the Fed raised interest rates by a quarter percentage point Wednesday, Chair Janet Yellen said the central bank was willing to tolerate inflation temporarily overshooting its 2 percent goal and intended to keep its policy accommodative for “some time.” UBS Group AG said the gradual pace of tightening means negative rates will deepen, the dollar weaken and gold rise.
The gold-to-silver ratio rose to 71 on March 14, the most in two months, and above an average of 62 in the past decade and a low of 32 in 2011, showing there’s potential for silver to appreciate versus its peer. Spot silver added 0.9 percent to $17.4964 an ounce, extending a 2.7 percent gain a day earlier.
The metal, sometimes called “poor man’s gold,” has risen more than 9 percent this year, while gold’s up less than 7 percent. The unpredictability of President Donald Trump’s administration and risks surrounding the outcome of elections in France and Germany this year have driven haven demand.
Supply may drop following mine closures and prices need to rise to boost output, according to Suki Cooper, analyst with Standard Chartered Plc in New York.
On demand, industrial use is expected to be roughly flat this year, though still near a record, said Jeffrey Christian, managing director of CPM Group. “Use in solar panels, electronics, batteries, jewelry, chemical process catalysts, and other manufactured products will remain strong,” he said.

We see silver as undervalued vis-à-vis gold but more especially vis-à-vis stocks, bonds and many property markets. Rather than selling the financial insurance that is gold, we would advise reducing allocations to stocks, bonds and property and allocating to physical silver.
We expect the gold silver ratio to fall back below 30 in the coming months and years. Indeed, given the favorable supply demand dynamics in the silver market and the fact that a huge amount of silver, unlike gold, has been used in industrial applications in the last 150 years and this continues with new tech uses today, we expect the gold silver ratio to mean revert to the long term average of 15 to 1 (see chart above).
http://www.goldcore.com/us/gold-blog/silver-1-70th-price- gold-silver-eagles-sales-jump/
-END-
Although the West slowed their appetite for gold and silver, China and Russia did not. In Feb the withdrawals (equals demand) at the Shanghai Gold Exchange showed 179 tonnes. If we extrapolate that demand for the coming year we would obtain a demand equal to 2200 tonnes or greater. China is back in demand for gold in a big way:
(courtesy Steve St Angelo/SRSRocco report)
Trump Market Euphoria Impacts Precious Metals Demand: Plummets In West, Surges In East
BySRSROCCO on March 20, 2017
With the Trump euphoria pushing the broader markets to new all-time highs, it has impacted precious metals demand considerably… especially in February. Precious metals investors believing the White House “Grandiose plans”, of making American great again, have cut back seriously on their precious metals buying.
There seems to be a percentage of the alternative community that believe Trump will actually put the U.S. back to the way it was in the 1960’s. And that is, back to a manufacturing powerhouse with high-paying jobs. While this would be a wonderful thing to do, the disintegrating ENERGY situation in the future just won’t allow it to happen.
IT WAS A ONE-TIME DEAL, and that period has come and gone…. FOREVER
Regardless, Western demand for precious metals declined considerably in February versus the same month last year. I used to spend more time publishing articles on gold and silver demand, but have refocused my analysis on how energy will impact the precious metals, mining and the overall economy.
However, Louis at Smaulgld.com does an excellent job publishing articles on precious metals demand. So, I have used some of his data and one of his charts.
As I stated above, the Trump market euphoria has taken the wind out of precious metals buying recently. According to the data from Smaulgld.com and the U.S. Mint, sales of gold and silver have plummeted in the West (especially USA), but surged in the East:
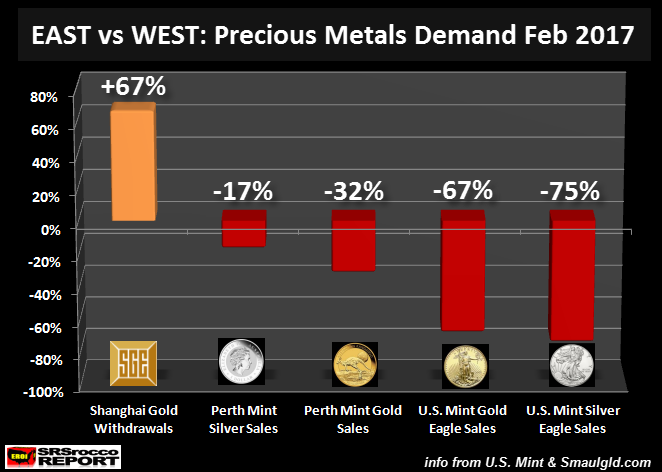
As we can see, Shanghai Gold Exchange withdrawals surged 67% in February versus the same month last year, while Perth Mint silver sales declined 17%, Perth Mint Gold sales dropped 32%, U.S. Gold Eagles fell 67% and Silver Eagle sales plummeted 75%.
According to Louis’s article, Shanghai Gold Exchange February Withdrawals Highest On Record, he published the following chart:
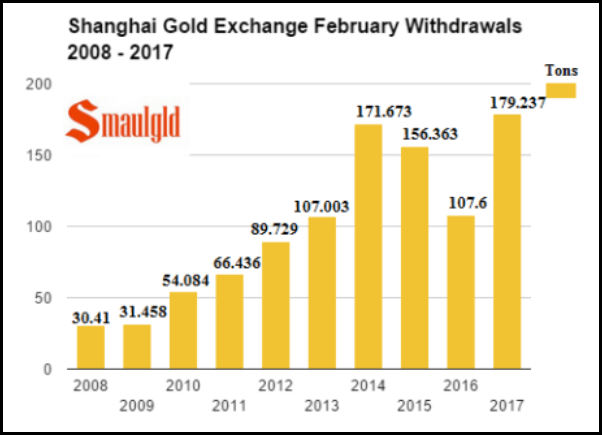
Chinese Shanghai Gold Exchange withdrawals were 179 metric tons (mt) in February compared 107 the same month last year. Gold withdrawals from the Shanghai Gold Exchange are a pretty good proxy for the physical metal demand taking place in China. We must remember, global monthly gold mine supply is approximately 265 mt. Which means, Shanghai Gold Exchange withdrawals of 179 mt accounted for two-thirds of global gold monthly mine supply. That’s a heck of a lot of demand… from just one country.
If we tally up the decline in U.S. Gold Eagle and Perth Mint gold coin sales in February versus last year, they equaled 67,806 oz. However, Shanghai Gold Exchange withdrawals increased 2,315,000 oz in February compared to the same month last year. So, we can clearly see that the increase in just Chinese demand, via the Shanghai Gold Exchange withdrawals, more than made up for the decline in Western retail official cold coin purchases.
Unfortunately, the Royal Canadian Mint does not publish their Gold or Silver Maple Leaf sales until the end of each quarter. That being said, Canadian Gold and Silver Maple Leaf sales parallels what is taking place in U.S. Eagle sales. Thus, Gold & Silver Maple Leaf sales are probably down considerably as well.
I would imagine most precious metals investors came across this article published on Zerohedge a few days ago, Demand For Physical Gold Is Collapsing. It seems as if the intent of this article was to generate a lot of READS. Because, if we look at what is taking place in China, there is no collapse in physical gold buying. Matter-a-fact, there was a record amount of gold withdrawn off the Shanghai Gold Exchange last month.
The author of that article, needed to include a footnote stating the following:
Western physical precious metal demand (especially in the USA) decreased significantly due to the Trump Market Euphoria, while Shanghai Gold Exchange withdrawals hit a new record in February as the Chinese realize the U.S. economy and Dollar is still toast.
I am completely dumbfounded by recent decline in precious metals demand and sentiment in the West. While I can understand the reason precious metals investors believe Trump will make America great again, the future ENERGY DYNAMICS will not allow us to return to the good ‘ole days of a manufacturing super-power. Rather, the upcoming collapse will change our lives forever.
When the Dow Jones Index and broader markets finally crack, there won’t be too many SAFE HAVENS to invest in. Along with a collapse of the Dow Jones Index, Real Estate prices in all sectors will head down the toilet. Investors scrambling for something to protect wealth will move into precious metals. Unfortunately, there won’t be much available supply… only at MUCH HIGHER PRICES.
So, this current downturn in Western physical gold and silver purchases do not phase me one bit. It only indicates that most Americans are completely insane when it comes to sound fundamental investing.
IMPORTANT NOTE: I will be publishing an article on the continued disintegration of the Global Oil Industry. I provide data showing how Mexico’s national oil company, PEMEX, is literally BANKRUPT. By looking at the data, logic suggests that the global oil industry is in serious trouble.
Lastly, the data for the Perth Mint sales came from two articles at Smaulgld.com, Perth Mine Silver Sales Slump In February and Perth Mint Gold Sales February Drop 32%. Sales of Gold & Silver Eagles were found on the U.S. Mint website.
END
Russia adds another 9.33 tonnes to official reserves”‘
(courtesy Lawrie Williams/Sharp Pixley)
LAWRIE WILLIAMS: Russia adds another 9.33 tonnes to its gold reserves in February
The Russian central bank continued to add to its gold reserves in February, but at a slower rate than in January or in November last year, it is too early to say whether the fall in the reported increase is significant given that the amount taken in is still greater than in three individual months last year. In the event, the Russian central bank reported that it had added 300,000 ounces of gold during February, bringing its total holding to around 1,654 tonnes – still keeping it in sixth place among national gold holders, behind China, which has reported gold reserves of 1,842.6 tonnes, but is still closing the gap on its neighbour. We speculated earlier this month that Russian gold reserves could even rise to match, or exceed, China’s officially reported gold reserve figure this year, although that was based on a continuation on a monthly basis of Russian reserve increases of 31.1 tonnes, as recorded in January – see: Russia’s gold reserves could overtake China’s this year. Given that China currently does not appear to be adding to its gold reserves – at least according to its official announcements – Russian reserves are still on the way to exceeding those of China assuming the latter’s buying hiatus continues. (It has added no gold to its reported reserves since October last year)
See below the world’s biggest gold holding nations as reported to the IMF. *Note Russia’s figure updated to take account of the latest central bank announcement of yesterday.
Table: World’s Top 10 National gold holders
| Tonnes | % of reserves | ||
| 1 | United States | 8,133.5 | 74.6% |
| 2 | Germany | 3,377.9 | 68.8% |
| 3 | Italy | 2,451.8 | 67.8% |
| 4 | France | 2,435.8 | 63.8% |
| 5 | China | 1,842.6 | 2.3% |
| 6 | Russia* | 1,654.4 | 16.4% |
| 7 | Switzerland | 1,040.0 | 6.0% |
| 8 | Japan | 765.2 | 2.4% |
| 9 | Netherlands | 612.5 | 63.9% |
| 10 | India | 557.8 | 6.0% |
As can be seen from the above table, Russia now only lags China by some 188 tonnes in terms of its gold reserves. Last year Russia added just over 200 tonnes to its reserves and a continuation at this kind of rate – if China continues its halt of official gold buying – would mean Russia’s reported reserves would be pretty much on a par with those of China by the year end.
Even so adding Russian and Chinese reported reserves together would only come to 3,497 tonnes – a little more than those of Germany in second place and still hugely behind the reported US holding which has, officially, remained unchanged since 2006 when it reported a reduction of 1.6 tonnes. All the IMF reported reserve figures are somewhat open to question as leased gold – and a number of nations have reported gold leasing activities – remains in reserve figures although it may not actually be available.
China has also been seen to add gold into its reserves surreptitiously by holding it in non-reported accounts and then updating its total figures at five or six year intervals, although it has been officially been reporting monthly changes in its holdings since July 2015 – but who knows? Other countries could also be non-reporters of changes in their gold reserves to the IMF for various reasons, so we can only really take the IMF figures as being the best guide available. We can’t vouch for their overall accuracy!
end
As many of you know, I am not a fan of technical analysis especially with manipulation occurring continually on the paper gold and silver markets. However very long term charts are quite intriguing as it is does give meaningful direction for these markets;
(courtesy Kingworldnews/James Turk)
Last week’s pops in gold and silver herald trend change, Turk tells KWN
Submitted by cpowell on Tue, 2017-03-21 00:47. Section: Daily Dispatches
7:47a ICT Tuesday, March 21, 2017
Dear Friend of GATA and Gold:
GoldMoney founder and GATA consultant James Turk tells King World News today why he thinks last week’s sharp increases in gold and silver herald a trend change for the monetary metals. Turk’s comments are posted at KWN here:
http://kingworldnews.com/james-turk-mega-cup-and-handle-formation-has-si…
CHRIS POWELL, Secretary/Treasurer
Gold Anti-Trust Action Committee Inc.
CPowell@GATA.org
end
Bill Holter interviewed by X22 spotlight
(courtesy Bill Holter)
|
Your early TUESDAY morning currency, Asian stock market results, important USA/Asian currency crosses, gold/silver pricing overnight along with the price of oil Major stories overnight
1 Chinese yuan vs USA dollar/yuan STRONGER AT 6.8890( HUGE REVALUATION NORTHBOUND /OFFSHORE YUAN MOVES STRONGER TO ONSHORE AT 6.8743/ Shanghai bourse UP 10.80 POINTS OR .33% / HANG SANG CLOSED UP 91.13 POINTS OR 0.37%
2. Nikkei closed DOWN 65.71 POINTS OR .34% /USA: YEN FALLS TO 112.53
3. Europe stocks opened ALL IN THE GREEN EXCEPT LONDON ( /USA dollar index FALLS TO 99.83/Euro UP to 1.0809
3b Japan 10 year bond yield: FALLS TO +.066%/ !!!!(Japan buying 100% of bond issuance)/Japanese yen vs usa cross now at 112.53/ THIS IS TROUBLESOME AS BANK OF JAPAN IS RUNNING OUT OF BONDS TO BUY./JAPAN 10 YR YIELD FINALLY IN THE POSITIVE/BANK OF JAPAN LOSING CONTROL OF THEIR YIELD CURVE AS THEY PURCHASE ALL BONDS TO GET TO ZERO RATE!!
3c Nikkei now JUST BELOW 17,000
3d USA/Yen rate now well below the important 120 barrier this morning
3e WTI:: 49.32 and Brent: 51.99
3f Gold DOWN/Yen UP
3g Japan is to buy the equivalent of 108 billion uSA dollars worth of bond per month or $1.3 trillion. Japan’s GDP equals 5 trillion usa./“HELICOPTER MONEY” OFF THE TABLE FOR NOW /REVERSE OPERATION TWIST ON THE BONDS: PURCHASE OF LONG BONDS AND SELLING THE SHORT END
Japan to buy 100% of all new Japanese debt and by 2018 they will have 25% of all Japanese debt. Fifty percent of Japanese budget financed with debt.
3h Oil UP for WTI and UP for Brent this morning
3i European bond buying continues to push yields lower on all fronts in the EMU. German 10yr bund RISES TO +.480%/Italian 10 yr bond yield DOWN to 2.325%
3j Greek 10 year bond yield RISES to : 7.441%
3k Gold at $1232.85/silver $17.41(8:15 am est) SILVER RESISTANCE AT $18.50
3l USA vs Russian rouble; (Russian rouble UP 24/100 in roubles/dollar) 57.09-
3m oil into the 49 dollar handle for WTI and 51 handle for Brent/
3n Higher foreign deposits out of China sees huge risk of outflows and a currency depreciation (already upon us). This can spell financial disaster for the rest of the world/China forced to do QE!! as it lowers its yuan value to the dollar/GOT REVALUATION NORTHBOUND from POBC.
JAPAN ON JAN 29.2016 INITIATES NIRP. THIS MORNING THEY SIGNAL THEY MAY END NIRP. TODAY THE USA/YEN TRADES TO 112.53 DESTROYING JAPANESE CITIZENS WITH HIGHER FOOD INFLATION
30 SNB (Swiss National Bank) still intervening again in the markets driving down the SF. It is not working: USA/SF this morning 0.9954 as the Swiss Franc is still rising against most currencies. Euro vs SF is 1.0761 well above the floor set by the Swiss Finance Minister. Thomas Jordan, chief of the Swiss National Bank continues to purchase euros trying to lower value of the Swiss Franc.
3p BRITAIN VOTES AFFIRMATIVE BREXIT/LOWER PARLIAMENT APPROVES BREXIT COMMENCEMENT
3r the 10 Year German bund now POSITIVE territory with the 10 year RISES to +.480%
The bank withdrawals were causing massive hardship to the Greek bank. the Greek referendum voted overwhelming “NO”. Next step for Greece will be the recapitalization of the banks and that will be difficult.
4. USA 10 year treasury bond at 2.493% early this morning. Thirty year rate at 3.105% /POLICY ERROR)GETTING DANGEROUSLY HIGH
5. Details Ransquawk, Bloomberg, Deutsche bank/Jim Reid.
(courtesy Jim Reid/Bloomberg/Deutsche bank/zero hedge)
Global Stocks Rise; Euro Surges To 6 Week High After French Presidential Debate
European stocks are modestly in the green as gains in banks and oil companies offset declines in miners. Asian stocks and S&P futures rise with Emerging-market stocks extending their longest winning streak since August on the back of the 5th consecutive daily drop in the USD.
The euro rose to the strongest in six weeks after a French presidential debate eased market concerns about a possible Le Pen win: the first French debate was reportedly won by centrist Emmanuel Macron. For those who missed it, last night saw the first televised debate between the candidates. Those who tuned in may be feeling a little jaded as the debate ended up lasting a whopping three and a half hours. There were plenty of head to head moments between Macron and Le Pen in particular which included much finger pointing and also amusing bouts of sarcasm. Immigration was unsurprisingly a hot topic while the exchanges also moved over to the economy and various policy measures. The general feeling was certainly one of it being lively however. Markets were largely waiting for some sort of conclusion about who came out on top though and following the debate an Elabe poll (covering 1157 respondents) found that Macron was seen as the winner of the debate at 29% with Melenchon second with 20%. Fillon and Le Pen came in joint third at 19% and Hamon came in fifth at 11%. An Opinionway poll showed 25% for Macron; in both polls Fillon and Le Pen were tied at 19%.
“From the point of view of international investors, this is a positive as it keeps France’s position in the euro zone secure, or at least not weaker,” said DZ Bank analyst Rene Albrecht.
As a result, the average probability of Macron win implied from betting odds climbed 2ppts to over 63%…

… boosting the Euro and peripheral bonds while pressuing Bunds. It’s worth noting that there are another two debates to come prior to the first round election on April 23rd. It’s also worth noting that Hillary Clinton was seen as the comfortable winner in all the US Presidential debates.
Taking a cue from the debate polling which showed Macron as the most convincing, German bonds slid from the open, with French election risks seen waning. Losses extended in bunds after stronger-than-expected U.K. inflation data pressured gilts lower, with 10y U.K. yields climbing by around 6bps. MPC-dated SONIA rate jumps to price in almost one full hike by August 2018. The easing of French election risk has firmed rate-hike expectations for the ECB. Euribor strip has bear steepened from the open, with market pricing now showing over 20bps of rate increases priced by Sept. 2018. ECB rate expectations have seen the 5y sector on the German curve underperform, now cheaper by around 2bps on the 2s5s10s fly. French bonds meanwhile opened higher after the debate, with 10y yields dropping as much as 4bps. The move was quickly faded, as has been repeatedly observed in similar bouts of optimism around the French election. OATs now little changed.
The biggest winner, however, was the Euro, which rose to just shy of 1.08, the strongest in more than a month.

“When you consider how many people have been worried about this election and how cheap the euro is, if that risk were to go away then there’s the potential for money to flow into Europe,” said Andrew Sheets, chief cross-asset strategist at Morgan Stanley in London. “That would be another form of volatility. There’s always a risk of large moves when valuations are extreme — and the euro is quite cheap.”
The dollar index fell below 100 for the first time since early February and was down almost half a percent on the day. The currency was on the defensive after Chicago Federal Reserve President Charles Evans reinforced the perception that the U.S. central bank will not accelerate the pace of its interest rate hikes. He said on Monday that two more interest rate hikes this year were likely, disappointing investors who had anticipated rates would be increased more quickly. The greenback is on its longest losing streak since November after the Federal Reserve’s dovish message on the speed of monetary tightening last week.
European stock markets opened higher after a rally in Asia, where MSCI’s broadest index of Asia-Pacific shares outside Japan hit 21-month highs. U.S. stock futures pointed to a positive start for Wall Street, which had suffered on Monday as investors worried that President Donald Trump’s plan to cut taxes and boost the economy would take longer than expected to realize. South Korea led gains among Asian emerging markets, with the Kospi jumping 1 percent to the highest since July 2011. Hyundai Motor Co. climbed 8.6 percent amid market speculation over a possible stake purchase by Elliott Management. The Stoxx Europe 600 Index added less than 0.1 percent at 9:48 a.m. in London. Banking stocks outperformed, led by Italian and French lenders, as worries over the French presidential election further abated. Mining stocks lost ground, trimming recent sharp gains. Futures on the S&P 500 rose 0.1 percent. The benchmark gauge fell 0.2 percent on Monday.
The 10-year U.S. Treasury yield briefly fell to two-week lows following the comments to 2.461 percent. It last stood at 2.48%. Oil prices rallied on expectations that an OPEC-led production cut to prop up the market could be extended. Prices for front-month Brent crude futures LCOc1, the international benchmark for oil, gained 1 percent to $52.13 per barrel. OPEC members increasingly favor extending the output curb beyond June to balance the market, sources within the group said, although they added this would require non-OPEC members such as Russia to also step up their efforts.
Elsewhere, Deutsche Bank was in focus as the subscription period for a capital raising began on Tuesday. Also today, Nike, FedEx, and General Mills are among companies scheduled to publish results
* * *
Bulletin Headline Summary from RanSquawk
- Sentiment in Europe received a lift from the open as participants reacted to a perceived strong performance from Macron in last night’s French presidential debate.
- GBP ramps higher after inflation rises to the highest level since Sep’13
- Looking ahead, focus will Canadian retail sales, API crude report as well as comments from Fed’s George and Mester.
Market Snapshot
- S&P 500 futures up 0.2% to 2373.5
- STOXX Europe 600 up less than 0.1% to 378
- MXAP up 0.1% to 149
- MXAPJ up 0.3% to 483.23
- Nikkei down 0.3% to 19,455.88
- Topix down 0.2% to 1,563.42
- Hang Seng Index up 0.4% to 24,593.12
- Shanghai Composite up 0.3% to 3,261.61
- Sensex down 0.3% to 29,432.19
- Australia S&P/ASX 200 down 0.07% to 5,774.62
- Kospi up 1% to 2,178.38
- German 10Y yield rose 2.8 bps to 0.468%
- Euro up 0.5% to 1.0795 per US$
- Brent Futures up 0.9% to $52.06/bbl
- Italian 10Y yield rose 0.7 bps to 2.364%
- Spanish 10Y yield fell 0.4 bps to 1.843%
- Gold spot down 0.4% to $1,229.24
- U.S. Dollar Index down 0.4% to 100.01
Top Overnight News from BBG
- PPG Said to Ready New Akzo Offer After Failed $22.4 Billion Bid
- Fed’s Dudley Says Wells Fargo Shows Bank Culture Needs Improving
- Google Overhauls Policies After Uproar Over YouTube Videos
- Deutsche Bank Said to Face Regulatory Fines Over Currency Trades
- Mideast Airlines Say New U.S. Restrictions Will Force Changes
- BlackRock Likes Property Even After Yellen Calls Prices ‘High’
- BMW Sees 2017 Profit Rising Slightly as Spending Exceeds Target
- Banking Panel Senators Make Bipartisan Call for Growth Proposals
- Baidu’s iQiyi Signs Pact With Warner Bros. on Movie Rights
- Chevron Says New LNG Projects Unlikely in West Australia
- NYSE Says It Has Identified, Fixed Cause of Arca Disruption
In Asian Markets, the major equity indices traded somewhat mixed following a similar lead from Wall St., where financials underperformed and participants were indecisive amid a lack of tier-1 data releases. ASX 200 (-0.1%) was dampened by weakness in telecoms and underperformance in the financial sector, while Nikkei 225 (-0.4%) lagged on return from an extended weekend, although downside was stemmed as USD/JPY nursed losses. Elsewhere, Hang Seng (+0.3%) and Shanghai Comp. (+0.3%) were kept afloat following the continued liquidity operations by the PBoC which resulted in a 2nd day of net injections. Finally, 10 year JGBs traded higher amid a dampened risk tone in Japan and with the BoJ present in the market for a total JPY 1.15tIn of JGBs ranging from 1-10yr maturities. PBoC injected CNY 50bIn 7-day reverse repos, CNY 20bIn in 14-day reverse repos and CNY 10bIn in 28-day reverse repos
Top Asian News
- SoftBank Is Said to Invest in WeWork at $17 Billion Valuation
- Downer Makes A$1.26 Billion Takeover Offer for Spotless
- McDonald’s China Says It’s Not Affected by Ban on Brazil Meat
- Billionaire Damani’s Avenue Supermarts Shares Double on Debut
- Modi-Backed ETF May Fuel India Sales After $1.4 Billion Haul
- China H Shares Rise to Highest Since 2015; Power Producers Gain
- M1 Bids May Not Come Above S$2.20/Share, Religare’s Jin Says
- India’s HPCL to Use Honeywell Clean-Fuel Technology
- Freeport Indonesia Restarts Copper Concentrate Mill: Spokesman
European risk sentiment received a lift from the open as participants reacted to a perceived strong performance from Macron in last night’s French presidential debate. As such European equities opened higher, with Euro Stoxx 50 spending much of the session higher by around 0.5%. On a sector breakdown, financials are among the best performers as Deutsche Bank trades higher on the session after going ex-subscription to their capital raising plans. Elsewhere Akzo Nobel are among the best performers on a stock specific basis as M&A news continues to circulate, with pre-market reports today suggesting PPG is preparing a renewed takeover offer for the Co. The notable data of the session, came in the form of UK CPI, with the higher than exp. reading (Y/Y 2.3% vs. Exp. 2.1%) seeing gilts underperform and sending GBP/USD towards 1.2450. The GBP strength has further exacerbated pressure on the USD, with the USD-index slipping below 100, while the French presidential election saw EUR/USD touch 1.0800. Fixed income markets have been pressured by the aforementioned risk on sentiment, with Bunds down 35 ticks on the session, while OATs saw a paring of some of their initial losses in the wake of reports that PM Cazeneuve asked govt. members not to back Macron.
Top European News
- EU Makes U.K. Wait to Start Brexit Talks as Trigger Date Set
- Macron on Top After First Debate of French Presidential Election
- Porsche SE Posts Profit as Owner Clan Plans to Buy Out Piech
- Swiss Watch Slump Extends Record Decline as U.S. Exports Slide
- Fingerprint Cards Withdraws Dividend Plan as Revenue Plummets
- Abertis Gives Information on Ruling on AP-7 Accounting Treatment
- Swedish Casino Company Takes Breather From Deals to Drive Growth
- Poland Needs Innovation to Catch Up With West, World Bank Says
In currencies, the Bloomberg Dollar Spot Index slipped by 0.2 percent, following a 0.1 percent drop Tuesday. The euro was up by 0.5 percent at $1.0796, while it rose versus all of its G-10 peers. The British pound traded 0.7 percent higher after data showed U.K. inflation rose faster than expected. The main mover of the morning has been GBP, which had been trending higher ahead of the inflation report to trip above 1.2400. In the wake of the release, GBP continued its ascension after CPI beat expectations, subsequently stoking expectations that the overshoot will force the Bank of England to act through potentially hiking rates, as such, a 25bps hike is now fully priced in by Aug’18. Elsewhere, a reassuring performance from Macron in the first presidential TV debate has buoyed EUR, with the currency touching 1.08 against the greenback. RBA minutes from Mar 7th meeting stated that it judged steady policy was consistent with growth and inflation targets and that rising AUD/USD would complicate economic transition. RBA also stated that economic growth is to accelerate gradually to above potential over the next 2 years and higher commodity prices could last longer than first thought given the stronger global demand.
In commodities, West Texas Intermediate oil climbed 0.8 percent to $48.60 before U.S. inventory data on Wednesday and as Libya prepared to restart crude shipments from major ports. Copper slumped 0.7 percent amid signs supplies are returning; disruptions caused the metal to surge last month to the highest level since 2015; prices slipped after reports that the union for workers on strike at the BHP Billiton Escondida copper mine held talks with the company and also coincided with a 4% drop in Dalian iron ore futures during Asian trade. Gold (-0.4%) prices pulled back from 2 week highs after four days of gains, while the softness in the USD index has supported oil prices with Brent futures above USD 52/bbl and WTI above USD 49/bbl ahead of the API inventories after market.
Looking at the day ahead, in the US the diary remains sparse with just the Q4 current account balance reading expected. Away from the data this morning we are expected to hear from the Fed’s Dudley and BoE’s Carney at a bank ethics event in London, while this afternoon we are due to hear from the Fed’s George and then this evening the Fed’s Mester is due to speak. The EU finance ministers meeting will also continue in Brussels this morning.
US Event Calendar
- 8:30am: Current Account Balance, est. $129.0b deficit, prior $113.0b deficit
Central Banks
- 6:35am: Fed’s Dudley, BOE’s Carney Speak at Bank Ethics London Event
- 12pm: Fed’s George Speaks in Washington on U.S. Economy and the Fed
- 6pm: Fed’s Mester Speaks at University of Richmond
- 9:45pm: Boston Fed Rosengren Speaks in Bali at Asia-Pacific Meeting
DB’s Jim Reid concludes the overnight wrap
Will France wake up this morning feeling more confident about the upcoming Presidential race? Well last night saw the first televised debate between the candidates. Those who tuned in may be feeling a little jaded as the debate ended up lasting a whopping three and a half hours. There were plenty of head to head moments between Macron and Le Pen in particular which included much finger pointing and also amusing bouts of sarcasm. Immigration was unsurprisingly a hot topic while the exchanges also moved over to the economy and various policy measures. The general feeling was certainly one of it being lively however. Markets were largely waiting for some sort of conclusion about who came out on top though and following the debate an Elabe poll (covering 1157 respondents) found that Macron was seen as the winner of the debate at 29% with Melenchon second with 20%. Fillon and Le Pen came in joint third at 19% and Hamon came in fifth at 11%. It’s worth noting that there are another two debates to come prior to the first round election on April 23rd. It’s also worth noting that Hillary Clinton was seen as the comfortable winner in all the US Presidential debates.
Prior to the outcome from that poll the Euro did touch as low as 1.072 overnight versus the US Dollar but bounced post the news and hit a high of 1.078, or up just under half a percent with the market seemingly comforted that the debate failed to yield any further support to Le Pen’s chances. The Euro is now sitting at 1.076 as we go to print. Meanwhile equity markets are once again a bit mixed. Having been closed on Monday bourses in Japan are open again with the Nikkei currently -0.27%. The ASX (-0.16%) is also down however there are small gains for the Hang Seng (+0.31%), Shanghai Comp (+0.19%) and more notably the Kospi (+1.02%). US equity index futures are also up about +0.20% while Gold is -0.57% so suggesting a slightly more positive environment for risk at the margin this morning.
While we’re on France, we thought it would be worth highlighting a report published by our colleagues yesterday in Europe summarising the results of their recently conducted global cross asset survey about investors’ views of asset returns one week after the French presidential election. They summarise that a Le Pen or a Left win is, perhaps unsurprisingly, strongly associated with Negative or Very Negative risk asset outcomes. A Centre win is mainly associated with Positive (but not Very Positive) outcomes, suggesting investors remain cautious about the economic environment, regardless of outcome. Many investors are neutrally positioned, but of non-neutral investors there is a distinct tilt towards long volatility and long hedges. A negative outcome is largely associated with high equity vol and sharp equity falls. In a positive outcome, the majority expectation is for limited equity upside only; however, we highlight a notable tail of expectations in the highly positive scenario, i.e. for very low vol and large equity upside. In rates the dominant expectation is for stable / higher yields regardless of election outcome. FX markets show a more bearish tilt, with EURUSD below parity in a negative outcome. In addition, upside is more limited – only 26% of respondents see EUR/USD above 1.10 in a positive outcome.
Moving on. In what was an otherwise very quiet day for the most part yesterday, it was the chorus of Fedspeak which markets were most concentrated on. Of particular focus was the Chicago Fed’s Evans who made the case for the Fed hiking 2 or 3 more times this year. Evans also said that he expects inflation to hit 2% in 2018 and that things are “much more balanced around the outlook” than they were two years ago. The Philadelphia Fed President Harker also spoke and said that he expects the Fed to overshoot the 2% inflation target “a little bit” and that he would not rule out a faster or slower pace of hikes in 2017 than the three he has projected so far. Finally there was a much more dovish angle to the Fedspeak yesterday too with Minneapolis Fed President Kashkari also speaking. He said that “we do not have a high inflation threat right around the corner” and that ‘I’d be very surprised if core inflation reaches 2% this year”. He also said that “the data are basically moving sideways, so I’m asking, what’s the rush to raise rates”.
Aside from the Fedspeak, there wasn’t a huge amount more for markets to feed off aside from some political related stories. The G-20 news from the weekend came and went however a lot of the focus was on the news that the FBI has confirmed that it is conducting a broad inquiry into a possible link between President Trump’s presidential campaign in 2016 and Russia. Meanwhile here in the UK we got the confirmation that PM Theresa May will trigger Article 50 on March 29th and so officially starting the clock on negotiations. The European Council President Donald Tusk confirmed that he will present the draft Brexit guidelines to the EU27 members states within 48 hours. It’s worth noting also that a provisional plan for the EU to hold a summit on April 6th to discuss early negotiation plans has been pushed back to late April/early May, all of which obviously eats into PM May’s negotiating time frame.
Over in markets the end result of all the Fedspeak and various political related headlines was a very modest risk off start to the week. The S&P 500 ended -0.20% by the closing bell and so confirming a third consecutive daily decline following last Wednesday’s big post-FOMC rally. The Stoxx 600 (-0.17%) was down a similar amount and fell for the first time since last Tuesday. The exception was once again in EM however where the MSCI EM index (+0.70%) rose for the seventh consecutive session. In government bonds 10y Treasury yields dipped 4bps to 2.462% and are now down to the lowest yield since March 6th having touched an intraday high of 2.628% a week ago. In Europe bond markets didn’t really do much although Greek bonds were a bit weaker after Eurogroup head Jeroen Dijsselbloem said at a finance minister’s meeting that “some key issues” still remain to be sorted out between Greece and its creditors and that talks will continue and intensify in coming days.
Moving on. Yesterday’s data was fairly thin on the ground. In the US the sole release was the Chicago Fed national activity index which came in at a better than expected 0.34 in February (vs. 0.03 expected) and in doing so has pushed the three-month average up to 0.24 which is the highest since December 2014. In Germany PPI was reported as rising +0.2% mom in February which was a little less than expected. Meanwhile in the UK the Rightmove index of house prices showed prices as stable at +2.3% yoy in March. The other data concerned the latest weekly ECB CSPP holdings where the average daily run rate last week of €363m more or less matched the average €367m since the program started.
Looking at the day ahead, this morning in Europe the focus will be on the UK where we will get the February CPI/RPI/PPI data (with headline CPI expected come in at +0.5% mom and headline RPI at +0.8% mom). We will also get the February public sector net borrowing data in the UK and then the March CBI industrial trends survey. This afternoon in the US the diary remains sparse with just the Q4 current account balance reading expected. Away from the data this morning we are expected to hear from the Fed’s Dudley and BoE’s Carney at a bank ethics event in London, while this afternoon we are due to hear from the Fed’s George and then this evening the Fed’s Mester is due to speak. The EU finance ministers meeting will also continue in Brussels this morning.
3. ASIAN AFFAIRS
i)Late MONDAY night/TUESDAY morning: Shanghai closed UP 10.80 POINTS OR .33%/ /Hang Sang CLOSED UP 91.13 POINTS OR 0.37% . The Nikkei closed down 65.71 .34% /Australia’s all ordinaires CLOSED DOWN 0.03%/Chinese yuan (ONSHORE) closed DOWN at 6.8890/Oil rose to 49.32 dollars per barrel for WTI and 51.99 for Brent. Stocks in Europe ALL IN THE GREEN EXCEPT LONDON ..Offshore yuan trades 6.87743 yuan to the dollar vs 6.8890 for onshore yuan.THE SPREAD BETWEEN ONSHORE AND OFFSHORE NARROWS CONSIDERABLY AGAIN/ ONSHORE YUAN STRONGER AS IS THE OFFSHORE YUAN AND THIS IS COUPLED WITH THE HUGELY WEAKER DOLLAR. CHINA SENDS HER DISPLEASURE SIGNAL TO WASHINGTON
3a)THAILAND/SOUTH KOREA/NORTH KOREA
NORTH KOREA
This must give you a very warm and fuzzy feeling: North Korea reveals a propaganda video of them blowing up a USA aircraft
(courtesy zerohedge)
North Korea Blows Up US Aircraft Carrier, Bomber In New Propaganda Video
North Korea’s disgruntled dictator – whose fate is looking more precarious by the day – Kim Jong-un has released a propaganda video in which a US aircraft carrier is blown up while a US strategic bomber shot down in flames. The clip also includes footage from the communist state’s recent ballistic missile launches are shown alongside a simple message: “a knife will be stabbed into the throat of the carrier.” The video declares: “The bomber will fall from the sky after getting hit by a hail of fire.” Footage also shows the USS Carl Vinson nuclear-powered aircraft carrier up in flames.

The 2 minute clip has emerged just days after Kim threatened to reduce the US “to ashes” as tensions with North Korea continue to increase, which in turn followed a warning by Tillerson that the US is preparing for a “first strike” against the irrational dictator, while US special forces conduct drills in South Korea to “eliminate” the country’s ruler.
It comes after a statement earlier this month warned Donald Trump of nuclear destruction if America fires “even a single bullet” towards Pyongyang. In it the country warned that “the Korean People’s Army will reduce the bases of aggression and provocation to ashes with its invincible Hwasong rockets tipped with nuclear warheads and reliably defend the security of the country and its people’s happiness in case the US and the South Korean puppet forces fire even a single bullet at the territory of the DPRK.”

The menacing talk came as South Korea warned over the weekend that its northern neighbor’s latest rocket-engine test showed “meaningful” progress. As reported on Sunday, the KCNA news agency said the engine would help the country achieve world-class satellite-launch capability – indicating a new type of rocket engine for an intercontinental ballistic missile.
In further acts of defiance, North Korea has declared it is not scared of recent US threats of possible pre-emptive military action to stop its nuclear build-up.
US President Donald Trump told reporters he held meetings on North Korea during the weekend at his Florida resort. While he did not refer specifically to the rocket-engine test, he said Kim Jong-un was “acting very, very badly.” Trump and members of his administration have been talking tough on North Korea since the Republican took office back in January.

As a reminder, last Friday Secretary of State Rex Tillerson announced the “policy of strategic patience” was over and refused to rule out military action. He said: “The diplomatic and other efforts of the past 20 years to bring North Korea to a point of de-nuclearisation have failed. So we have 20 years of a failed approach.
“And that includes a period in which the US provided $1.35billion (£1.08billion) in assistance to North Korea as an encouragement to take a different pathway.” He added: “If they elevate the threat of their weapons program to a level we believe requires action that option is on the table.”
Meanwhile, as Reuters reported, fearing a possible attack, Japan started staging mass evacuation drills. In the first exercise of its kind saw civilians young and old scrambling for cover as air-raid sirens wailed.
The video is below:
end
Ladies and gentlemen: Kim is a madman and must be taken out:
he threatens the USA with a “first strike” nuclear iCBM
(courtesy zero hedge)
North Korea Threatens US With “First-Strike” Nuclear ICBM
In the latest troubling development to come out of North Korea’s increasingly irrational leadership, Reuters reports that the communist country has nothing to fear from any U.S. move to broaden sanctions aimed at cutting it off from the global financial system and will pursue “acceleration” of its nuclear and missile programs, according to a Pyongyang envoy. This includes developing a “pre-emptive first strike capability” and an inter-continental ballistic missile, according to Choe Myong Nam, deputy ambassador at the DPRK (North Korean) mission to the United Nations in Geneva.
The latest development follows a previous report also from Reuters, in which it said the Trump administration is considering sweeping sanctions as part of a broad review of measures to counter North Korea’s nuclear and missile threat. “I think this is stemming from the visit by the Secretary of State (Rex Tillerson) to Japan, South Korea and China…We of course are not afraid of any act like that,” Choe told Reuters.
“Even prohibition of the international transactions system, the global financial system, this kind of thing is part of their system that will not frighten us or make any difference.” He called existing sanctions “heinous and inhumane”.

Choe said his country wants a forum set up to examine the “legality and legitimacy of the sanctions regime” and denounced joint annual military exercises currently being carried out by the United States and South Korea on the divided peninsula and criticized remarks by Tillerson during his talks with regional allies last week.
“All he was talking about is for the United States to take military actions on DPRK (the Democratic People’s Republic of Korea,” Choe said.
Additionally, North Korea rejects claims by Washington and Seoul that the military drills taking place at this moment are defensive. They involve strategic nuclear bombers and a nuclear submarine Columbus that recently entered South Korean ports, he said.
“In the light of such huge military forces involved in the joint military exercises, we have no other choice but to continue with our full acceleration of the nuclear programs and missile programs.”
“It is because of these hostile activities on the part of the United States and South Korea.” “We strengthen our national defense capability as well as pre-emptive strike capabilities with nuclear forces as a centerpiece,” Choe said.
He declined to give technical details of North Korea’s latest rocket engine test on Sunday – seen as a possible prelude to a partial ICBM flight – calling it a great historical event that would lead to “fruitful outcomes”.
“I can tell you for sure that the inter-continental ballistic rockets of the DPRK will be launched at any time and at any place as decided by our Supreme Leadership,” Choe said, recalling leader Kim Jong Un’s pledge in a New Year’s address.
Analysts say North Korea has likely mastered the technology to power the different stages of an ICBM and may show it off soon, but is likely still a long way from being able to hit the mainland United States. Of course, it woudl be preferrable not to confirm this in practice either way.

“The United States has been talking about launching pre-emptive strikes at North Korea,” Choe said. “And we have been prepared to deter, to counter-attack such attacks on the part of the United States. We would utilize every possible means in our hands and the inter-continental ballistic rocket is one of them.”
b) REPORT ON JAPAN
c) REPORT ON CHINA
4. EUROPEAN AFFAIRS
This is interesting: the German Federal Auditor group is calling for an audit of the ECB as they need more supervision
(courtesy zero hedge)
“Audit The ECB”? – German Officials Call For Greater Oversight Of Central Bank
With the omnipotence of the world’s central banks suddenly all too evidently exposed as nothing more than ‘Oz’-like smoke-and-mirrors, it is not just US politicians that are losing faith and calling for more oversight of the most-powerful unelected officials in the world. Handelsblatt reports today that Germany’s federal auditor says The ECB lacks accountability in banking sector oversight and government will work to close that oversight gap.
Handelsblatt reports, citing a parliamentary report it obtained, that the European Court of Auditors is unable to perform an “extensive review” of the bank supervisory functions at ECB. Furthermore, the German Federal Court of Auditors says in a report submitted to the German parliament’s budget committee
Germany should explore all options for closing the oversight gap.
In its report, the federal auditor says bank oversight is an important public function that does not fall under the rubric of central bank independence, noting that national banking regulators like Germany’s used to be fully audited before the ECB took over the responsibility in 2015.
“The federal government should explore all options for closing this oversight gap,” the report said.
The ECB has argued that the European Court of Auditors only has the authority to review the central bank’s efficiency in terms of personnel and budgeting, not its decisions as Europe’s top banking supervisor. The European Court of Auditors has complained in the past that the ECB has used this argument to justify its refusal to turn over some documents for review.
That, according to the German agency, has left a gap in oversight that didn’t exist before 2015, since national regulators in the euro zone tended to be separate from their country’s central banks.
In a statement, the ECB said that it works closely with the European Court of Auditors and has made “a considerable number of documents and explanations available.”
While we fully understand the concerns at the lack of transparency and oversight of Europe’s most powerful entity, it is comewhat ironic that it is the Germans complaining when they just used the “well, it’s not us messing with the currency, the ECB is independent” argument to eschew Trump’s currency war tweets.
We are sure Dragh is not too worried for now, but if this escalates, this is what we would expect him to look like…

end
5. RUSSIAN AND MIDDLE EASTERN AFFAIRS
6.GLOBAL ISSUES
7. OIL ISSUES
This is how OPEC lost the battle against the shale boys as our American friends learned how to lower their cost curve and break even points;
(courtesy zero hedge)
How OPEC Lost The War Against Shale, In One Chart
At the start of March we showed a fascinating chart from Rystad Energy, demonstrating how dramatic the impact of technological efficiency on collapsing US shale production costs has been: in just the past 3 years, the wellhead breakeven price for key shale plays has collapsed from an average of $80 to the mid-$30s…

… resulting in drastically lower all-in breakevens for most US shale regions.

Today, in a note released by Goldman titled “OPEC: To cut or not to cut, that is the question”, the firm presents a chart which shows just as graphically how exactly OPEC lost the war against US shale: in one word: the cost curve has massively flattened and extended as a result of “shale productivity” driving oil breakeven in the US from $80 to $50-$55, in the process sweeping Saudi Arabia away from the post of global oil price setter to merely inventory manager.

This is how Goldman explains it:
Shale’s short time to market and ongoing productivity improvements have provided an efficient answer to the industry’s decade-long search for incremental hydrocarbon resources in technically challenging, high cost areas and has kicked off a competition amongst oil producing countries to offer attractive enough contracts and tax terms to attract incremental capital. This is instigating a structural deflationary change in the oil cost curve, as shown in Exhibit 2. This shift has driven low cost OPEC producers to respond by focusing on market share, ramping up production where possible, using their own domestic resources or incentivizing higher activity from the international oil companies through more attractive contract structures and tax regimes. In the rest of the world, projects and countries have to compete for capital, trying to drive costs down to become competitive through deflation, FX and potentially lower tax rates.
The implications of this curve shift are major, all of which are very adverse to the Saudis, who have been relegated from the post of long-term price setter to inventory manager, and thus the loss of leverage. Here are some further thoughts from Goldman:
- OPEC role: from price setter to inventory manager In the New Oil Order, we believe OPEC’s role has structurally changed from long-term price setter to inventory manager. In the past, large-scale developments required seven years+ from FID to peak production, giving OPEC long-term control over oil prices. US shale oil currently offers large-scale development opportunities with 6-9 months to peak production. This short-cycle opportunity has structurally changed the cost dynamics, eliminating the need for high cost frontier developments and instigating a competition for capital amongst oil producing countries that is lowering and flattening the cost curve through improved contract terms and taxes.
- OPEC’s November decision had unintended consequences: OPEC’s decision to cut production was rational and fit into the inventory management role. Inventory builds led to an extreme contango in the Brent forward curve, with 2-year fwd Brent trading at a US$5.5/bl (11%) premium to spot. As OPEC countries sell spot, but US E&Ps sell 30%+ of their production forward, this was giving the E&Ps a competitive advantage. Within one month of the OPEC announcement, the contango declined to US$1.1/bl (2%), achieving the cartel’s purpose. However, the unintended consequence was to underwrite shale activity through the credit market.
- Stability and credit fuel overconfidence and strong activity: A period of stability (1% Brent Coefficient of Variation ytd vs. 6% 3-year average) has allowed E&Ps to hedge (35% of 2017 oil production vs. 21% in November) and access the credit market, with high yield reopen after a 10- month closure (largest issuance in 4Q16 since 3Q14). Successful cost repositioning and abundant funding are boosting a short-cycle revival, with c.85% of oil companies under our coverage increasing capex in 2017.
That said, the new equilibrium only works as long as credit is cheap and plentiful. If and when the Fed’s inevitable rate hikes tighten credit access for shale firms, prompting the need for higher margins and profits, the old status quo will revert. As a reminder, this is how over a year ago Citi explained the dynamic of cheap credit leading to deflation and lower prices:
Easy access to capital was the essential “fuel” of the shale revolution. But too much capital led to too much oil production, and prices crashed. The shale sector is now being financially stress-tested, exposing shale’s dirty secret: many shale producers depend on capital market injections to fund ongoing activity because they have thus far greatly outspent cash flow.
This is the key ingredient of what Goldman calls the shift to a new “structural deflationary change in the oil cost curve” as shown in chart above. As such, there is the danger that tighter conditions will finally remove the structural pressure for lower prices. However, judging by recent rhetoric by FOMC members, this is hardly an imminent issue, which means Saudi Arabia has only bad options: either cut production, prompting higher prices and even greater shale incursion and market share loss for the Kingdom, or restore the old status quo, sending prices far lower, and in the process collapsing Saudi government revenues potentially unleashing another budget crisis.
end
Russia mentions production cut ( of which it does not mean) and up goes oil and then it fails
(courtesy zerohedge)
Oil Pumps’n’Dumps After Russia Mentions Production Cut
It appears the weight of positioning is too much to maintain any OPEC/NOPEC jawboning. After yesterday’s failure by the Saudis, Russia’s comments that it “doesn’t rule out extending the oil pact with OPEC” prompted an immediate algo panic buy… but seconds later that was sold into as we suspect over-extended longs are now using rips to reduce risk.
#Fail

It appears $49 is the new jawbone line in the sand…

end
API reports bigger and expected crude and a much bigger buildup at Cushing. However gasoline did have a drawdown. Oil initially rose and then plummeted on the news:
(courtesy zero hedge)
WTI/RBOB Pump’n’Dump After Surprise Inventory Data
After last week’s surprise draw (but big build at Cushing), API reports a bigger than expected crude (and Cushing) build and bigger than expected draw in Gasoline inventories. For now, both WTI and RBOB kneejerked higher but WTI faded very rapidly.
API
- Crude +4.539mm (+3mm exp)
- Cushing +1.968mm
- Gasoline -4.934mm (-2.4mm exp)
- Distillates -883k
Another big Cushing build and another big gasoline draw…

And the immediate reaction in WTI and RBOB – after both sold off today despite Russian jawboning –

Bloomberg reports:
“The catalyst is concern over demand due to potential difficulties with President Trump getting his pro-growth agenda through,” Bart Melek, the head of global commodity strategy at TD Securities in Toronto, says by phone. “The crude market acted technically here.”
“We’re still pretty high when it comes to inventories and if they keep getting higher, it’s only going to put more pressure on the market,” Carl Larry, principal consultant for Oil Outlooks and Opinions in Houston, says by phone
8. EMERGING MARKETS
Venezuela stops publishing money supply data. Who would have thought that they could do such a horrible act?
(courtesy zero hedge)
Venezuela Stops Publishing Money Supply Data For Obvious Reasons
More than a year after hyperinflating banana republic Venezuela stopped reporting official inflation data, Venezuela has stopped publishing money supply data, depriving the general public of the last, and best, available tool to ascertain soaring inflation in what has become the world’s worst-performing economy. Then again, one hardly needs official data to confirm the blistering wave of hyperinflation sweeping through the nation which has seen the value of the bolivar disintegrate under the Maduro regime.
The money supply indicator suddenly stopped appearing on the central bank’s website on Feb. 24. The data in question, which will no longer be updated, looked as follows most recently.

Despite the halt of CPI data, consumer price rises are widely seen to be in triple digits, driven by an unraveling socialist system in which many people struggle to obtain meals and medicines. The M2 money supply was up by nearly 180% in mid-February from a year earlier, according to the central bank before it halted the release of the weekly data without explanation last month Reuters reports. In contrast, Reuters reports that neighboring Colombia’s M2 was up 7 percent in the same period and the United States’ was up 6 percent.
“If they are not publishing, you know it must be skyrocketing,” Aurelio Concheso, director of the Caracas-based business consultancy Aspen Consulting, stated the obvious. The central bank and ministry of communications did not respond to a request for comment, Reuters adds.
An increase in M2, the sum of cash together with checking, savings and other deposits, means more currency is circulating. That can accelerate inflation when coupled with a decline in the output of goods and services – such as in Venezuela, which is in the fourth year of a recession. When money supply is growing exponentially, as it has been in Venezuela, academics usually point to the infamous example of the Weimar Republic and leave it at that.
Slowly but surely Venezuela has stopped publishing all economic data. In addition to money supply and CPI, the government ceased the dissemination of gross domestic product data more than a year ago. Before that, it put an end to the release of balance of payments figures and its consumer product scarcity index.
For those who are somehow unfamiliar, Venezuela’s money supply, as measured by M2, has risen exponentially since Hugo Chavez, a devout socialist, came to power in 1999 and is a major factor behind what is thought to be the world’s highest inflation.
In the absence of official data – and highlighting Venezuela’s conflict of powers – the opposition-run National Assembly is publishing its own inflation figure, which it said reached 741 percent in the year to February. Critics accuse the government of suppressing data in order to hide the magnitude of the economic mess and of stoking price rises by reckless money-printing and overspending.
Socialist Nicolas Maduro, elected president after Chavez’s 2013 death, has long blamed Venezuela’s difficulties on an “economic war” being waged on the government by the opposition and U.S. government.
With no money supply figures available, the closest alternative is “excess bank reserves” data, a number which in the US has in recent years been around $2.5 trillion and which many expect will ultimately translate into runaway inflation once the hyperinflation in risk asset markets spills over into the broader economy. Still published by the Venezuela central bank, it represents the total funds that banks have available to make commercial loans though is no substitute for M2, say economists. The last year for which inflation data is available from the central bank is 2015, when consumer prices rose 181 percent.
Your early morning currency/gold and silver pricing/Asian and European bourse movements/ and interest rate settings TUESDAY morning 7:00 am
Euro/USA 1.0809 UP .0073/REACTING TO + huge Deutsche bank problems + USA election:/TRUMP WINS THE ELECTION/USA READY TO GO ON A SPENDING BINGE WITH THE TRUMP VICTORY/ITALIAN REFERENDUM DEFEAT/AND NOW ECB TAPERING BOND PURCHASES/USA RAISING INTEREST RATE/EUROPE BOURSES all in the GREEN EXCEPT LONDON FTSE
USA/JAPAN YEN 112.53 DOWN 0.021(Abe’s new negative interest rate (NIRP), a total DISASTER/SIGNALS U TURN WITH INCREASED NEGATIVITY IN NIRP/JAPAN OUT OF WEAPONS TO FIGHT ECONOMIC DISASTER/KURODA: HELICOPTER MONEY ON THE TABLE AND DECISION ON SEPT 21 DISAPPOINTS WITH STIMULUS/OPERATION REVERSE TWIST
GBP/USA 1.2464 UP .0099 (Brexit by March 2017/UK government loses case/parliament voted to the affirmative/PRIME MINISTER MAY DECIDES ON A HARD BREXIT/PARLIAMENT PASSES BILL TO BEGIN THE ARTICLE 50 PROCESS AND THE BREXIT/AND NOW A NEW SCOTLAND REFERENDUM IS ON THE TABLE)
USA/CAN 1.3318 DOWN .0019 (CANADA WORRIED ABOUT TRADE WITH THE USA WITH TRUMP ELECTION/ITALIAN EXIT AND GREXIT FROM EU)
Early THIS TUESDAY morning in Europe, the Euro ROSE by 73 basis points, trading now ABOVE the important 1.08 level RISING to 1.0809; Europe is still reacting to Gr Britain HARD BREXIT,deflation, announcements of massive stimulation (QE), a proxy middle east war, and the ramifications of a default at the Austrian Hypo bank, an imminent default of Greece, Glencore, Nysmark and the Ukraine, along with rising peripheral bond yield further stimulation as the EU is moving more into NIRP, and now the Italian referendum defeat AND NOW THE ECB TAPERING OF ITS PURCHASES/ THE USA’S NON tightening by FAILING TO RAISE THEIR INTEREST RATE AND NOW THE HUGE PROBLEMS FACING TOO BIG TO FAIL DEUTSCHE BANK + THE ELECTION OF TRUMP IN THE USA+ AND MONTE DEI PASCHI NATIONALIZATION / Last night the Shanghai composite CLOSED UP 10.80 POINTS OR 0.33% / Hang Sang CLOSED UP 91.13 POINTS OR 0.79% /AUSTRALIA CLOSED DOWN 0.03% / EUROPEAN BOURSES ALL IN THE GREEN EXCEPT LONDON
We are seeing that the 3 major global carry trades are being unwound. The BIGGY is the first one;
1. the total dollar global short is 9 trillion USA and as such we are now witnessing a sea of red blood on the streets as derivatives blow up with the massive rise in the rise in the dollar against all paper currencies and especially with the fall of the yuan carry trade. The emerging market which house close to 50% of the 9 trillion dollar short is feeling the massive pain as their debt is quite unmanageable.
2, the Nikkei average vs gold carry trade ( NIKKEI blowing up and the yen carry trade HAS BLOWN up/and now NIRP)
3. Short Swiss franc/long assets blew up ( Eastern European housing/Nikkei etc.
These massive carry trades are terribly offside as they are being unwound. It is causing global deflation ( we are at debt saturation already) as the world reacts to lack of demand and a scarcity of debt collateral. Bourses around the globe are reacting in kind to these events as well as the potential for a GREXIT>
The NIKKEI: this TUESDAY morning CLOSED DOWN 65.71 POINTS OR .34%
Trading from Europe and Asia:
1. Europe stocks ALL IN THE GREEN EXCEPT LONDON
2/ CHINESE BOURSES / : Hang Sang CLOSED UP 91.13 POINTS OR 0.37% / SHANGHAI CLOSED UP 10.80 OR .33%/Australia BOURSE CLOSED DOWN 0.03%/Nikkei (Japan)CLOSED DOWN 65.71 OR .34% / INDIA’S SENSEX IN THE RED
Gold very early morning trading: $1233.00
silver:$17.42
Early TUESDAY morning USA 10 year bond yield: 2.493% !!! UP 3 IN POINTS from MONDAY night in basis points and it is trading JUST BELOW resistance at 2.27-2.32%. THE RISE IN YIELD WITH THIS SPEED IS FRIGHTENING
The 30 yr bond yield 3.105, UP 4 IN BASIS POINTS from MONDAY night.
USA dollar index early TUESDAY morning: 99.83 DOWN 57 CENT(S) from MONDAY’s close.
This ends early morning numbers TUESDAY MORNING
xxxxxxxxxxxxxxxxxxxxxxxxxxxxxxxxxxxxxxxxxxxxxxxxxxxxxxxxxxxxxxxxxxxxxxxxxxxxxxxxxxxxxxxxxxxxxxxxxxxxxxxxxxxxxxx
And now your closing TUESDAY NUMBERS
Portuguese 10 year bond yield: 4.202% DOWN 4 in basis point yield from MONDAY
JAPANESE BOND YIELD: +.066% DOWN 1 in basis point yield from MONDAY/JAPAN losing control of its yield curve
SPANISH 10 YR BOND YIELD: 1.797% DOWN 5 IN basis point yield from MONDAY (this is totally nuts!!/
ITALIAN 10 YR BOND YIELD: 2.305 DOWN 6 POINTS in basis point yield from MONDAY
the Italian 10 yr bond yield is trading 50 points HIGHER than Spain.
GERMAN 10 YR BOND YIELD: +.454% UP 2 IN BASIS POINTS ON THE DAY
END
xxxxxxxxxxxxxxxxxxxxxxxxxxxxxxxxxxxxxxxxxxxxxxxxxxxxxxxxxxxxxxxxxxxxxxxxxxxxxxxxxxxxxxxxxxxxxxxxxxxxxxxxxxxxxxxxxxxxxxxxxxxxxxxxxxxxx
IMPORTANT CURRENCY CLOSES FOR TUESDAY
Closing currency crosses for TUESDAY night/USA DOLLAR INDEX/USA 10 YR BOND YIELD/1:00 PM
Euro/USA 1.0810 UP .0074 (Euro UP 74 basis points/ represents to DRAGHI A COMPLETE POLICY FAILURE/
USA/Japan: 112.02 DOWN: 0.540(Yen UP 54 basis points/
Great Britain/USA 1.2478 UP 0.01123( POUND UP 112 basis points)
USA/Canada 1.3329 DOWN 0.0008(Canadian dollar UP 8 basis points AS OIL FELL TO $47.70
xxxxxxxxxxxxxxxxxxxxxxxxxxxxxxxxxxxxxxxxxxxxxxxxxxxxxxxxxxxxxxxxxxxxxxxxxxxxxxxxx
This afternoon, the Euro was UP by 74 basis points to trade at 1.0810
The Yen ROSE to 112.02 for a GAIN of 54 Basis points as NIRP is STILL a big failure for the Japanese central bank/HELICOPTER MONEY IS NOW DELAYED/BANK OF JAPAN NOW WORRIED AS AS THEY ARE RUNNING OUT OF BONDS TO BUY AS BOND YIELDS RISE /OPERATION REVERSE TWIST ANNOUNCED SEPT 21.2016
The POUND ROSE BY 112 basis points, trading at 1.2478/
The Canadian dollar ROSE by 8 basis points to 1.3329, WITH WTI OIL FALLING TO : $47.70
Your closing 10 yr USA bond yield DOWN 4 IN basis points from MONDAY at 2.437% //trading well ABOVE the resistance level of 2.27-2.32%) very problematic USA 30 yr bond yield: 3.05 DOWN 4 in basis points on the day /
Your closing USA dollar index, 99.73 DOWN 68 CENT(S) ON THE DAY/1.00 PM
Your closing bourses for Europe and the Dow along with the USA dollar index closing and interest rates for TUESDAY: 1:00 PM EST
London: CLOSED DOWN 51.47 OR 0.69%
German Dax :CLOSED DOWN 90.377 POINTS OR 0.75%
Paris Cac CLOSED DOWN 9.73 OR 0.19%
Spain IBEX CLOSED DOWN 2.10 POINTS OR 0.02%
Italian MIB: CLOSED DOWN 49.71 POINTS OR 0.25%
The Dow closed DOWN 237.85 OR 1.14%
NASDAQ WAS closed DOWN 102.70 POINTS OR 1.83% 4.00 PM EST
WTI Oil price; 47.70 at 1:00 pm;
Brent Oil: 51.10 1:00 EST
USA /RUSSIAN ROUBLE CROSS: 57.53 DOWN 19/100 ROUBLES/DOLLAR
TODAY THE GERMAN YIELD RISES TO +0.454% FOR THE 10 YR BOND 1:30 EST
END
This ends the stock indices, oil price, currency crosses and interest rate closes for today
Closing Price for Oil, 5 pm/and 10 year USA interest rate:
WTI CRUDE OIL PRICE 5 PM:$47.50
BRENT: $50.83
USA 10 YR BOND YIELD: 2.416% (ANYTHING HIGHER THAN 2.70% BLOWS UP THE GLOBE)
USA 30 YR BOND YIELD: 3.033%
EURO/USA DOLLAR CROSS: 1.0806 UP .0070
USA/JAPANESE YEN:111.72 DOWN .842
USA DOLLAR INDEX: 99.73 down 69 cents ( HUGE resistance at 101.80 broken TO THE DOWNSIDE)
The British pound at 5 pm: Great Britain Pound/USA: 1.2476 : UP .01106 OR 111 BASIS POINTS.
Canadian dollar: 1.3351 UP .0014
German 10 yr bond yield at 5 pm: +.454%
END
And now your more important USA stories which will influence the price of gold/silver
TRADING IN GRAPH FORM FOR THE DAY
D.C. Drama Damages Trump Trades: Bonds Bid As Banks Bloodbath Most Since Brexit
It’s about time…

What will today’s damage do to Trumphoria and the hope trade?
While many pointed to fears over Trumpcare votes (and delays to any tax/banking reform agenda) as the catalyst for today, it was the demise of the dollar long that ignited the downward momentum in risk assets… (NOTE: The Dollar Index dropped back below 100.00 and Bloomberg Dollar Index dropped back to near election lows)

And judging by the still majorly net long USD positioning in FX futures, this dollar slide is far from over…

The potential for delays combined with a dovish-sounding Fed has sparked panic-selling in bank stocks… BofA is now down over 10% from the post-Trump speech to Congress highs…

This is the worst day for US banks since Brexit…(with the S&P Financial ETF busting below its 50DMA) – Bank Stocks are now unchanged since Dec 7th

Slamming the “Big 4” US banks back below $1 trillion

As a reminder – the gap between the exuberance of rising rates and bank stock prices is very wide…

And the credit market never bought it anyway…

Since The Fed hiked rates, gold and bonds are surging, stock indices are red and Banks are battered…

Today was the first 1% drop in the S&P and Dow since October 11th… Small Caps, Trannies, and Nasdaq worst day since September 9th,

Small Caps and Trannies are negative YTD…

VIX was chaotic in the last hour but did not help stocks… The Dow is now down over 500 points from its record highs back at 6 week lows…

Some technicals:
- Transports broke below 100DMA
- Small Caps broke below 50DMA, nears 100DMA
- Financials broke below 50DMA
- High Yield Bond ETF (HYG) broke below 100DMA
- Biotechs dropped near 50DMA
- VIX broke above 100DMA
- Retail (XRT) lowest since June 2016
- Treasury ETF (TLT) broke above 50DMA
- Silver broke above 50DMA
Liquidity collapsed intraday but the machines came back with a veangance into the close..

Seems like it’s about time (S&P is up 4% YTD, 2017 EPS -1% YTD)

AAPL saw another upgrade this morning – pushing it to fresh record highs – before it plunged most since December 1st

Retail Stocks tumbled further – to 6-week lows…

But as Bloomberg noted, while retailer stocks fall further, sales of downside puts in KSS, URBN, GPS, RL, WSM and DKS indicate sentiment may be turning.
- KSS ~20k April $35 puts sold for ~56c vs open interest of ~2.5k
- URBN ~20k April $21 puts were sold for 31c vs open interest of 213
- GPS ~6.6k April $21 puts were sold for 31c vs open interest of ~1.9k
- RL ~3.2k April $75 puts were sold for 85c vs open interest of ~6k
- WSM ~5.4k April $45 puts were sold for 45c vs open interest of ~1.2k
- DKS ~3.7k April $44 puts were sold for ~42c vs open interest of 805
The cumulative notional at each strike for each company is equal to ~200m.
Biotechs were battered most in 2 months after Trump comments overnight..

How much further do stocks have to fall?

High yield bond prices plunged…

Treasury yields tumbled lower on the day… (with the belly of the curve now notably lower in yield post-Fed rate hike)

Pushing 7Y, 10Y, and 30Y yields lower on the year…

And 5Y Real Yields back into negative territory…

Lots of relative-value indicators lining up but as we warned a week or two back – the spread between bond yields and stock dividend yields had reached an extreme that did not end well the last time…

The USD weakness has sparked buying gold (and silver) sending the latter back to lamost unchanged for March…but it’s not helping crude

RBOB and WTI fell today ahead of tonights inventory data…

Gold topped $1245 and Silver $17.50

Bitcoin and Gold both gained on the day…

end
Early trading:
Dollar Drops Most In 2 Years – Unchanged Since March 2015
Since The Fed’s ‘dovish’ rate hike last week, the dollar index has been tumbling. Today’s drop takes the greenback to its weakest since Nov 10th – almost erasing the entire post-Trump gain.
This is the 5th down day in a row for the Bloomberg Dollar Index

This is the biggest 5-day decline since March 2015 and The Dollar is now unchanged in 2 years…

Finally we note that DXY is less than 100 once again…

end
Then this: bank shares plummet, gold rises bond yields rise (bond prices fall) as Trumpcare vote is now in doubt:
(courtesy zerohedge)
Bank Bloodbath Batters Stocks; Bonds, Bullion Bounce As Trumpcare Vote Doubts Rise
Does this look like policy ‘success’ or ‘failure‘?

VIX is jumping as stocks sink…

And Bank stocks are collapsing…

With the Financials ETF breaking below a key technical level…Bank stocks have now gone nowhere since Dec 8th.

Lots of chatter about selling due to doubts on TrumpCare passing on Thursday – which will delay the tax reform foundation that the market is settled on (and any banking system reform)
end
Then: liquidity collapses! as stocks tumble!!
(zero hedge)
Liquidity Suddenly Collapses As Stocks Tumble
The S&P 500 is down almost 1% this morning. While in the old normal that would be nothing much to note, in the new normal, this is the biggest drop since October 11th!

The 110-day streak without a 1% drop is getting close…

And, as Nanex points out, S&P 500 futures liquidity is collapsing today…

And the bank bloodbath continues…

end
Obamacare Repeal Status Update
in Cartoon form:
As with anything, the status of the repeal of Obamacare depends on your politics…
Democrats…

Republicans…

The White House…

Ahead Of Critical Vote GOP Unveils More Changes To Health Bill, But It’s Not Enough
With just two days left until the House is set to vote this Thursday on the critical Obamacare repeal bill, where an adverse vote could lead to the biggest blow to Trump’s domestic policy agenda yet, House Republican leaders on Monday night released the latest set of changes to their ObamaCare replacement bill, as they scrambled to win more votes for the legislation.
According to the Hill, the changes include two measures that conservative Republican Study Committee members won at the White House on Friday: allowing states to require Medicaid recipients to work and allowing states to choose a Medicaid block grant over the cap system in the current bill. The House changes – which come in the form of a manager’s amendment – also contain nods to calls from lawmakers to increase tax credits for older people to address projected cost spikes under the GOP bill, without actually making that change. Instead, the House bill would enact a different, placeholder provision to increase a medical tax deduction, with roughly the same cost, $85 billion over 10 years.
As summarized by Axios, the GOP leaders skipped some of the biggest changes they could have made instead punting on the key ; a list of the actual changes the House GOP is making is as follows:
- States can now choose Medicaid per capita caps or block grants.
- There will be an optional Medicaid work requirement (with extra federal funds for states that do it).
- There will be a more generous Medicaid inflation adjustment for the costs of elderly and disabled.
- Obamacare taxes get repealed a year earlier.
What they punted on:
- A reserve fund to beef up the tax credit, especially for the low-income elderly, but no actual change to the tax credit. That’s up to the Senate.
What they left out:
- It doesn’t end the Medicaid expansion earlier, as conservatives wanted. Rep. Joe Barton could still bring that to the Rules Committee on Wednesday.
- It doesn’t try to repeal Obamacare’s insurance regulations. GOP leaders say that can’t be done in a budget “reconciliation” bill, but conservatives want them to try.
Still, the overall structure of the bill remains the same after these changes which is why the head of a House conservative group said there still aren’t enough votes to pass the measure.
“Currently there are not enough votes to pass the legislation,” House Freedom Caucus Chairman Mark Meadows said Monday night after a raucous caucus meeting. The group, which has opposed earlier versions, didn’t take an official position on the changes, but a spokeswoman said a whip count by the group showed it could block passage. Meadows added that “our leadership is going to put forth a bill that does not address any of the concerns in a meaningful way and will dare us to vote against it.” The Hill also adds that it remains in doubt whether this range of changes will be enough to win the 216 votes needed for the bill to pass on Thursday.
But the House chairmen who helped lead the efforts to write the bill, known as the American Health Care Act, expressed confidence.
“We’re confident these changes will set AHCA up for success in the House,” Chairmen Kevin Brady and Greg Walden said in a statement. “We look forward to working with our Senate colleagues to get this bill over the finish line and send it to the President as quickly as possible.”
House Speaker Paul Ryan was also optimistic “With this amendment, we accelerate tax relief, give states additional options to spend health care dollars how they choose, strengthen what were already substantial pro-life protections, and ensure there are necessary resources to help older Americans and the disabled.” In a statement late on Monday he also said: “I want to thank the White House and members from all parts of our conference who have helped make this the strongest legislation it can be.”
“With the president’s leadership and support for this historic legislation, we are now one step closer to keeping our promise to the American people and ending the Obamacare nightmare.”
The optimism was quickly shut down by the Meadows: “I think there are obviously some small tweaks that are good tweaks but there’s no substantial changes in the manager’s amendment that would make anybody be more compelled to vote for this,” Meadows said.
“This is a defining moment for the Freedom Caucus,” he added. “I don’t think there is a more critical vote for the Freedom Caucus than this particular one.” Another Freedom Caucus member, Justin Amash of Michigan, said he’s confident the group will largely hold together to block the bill after leaders ignored their demands.
“We’ve made suggestions all the way through,” he said Monday night. “If they don’t want to listen to them then that’s on them.”
On Tuesday morning, the president will visit Capitol Hill in an attempt to seal House Republican support for the plan. Representative Phil Roe, a member of the Republican vote-counting team, said Trump’s visit may help “any wavering souls.” “It’s gonna be a close vote I think, but I think it’s going to pass,” said Roe.
House leaders were working hard to to win over remaining holdouts, both conservatives and moderates in their party, a process known as whipping votes. “They’re already whipping with a whip that’s 10 feet long and five feet wide,” Meadows said when asked if GOP leaders were trying to pick off individual members of the Freedom Caucus.
Finally, as Axios concludes, this means “we will still have lots of drama between now and Thursday night.”
end
Trump issues a threat to Freedom Caucus member of the Republican House who still will vote no to the bill
(courtesy zerohedge)
“Vote Or Lose Your Seat”: Trump’s “Half-Joking” Threat “Mark, I’m Coming After You”
Realizing just how much is at stake in Thursday Trumpcare vote, which could set back his domestic policies for months, and even delay his tax reform into 2018 should it not pass, Trump went on the offensive in his visit to the Capitol on Tuesday seeking to “whip” republicans, especially the Freedom Caucus, to vote for his healthcare plan. In typical fashion, Trump was quite direct and issued a stern warning, telling Republicans they could “lose their seats” and the House majority, in 2018 if they fail to repeal and replace ObamaCare, GOP sources said quoted by The Hill and Axios.
During a closed-door meeting in the basement of the Capitol, Trump told rank-and-file House Republicans if the party is not successful in passing its health care bill, “I believe many of you will lose in 2018,” according to a source in the room.
To be sure, passing the House is just the first hurdle: should the American Health Care Act pass the Thursday, it will then head to the Senate, where it faces an even tougher road.
For now, however, Trump is focused on the House. His visit to Capitol Hill was billed as a rally for the healthcare bill, just two days before the historic vote to roll back President Obama’s signature domestic achievement. But the gathering took on a darker tone.
The president told lawmakers a failed vote would be embarrassing to the party and could result in members facing primary challengers and Republicans losing the House, sources said.
Here, Trump singled out Freedom Caucus Chairman Mark Meadows, a Trump ally during the presidential campaign who opposes the legislation.
Trump asked Meadows to stand and then talked about how Meadows supported his campaign early, adding he expects Meadows to support the Republican Obamacare replacement bill in the end. Trump then directly “threatened” the biggest hurdle to Trumpcare in the House:“I think Mark Meadows will get there too,” Trump told the Freedom Caucus chairman, half-joking. “Mark, I’m coming after you.”

Rep. Mark Meadows, R-N.C., chair of the House Freedom Caucus
As Axios adds, in a press gaggle after the meeting, Rep. Bill Flores said Trump was “half joking” in his comments. It is unclear what the other “half” was.
In any case, the (non) threat appears to have failed: when Meadows emerged from the meeting, he said he was still a “no” on the bill, adding that he didn’t anticipate any Freedom Caucus members would change their vote.
Without the Freedom Caucus’ vote, Trumpcare has no chance of passing the House, and may be the catalyst that finally unleashes all the pent up market concerns that Trump’s domestic policy will be indefinitely delayed, if not derailed outright.
* * *
Finally, as Bloomberg notes, Republicans remained still split after Trump’s visit to the Capitol. Rep. Peter King, asked if the bill can pass, replied “I don’t know. It’s going to be close.” Bloomberg also confirmed that resistance from the Freedom Caucus, which had said it had enough votes to kill the measure, appears to be holding, with Rep. Jim Jordan, saying he’s “still a no,” as is Rep. Mo Brooks, R-Ala.; Rep. Gary Palmer, R-Ala., who flipped support to yes late last week, says other members aren’t there for the measure and are still negotiating.
end
Meet the 26 holdouts to the Trumpcare bill
(courtesy zero hedge)
Here Are The 26 People Responsible For Today’s Market Plunge
As we noted first thing this morning, and as we, and others, have been warning since December, the passage of Trump’s tax plan is conditional on the effective repeal (and/or replace) of Obamacare, which is set for a vote on Thursday. And yet, it was only today that the market, and the press, appeared to notice that the biggest threat for the market – a market which has long ago priced in the successful passage of Trump’s tax cuts – is that Trumpcare may not pass not only the Senate, but also the House, which in turn would stall Trump’s tax plan schedule well into fiscal 2018 (if not later) as the following Reuters headlines confirms: “Worries about Trump tax plan sink stocks.”
And, unfortunately for Trump and bulls, despite the president’s trip to the Capitol this morning, he failed to whip holdout Republicans. In fact, according to the latest NBC News roll call, there are at least 26 Republicans who as of this moment, 48 hours before the House vote to repeal Obamacare, are either opposed, or lean “strongly against” the health bill despite its recent revisions.
So, for all those who are looking for someone – or someones – to blame for today’s selloff, which is shaping up as the worst of 2016, here is the list of 26 Republican house members who are jeopardizing Trump’s entire domestic agenda. As a reminder, the GOP can only afford to lose 21. If the list below holds, Trump’s biggest legislative push will be a failure on Thursday.

Furthermore, as The Hill reports, the leader of the House Freedom Caucus on Tuesday said there are still enough holdouts among conservatives to prevent the GOP’s ObamaCare repeal plan from winning passage on the floor.
When asked if there remained at least 21 Freedom Caucus members opposed to the legislation, Mark Meadows (R-N.C.) replied “yes.” That’s the maximum number of defections House GOP leaders can afford to clinch passage of the bill in a vote planned for Thursday.
Freedom Caucus members said they’re still not convinced to get on board despite President Trump’s pitch to the GOP conference Tuesday morning. Trump warned Republicans that they could they could lose their seats and the entire House majority in 2018 if they fail to repeal and replace ObamaCare.
As reported earlier, Trump singled out Meadows at one point during the meeting, saying “I think Mark Meadows will get there too.” Meadows shrugged off the possibility he might face a primary challenger accusing for opposing the repeal-and-replace plan.
“I don’t know too many people that can challenge me from the right,” Meadows told reporters in the Capitol. “I believe that I’m representing them in opposing this bill because it won’t lower premiums and until it does I’m going to be a no even if it sends me home,” Meadows added.
Members of the Freedom Caucus met in the Rayburn House Office Building shortly after Trump addressed the GOP conference.
They left saying that their position hasn’t changed.
end
The Truth About Trump’s “Skinny Budget”
[Ed. Note: To see exactly what this former Reagan insider has to say about Trump and the fiscal threats from politics and the debt ceiling, David Stockman is sending out a copy of his book Trumped! A Nation on the Brink of Ruin… And How to Bring It Back to any American willing to listen – before it is too late. To learn how to get your free copy CLICK HERE.]
I’ve been betting on the Great Disrupter, I find myself validated once again by the so-called “skinny budget” issued by the White House on Thursday.
After all, if you wanted to dump a truckload of sand into Washington’s fiscal gears, a plan to shift $54 billion from the shallow end of the Swamp (State, EPA, HUD etc.) to the deepest end (Pentagon) would be just the ticket.
And in the process you could throw your budget director overboard on day #1, which would be another plausible goal if disruption is your modus operandi. Otherwise, a credible fiscal spokesman might come in extremely handy in an environment where a bruising $20 trillion debt ceiling battle is just around the corner and where your multi-trillion “stimulus” plans are crushing up against inherited deficits of $10 trillionover the next decade.
Indeed, when you have already run-up Uncle Sam’s net debt by $260 billionduring your first 50 daysin office and will be out of cash before Memorial Day, you might want to have one of the GOP’s most experienced and competent budget hawks at your side and fit as a fiddle.
But not the Donald.
He just sent his Office of Management and Budget (OMB) Director, Mick Mulvaney, right into a nest of budgetary machine gun fire on Capitol Hill. I held that same position under Ronald Reagan, so I have some sympathy for the man.
Mulvaney will be eviscerated politically within weeks, and for no ascertainable purpose. The Trump skinny budget is already DOA, and couldn’t get 30 votes in the House on a secret ballot.
I should make clear I’m 100% in favor of every one of these cuts, and a lot more, too. For instance, I wouldn’t cut the Commerce Department by merely 16% or $1.5 billion; I’d ashcan the whole joint. Free enterprise doesn’t need thousands of bureaucrats to help it do “commerce.”
Likewise, the whole Agriculture Department is a relic of the New Deal. Farmers on $250,000 combines harvesting 16 rows of corn at a time by GPS navigation don’t need $23 billion per year from the taxpayers or even the $18 billioncontained in Trump’s skinny budget.
But since even the $54 billionof nondefense cuts Trump has identified involve deep surgery without anesthesia on numerous bloated appendages of Big Government, the idea that such savings should be wasted on the Pentagon is downright appalling.
Imperial Washington already spends $600 billionon defense, which happens to be10Xwhat the Russkies spend, and even then it wastes upwards of$125 billionper year according to the most recent independent audit. So Trump is not draining the Swamp; he’s just proposing to dredge the deep end and re-channel its fetid waters to the far side of the Potomac.
Even that is not going to happen, however.
What Trump’s skinny budget will actually accomplish is to embroil the already fragile GOP majorities in a rip-roaring internal fight over busting the DOD sequester caps in order to transfer wholly unachievable cuts from the domestic agencies.
Needless to say, this one-sided battle over “priorities” will squander huge amounts of political capital and add one more roadblock — on top of the “Obamacare repeal and replace” battle and the impending debt ceiling crisis — to the rapidly fading prospects for the Trump Stimulus that has gotten Wall Street so jiggy.
Indeed, the skinny budget is such a complete legislative stink bomb that it should clarify once and for all that the Trump White House has no semblance of a viable fiscal strategy. It is floundering wildly and digging itself deeper into budgetary quicksand with each passing day.
When all the bloodletting is done in this case, in fact, the military-industrial complex and congressional porkers will fund every dime of the $54 billion defense bonanza. But when the GOP appropriators in the House and Senate finish their laughing and spleen-busting denunciations of Trump’s skinny budget — the $6 billion of cuts from the National Institutes of Health, for instance — they will end up charging 95% of the utterly unnecessary defense increase to Uncle Sam’s already maxed-out credit card.
But making fiscal ends meet is not remotely on the Donald’s mind. As he said in Nashville last week, what he really has in mind is not so much whacking the EPA budget by 31% as it is blowing a cavernous hole in Uncle Sam’s revenue base:
We’re going to reduce your taxes, big league! I want to start that process so quickly!” Trump exclaimed to an ecstatic crowd in Nashville on Wednesday night. “Got to get the health care done, we gotta start the tax reductions…. I want to cut the hell out of taxes…”
Now let’s also be clear, there is nothing wrong with cutting Federal taxes by upwards of $5 trillion over the next 10 years, as would occur under the full measure of the Trump corporate and individual tax reductions.
After all, according to the Congressional Budget Office’s January estimates Federal receipts under existing law would total $43 trillion during the period, meaning that the Donald has a quite reasonable 12% weight reduction program in mind for Uncle Sam.
But if you don’t want to end up like the Donald’s Atlantic City casinos, you have to pay for these tax cuts with spending reductions. And, yes, that’s true even if you allow for “dynamic scoring” or the so called growth dividend and revenue reflows from lower tax burdens on labor and enterprise.
But no one except a fiscal charlatan can argue that tax cuts pay for 100%of the revenue loss. You might get25% back in higher growth, but you have to earn the rest either from new less damaging revenue sources such as the BAT (border adjustment tax); or preferably through sweeping spending cuts in the budgetary precincts where the real money lies.
That is, the national security complex including Homeland Security, Veterans and international security assistance and the middle class social security/Medicare entitlements. The latter will cost $1.7 trillionduring FY 2018 but the Trump administration has given them a free pass. And the three national security complex programs will cost $800 billionbetween them and the skinny budget loads on about $60 billionmore.
In other words, what passes for Trump’s fiscal program is a steaming pile of inconsistency, impossibility and retarded math. I’m quite sure that Trump’s pursuit of his “phenomenal” tax cuts along with these radical shifts in spending priorities and the huge infrastructure program to boot will result in one thing: Namely, a complete Fiscal Bloodbath and breakdown of governance that’s not even remotely “priced-in” in a stock market trading at 25X S&P 500 earnings.
To be sure, at the end of the day a complete descent into fiscal carnage is exactly what needs to happen.
Only after the financial markets first implode in fearful capitulation can the decks be cleared and a pathway to avoid eventual national bankruptcy be fashioned.
So by fecklessly indulging his posse of generals and the military industrial complex while sending his budget director on a kamikaze mission on the domestic side of the budget, the Donald is accomplishing his job as the Great Disrupter — even if that’s not exactly his stated purpose.
Trump’s skinny budget is more DOA than anything I sent to Capitol Hill back in 1981. At least back then the Gipper had a clean national balance sheet to squander and plenty of fiscal headroom to accommodate his sweeping tax cuts.
By contrast, the Donald is inheriting a $20 trilliondebt at 106% of GDP, not 30% where it was in 1981; and also another $10 trillion built in over the next decade.
Stated differently, the Donald was essentially sunk before he started, but has now added insult to injury by assembling an economic team that is clueless about the nation’s dire fiscal condition and the legislative process which surrounds it.
The only thing more ridiculous than Trump’s skinny budget, therefore, is the Wall Street delusion that a giant tax cut and infrastructure spending program is about to give the U.S. economy a huge shot of get-up-and-go.
To the contrary, what the Wall Street punters are about to get is the shocking discovery that the Trump Reflation Trade was a complete scam all along.
Thursday’s skinny budget was just another obvious clue.
Regards,
END
Somehow the current account deficit beats by a huge 8 standard deviations and it shrinks to only 112 billion. This would be a positive to revisions to 4th quarter GDP
(courtesy zero hedge)
Current Account Deficit Beats By 8 Standard Deviations, Shrinks To Smallest In 18 Months
The US current account deficit shrank dramatically in Q4.

Beating expectations of -$129 billion by 8 standard deviations, the $112.4 billion print is the smallest deficit since Q2 2015.

So 30 economists were way off the estimate with both trade and capital inflows improving – the balance of goods and services deficit widened to $132.32b (compared to $116.23b prior quarter), and the balance on primary income widened to $61.5b (compared to $41.6b prior quarter).
The current account deficit represents 2.4% of gross domestic product in the fourth quarter after 2.5% in the prior quarter.
This smaller-than-expected current account balance is a positive for Q4 GDP revisions.
end
Well that about does it for tonight
H


[…] MARCH 21GOLD SHOOTS UP $12.50 DESPITE THE RAID ATTEMPT/SILVER ALSO RISES 15 CENTS/THE GLD ADDS 4.15 … […]
LikeLike
[…] from Harvey Organ: […]
LikeLike