
GOLD: $1254.80 DOWN $2.45(COMEX TO COMEX CLOSINGS)
Silver: $16.04 DOWN 2 CENTS (COMEX TO COMEX CLOSINGS)
Closing access prices:
Gold $1254.80
silver: $16.03
For comex gold:
JULY/
NUMBER OF NOTICES FILED TODAY FOR JULY CONTRACT:7 NOTICE(S) FOR 700 OZ
TOTAL NOTICES SO FAR 60 FOR 6000 OZ (0.1866 tonnes)
For silver:
JUNE
315 NOTICE(S) FILED TODAY FOR
1,575,000 OZ/
Total number of notices filed so far this month: 4802 for 24,010,000 oz
XXXXXXXXXXXXXXXXXXXXXXXXXXXXXX
XXXXXXXXXXXXXXXXXXXXXXXXXXXXXX
Bitcoin: BID $6485/OFFER $6569: DOWN $7(morning)
Bitcoin: BID/ $6527/offer $6612: UP $33 (CLOSING/5 PM)
end
First Shanghai gold fix comes at 10 pm est
The second Shanghai gold fix: 2:15 pm
First Shanghai gold fix gold: 10 pm est: 1257.09
NY price at the same time: 1254.50
PREMIUM TO NY SPOT: $2.59
Second gold fix early this morning: 1259.68
USA gold at the exact same time:1256.95
PREMIUM TO NY SPOT: $3.03
AGAIN, SHANGHAI REJECTS NEW YORK PRICING.
WE WILL NOT PROVIDE LONDON FIXES AS THEY ARE NOT ACCURATE AS TO WHAT IS GOING ON AT THE SAME TIME FRAME.
Let us have a look at the data for today
xxxxxxxxxxxxxxxxxxxxxxxxxxxxxxxxxxxxxxxxxxxxxxxxxxxxxxxxxxxxxxxxxxxxxxxxxx
In silver, the total OPEN INTEREST FELL BY A TINY 196 CONTRACTS FROM 205,622 UP TO 205,426 DESPITE YESTERDAY’S 7 CENT RISE IN SILVER PRICING. WE HAVE HAD SUCH CONSIDERABLE COMEX LIQUIDATION THESE PAST SEVERAL DAYS BUT IT HAS NOT MANIFESTED ITSELF INTO LOWER DEMAND FOR PHYSICAL SILVER..JUST THE OPPOSITE. WE ARE STILL WITNESSING A LARGE AMOUNT OF PHYSICAL METAL STAND FOR COMEX DELIVERY(OVER 28 MILLION OZ) AS WELL AS CONSIDERABLE LONGS PACKING THEIR BAGS AND MIGRATING OVER TO LONDON IN GREATER NUMBERS IN THE FORM OF EFP’S. WE WERE NOTIFIED TUESDAY NIGHT, THAT WE HAD A GOOD SIZED NUMBER OF COMEX LONGS TRANSFERRING THEIR CONTRACTS TO LONDON THROUGH THE EFP: 2265 EFP’S FOR SEPT. , 0 EFP’S FOR DECEMBER AND ZERO FOR ALL OTHER MONTHS AND THEREFORE TOTAL ISSUANCE: OF 2265 CONTRACTS. WITH THE TRANSFER OF 2265 CONTRACTS, WHAT THE CME IS STATING IS THAT THERE IS NO SILVER (OR GOLD) TO BE DELIVERED UPON AT THE COMEX AS THEY MUST EXPORT THEIR OBLIGATION TO LONDON. ALSO KEEP IN MIND THAT THERE CAN BE A DELAY OF 24-48 HRS IN THE ISSUING OF EFP’S. THE 2265 EFP CONTRACTS TRANSLATES INTO 11.325 MILLION OZ ACCOMPANYING:
1.THE 7 CENT GAIN IN SILVER PRICE AT THE COMEX AND
2. THE STRONG AMOUNT OF SILVER OUNCES WHICH STOOD FOR THE JUNE/2018 COMEX DELIVERY MONTH. (5.420 MILLION OZ) AND NOW JULY/ 2018 WITH 28.485 MILLION OZ INITIALLY STANDING FOR DELIVERY.
ACCUMULATION FOR EFP’S/SILVER/J.P.MORGAN’S HOUSE OF BRIBES, / STARTING FROM FIRST DAY NOTICE/FOR MONTH OF JUNE:
9634 CONTRACTS (FOR 4 TRADING DAYS TOTAL 9634 CONTRACTS) OR 48.17 MILLION OZ: (AVERAGE PER DAY: 2408 CONTRACTS OR 12.04 MILLION OZ/DAY)
TO GIVE YOU AN IDEA AS TO THE HUGE SUPPLY THIS MONTH IN SILVER: SO FAR THIS MONTH OF JULY: 48.17 MILLION PAPER OZ HAVE MORPHED OVER TO LONDON. THIS REPRESENTS AROUND 5.26% OF ANNUAL GLOBAL PRODUCTION (EX CHINA EX RUSSIA)* LAST MONTH’S 345.43 MILLION OZ IS THE SECOND HIGHEST RECORDED ISSUANCE OF EFP’S AND IT FOLLOWED THE RECORD SET IN APRIL 2018 OF 385.75 MILLION OZ.
ACCUMULATION IN YEAR 2018 TO DATE SILVER EFP’S: 1,707.91 MILLION OZ.
ACCUMULATION FOR JAN 2018: 236.879 MILLION OZ
ACCUMULATION FOR FEB 2018: 244.95 MILLION OZ
ACCUMULATION FOR MARCH 2018: 236.67 MILLION OZ
ACCUMULATION FOR APRIL 2018: 385.75 MILLION OZ
ACCUMULATION FOR MAY 2018: 210.05 MILLION OZ
ACCUMULATION FOR JUNE 2018: 345.43 MILLION OZ
RESULT: WE HAD A TINY SIZED DECREASE IN COMEX OI SILVER COMEX OF 196 DESPITE THE SMALL 7 CENT GAIN IN SILVER PRICE. NOT ONLY THAT BUT THE CME NOTIFIED US THAT IN FACT WE HAD A FAIR SIZED EFP ISSUANCE OF 2265 CONTRACTS WHICH EXITED OUT OF THE SILVER COMEX AND TRANSFERRED THEIR OI TO LONDON AS FORWARDS. SPECULATORS CONTINUED THEIR INTEREST IN ATTACKING THE SILVER COMEX FOR PHYSICAL SILVER (SEE COMEX DATA) . FROM THE CME DATA: 2265 EFP’S FOR SEPT, 0 EFP’S FOR DECEMBER AND ZERO FOR ALL OVER MONTHS FOR A DELIVERABLE FORWARD CONTRACT OVER IN LONDON WITH A FIAT BONUS (TOTAL: 2265). TODAY WE GAINED A TINY: 2270 TOTAL OI CONTRACTS ON THE TWO EXCHANGES: i.e.2265 OPEN INTEREST CONTRACTS HEADED FOR LONDON (EFP’s) TOGETHER WITH AN INCREASE OF 5 OI COMEX CONTRACTS. AND ALL OF THIS DEMAND HAPPENED WITH A 7 CENT GAIN IN PRICE OF SILVER AND A CLOSING PRICE OF $16.07 WITH RESPECT TO TUESDAY’S TRADING. YET WE STILL HAVE A GIGANTIC AMOUNT OF SILVER STANDING AT THE COMEX FOR DELIVERY IN THIS ACTIVE JULY DELIVERY MONTH OF MORE THAN 28 MILLION OZ. IT SURE LOOKS LIKE A FAILED BANKER SHORT COVERING EXERCISE AS BANKERS ARE SCRAMBLING TO COVER THEIR HUGE SHORTFALL.
In ounces AT THE COMEX, the OI is still represented by OVER 1 BILLION oz i.e. 1.029 MILLION OZ TO BE EXACT or 147% of annual global silver production (ex Russia & ex China).
FOR THE NEW FRONT JULY MONTH/ THEY FILED AT THE COMEX: 315 NOTICE(S) FOR 1,575,000 OZ OF SILVER
IN SILVER, WE SET THE NEW RECORD OF OPEN INTEREST AT 243,411 CONTRACTS ON APRIL 9.2018. AND AGAIN THIS HAS BEEN SET WITH A LOW PRICE OF $16.51
ON THE DEMAND SIDE WE HAVE THE FOLLOWING:
- HUGE AMOUNTS OF SILVER STANDING FOR DELIVERY (MARCH/2018: 27 MILLION OZ , APRIL/2018 : 2.485 MILLION OZ MAY: 36.285 MILLION OZ / JUNE/2018 (5.420 MILLION OZ) AND NOW JULY 2018 AMOUNT INITIALLY STANDING: 28.485 MILLION OZ )
- HUGE RECORD OPEN INTEREST IN SILVER 243,411 CONTRACTS (OR 1.217 BILLION OZ/ SET APRIL 9/2018
- HUGE ANNUAL EFP’S ISSUANCE EQUAL TO 2.9 BILLION OZ OR 400% OF SILVER ANNUAL PRODUCTION/2017
- RECORD SETTING EFP ISSUANCE FOR ANY MONTH IN SILVER; APRIL/2018/ 385.75 MILLION OZ/ AND THE SECOND HIGHEST RECORDED EFP ISSUANCE JUNE 2018 345.43 MILLION OZ
AND YET, WITH THE EXTREMELY HIGH EFP ISSUANCE, WE HAVE A CONTINUAL LOW PRICE OF SILVER DESPITE THE ABOVE HUGE DEMAND. TO ME THE ONLY ANSWER IS THAT WE HAVE SOVEREIGN (CHINA) WHO IS ENDEAVOURING TO GOBBLE UP ALL AVAILABLE PHYSICAL SILVER NO MATTER WHERE, EXACTLY WHAT J.P.MORGAN IS DOING. AND IT IS MY BELIEF THAT J.P.MORGAN IS HOLDING ITS SILVER FOR ITS BENEFICIAL OWNER..THE USA GOVERNMENT WHO IN TURN IS HOLDING THAT SILVER FOR CHINA.(FOR A SILVER LOAN REPAYMENT).
In gold, the open interest FELL BY A CONSIDERABLE 3763 CONTRACTS DOWN TO 490,401 DESPITE THE RISE IN THE GOLD PRICE/YESTERDAY’S TRADING (A GAIN IN PRICE OF $5.15). WE ARE NOW IN THE ACTIVE DELIVERY MONTH OF JULY. NO DOUBT THE BOYS ARE CASHING IN THEIR COMEX LONGS TO BEGIN THE PROCESS TO MOVE INTO LONDON FORWARDS. THE CME RELEASED THE DATA FOR EFP ISSUANCE AND IT TOTALED AN ATMOSPHERIC SIZED 22,417 CONTRACTS : AUGUST SAW THE ISSUANCE OF: 15,917 CONTRACTS, DECEMBER HAD AN ISSUANCE OF 6500 CONTACTS AND THEN ALL OTHER MONTHS ZERO. The new COMEX OI for the gold complex rests at 490,401. ALSO REMEMBER THAT THERE WILL BE A DELAY IN THE ISSUANCE OF EFP’S. THE BANKERS REMOVE LONG POSITIONS OF COMEX GOLD IMMEDIATELY. THEN THEY ORCHESTRATE THEIR PRIVATE EFP DEAL WITH THE LONGS AND THAT COULD TAKE AN ADDITIONAL 48 HRS SO WE GENERALLY DO NOT GET A MATCH WITH RESPECT TO DEPARTING COMEX LONGS AND NEW EFP LONG TRANSFERS. . EVEN THOUGH THE BANKERS ISSUED THESE MONSTROUS EFPS, THE OBLIGATION STILL RESTS WITH THE BANKERS TO SUPPLY METAL BUT IT TRANSFERS THE RISK TO A LONDON BANKER OBLIGATION AND NOT A NEW YORK COMEX OBLIGATION. LONGS RECEIVE A FIAT BONUS TOGETHER WITH A LONG LONDON FORWARD. THUS, BY THESE ACTIONS, THE BANKERS AT THE COMEX HAVE JUST STATED THAT THEY HAVE NO APPRECIABLE METAL!! THIS IS A MASSIVE FRAUD: THEY CANNOT SUPPLY ANY METAL TO OUR COMEX LONGS BUT THEY ARE QUITE WILLING TO SUPPLY MASSIVE NON BACKED GOLD (AND SILVER) PAPER KNOWING THAT THEY HAVE NO METAL TO SATISFY OUR LONGS. LONDON IS NOW SEVERELY BACKWARD IN BOTH GOLD AND SILVER AND WE ARE WITNESSING DELAYS IN ACTUAL DELIVERIES.
IN ESSENCE WE HAVE A HUMONGOUS OI GAIN IN TOTAL CONTRACTS ON THE TWO EXCHANGES: 3763 OI CONTRACTS DECREASED AT THE COMEX AND AN ATMOSPHERIC SIZED 22,417 EFP OI CONTRACTS WHICH NAVIGATED OVER TO LONDON. THUS TOTAL OI GAIN: 18924 CONTRACTS OR 1,892,400 OZ = 58.98 TONNES. AND STRANGELY ALL OF THIS DEMAND OCCURRED WITH ONLY A FAIR RISE IN THE PRICE OF GOLD ON YESTERDAY TO THE TUNE OF $5.15???
YESTERDAY, WE HAD 12,875 EFP’S ISSUED.
ACCUMULATION OF EFP’S GOLD AT J.P. MORGAN’S HOUSE OF BRIBES: (EXCHANGE FOR PHYSICAL) FOR THE MONTH OF JUNE : 47048 CONTRACTS OR 4,704,800 OZ OR 146.33 TONNES (4 TRADING DAYS AND THUS AVERAGING: 11,762 EFP CONTRACTS PER TRADING DAY OR 1,176,200 OZ/ TRADING DAY),,
TO GIVE YOU AN IDEA AS TO THE HUGE SIZE OF THESE EFP TRANSFERS : THIS MONTH IN 4 TRADING DAYS IN TONNES: 146.33 TONNES
TOTAL ANNUAL GOLD PRODUCTION, 2017, THROUGHOUT THE WORLD EX CHINA EX RUSSIA: 2555 TONNES
THUS EFP TRANSFERS REPRESENTS 146.33/2550 x 100% TONNES = 5.73% OF GLOBAL ANNUAL PRODUCTION SO FAR IN JULY ALONE.***
ACCUMULATION OF GOLD EFP’S YEAR 2018 TO DATE: 4,249.24* TONNES *SURPASSED ANNUAL PROD’N
ACCUMULATION OF GOLD EFP’S FOR JANUARY 2018: 653.22 TONNES (21 TRADING DAYS)
ACCUMULATION OF GOLD EFP’S FOR FEBRUARY 2018: 649.45 TONNES (20 TRADING DAYS)
ACCUMULATION OF GOLD EFP’S FOR MARCH 2018: 741.89 TONNES (22 TRADING DAYS)
ACCUMULATION OF GOLD EFP’S FOR APRIL 2018: 713.84 TONNES (21 TRADING DAYS)
ACCUMULATION OF GOLD EFP’S FOR MAY 2018: 693.80 TONNES ( 22 TRADING DAYS)
ACCUMULATION OF GOLD EFP FOR JUNE 2018 650.71 TONNES (21 TRADING DAYS)
WHAT IS ALARMING TO ME, ACCORDING TO OUR LONDON EXPERT ANDREW MAGUIRE IS THAT THESE EFP’S ARE BEING TRANSFERRED TO WHAT ARE CALLED SERIAL FORWARD CONTRACT OBLIGATIONS AND THESE CONTRACTS ARE LESS THAN 14 DAYS. ANYTHING GREATER THAN 14 DAYS, THESE MUST BE RECORDED AND SENT TO THE COMPTROLLER, GREAT BRITAIN TO MONITOR RISK TO THE BANKING SYSTEM. IF THIS IS INDEED TRUE, THEN THIS IS A MASSIVE CONSPIRACY TO DEFRAUD AS WE NOW WITNESS A MONSTROUS TOTAL EFP’S ISSUANCE AS IT HEADS INTO THE STRATOSPHERE.
Result: A CONSIDERABLE SIZED DECREASE IN OI AT THE COMEX OF 3763 DESPITE THE $5.13 RISE IN PRICING GOLD UNDER TOOK YESTERDAY // . WE ALSO HAD AN ATMOSPHERIC SIZED NUMBER OF COMEX LONG TRANSFERRING TO LONDON THROUGH THE EFP ROUTE: 22,417 CONTRACTS AS THESE HAVE ALREADY BEEN NEGOTIATED AND CONFIRMED. THERE OBVIOUSLY DOES NOT SEEM TO BE MUCH PHYSICAL GOLD AT THE COMEX. I GUESS IT EXPLAINS THE HUGE ISSUANCE OF EFP’S…THERE IS HARDLY ANY GOLD PRESENT AT THE GOLD COMEX FOR DELIVERY PURPOSES. IF YOU TAKE INTO ACCOUNT THE 22,417 EFP CONTRACTS ISSUED, WE HAD AN ATMOSPHERIC NET GAIN OF 18,924 CONTRACTS IN TOTAL OPEN INTEREST ON THE TWO EXCHANGES:
22,417 CONTRACTS MOVE TO LONDON AND 3763 CONTRACTS DECREASED AT THE COMEX. (in tonnes, the GAIN in total oi equates to 58.86 TONNES). ..AND BELIEVE IT OR NOT BUT ALL OF THIS DEMAND OCCURRED WITH ONLY A SMALL SIZED GAIN OF $5.15 IN TRADING. AT THE COMEX!!!. THE COMEX IS AN OUTRIGHT FRAUD
we had: 7 notice(s) filed upon for 700 oz of gold at the comex.
xxxxxxxxxxxxxxxxxxxxxxxxxxxxxxxxxxxxxxxxxxxxxxxxxxxxxxxxxxx
With respect to our two criminal funds, the GLD and the SLV:
GLD...
WITH GOLD DOWN $2.45 TODAY: /
NO CHANGE IN GOLD INVENTORY AT THE GLD
/GLD INVENTORY 803.42 TONNES
Inventory rests tonight: 803.42 tonnes.
TO ALL INVESTORS THINKING OF BUYING GOLD THROUGH THE GLD ROUTE: YOU ARE MAKING A TERRIBLE MISTAKE AS THE CROOKS ARE USING WHATEVER GOLD COMES IN TO ATTACK BY SELLING THAT GOLD. IT SURE SEEMS TO ME THAT THE GOLD OBLIGATIONS AT THE GLD EXCEED THEIR INVENTORY
SLV/
WITH SILVER DOWN 2 CENTS:
NO CHANGE IN SILVER INVENTORY AT THE SLV
/INVENTORY RESTS AT 324.305 MILLION OZ/
NOTE THE DIFFERENCE BETWEEN THE GLD AND SLV: THE CROOKS CAN RAID GOLD BECAUSE THEY DO HAVE SOME PHYSICAL. THEY DO NOT RAID SILVER PROBABLY BECAUSE THERE IS NO REAL SILVER INVENTORIES BEHIND THEM
end
First, here is an outline of what will be discussed tonight:
1. Today, we had the open interest in SILVER FELL BY A TINY SIZED 196 CONTRACTS from 205,622 DOWN TO 205,426 (AND FURTHER FROM THE NEW COMEX RECORD SET /APRIL 9/2017 AT 243,411/SILVER PRICE AT THAT DAY: $16.53). THE PREVIOUS RECORD OTHER THAN WAS ESTABLISHED AT: 234,787, SET ON APRIL 21.2017 OVER ONE YEAR AGO. THE PRICE OF SILVER ON THAT DAY: $17.89. OUR CUSTOMARY MIGRATION OF COMEX LONGS MORPH INTO LONDON FORWARDS CONTINUES AS OUR BANKERS USED THEIR EMERGENCY PROCEDURE TO ISSUE:
2265 EFP CONTRACTS FOR SEPT., 0 EFP CONTRACTS FOR DECEMBER AND ALL OTHER MONTHS: ZERO. TOTAL EFP ISSUANCE: 2265 CONTRACTS . EFP’S GIVE OUR COMEX LONGS A FIAT BONUS PLUS A DELIVERABLE PRODUCT OVER IN LONDON. IF WE TAKE THE OI LOSS AT THE COMEX OF 196 CONTRACTS TO THE 2265 OI TRANSFERRED TO LONDON THROUGH EFP’S, WE OBTAIN A NET GAIN OF 2069OPEN INTEREST CONTRACTS. THUS IN OUNCES, THE GAIN ON THE TWO EXCHANGES: 10.345 MILLION OZ!!! AND YET WE ALSO HAVE A STRONG DEMAND FOR PHYSICAL AS WE WITNESS AN INITIAL STANDING OF OVER 28 MILLION OZ AND YET ALL OF THIS DEMAND OCCURRED DESPITE A RELATIVELY SMALL 7 CENT GAIN IN PRICE??? .
IT SURE LOOKS LIKE WE ARE GETTING SOME COVERING FROM THE BANKERS SIDE ESPECIALLY WHEN YOU SEE A GOOD GAIN IN PRICE AND THEN A FALL IN COMEX OI AND A SMALLER THAN EXPECTED EFP ISSUANCE.
RESULT: A CONSIDERABLE SIZED DECREASE IN SILVER OI AT THE COMEX DESPITE THE 7 CENT RISE THAT SILVER UNDERTOOK IN PRICING ON TUESDAY. BUT WE ALSO HAD ANOTHER FAIR SIZED 2265 EFP’S ISSUED TRANSFERRING COMEX LONGS OVER TO LONDON. TOGETHER WITH THE STRONG SIZED AMOUNT OF SILVER OUNCES STANDING FOR JULY, DEMAND FOR PHYSICAL SILVER CONTINUES TO INTENSIFY AS WE WITNESS SEVERE BACKWARDATION IN SILVER IN LONDON AS WELL AS THE STRONG AMOUNT OF PHYSICAL STANDING FOR METAL AT THE COMEX.
(report Harvey)
.
2.a) The Shanghai and London gold fix report
(Harvey)
2 b) Gold/silver trading overnight Europe, Goldcore
(Mark O’Byrne/zerohedge
and in NY: Bloomberg
3. ASIAN AFFAIRS
i)FRIDAY MORNING/THURSDAY NIGHT: Shanghai closed UP 13.34 POINTS OR 0.49% /Hang Sang CLOSED UP 133.53 POINTS OR 0.47%/ / The Nikkei closed UP 241.15 POINTS OR 1.12% /Australia’s all ordinaires CLOSED UP 0.84% /Chinese yuan (ONSHORE) closed DOWN at 6.6460 AS POBC RESUMES ITS HUGE DEVALUATION /Oil DOWN to 72,39 dollars per barrel for WTI and 76.64 for Brent. Stocks in Europe OPENED MIXED //. ONSHORE YUAN CLOSED UP AT 6.6460 AGAINST THE DOLLAR. OFFSHORE YUAN CLOSED DOWN ON THE DOLLAR AT 6.6611 :HUGE DEVALUATION/PAST SEVERAL DAYS NOW RESUMES: TARIFF WARS BEGIN//ONSHORE YUAN TRADING STRONGER AGAINST OFFSHORE YUAN/ONSHORE YUAN TRADING WEAKER AGAINST USA DOLLAR/OFFSHORE YUAN TRADING MUCH WEAKER AGAINST THE DOLLAR /CHINA RETALIATES WITH TARIFFS/ TRUMP RESPONDS TO NEW TARIFFS AND IT NOW A FULL TRADE WAR COMMENCED
/NORTH KOREA/SOUTH KOREA
i)North Korea/South Korea/USA
b) REPORT ON JAPAN
A mixture of good news and bad for Japan last night: Japanese wages finally soar at the fastest pace in 24 years as the aging population witnesses a declining labour pool. However this did not translate into higher spending which is what Japan desperately needs:
( zerohedge)
3 c CHINA
i)China/USA
It began at midnight: trade wars commence between China and the USA
( zerohedge)
4. EUROPEAN AFFAIRS
i
5. RUSSIAN AND MIDDLE EASTERN AFFAIRS
i)Russia/Syria/USA
This will be interesting to watch: Putin is preparing to make major concessions during the Trump summit and word is that he will not support Iran inside Syria
( zerohedge)
ii)Russia/USA
Russia joins the global trade war by imposing tariffs on USA energy and mining imports
( zerohedge)
6 .GLOBAL ISSUES
( zerohedge)
7. OIL ISSUES
8. EMERGING MARKET
9. PHYSICAL MARKETS
i)Alasdair comments on the true rate of inflation and it is rearing its ugly head throughout the globe
( Alasdair Macleod/GATA)
ii)SGE withdrawals are a good measure of gold demand coming from China. In the first half of the year 1,000 tonnes of gold was withdrawn = demand. China mines about 420 tonnes a year so if you exclude 220 tonnes (420/2) we have citizen demand of 780 tonnes. per half year. China’s 420 tonnes goes straight to the banks but for the past two years, China has not announced an increase in their sovereign holdings. You can bet the farm that they will announce a huge increase in their holdings.
(courtesy Lawrie Williams)
10. USA stories which will influence the price of gold/silver)
i)Jobs report and job related data
a)The official report; 213,000 job gains, stronger than expected but hours earnings again disappoint as does the huge increase in unemployment as the total unemployed rises from 6.065 million to 6.564 million or a gain in unemployed at 499,000 poor souls.
( zerohedge)
b)And now the real data:
ii)MARKET TRADING/EARLY MORNING
a)Last night:
the trade war begins at midnight
( zerohedge)
b)This morning after release of the NON farm payrolls;
The trade deficit improves from 43.6 billion down to 43.1 billion as the USA exports more and imports less. However the trade imbalance with China increases from 30.8 billion dollars to 32 billion dollars. This will be a positive to GDP growth figures
( zerohedge)
v)SWAMP STORIES
a)today is the deadline for the FBI to come clean and provide the necessary emails
( zerohedge)
b)Here comes the first emails and they are dandies. They reveal that the FBI were scrambling to find dirt so that they could question people who interact with the President
I think this is prima facie evidence of political bias and then official actions just got connected.
( zerohedge)
( zerohedge)
Trading Volumes on the COMEX
PRELIMINARY COMEX VOLUME FOR TODAY: 205,279 contracts
CONFIRMED COMEX VOL. FOR YESTERDAY: 430,566 contracts
xxxxxxxxxxxxxxxxxxxxxxxxxxxxxxxxxxxxxxxxxxxxxxxxxxxxxxxxxxxxxxxxxxxx
And now for the wild silver comex results.
Total silver OI FELL BY A TINY SIZED 196 CONTRACTS FROM 205,622 UP TO 205,426 (AND A LITTLE FURTHER FROM THE THE NEW RECORD OI FOR SILVER SET APRIL 9.2018/ 243,411 CONTRACTS) DESPITE THE 7 CENT GAIN IN SILVER PRICING/ YESTERDAY. SINCE WE ARE NOW INTO THE ACTIVE DELIVERY MONTH OF JULY, WE WERE INFORMED THAT WE STRONG SIZED 2265 EFP CONTRACTS FOR SEPT., 0 EFP CONTRACTS FOR DECEMBER AND ZERO FOR ALL OTHER MONTHS. THESE EFPS WERE ISSUED TO COMEX LONGS WHO RECEIVED A FIAT BONUS PLUS A DELIVERABLE PRODUCT OVER IN LONDON. THE TOTAL EFP’S ISSUED: 2265. ON A NET BASIS WE GAINED 2069 SILVER OPEN INTEREST CONTRACTS AS WE OBTAINED A 196 CONTRACT LOSS AT THE COMEX COMBINING WITH THE ADDITION OF 2265 OI CONTRACTS NAVIGATING OVER TO LONDON.
NET GAIN ON THE TWO EXCHANGES: 2069 CONTRACTS
AMOUNT STANDING FOR SILVER AT THE COMEX
We are now in the active delivery month of JULY and here the front month fell by 255 contacts to stand at 1214 contracts. We had 310 notices filed yesterday so we continue where we left off yesterday as guys refuse to take any more silver ETF’s and instead seek physical delivery at the comex. We gained 55 contracts or an additional 275,000 oz of silver will stand at the comex.
The next delivery month, after July is the non active delivery month of August and here we gained 39 contracts to stand at 1057. The next active delivery month after August for silver is September and here the OI FELL by 391 contracts DOWN to 159,705
We had 315 notice(s) filed for 1,575,000 OZ for the JULY 2018 COMEX contract for silver
FROM LAST YEARS DATA, ON FIRST DATE NOTICE FOR THE JULY 2017 SILVER COMEX DELIVERY MONTH WE HAD 12.115 MILLION OZ OF SILVER STANDING FOR DELIVERY. AT MONTH’S END WE HAD 16.435 MILLION OZ EVENTUALLY STAND AS WE ALREADY HAD QUEUE JUMPING BEGIN IN EARNEST FROM APRIL 2017 ONWARD EVEN TO TODAY. SO WITH TODAY’S NUMBERS WE SURPASSED LAST YEAR’S LEVEL BY A WIDE MARGIN.
INITIAL standings for JULY/GOLD
JULY 6/2018.
| Gold | Ounces |
| Withdrawals from Dealers Inventory in oz | nil oz |
| Withdrawals from Customer Inventory in oz |
nil OZ
|
| Deposits to the Dealer Inventory in oz | NIL oz |
| Deposits to the Customer Inventory, in oz | nil
oz |
| No of oz served (contracts) today |
7 notice(s)
700 OZ
|
| No of oz to be served (notices) |
159 contracts
(15,900 oz)
|
| Total monthly oz gold served (contracts) so far this month |
60 notices
6000 OZ
.1866TONNES
|
| Total accumulative withdrawals of gold from the Dealers inventory this month | NIL oz |
| Total accumulative withdrawal of gold from the Customer inventory this month | xxx oz |
For JULY:
Today, 0 notice(s) were issued from JPMorgan dealer account and 0 notices were issued from their client or customer account. The total of all issuance by all participants equates to 7 contract(s) of which 0 notices were stopped (received) by j.P. Morgan dealer and 0 notice(s) was (were) stopped/ Received) by j.P.Morgan customer account.
xxxxxxxxxxxxxxxxxxxxxxxxxxxxxxxxxxxxxxxxxxxxxxxxxxxxxxxxxxxxxxxxxxxxxxxxxx
To calculate the INITIAL total number of gold ounces standing for the JULY. contract month, we take the total number of notices filed so far for the month (60) x 100 oz or 6000 oz, to which we add the difference between the open interest for the front month of JULY. (166 contracts) minus the number of notices served upon today (7 x 100 oz per contract) equals 21,900 oz,(.6811 tonnes) the number of ounces standing in this non active month of JULY
Thus the INITIAL standings for gold for the JULY contract month:
No of notices served (60 x 100 oz) + {(166)OI for the front month minus the number of notices served upon today (7 x 100 oz )which equals 21,900 oz standing in this NON – active delivery month of JULY .
We gained 5 contracts or an additional 500 oz will stand for delivery as these guys refused to morph into London based forwards and receive a good fiat sweetener on top of their forwards for their efforts
THERE ARE ONLY 7.4208 TONNES OF REGISTERED COMEX GOLD AVAILABLE FOR DELIVERY AGAINST 0.6811 TONNES STANDING FOR JULY
IN THE LAST 18 MONTHS 82 NET TONNES HAS LEFT THE COMEX.
end
And now for silver
AND NOW THE APRIL DELIVERY MONTH
JULY INITIAL standings/SILVER
| Silver | Ounces |
| Withdrawals from Dealers Inventory | nil oz |
| Withdrawals from Customer Inventory |
603,175,960 oz
CNT
Scotia
|
| Deposits to the Dealer Inventory |
1,209,740.500
oz
CNT
|
| Deposits to the Customer Inventory |
nil
|
| No of oz served today (contracts) |
315
CONTRACT(S)
(1,575,000 OZ)
|
| No of oz to be served (notices) |
895 contracts
(4,475,000 oz)
|
| Total monthly oz silver served (contracts) | 4802 contracts
(24,010,000 oz) |
| Total accumulative withdrawal of silver from the Dealers inventory this month | NIL oz |
| Total accumulative withdrawal of silver from the Customer inventory this month |
we had 1 inventory movement at the dealer side of things
i) Into dealer CNT: 1,209,740.500 oz
total dealer deposits: 1,209,740.500 oz
we had 1 deposits into the customer account
i) Into JPMorgan: NIL oz
*** JPMorgan for most of 2017 and in 2018 has adding to its inventory almost every single day.
JPMorgan now has 141 million oz of total silver inventory or 52.0% of all official comex silver. (141 million/270 million)
ii) Into CNT; 578,733.160 oz
iii) Into Scotia: 578,,733.160
total customer deposits today: 603,175.960 oz
we had 0 withdrawals from the customer account;
total withdrawals: nil oz
we had 0 adjustments/
total dealer silver: 76.927 million
total dealer + customer silver: 278 .801 million oz
The total number of notices filed today for the JULY. contract month is represented by 315 contract(s) FOR 1,575,000 oz. To calculate the number of silver ounces that will stand for delivery in JULY., we take the total number of notices filed for the month so far at 4802 x 5,000 oz = 24,010,000 oz to which we add the difference between the open interest for the front month of JULY. (1210) and the number of notices served upon today (315 x 5000 oz) equals the number of ounces standing.
.
Thus the INITIAL standings for silver for the JULY/2018 contract month: 4802(notices served so far)x 5000 oz + OI for front month of JULY(1210) -number of notices served upon today (315)x 5000 oz equals 28,485,000 oz of silver standing for the JULY contract month
WE GAINED 55 CONTRACTS OR AN ADDITIONAL 275,000 OZ WILL STAND AS THESE GUYS REFUSE TO MORPH INTO LONDON BASED FORWARDS AND RECEIVE A FIAT SWEETENER FOR THEIR EFFORTS.
PLEASE NOTE THE FOLLOWING FOR COMPARISON PURPOSES:
THE INITIAL STANDING FOR SILVER AT THE COMEX JULY 2017: 12.115 MILLION OZ ALTHOUGH AT MONTH’S END: 16.435 MILLION OZ. THIS COMPARES WITH TODAY’S INITIAL STANDING FOR SILVER OF 28.485 MILLION OZ.
As I stated yesterday:
“WHEN WE WITNESS THE AMOUNT OF PHYSICAL INCREASE IN THE AMOUNT STANDING AT THE COMEX AND ESPECIALLY COMMENCING ON DAY 2 OF THE DELIVERY CYCLE, YOU CAN BET THE FARM THAT THIS AMOUNT WILL INCREASE FROM THIS DAY FORTH UNTIL THE CONCLUSION OF THE MONTH OF JULY. THIS IS KNOWN AS QUEUE JUMPING AND THIS PHENOMENON HAS BEEN FRONT AND CENTRE OF OPERATIONS IN SILVER FOR NOW OVER 14 MONTHS. SILVER IS BEING SOUGHT BY COMMERCIALS OVER ON THIS SIDE OF THE POND AS DWINDLING SUPPLIES VACATE THE GLOBAL ARENA.”
queue jumping continues to intensify to the highest degree in silver as dealers scrounge around for dwindling supplies.
xxxxxxxxxxxxxxxxxxxxxxxxxxxxxxxxxxxxxxxxxxxxxxxxxxxxxxxxxxx
ESTIMATED VOLUME FOR TODAY: 57,615 CONTRACTS
CONFIRMED VOLUME FOR YESTERDAY: 92,531 CONTRACTS absolutely criminal
YESTERDAY’S CONFIRMED VOLUME OF 92,531 CONTRACTS EQUATES TO 462 million OZ OR 66.2% OF ANNUAL GLOBAL PRODUCTION OF SILVER
COMMODITY LAW SUGGESTS THAT OPEN INTEREST SHOULD NOT BE MORE THAN 3% OF ANNUAL GLOBAL PRODUCTION. THE CROOKS ARE SUPPLYING MASSIVE PAPER TRYING TO KEEP SILVER IN CHECK.
The record level of silver open interest is 234,787 contracts set on April 21./2017 with the price at that day at $18.42
The previous record was 224,540 contracts with the price at that time of $20.44
end
NPV for Sprott
1. Sprott silver fund (PSLV): NAV RISES TO -3.00% (JULY 6/2018)
2. Sprott gold fund (PHYS): premium to NAV FALLS TO -0.51% to NAV (JULY 6/2018 )
Note: Sprott silver trust back into NEGATIVE territory at -3.00%-/Sprott physical gold trust is back into NEGATIVE/
(courtesy Sprott/GATA)
3.SPROTT CEF.A FUND (FORMERLY CENTRAL FUND OF CANADA):
NAV 13.05/TRADING 12.54//DISCOUNT 3.89.
END
And now the Gold inventory at the GLD/
JULY 6/WITH GOLD DOWN $2.45: NO CHANGE IN GOLD INVENTORY AT THE GLD/INVENTORY RESTS AT 803.42 TONNES
JULY 5/WITH GOLD UP ANOTHER $5.15, THE CROOKS RAIDED THE COOKIE JAR AGAIN TO THE TUNE OF 5.89 TONNES/INVENTORY RESTS AT 803.42 TONNES IN THE LAST 10 TRADING DAYS GLD HAS LOST A HUGE 25.34 TONNES WITH A LOSS OF ONLY $15.25 IN PRICE
July 3/WITH GOLD UP $11.15/THE CROOKS RAIDED THE GLD INVENTORY AGAIN TO THE TUNE OF 9.73 TONNES/INVENTORY RESTS AT 809.31 TONNES
JULY 2/WITH GOLD DOWN $12.15, THE CROOKS RAIDED THE GLD INVENTORY AGAIN BY 1.47 TONNES DOWN./INVENTORY RESTS AT 819.04 TONNES
JUNE 29/WITH GOLD UP $3.70/A WITHDRAWAL OF 1.18 TONNES OF GOLD FROM THE GLD/INVENTORY RESTS AT 820.51 TONNES
JUNE 28/WITH GOLD DOWN $5.15/NO CHANGES IN GOLD INVENTORY AT THE GLD/INVENTORY RESTS AT 821.69 TONNES
June 27/WITH GOLD DOWN $3.60// TWO ENTRIES:/STRANGELY THE CROOKS RETURNED THE WITHDRAWAL OF 4.42 TONNES LAST NIGHT (THUS WE HAD A DEPOSIT OF 4.42 TONNES/INVENTORY RESTS AT 824.63 TONNES. /THEN LATE THIS AFTERNOON A WITHDRAWAL OF 2.94 TONNES
INVENTORY RESTS AT 821.69 TONNES/THIS VEHICLE IS AN OUTRIGHT FRAUD.
june 26/LATE LAST NIGHT, WITH GOLD DOWN $9.10 WE HAD A HUGE WITHDRAWAL OF 4.42 TONNES OF GOLD/INVENTORY RESTS AT 820.21 TONES
JUNE 25/WITH GOLD DOWN $1.45/NO CHANGE IN GOLD INVENTORY AT THE GLD.INVENTORY RESTS AT 824.63 TONNES
JUNE 22/WITH GOLD UP 25 CENTS TODAY, THE CROOKS WITHDREW A MASSIVE 4.13 TONNES OF GOLD/INVENTORY RESTS AT 824.63 TONNES
JUNE 21/WITH GOLD DOWN $4.00/NO CHANGES IN GOLD INVENTORY AT THE GLD/INVENTORY RESTS AT 828.76 TONNES
JUNE 20/WITH GOLD DOWN $3.55/NO CHANGES IN GOLD INVENTORY AT THE GLD/INVENTORY RESTS AT 828.76 TONNES
JUNE 19/WITH GOLD DOWN $1.50/NO CHANGES IN GOLD INVENTORY AT THE GLD/INVENTORY RESTS AT 828.76 TONES
JUNE 18/WITH GOLD UP $1.90/NO CHANGES IN GOLD INVENTORY AT THE GLD/INVENTORY RESTS AT 828.76 TONNES
JUNE 15/WITH GOLD DOWN $28.90/NO CHANGE IN GOLD INVENTORY AT THE GLD/INVENTORY RESTS AT 828.76 TONNES
JUNE 14/WITH GOLD UP $7.10/NO CHANGE IN GOLD INVENTORY AT THE GLD/INVENTORY RESTS AT 828.76 TONNES/
JUNE 13/WITH GOLD UP $2.20/NO CHANGE IN GOLD INVENTORY AT THE GLD/INVENTORY RESTS AT 828.76 TONNES
JUNE 12/WITH GOLD DOWN $4.75:NO CHANGE IN GOLD INVENTORY AT THE GLD/INVENTORY RESTS AT 828.76 TONNES
JUNE 11/WITH GOLD UP 65 CENTS/THE CROOKS RAIDED THE COOKIE JAR FOR 3.83 TONNES/INVENTORY RESTS AT 828.76 TONNES
JUNE 8/WITH GOLD DOWN 10 CENTS/NO CHANGE IN GOLD INVENTORY AT THE GLD/INVENTORY REMAINS AT 832.59 TONNES./
JUNE 7/WITH GOLD UP $1.45, THE CROOKS DECIDED TO RAID AGAIN THE GLD GOLD COOKIE JAR TO THE TUNE OF 3.54 TONNES/GOLD INVENTORY LOWERS TO 832.59 TONNES
JUNE 6/WITH GOLD UP $1.30 TODAY, WE HAD NO CHANGES IN GOLD INVENTORY AT THE GLD/INVENTORY RESTS AT 836.13 TONNES
JUNE 5/WITH GOLD UP $5.30 TODAY, WE HAD A TINY WITHDRAWAL OF .29 TONNES AND THAT NO DOUBT WAS TO PAY FOR FEES/836.13 TONNES
JUNE 4/WITH GOLD DOWN ONLY $2.50, THE CROOKS UNLEASHED A MASSIVE WITHDRAWAL OF 10.61 TONNES OF GOLD FROM THE GLD/INVENTORY RESTS AT 836.42 TONNES
JUNE 1/WITH GOLD DOWN $5.10 TODAY, A HUGE 4.42 TONNES OF GOLD WAS WITHDRAWN FROM THE GLD AND THIS WAS USED IN THE RAID TODAY/INVENTORY RESTS AT 847.03 TONNES
xxxxxxxxxxxxxxxxxxxxxxxxxxxxxxxxxx
JULY 6/2018/ Inventory rests tonight at 803.42 tonnes
*IN LAST 407 TRADING DAYS: 123,17 NET TONNES HAVE BEEN REMOVED FROM THE GLD
*LAST 357 TRADING DAYS: A NET 33.15 TONNES HAVE NOW BEEN ADDED INTO GLD INVENTORY.
end
Now the SLV Inventory/
JULY 6/WITH SILVER DOWN 2 CENTS/NO CHANGE IN SILVER INVENTORY AT THE SLV/INVENTORY RESTS AT 824.305 MILLION OZ/
JULY 5/WITH SILVER UP 6 CENTS, A GOOD CHANGE IN SILVER INVENTORY AT THE SLV: A DEPOSIT OF 470,000 OZ/INVENTORY RESTS AT 324.305 MILLION OZ/ FOR THE PAST 10 TRADING DAYS, SILVER INVENTORY HAS ADVANCED BY 4.945 MILLION OZ WITH A LOSS OF 33 CENTS/PLEASE COMPARE THIS WITH THE GLD.
JULY 3/WITH SILVER UP 17 CENTS, A HUGE DEPOSIT OF 1.37 MILLION OZ ADDED TO THE SLV/INVENTORY RESTS AT 323.835 MILLION OZ.
JULY 2/WITH SILVER DOWN 31 CENTS/A HUGE 2.070 MILLION OZ DEPOSIT AT THE SLV/INVENTORY RESTS AT 322.465 MILLION OZ/
JUNE 29/WITH SILVER UP 14 CENTS TODAY, NO CHANGES IN SILVER INVENTORY AT THE SLV/INVENTORY RESTS THIS WEEKEND AT 320.395 MILLION OZ/
JUNE 28/WITH SILVER DOWN 18 CENTS, THE CROOKS ADDED 1.035 MILLION OZ OF SILVER INTO THE SLV/INVENTORY RESTS AT 320.395 MILLION OZ
JUNE 27.2018/WITH SILVER DOWN 8 CENTS/NO CHANGE IN SILVER INVENTORY/INVENTORY RESTS AT 819.360 MILLION OZ/
june 26./2018/WITH SILVER DOWN 8 CENTS, THE CROOKS WITHDREW THE DEPOSIT OF TWO DAYS AGO; 941,000 OZ OUT OF INVENTORY/INVENTORY RESTS AT 819.360 OZ
JUNE 25/WITH SILVER DOWN 12 CENTS/NO CHANGES IN SILVER INVENTORY AT THE SLV/INVENTORY RESTS AT 320.301 MILLION OZ/
JUNE 22/WITH SILVER UP 12 CENTS TODAY,ANOTHER BIG CHANGE IN SILVER INVENTORY AT THE SLV” A DEPOSIT OF 941,000 OZ INTO INVENTORY/INVENTORY RESTS THIS WEEKEND AT 320.301 MILLION OZ/
JUNE 21/WITH SILVER UP ONE CENT/ANOTHER CHANGE IN SILVER INVENTORY AT THE SLV/: A DEPOSIT OF 2.918 MILLION OZ/INVENTORY RESTS AT 319.360 MILLION OZ/ THUS FOR TWO STRAIGHT DAYS A TOTAL OF 5.26 MILLION OZ OF SILVER HAS BEEN ADDED WITH NO CHANGE IN PRICE.
JUNE 20/WITH SILVER DOWN ONE CENT/A HUGE CHANGE IN SILVER INVENTORY AT THE SLV/INVENTORY / A DEPOSIT OF 2.35 MILLION OZ/INVENTORY RESTS AT 316.442 MILLION OZ/
JUNE 19/2018/WITH SILVER DOWN 11 CENTS/NO CHANGE IN SILVER INVENTORY AT THE SLV/INVENTORY RESTS AT 314.090 MILLION OZ/
JUNE 18/WITH SILVER DOWN 6 CENTS TODAY/NO CHANGE IN SILVER INVENTORY/INVENTORY RESTS AT 314.090 MILLION OZ/
JUNE 15/WITH SILVER DOWN 75 CENTS/A BIG CHANGE IN SILVER INVENTORY AT THE SLV: A WITHDRAWAL OF 1.788 MILLION OZ//INVENTORY RESTS AT 314.090 MILLION OZ
JUNE 14/WITH SILVER UP 30 CENTS, THE CROOKS DECIDED THAT THEY NEEDED SILVER INVENTORY BADLY SO THEY RAID THE SLV OF 1.412 MILLION OZ/INVENTORY RESTS AT 315.878 MILLION OZ/
JUNE 13/WITH SILVER UP 11 CENTS TODAY/NO CHANGES IN SILVER INVENTORY AT THE SLV/INVENTORY RESTS AT 317.290 MILLION OZ/
JUNE 12/WITH SILVER DOWN 5 CENTS/A HUGE CHANGES IN SILVER INVENTORY AT THE SLV/ THE CROOKS RAID THE SILVER COOKIE JAR BY 1.976 MILLION OZ/INVENTORY LOWERS TO 317.290 MILLION OZ/
jUNE 11/NO CHANGE IN SILVER INVENTORY/319.266 MILLION OZ
JUNE 8/WITH SILVER DOWN 5 CENTS/A HUGE CHANGE IN SILVER INVENTORY AT THE SLV: A WITHDRAWAL OF 1.412 MILLION OZ//INVENTORY LOWERS TO 319.266 MILLION OZ/
JUNE 7/WITH SILVER UP ANOTHER 12 CENTS/A HUGE CHANGE IN SILVER INVENTORY AT THE SL: A WITHDRAWAL OF 1.883 MILLION OZ WITH ALL OF THAT SILVER DEMAND//INVENTORY RESTS AT 320.678 MILLION OZ/
JUNE 6/WITH SILVER UP 14 CENTS TODAY/NO CHANGE IN SILVER INVENTORY AT THE SLV/INVENTORY RESTS AT 322.561 MILLION OZ/
JUNE 5/WITH SILVER UP 10 CENTS NO CHANGE IN SILVER INVENTORY/INVENTORY RESTS AT 322.561 MILLION OZ
JUNE 4/WITH SILVER DOWN 1 CENTA SMALL CHANGE IN SILVER INVENTORY AT THE SLV: A DEPOSIT OF 522,000 OZ INTO THE SLV/.INVENTORY RISES AT 322.561 MILLION OZ/
JUNE 1/WITH SILVER DOWN 3 CENTS/NO CHANGE IN SILVER INVENTORY AT THE SLV/INVENTORY REMAINS AT 322.039 MILLION OZ/
JULY 6/2018:
Inventory 324.305 MILLION OZ
6 Month MM GOFO 2.04/ and libor 6 month duration 2.52
Indicative gold forward offer rate for a 6 month duration/calculation:
G0FO+ 2.04%
libor 2.52 FOR 6 MONTHS/
GOLD LENDING RATE: .48%
XXXXXXXX
12 Month MM GOFO
+ 2.78%
LIBOR FOR 12 MONTH DURATION: 2.48
GOFO = LIBOR – GOLD LENDING RATE
GOLD LENDING RATE = +.30
end
Major gold/silver trading /commentaries for FRIDAY
GOLDCORE/BLOG/MARK O’BYRNE.
“No Gold Ever Leaves China … They Are
Hoarding It and Russia Is Buying It”
– U.S. China trade war escalates as Russia stockpiles gold on the Keiser Report
– Trump’s erratic and risky trade policies pose a risk to dollar as reserve currency
– China, Russia “getting cosier” with Silk Road and increasing economic cooperation
– China and Russia “want to do business outside of the dollar” and “dollar will finally reach its comeuppance”
– “No gold ever leaves China … they are hoarding it and Russia is buying it”
– Makes sense to be “accumulating lots of gold”
In this final episode of the Keiser Report from Paris, France, Max and Stacy discuss if a genuine trade war has erupted between China and the U.S. and look at nations, including Russia, stockpiling gold and also cover our recent market update (June 21): Russia Buys 600,000 oz Of Gold In May After Dumping Half Of US Treasuries In April

In the second half, Max continues his interview with French journalist, Pierre Jovanovic, of Quotidien.com about the economic situation and France and political crisis in Europe.
The entire show is well worth a watch and commentary regarding the recent developments with Russia, China, US Treasuries, the dollar and gold can be watched from the start until 13.11 minute.
Full interview on Keiser Report here

Goldnomics Podcast – Listen and subscribe on YouTube, ITunes, Soundcloud or Blubrry
News and Commentary
Bloomberg Live Now: China-U.S. Trade War Kicks Off (Bloomberg.com)
Stocks Mixed as U.S. Tariffs Kick In; Havens Flat (Bloomberg.com)
Gold’s allure has been damaged by strengthening greenback for now (Bloomberg.com)
Gold ends higher for a 2nd session, slips in electronic trade after Fed minutes (MarketWatch.com)
Gold Is ‘Invaluable’ To Technology Sector, Higher Metal Demand Inevitable — WGC (MiningReview.com)
Source: Forbes
U.S. China Trade War as Russia Stockpiles Gold – GoldCore on Keiser Report (RT.com)
Inflation Is Back, Part 8: Labor Shortage Reaches “Critical” Point (DollarCollapse.com)
Unfunded Promises (MauldinEconomics.com)
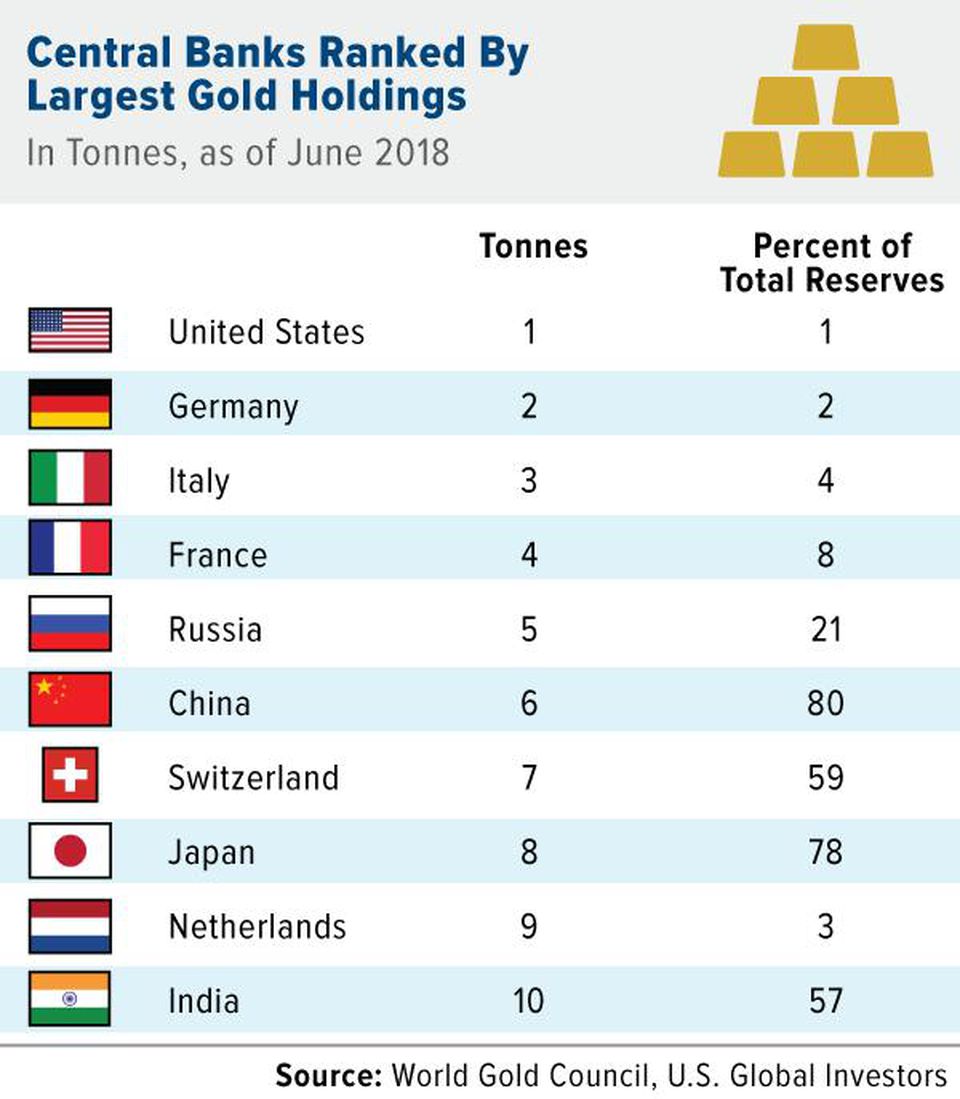
Top 10 Countries With Largest Gold Reserves (Forbes.com)
The vital role of gold in technology (Gold.org)
Time to Buy Gold for a Trade (Investopedia.com)
Listen on SoundCloud , Blubrry & iTunes. Watch on YouTube below

Gold Prices (LBMA AM)
05 Jul: USD 1,252.50, GBP 946.89 & EUR 1,071.64 per ounce
04 Jul: USD 1,256.90, GBP 951.47 & EUR 1,079.80 per ounce
03 Jul: USD 1,245.85, GBP 944.85 & EUR 1,068.81 per ounce
02 Jul: USD 1,249.00, GBP 948.87 & EUR 1,072.39 per ounce
29 Jun: USD 1,250.55, GBP 950.29 & EUR 1,073.85 per ounce
28 Jun: USD 1,250.50, GBP 955.26 & EUR 1,081.68 per ounce
27 Jun: USD 1,256.80, GBP 951.40 & EUR 1,079.97 per ounce
Silver Prices (LBMA)
05 Jul: USD 15.95, GBP 12.04 & EUR 13.65 per ounce
04 Jul: USD 16.05, GBP 12.15 & EUR 13.78 per ounce
03 Jul: USD 15.93, GBP 12.08 & EUR 13.68 per ounce
02 Jul: USD 15.98, GBP 12.14 & EUR 13.73 per ounce
29 Jun: USD 16.03, GBP 12.20 & EUR 13.77 per ounce
28 Jun: USD 16.11, GBP 12.30 & EUR 13.90 per ounce
27 Jun: USD 16.21, GBP 12.27 & EUR 13.93 per ounce
Recent Market Updates
– Irish Gold Money Rings Found – Mystery Surrounds What May Be Ancient, Pre-Historic Currency
– Gold $10,000 In Currency Reset? Russia, China Gold Demand To Overwhelm Gold Futures Manipulation (GOLDCORE VIDEO)
– Italian Debt – A Financial Disaster Waiting To Happen
– As The Currency Reset Begins – Get Gold As It Is “Where The Whole World Is Heading”
– Buy Gold Or Bitcoin As The “Liquidity Party” Is Ending?
– Why Russia and Turkey Diversifying Into Gold May Signal A Bigger Global Shift
– London House Prices Fall 1.9% In Quarter – Bubble Bursting?
– Gold Exports To London From U.S. Surge 152% In 2018
– Manipulation of Gold & Silver by Bullion Banks Is “Undeniable”
– “Perfect Environment For Gold” As Fed Will Weaken Dollar and Create Inflation – Rickards
– Russia Buys 600,000 oz Of Gold In May After Dumping Half Of US Treasuries In April
– In Gold, Silver and Bitcoin We Trust? Goldnomics Podcast with Ronald-Peter Stoeferle
– Own A “Bit Of Gold” As We Are Moving Ever Closer To A Trade War
– Bitcoin Price To $0 Or $1 Million In One Year? MoneyConf 2018 Poll
– Cashless Society – Good or Bad? MoneyConf 2018 Video
– Do We Still Need Banks In The Age Of Fintech?

ANDREW MAGUIRE’S KINESIS WHICH IS A”BITCOIN’ BACKED 100% BY ALLOCATED GOLD AND SILVER
Andrew Maguire’s Kinesis money which is a “bitcoin” but backed 100% by allocated gold and silver is set to go.
it think it would be a great idea to look at this!
please read at: https://kinesis.money/#/
(Andrew Maguire)
|
|
Dear Harvey Organ,
Thank you for your participation in our webinar on June 7th with our host and CEO of Kinesis, Thomas Coughlin.
The response we received has been incredible, we appreciate you taking the time to join us and hope you found it to be beneficial.
Due to such a high influx of questions we received we were unable to have them all answered. Nevertheless, if there was anything which requires more clarification, or you have a query which needs to be rectified, we invite you to join our telegram group:
We apologize for the technical issues we incurred during the webinar which resulted in it running a little over schedule, we hope that the next one we host will run seamlessly.
A video has been put together and uploaded onto our YouTube channel which can be found here:
Please share and subscribe to our YouTube channel to be notified of all the latest videos as they become available.
The rapid growth that we are currently experiencing has been incredible and with your support, is only going to get better.
We are working behind the scenes very hard to create a better experience for everyone involved! Stay tuned in as we have many more announcements to be released in the upcoming days.
Kind Regards,
 |
Kinesis Money
a:C/O ILS Fiduciaries (IOM) Limited, First Floor,Millennium House, Victoria Road, Douglas, Isle of Man IM2 4RW
   |
The following is self explanatory
(courtesy GATA/Chris Powell and Harvey Organ)
GATA asks bank regulator to check risks of gold
futures maneuver
Submitted by cpowell on Sun, 2018-06-10 16:17. Section: Daily Dispatches
12:21p ET Sunday, June 10, 2018
Dear Friend of GATA and Gold:
GATA has appealed to the U.S. comptroller of the currency, who has regulatory authority over banks, to review financial risks certain banks may have incurred through derivatives in the monetary metals markets, particularly through the recent heavy use of the “exchange for physicals” mechanism of settling gold and silver futures contracts on the New York Commodities Exchange.
The appeal was made in a letter sent May 5 to the comptroller, Joseph M. Otting, whose office is part of the U.S. Treasury Department, by your secretary/treasurer and GATA futures market consultant Harvey Organ.
“Exchange for physical” settlements of futures contracts long were considered emergency procedures when a seller was not able to deliver metal from an exchange-approved warehouse and wanted to settle with delivery elsewhere. But now such settlements appear to constitute most gold and silver futures settlements on the Comex. It is a strange development that appears to have been necessitated by the increasing difficulties of central banking’s gold and silver price suppression policy.
GATA has received no acknowledgment of the letter. Its text is below and a PDF copy of it is here:
http://www.gata.org/files/ComptrollerOfCurrencyLetter.pdf
CHRIS POWELL, Secretary/Treasurer
Gold Anti-Trust Action Committee Inc.
CPowell@GATA.org
* * *
May 5, 2018
Joseph M. Otting, Comptroller of the Currency
U.S. Treasury Department
400 7th Street, SW
Washington DC 20219
Dear Comptroller Otting:
Please let us bring to your attention financial risks to major banks involving their possibly unreported exposure to derivatives in the monetary metals markets.
In recent months gold and silver future contracts issued by U.S. banks on the New York Commodities Exchange have been moved off-exchange for delivery through a mechanism known as “exchange for physical” (EFP) contracts. Until recently use of this mechanism was considered an emergency procedure when a seller did not have access to metal for delivery through Comex warehouses. Now the mechanism seems to be in use for a large share of front-month contracts for which delivery is sought.
Here is an example that is happening at the Comex in the front active month of April for gold and the inactive delivery month of April for silver.
In gold, there were 229,436 EFP contracts for 713.64 tonnes, an average of 10,925 contracts and 1,092,500 ounces per trading day.
In silver, there were 77,150 EFP contracts for 385,750,000 ounces, an average of 3,673 contracts and 18,369,000 ounces per trading day.
London Bullion Market Association rules suggest that these contracts may not be reported to regulators. The LBMA’s bylaws say:
“Figures above exclude any contracts not subject to risk-based capital requirements, such as FX contracts with an original maturity of 14 days or less, futures contracts, written options, and basis swaps. Therefore, the total notional amount of derivatives by maturity will not add to the total derivatives figure in this table.”
We are told that these EFP contracts are transferred from the Comex to London as what are called “serial forwards” and their duration is always less than 14 days, which exempts them from being reported.
It is our understanding that in each quarter your office prepares a report detailing risk undertaken by the banks under the comptroller’s supervision.
These risks include derivatives undertaken by U.S. banks and other obligations that may cause a bank to fail. Our concern is that your office may not be aware of large unreported derivative exposure by banks.
Could you review this matter and let us know your conclusions?
Sincerely,
CHRIS POWELL
Secretary/Treasurer
HARVEY ORGAN
Consultant
Gold Anti-Trust Action Committee Inc.
7 Villa Louisa Road
Manchester, Connecticut 06043-7541
END
Alasdair comments on the true rate of inflation and it is rearing its ugly head throughout the globe
(courtesy Alasdair Macleod/GATA)
Inflation Rearing Its Ugly Head
The world of finance and investment, as always, faces many uncertainties. The US economy is booming, say some, and others warn that money supply growth has slowed, raising fears of impending deflation. We fret about the banks, with a well-known systemically-important European name in difficulties. We worry about the disintegration of the Eurozone, with record imbalances and a significant member, Italy, digging in its heels. China’s stock market, we are told, is now officially in bear market territory. Will others follow? But there is one thing that’s so far been widely ignored and that’s inflation.
More correctly, it is the officially recorded rate of increase in prices that’s been ignored. Inflation proper has already occurred through the expansion of the quantity of money and credit following the Lehman crisis ten years ago. The rate of expansion of money and credit has now slowed and that is what now causes concern to the monetarists. But it is what happens to prices that should concern us, because an increase in price inflation violates the stated targets of the Fed. An increase in the general level of prices is confirmation that the purchasing power of a currency is sliding.
According to the official inflation rate, the US’s CPI-U, it is already running significantly above target at 2.8% as of May. Oil prices are rising. Brent (which my colleague Stefan Wieler tells me sets gasoline and diesel prices) is now nearly $80 a barrel. That has risen 62% since last June. If the US economy continues to grow the Fed will have to put up interest rates to slow things down. If it doesn’t, as money-supply followers fear, the Fed may still be forced to put up interest rates to contain price inflation.
It is too simplistic to argue that a slowing of money supply growth removes the inflation threat. In this article, I explain why, and postulate that the next credit crisis will be the beginning of the end for unbacked fiat currencies.
The fictions behind price inflation
The CPI-U statistic is an attempt to measure changes in the general price level, defined as the price of a basket of goods and services purchased by urban consumers. The concept is flawed from the outset, because it is trying to measure the unmeasurable. Its mythical Mr or Mrs Average doesn’t exist. Not only is the general price level different for each individual and household, but you cannot ignore different classes, professions, locations, cultural and personal preferences, and assume they can be averaged into something meaningful. We can talk vaguely about the general level of prices, but that does not mean it can or should be measured. Averaging is simply an inappropriate construction abused by mathematical economists.
There is also a fundamental and important dynamic issue, ignored by economic statisticians. You cannot capture economic progress with statistics, let alone averages. The ever-present change in the human condition is the result of an unquantifiable interaction between consumers and producers. What a consumer bought several months ago, which is the basis for statistical information, can be no more than an historical curiosity. It does not tell us what he or she is buying today or will buy tomorrow. Nor can the statisticians possibly make the value judgements that lead consumers to switch brands or buy different things altogether. In short, even if there was a theoretically justifiable price index, it measures the wrong thing.
The statisticians are simply peddling a myth, which leaves it wide open to abuse. The myth-makers, so long as the myths are believed, control the narrative. It is in the interests of the statisticians’ paymasters, the state, to see price inflation under-recorded, so it should be no surprise that independent attempts to record price inflation put it far higher.
Independent estimates suggest that a price inflation rate of around 10%, depending on the urban location, is a more truthful assessment.[i] If this was officially admitted, the continuing impoverishment of the ordinary American would be exposed, because the GDP deflator would be large enough to record an economy continually contracting in real terms. And this appears to have been the situation since the Lehman crisis, as well as in many of the years preceding it.
You cannot, year in year out, take wealth away from consumers without crippling the economy. A continual economic contraction, which is the inevitable result of monetary debasement. It can never be officially admitted, least of all by the Fed, which has total responsibility for the currency and the banking system. The Fed does not produce official price inflation estimates, which is the responsibility of the Bureau of Economic Affairs, so the Fed conveniently hides behind another government department.
But if the Fed did admit to this statistical cover-up, what could it do? The whole concept of monetary stimulation would quickly unravel, and the debate would almost certainly move away from policies that rely on monetary smoke and mirrors towards the reintroduction of sound money. The Fed would be out of a job.
However, the government now depends on inflationary financing to cover persistent budget deficits, if not directly, then indirectly through the expansion of bank credit to finance the acquisition of government bonds. In the short term, President Trump has made things worse by raising the budget deficit even further, which will be financed through more monetary inflation. And in the long term the obligations of increasing welfare costs will ensure accelerating monetary inflation ad infinitum is required to pay the government’s excess spending.
So, we can say with confidence that the purpose of monetary policy has quietly changed from what is commonly stated, that is to foster the health of the US economy. Instead it is to ensure government spending can proceed without interruption and without asking the people’s representatives permission to raise taxes.
Supply-side and time factors
The conventional neo-Keynesian view of price inflation is that rising prices are driven by excess demand. In other words, an economy that grows too fast leads to increasing demand for the factors of production.
This approach wrongly plays down the role of money. If the quantity of money is fixed, the increased demand for some factors of production can only be met by reduced demand for other factors of production. If the quantity of money and credit is increased the redistribution of factors of production is impaired, and common factors are bid up to the extent the extra money is available. The source of higher prices is clearly the extra money.
When a central bank, like the Fed, creates money and encourages the expansion of credit, it takes time for this extra money to work through the system. It is deployed initially in the financial, as opposed to the productive side of the economy. This is because monetary inflation is initially directed at the banks to stabilise their balance sheets. And once the immediate crisis is passed, the banks continue to extend credit to the government at suppressed interest rates by buying its bonds. Suppressed interest rates and therefore bond yields lead to a bull market in equities, encouraging credit-backed speculation. Bank credit is then increasingly extended to businesses and also to consumers through credit card and mortgage debt. At this point, price inflation then begins to be a problem.
The eighteenth-century banker and economist Richard Cantillon was the first to describe how the new money gradually disperses through the economy, raising prices in its wake. To his analysis we must in modern times add the course it takes through financial markets to impact the non-financial economy.
The time taken for new money and credit to be absorbed into the economy governs the length of the period that separates successive credit crises. Cantillon also made the central point that the gainers are those that get the new money to spend first, while the losers are those who find prices have risen before they get their hands on the new money. In effect, wealth is transferred from the latter to the former.
This wealth transfer benefits the government, the banks, and the banks’ favoured customers through the transfer of wealth from mostly blue-collar workers, the unemployed, retirees and those on fixed wages. The self-serving nature of the Cantillon effect is bound to influence monetary policy-makers in their understanding of the effects of their monetary policies. Blinded by self-interest and the interests of those near to them, they fail to understand exactly how the creation of extra money actually creates widespread poverty.
Monetary creation manifestly benefits the parties that control and advise the Fed, giving it and its epigones the rosy glow of institutional comfort and superiority. Everyone around it parties on the new money. And the licences to create it out of thin air given to the commercial banks are exploited by them to the full. They are temperamentally opposed to withdrawing the stimulus. It is hardly surprising the neo-Keynesians, with their flexible economic beliefs, no longer believe in only stimulating the economy to bring it out of recession. Instead they continue to stimulate it into the next credit crisis, as the ECB and the Bank of Japan currently illustrate, because everyone in the monetary establish wants the party to continue.
The link between monetary inflation and prices
There is no mathematical formula for the link between monetary inflation and prices. For modern economists, it comes down to their fluid mainstream opinion. Milton Friedman famously said, “Inflation is always and everywhere a monetary phenomenon”, but not everyone shares his conclusion. Central bankers note Friedman’s dictum but ignore it in favour of their ad hoc interpretation of the effects of monetary policy. The result is that in the absence of a sound understanding of the relationship between money, prices and asset prices, they always end up shutting stable doors after a new financial crisis overwhelms them.
It is a policy that always fails. Central bankers think the difficulty arises in the private sector, so they address what they see as evolving market-related risks. They fail fully to understand it emanates from their own monetary policies. Besides going against the grain of their own vested interests, convincing central bankers otherwise is made doubly difficult because there is no empirical proof that links the quantity of money in circulation with prices.
Logically, Friedman was correct. If you have more money chasing the same quantity of goods, its purchasing power will fall. That was the lesson of sound money, when it was beyond the reach of government creation and interference. The purchasing power of both sound and unsound money also vary due to changes in the general level of liquidity desired by consumers.
However, widespread use of sound money, gold or silver, also ensured that the price effect of changes in a localised desire for monetary liquidity were minimised through price arbitrage, so in those circumstances, the relationship between the quantity of money and the general price level was plain to see and unarguable. Unbacked national currencies do not share this characteristic, and their purchasing power is dependent only partly on changes in their quantity, being hostage to consumers’ collective desire to hold their own state’s legal tender. In other words, if consumers collectively reject their government’s currency, it loses all value as a medium of exchange.
In effect, there are two vectors at work, changes in the quantity and changes in the desire to hold currency. They can work in opposition, or together. Given the quantities of new currency and credit issued since the Lehman crisis, there appears to be a degree of cancelling out between the two forces, with the effects of a dramatic increase in the quantity of money being partially offset by a willingness to hold larger balances. The result is the dollar’s purchasing power has not fallen as much as might be expected, though as was discussed earlier in this article, the fall in the dollar’s purchasing power has been significantly greater than official inflation figures admit.
It is very likely that people and businesses in the US have been persuaded to hold onto cash balances and deposits at the banks by misleading official inflation figures. If the authorities had admitted to rates of price inflation are closer to the figures from Shadowstats and the Chapwood index, consumer behaviour would probably have been markedly different, with consumers reducing their exposure to a more obviously declining dollar.
In that event, both the effect of a massively increased supply of broad money combined with falling public confidence in the currency would almost certainly have worked together to rapidly undermine the dollar’s purchasing power. All experience tells us that unless a loss of confidence in the currency is nipped in the bud by a pre-emptive and significant increase in interest rates, a currency’s descent towards destruction can rapidly escalate. Doing it too late or not enough merely undermines confidence even more.
The issue of confidence poses yet another problem for the Fed. The extent to which currency values depend on misleading statistics represents a great and growing danger for future monetary policy, when statistical manipulation by the state is finally revealed to the disgust of the general public.
The dollar has nowhere to hide in the next credit crisis
The history of successive credit cycles shows that the general level of prices rises as a result of earlier monetary expansion. Inevitably, a central bank is belatedly forced to raise its interest rates, because the market demands it does so by no longer accepting the suppression of time-preference values.[ii]
Higher interest rates expose the miscalculations of the business community as a whole in their individual assessments for allocating capital. A slump in business activity ensues, and the banks, which are highly-geared intermediaries between lenders and borrowers, rapidly become insolvent. A credit crisis then swiftly develops into a systemic crisis for the banking system.
In the past, the encashment of bank deposits has been the way in which individuals tried to protect themselves from a bank’s insolvency. This created a demand for physical cash, which helped support the currency’s value through the systemic crisis. However, this prop for confidence in the currency in a crisis has now been effectively removed.
Central banks regard the right of the general public to encash their deposits as a hinderance to their attempts to stop banks failing. Since the 1990s, governments have gradually restricted public ownership of cash, accusing cash hoarders of criminal activities and tax evasion. More recently, they have moved towards banning cash altogether, assisted by the spread of contactless cards and other forms of electronic transfer.
The removal of the physical cash alternative forces a worried depositor to redeposit money from his bank into another bank he deems safer. The central bank can compensate for the loss of deposits in a bank which has lost its depositors’ confidence by recycling the surplus deposits accumulating in the other banks. It allows the central bank to rescue ailing banks behind closed doors, instead of having to deal with the contagious loss of public confidence that goes with an old-fashioned run on a bank. That is probably the overriding reason why central banks want to do away with cash.
Now let us make the reasonable assumption that the next credit crisis is worse than the last: that is, after all, the established trend. An ordinary saver is locked into the system and unable to demand cash to escape the risk of being a creditor to his bank and the banking system generally. His only remedy is to reduce his exposure to bank deposits by buying something, thereby giving the systemic and currency headaches to someone else. It is easy to envisage a situation where the marginal sellers of a currency held in bank deposits drive its purchasing power rapidly lower. All that is needed is an absence of buyers, or put another way, a reluctance to sell assets seen as preferred to owning the currency.
But what is safe to buy? Failing business models mean that non-financial assets fall in value and residential property prices, which are set by the interest cost and availability of mortgages, are likely to be in a state of collapse, at least initially. Equities will reflect these collapsing values as well. Government bonds are a traditional safe-haven asset, but government finances are certain to face a crisis with budget deficits rocketing out of control.
Prescient investors and savers are likely to anticipate these dangers in advance of the credit crisis itself and take avoiding action. That is how markets function. Now that the cash alternative has been effectively closed down, the only assets for which deposits are likely to be encashed in advance of the crisis are precious metals and cryptocurrencies. Therefore, it seems likely that safe-haven demand escaping falling currencies will initially benefit these asset classes. They will be, as the cliché has it, the canary in the coal mine.
Are we heading for the last conventional credit crisis?
This article has highlighted the deceitfulness of official US price statistics, and the way they have been used to fool both markets and consumers. The Fed’s monetary policies are founded on quicksand and could face a different set of challenges from the last credit crisis: a general loss of public confidence in the Fed itself.
In the Lehman crisis, we looked to the Fed to rescue us from a complete systemic collapse. It succeeded by doubling base money in a year from September 2008, eventually increasing it nearly five times over the following five years. The fiat money quantity (FMQ), which includes all dollar fiat money and credit (both in circulation and reserves), increased threefold from $5.4 trillion to $15.6 trillion. These are measures of the massive monetary expansion, whose price effects have been successfully concealed by official statistics. The whole process of rescuing the economy from the last banking crisis and making it appear to recover has been a truly extraordinary deception.
When one stops admiring the undoubted skill the monetary authorities have displayed in managing all our expectations, there are bound to be doubts. The Fed appears to be normalising its balance sheet, presumably so it can do it all over again. But the ratio of FMQ to GDP was 33% in 2007 before the Lehman crisis, and is at a staggering 80% today. On any measure, we are moving towards the next credit crisis with far too many dollars in issue relative to the size of the US economy.
When the next credit crisis hits us, the Fed is likely to find it impossible to expand its balance sheet and support both the banks and the government’s finances through QE in the way it did last time, without undermining the purchasing power of the dollar. A crisis that is demonstrably caused by an unbearable burden of debt cannot continually be resolved by offering yet more credit. Last time it worked without undermining the currency, next time we cannot be so sure. But the Fed has no other remedy.
The next credit crisis could therefore be the last faced by today’s fiat currency and banking system, if the debasement of currency required to prevent a debt meltdown brings forward the destruction of the dollar and all other currencies that are linked to it. The credit cycle will therefore cease. We should shed no tears for its ending, but our rejoicing must be ameliorated by the political and economic consequences that follow.
The end of fiat money may not happen immediately, because the general public can be expected to hang on to the fond illusion their dollars will always be valid as a medium of exchange before finally abandoning all hope for it. That has been the experience of documented inflations in the fiat currency age, from the European hyperinflations in the early 1920s onwards. And since all currencies are in the same unbacked fiat-currency boat, the purchasing power for them is likely to collapse as well, unless individual central banks introduce credible gold convertibility.
We have well-documented individual monetary collapses, even regional ones such as those that followed after the First World War in Europe. In Austria it ended four years after the war, in Germany five. But a transcontinental monetary crisis leading to the end of the global fiat currency regime takes us all into unknown territory, whose timing and progression, if it occurs, is hard to estimate.
My best guess for the timing of the next credit crisis remains later this year, perhaps the first half of 2019 at the latest. The short time that is left is the consequence of the enormous monetary debasement throughout the credit cycle not just in the US but globally as well. And the small amount of headroom for interest rates before the crisis is triggered, due to the accumulation of unproductive debt since the last crisis.
Total fiat currency destruction should take at least a further year or two, perhaps three from there. But first things first: the current phase of the credit cycle must evolve into a credit crisis before we can feel our way through its developing consequences.
[i] See Shadowstats.com, 1980 series, and chapwoodindex.com.
[ii] Time preference is the difference between immediate possession of a good and the promise of its future possession and is the basis behind interest rates when set by free markets.
end
SGE withdrawals are a good measure of gold demand coming from China. In the first half of the year 1,000 tonnes of gold was withdrawn = demand. China mines about 420 tonnes a year so if you exclude 220 tonnes (420/2) we have citizen demand of 780 tonnes. per half year. China’s 420 tonnes goes straight to the banks but for the past two years, China has not announced an increase in their sovereign holdings. You can bet the farm that they will announce a huge increase in their holdings.
(courtesy Lawrie Williams)
LAWRIE WILLIAMS: China H1 gold demand exceeds 1,000 tonnes
Despite a slightly lower figure for June Shanghai Gold Exchange (SGE) gold withdrawals this year compared with last, year to date figures remain in excess of those at ths same time last year and have already exceeded the 1,000 tonne mark, the first time in four years that they have achieved this level by this time. Given that gold movements in and out of the SGE tend to be higher in the second half of the year, the world’s largest absorber of physical gold is well on track to maintain that position and perhaps again heading for an annual total of well over 2,000 tonnes (or equivalent to around two thirds of total global new mined gold production. With Indian consumption flat at best so far this year, the Chinese figure becomes increasingly important in terms of global supply and demand.
Table: SGE Monthly Gold Withdrawals (Tonnes)
| Month | 2018 | 2017 | 2016 | % change 2017-2018 | % change 2016- 2018 |
| January | 223.58 | 184.41 | 225.08 | +21.2% | -0.7% |
| February* | 118.42 | 148.24 | 107.60 | -20.1% | +10.7% |
| March | 192.61 | 192.25 | 183.24 | +0.2% | +5.1% |
| April | 212.65 | 165.78 | 171.40 | +28.3% | +24.07% |
| May | 150.58 | 138.08 | 147.28 | +9.1% | +2.2% |
| June | 140.59 | 155.51 | 138.51 | -9.6% | +1.5% |
| July | 144.71 | 117.58 | |||
| August | 161.41 | 144.44 | |||
| September | 214.24 | 170.90 | |||
| October | 151.54 | 153.25 | |||
| November | 189.10 | 214.72 | |||
| December | 185.21 | 196.37 | |||
| Year to date | 1040.24 | 984.34 | 973.11 | + 5.58% |
+6.90% |
| Full Year | 2,030.48 | 1,970.37 |
Source: Shanghai Gold Exchange. Lawrieongold.com
China remains the world’s largest gold producer by a fairly large margin over second placed Australia and third placed Russia, both of which are seen to be increasing annual physical gold output – see: World Top 20 Gold producing nations in 2017 – not peak gold yet! China’s own production appears to be falling so, in order to maintain its apparent demand levels it will need to import more gold this year than last so import figures, particularly from Hong Kong, Switzerland, the U.K., the U.S. and Australia, all of which break down their gold exports by destination nation, will need to be monitored closely to pick up the trends.
So are SGE gold withdrawals a good representation of total Chinese gold demand. We think so in that the figures are far closer to the sums of known Chinese imports plus China’s own gold output plus an allowance for scrap supply than the much lower gold demand figures estimated by the various majoe gold consultancies which tend to utilise far more restricted parameters for what they see as consumption. They appear to ignore, for example, imports by the banks and other entities utilised in domestic financial transactions, thus the SGE gold withdrawal figures would appear to be far closer to actual gold flows into mainland China than other measures.
06 Jul 2018
-END-‘
My good friend Andrew Maguire reports through Kingworldnews that German banks and Swiss banks are refusing to give their clients gold which is held in unallocated form. This is a huge signal to many as they will now try to retrieve their unallocated gold and place it in allocated form in an independent vault.
Trouble ahead for our banks who have huge obligations and cannot deliver..
(courtesy Andrew Maguire/Kingworldnews)
MAJOR ALERT: Andrew Maguire Says Major
German Bank Just Refused To Hand Over Client’s
Physical Gold
It’s happened again. London whistleblower Andre Maguire told King World News that one of the largest banks in Germany just refused to return a client’s gold the bank was supposedly storing for the client.
German Bank Refuses To Return Client’s 1/2 Tonne Of Gold
July 6 (King World News) – Andrew Maguire: “Eric, over the last few months we have been observing Swiss and German banks enforcing cash and gold withdrawal limits for clients. Currently, Swiss banks are capping client cash withdrawals to between 100,000 – 200,000 euros. Although the onus is placed upon individual banks to decide cash withdrawal limits for their clients, we have recently seen these limits enforced more strictly. This has to be an unannounced official mandate as it is now being widely reported by our clients…
Many Banks Now Refusing To Return Client’s Gold
Andrew Maguire continues: “It’s important to understand that these cash withdrawal limits also determine physical gold withdrawal limits. It is the strictly enforced physical gold withdrawal limits that have our attention. Following at least 10 similar reports to us of banks refusing to deliver clients’ physical gold bars, this week a very wealthy client sought to remove 500 kilos of his physical gold from a German bank for safekeeping in a secure, independent vault. The bank refused delivery of his gold bars.
These refusals to deliver bullion are now resonating loudly enough to prompt something to be officially sanctioned soon. Cash restrictions are already in place, however, the problem officials potentially face is being forced to go to market to buy thousands of tonnes of gold bullion to meet the surge of requests to withdraw bullion. That is simply not going to be allowed to happen as the bulk of unallocated exposure sits on the balance sheets of the too-big-too fail bullion banks…
Andrew Maguire continues: “We are also evidencing a large move to allocate and remove gold and silver from the interconnected legacy banking system. This is creating a supply shortage ahead of season. And I strongly suspect the blatant officially rigged price decline into such a tight physical gold market is coordinated with officials quietly slamming the back door on clients looking to remove gold out of the legacy system.
To avert a bailed-in daisy chain of bank defaults, there is only one solution and it would not be considered a default — a weekend cash settlement of all unallocated gold and silver accounts, with the insiders pre-positioned long FX & related Comex gold & silver futures. Such an action would still leave cash withdrawal limits in place or tightened. Think this can’t happen? Ask those that woke up to a bail-in in Cyprus, where even bank deposit boxes were locked. Similar European & US bail-in legislation is already in place
Your early FRIDAY morning currency, Asian stock market results, important USA/Asian currency crosses, gold/silver pricing overnight along with the price of oil Major stories overnight/9 AM EST
i) Chinese yuan vs USA dollar/CLOSED UP TO 6.6460/HUGE DEVALUATION FOR THE PAST TWO WEEKS RESUMES/ /shanghai bourse CLOSED UP 13.35 POINTS OR 0.49% /HANG SANG CLOSED UP 133.53 POINTS OR 0.47%
2. Nikkei closed UP 241,15 POINTS OR 1.12% / /USA: YEN RISES TO 110.64/
3. Europe stocks OPENED MIXED / /USA dollar index FALLS TO 94.32/Euro RISES TO 1.1709
3b Japan 10 year bond yield: FALLS TO . +.03/ !!!!(Japan buying 100% of bond issuance)/Japanese yen vs usa cross now at 110.64/ THIS IS TROUBLESOME AS BANK OF JAPAN IS RUNNING OUT OF BONDS TO BUY./JAPAN 10 YR YIELD FINALLY IN THE POSITIVE/BANK OF JAPAN LOSING CONTROL OF THEIR YIELD CURVE AS THEY PURCHASE ALL BONDS TO GET TO ZERO RATE!!
3c Nikkei now JUST BELOW 17,000
3d USA/Yen rate now well below the important 120 barrier this morning
3e WTI:: 72.39 and Brent: 76.64
3f Gold DOWN/Yen DOWN
3g Japan is to buy the equivalent of 108 billion uSA dollars worth of bond per month or $1.3 trillion. Japan’s GDP equals 5 trillion usa./“HELICOPTER MONEY” OFF THE TABLE FOR NOW /REVERSE OPERATION TWIST ON THE BONDS: PURCHASE OF LONG BONDS AND SELLING THE SHORT END
Japan to buy 100% of all new Japanese debt and by 2018 they will have 25% of all Japanese debt. Fifty percent of Japanese budget financed with debt.
3h Oil DOWN for WTI and DOWN FOR Brent this morning
3i European bond buying continues to push yields lower on all fronts in the EMU. German 10yr bund FALLS TO +.29%/Italian 10 yr bond yield UP to 2.67% /SPAIN 10 YR BOND YIELD DOWN TO 1.31%
3j Greek 10 year bond yield RISES TO : 4.03
3k Gold at $1255.20 silver at:16.01 7 am est) SILVER NEXT RESISTANCE LEVEL AT $18.50
3l USA vs Russian rouble; (Russian rouble DOWN 11/100 in roubles/dollar) 63.25-
3m oil into the 72 dollar handle for WTI and 76 handle for Brent/
3n Higher foreign deposits out of China sees huge risk of outflows and a currency depreciation. This can spell financial disaster for the rest of the world/
JAPAN ON JAN 29.2016 INITIATES NIRP. THIS MORNING THEY SIGNAL THEY MAY END NIRP. TODAY THE USA/YEN TRADES TO 110.64 DESTROYING JAPANESE CITIZENS WITH HIGHER FOOD INFLATION
30 SNB (Swiss National Bank) still intervening again in the markets driving down the SF. It is not working: USA/SF this morning 0.9923 as the Swiss Franc is still rising against most currencies. Euro vs SF is 1.1628 well above the floor set by the Swiss Finance Minister. Thomas Jordan, chief of the Swiss National Bank continues to purchase euros trying to lower value of the Swiss Franc.
3p BRITAIN VOTES AFFIRMATIVE BREXIT/LOWER PARLIAMENT APPROVES BREXIT COMMENCEMENT/ARTICLE 50 COMMENCES MARCH 29/2017
3r the 10 Year German bund now POSITIVE territory with the 10 year FALLING to +0.29%
The bank withdrawals were causing massive hardship to the Greek bank. the Greek referendum voted overwhelming “NO”. Next step for Greece will be the recapitalization of the banks and that will be difficult.
4. USA 10 year treasury bond at 2.83% early this morning (THIS IS DEADLY TO ALL MARKETS). Thirty year rate at 2.95%
5. Details Ransquawk, Bloomberg, Deutsche bank/Jim Reid.
(courtesy Jim Reid/Bloomberg/Deutsche bank/zero hedge)
Volatile Markets On Edge As Trade War Begins
Amid Confusion
“Clearly the first salvos have been exchanged and in that sense, the trade war has started. There is no obvious end to this” – Louis Kuijs, chief Asia economist at Oxford Economics.
The “largest-scale trade war” (as defined by China) launched at midnight, when the US announced $34 billion in tariffs on Chinese exports, and… confusion followed.
Duties on Chinese goods started just after midnight, or at 12:01 a.m. Friday in Washington, and just after midday in China. Another $16 billion of goods could follow in two weeks, Trump earlier told reporters aboard Air Force one, before suggesting the final total could eventually reach $550 billion, a figure that exceeds all of U.S. goods imports from China in 2017.
As we noted earlier, while China vowed to respond with countermeasures to the “unfair” US tariffs, no explicit announcement of just how China would retaliate followed immediately. Adding to the confusion, state-owned news agency Xinhua reported that China’s tariff actions in response took effect at 12:01 pm, however here too there was no detail, and the result was a spike in risk, as traders assumed that China was perhaps willing to concede early on without an explicit response.

To be sure, a token statement from the Chinese Commerce Ministry followed, with verbiage recycled from recent announcements:
“The United States has violated WTO rules and ignited the largest trade war in economic history. Such tariffs are typical trade bullying, and this action threatens global supply chains and value chains, stalls the global economic recovery, triggers global market turmoil, and will hurt more innocent multinational companies, enterprises and consumers.”
But it wouldn’t be until a little after 3am EDT, during the press conference by Chinese foreign ministry spokesman Lu Kang, that China specifically laid out how China would respond. In the Beijing press conference, he called the US move “typical trade bullying” and noted that any side’s “hegemonic actions” in trade will not succeed, in response to questions about whether China and U.S. will hold talks. Some other highlights from his presser:
- When asked about how much U.S. goods will be affected, Lu says it’s a question for relevant departments
- China has been trying the best to help relevant parties understand the globalization objectively and to deal with trade issues rationally since March, Lu says
- U.S. tariff actions openly violate WTO rules and trigger global market turbulence: Lu
- China is confident to uphold multilateral and free trade system with other countries, Lu says
But most importantly, he said that China’s countermeasures took effect immediately after “unfair” U.S. tariff actions came into force, as Xinhua trolled Trump in a tweet, saying that “Battling with the world over trade, Trump seems to be making America ALONE again.”

China Xinhua News
✔@XHNews
Battling with the world over trade, Trump seems to be making America ALONE again. Let’s see why.
Xinhua then also clarified that the list of products China will hit with the 25 percent tariff won’t change from what was put out in mid-June: some 545 products including soybeans and a bunch of other farm products, plus cars and crude oil, but mostly agriculture products:
- Soybeans – which are used to feed pigs in China, the world’s biggest pork producer
- Corn – same, used as animal feed
- Wheat – China is the world’s top wheat consumer
- Beef – U.S. exports to China only started again in 2017 after being banned for years because of mad cow disease
- Sorghum – also used in animal feed
China also said that while it has promised not to “fire the first shot,” it would now be forced to “counterattack” in order to defend its core interests. It has vowed to inform the World Trade Organization (WTO) and work with other countries to “jointly safeguard free trade and the multilateral system.”
“Our view is that trade war is never a solution,” Chinese Premier Li Keqiang told reporters in the Bulgarian capital Sofia, after meeting his counterpart. “No one will emerge as a winner from trade war, it benefits no one.”
Meanwhile, PBoC adviser Ma Jun said impact of US-China trade war is limited and expects the $50BN in US tariffs to slow down China’s growth by 0.2 ppts, while there were also comments from China Foreign Minister Wang Yi that China and EU should safeguard free trade and that China is willing to defend Iran accord with Europe.
These clarifications appeared to break the back of the modest bullish tone that had developed in response to the widely telegraphed and priced in trade war announcement, resulting in renewed selling in both China and the US: as shown below, while the Shanghai Composite initially dropped to a fresh 2016 low, sliding as much as 1.57% and below 2,700, it then rebounded sharply, only to fade gains and close 0.49% higher after a rollercoaster session .

A similar confused reaction was observed in the offshore yuan, which initially tumbled, then erased all losses and even turned briefly green for the day, before trading modestly in the red as US traders walked in to their desks.

Meanwhile, US equity futures saw the initial mini-spike fizzle, and were trading modestly in the red at publication time.

European stocks similarly trimmed gains and U.S. equity-index futures fluctuated after China provided the details of its retaliation. The Stoxx Europe 600 Index climbed 0.1% as of 10:14 a.m. London time, the highest in two weeks. Defensive stocks including household goods and utilities were among the gainers in the Stoxx Europe 600 Index, while carmakers and miners fell, confirming that traders were especially concerned about sectors targeted by China: as a reminder, China’s new tariffs will deal a big blow to German automakers, like BMW and Daimler which are fighting a number of battles in addition to trade tensions.
One of the sectors hit hard was Europe’s bank which initially spiked higher, only to lose all gains as the session progressed.

In a mini sideshow development, Deutsche Bank rose on a WiWo report that China’s ICBC and JPMorgan are takeover bids; however JPM promptly denied the rumor just before 6am. The denial however did not faze traders who have sent DB stock 5% higher on the session.

Overall, there has been a relatively limited reaction to the official start of the trade conflict, which however had been well-telegraphed in advance. As an aside, if one looks at how stocks have performed since the start of trade war tensions, the US is clearly winning, if only for the time being.

What happens next, nobody really knows: as Bloomberg notes, the riskiest economic gamble of Trump’s presidency could spread as it enters a new and dangerous phase by imposing direct costs on companies and consumers globally. It’s the first time the U.S. has imposed tariffs aimed just at Chinese goods and follows months of accusations that Beijing stole American intellectual property and unfairly swelled America’s trade deficit.
Meanwhile, adding to today’s confused trade, in just under 2 hours, the BLS will release the June jobs numbers, after the ADP released disappointing numbers on Thursday (a full preview is here).
“The usually highly anticipated report comes as trade tensions intensify between the U.S. and Chinese and are about to step up a gear, so the Labor Department’s report may not attract as much attention as normal,” Jasper Lawler, head of research at London Capital Group Ltd. said in a note. “This does not mean that the report will be less likely to cause volatility in the dollar.”
Treasuries were unchanged, stuck to 2.83% and grinding ever lower. The Bloomberg Dollar Spot Index fell for a fourth day and was set for a weekly decline. The pound gained above $1.32 Friday following a report that ex-Prime Minister David Cameron had intervened to urge Foreign Secretary Boris Johnson to accept May’s proposals.

Commodities are mostly lower with WTI (-0.1%) and Brent (-0.3%) pressured amid yesterday’s surprise build in crude inventories fused with nervous trading as US-Sino trade war looms. Gold (-0.2%) is experiencing cautious trade ahead of the key US NFP due later today. Elsewhere, London copper (-0.1%, -5% this week) is set for the worst week since November 2015, down a fifth consecutive session as US tariffs kick in.
Looking ahead, highlights include US NFP, US trade, Canadian jobs, Baker Hughes
Market Snapshot
- S&P 500 futures little changed at 2738
- STOXX Europe 600 up 0.3% to 382.69
- MXAP up 0.6% to 163.58
- MXAPJ up 0.4% to 532.10
- Nikkei up 1.1% to 21,788.14
- Topix up 0.9% to 1,691.54
- Hang Seng Index up 0.5% to 28,315.62
- Shanghai Composite up 0.5% to 2,747.23
- Sensex up 0.6% to 35,770.54
- Australia S&P/ASX 200 up 0.9% to 6,272.29
- Kospi up 0.7% to 2,272.87
- German 10Y yield rose 0.3 bps to 0.302%
- Euro up 0.2% to $1.1713
- Brent Futures down 0.2% to $77.22/bbl
- Italian 10Y yield rose 7.4 bps to 2.462%
- Spanish 10Y yield fell 1.1 bps to 1.318%
- Brent Futures down 0.2% to $77.22/bbl
- Gold spot down 0.2% to $1,255.94
- U.S. Dollar Index down 0.1% to 94.27
Top Overnight News
- China said its retaliatory tariffs are now in effect to counter Trump’s measures, and argued it had been forced to act Impact of U.S. tariffs on $50b of Chinese goods to have “limited” impact on the economy, PBOC adviser Ma Jun says in comments distributed to reporters over WeChat
- U.S. companies for months bemoaned the tariffs on Chinese imports that will take effect Friday. Now they fear the worst is yet to come in an escalating confrontation with Beijing over trade
- Federal Reserve officials said a “very strong” economy warranted continued increases in their benchmark policy rate while citing an escalating trade war and emerging-market turmoil as risks to growth
- Deutsche Bank: recent fall in valuation has drawn interest from JPMorgan and ICBC accoring to people familiar: Wirtschaftswoche
- Prime Minister Theresa May is facing a decisive battle with her cabinet over the U.K.’s future ties to the European Union, in a showdown that threatens to throw Brexit talks into disarray
- Saudi Arabia cut pricing for most of its oil grades as the world’s biggest crude exporter is increasing production to assure buyers there is sufficient supply following U.S. President Donald Trump’s demands that OPEC do more to stabilize oil markets
- German industrial production picked up in May, signaling that the economy is beginning to stabilize after a stumble earlier in the year
- While trade tensions intensify, Germany’s carmakers are fighting on an unprecedented number of fronts. While a tit-for- tat trade war move will hurt BMW AG and Daimler AG the most, the industry also has to also deal with record spending required for electric cars to keep up with emissions regulation, competitors from China and the tech industry
Asian stocks traded higher after the positive momentum from Wall St’s best performance in over a month followed through to Asia. ASX 200 (+0.9%) and Nikkei 225 (+1.1%) were positive as both indices took impetus from their US counterparts, in which the mining sector led the gains in Australia and the prior day’s currency weakness provided some encouragement to Japanese exporters. Conversely, Hang Seng (+0.5%) initially weakened and Shanghai Comp. (+0.5%) briefly fell below the 2700 level for the first time since March 2016 amid the tit-for-tat tariffs and after PBoC inaction amounted to a considerable CNY 500bln net drain for the week before the indices finished in the green. The KOSPI (+0.7%) was also subdued with index heavyweight Samsung Electronics dampened on disappointing preliminary Q2 results, while Singapore Straits Times Index (-2.0%) slumped from the open with developers hit by a surprise announcement yesterday of higher stamp duty rates and tighter loan-to-value limits as part of measures to cool the property market. Finally, 10yr JGBs have seen mild support overnight amid the overall cautious tone in the Asia-Pac region and BoJ’s presence in the market for JPY 810bln in JGBs, but with upside capped by resistance around the 151.00 level.
PBoC skipped open market operations for a net weekly drain of CNY 500bln vs. last week’s CNY 370bln net drain. PBoC set CNY mid-point at 6.6336 (Prev. 6.6180)
Top Asian News
- Xiaomi Falls in Gray Market Before H.K. Debut: Bright Smart Sec.
- Musk: SpaceX, Boring Co. Engineers Heading to Thailand Tomorrow
- Chinese Stocks Struggle to Hold on to Rally as Tariffs Begin
- Janus Henderson Seeks Sales Team Head as It Expands in Asia
European equities trade higher (Eurostoxx 50 +0.2%) while investors monitor the ongoing trade disputes amid US moving forward with tariffs targeting USD 34bln of Chinese goods. Shortly after, the Chinese Foreign Ministry said tariffs have been implemented on some US goods. Energy names lag on softer oil prices. In terms of individual stock movers, Deutsche Bank (+5.0%) shares were lifted by reports JP Morgan and ICBC are to take a stake in the company, JP Morgan have denied these reports, however. Thyssenkrupp (+2.8%) also rests at the top of the German benchmark following the resignation of their CEO after he came under heavy criticism from shareholders.
Top European News
- Irish Banks Face Increased Capital Demand Decade After Crash
- U.K. House Prices ‘Broadly Flat’ Amid Shortage of Properties
- Rolls- Royce Offloads Problem Marine Arm to Norway’s Kongsberg
- Econocom Drops Most on Record as Leasing Delays Prompt Warning
In FX, the Dollar remains on the back foot amidst the first roll out of reciprocal import tariffs by the US and China, but also eyeing the official monthly BLS report with several anecdotal releases in the run up suggesting moderate downside risk vs consensus for the headline payroll number. The DXY is near recent lows around 94.200 as a result, but likely to be more responsive to average earnings once the initial reaction to jobs, back revisions and the unemployment rate. EUR/GBP – Both maintaining momentum vs the Buck, with the single currency back above 1.1700, but still wary of decent (1.7 bn) option expiry interest at the strike and Cable looking at 1.3250 again as attention away from NFP is trained on Chequers and the latest Brexit ‘make or break’ meeting. CHF/JPY/CAD – All treading tight lines vs the Usd, with the Franc meandering between 0.9915-45, Jpy trapped within a 110.55-80 range and Loonie locked in 1.3120-50 parameters in the run up to Canadian jobs data, and the BoC policy meet next week.
Commodities are mostly lower with WTI (-0.1%) and Brent (-0.3%) pressured amid yesterday’s surprise build in crude inventories fused with nervous trading as US-Sino trade war looms. Gold (-0.2%) is experiencing cautious trade ahead of the key US NFP due later today. Elsewhere, London copper (-0.1%, -5% this week) is set for the worst week since November 2015, down a fifth consecutive session as US tariffs kick in.
Looking at the day ahead, the June employment report in the US is the data highlight including of course the latest payrolls and average hourly earnings data. We will also get May industrial production in Germany along with the May trade balance and current account balance in France and Q1 unit labor costs in the UK. Aside from the data, the ECB’s Nouy and the EU’s Dombrovskis will be speaking at Central Bank of Austria’s annual conference.
US Event Calendar
- 8:30am: Trade Balance, est. $43.7b deficit, prior $46.2b deficit
- 8:30am: Change in Nonfarm Payrolls, est. 195,000, prior 223,000
- Unemployment Rate, est. 3.8%, prior 3.8%
- Average Hourly Earnings MoM, est. 0.3%, prior 0.3%
- Average Hourly Earnings YoY, est. 2.8%, prior 2.7%
- Average Weekly Hours All Employees, est. 34.5, prior 34.5
- Labor Force Participation Rate, est. 62.7%, prior 62.7%
DB’s Jim Reid concludes the overnight wrap
A word of warning. If you’re going to a wedding that starts around 3pm tomorrow in England or Sweden be prepared to stand in for the Groom or Bride if they’re a football fan as they may see jilting their spouse as preferable to missing the big game. It’s truly a game where “the winner takes it all”. I haven’t read the tabloid papers in the UK today but I’m predicting that someone will use “Come and ABBA go if you think your hard enough” as their front page! Finally spare a thought for Craig on my team who tomorrow has his stag do in Scotland. He may not find many places to watch the game with a sympathetic crowd.
Sticking with the ABBA theme it’s a case this morning of “Gimme, gimme, gimme a tariff after midnight” as we we’re now an hour past the 00.01am ET scheduled US imposition of tariffs on $34bn of Chinese goods. Earlier on, Bloomberg reported that China’s Ministry of Commerce will be forced to retaliate on US tariffs, but have not specified a time frame yet. There is no official word yet from China as we go to print this morning. Before the US tariffs took effect, Reuters reported that President Trump told reporters on board Air Force one that subsequent rounds of tariffs could be applied on $550bn worth of Chinese goods.
This morning in Asia, markets are recovering from earlier session lows, with the Nikkei (+1.04%) and Kospi (+0.18%) both up while the Hang Seng (-0.48%), and Shanghai Comp. (-0.34%) are modestly down. Datawise, Japan’s May labour cash earnings grew at the fastest monthly rate in c20 years, at 2.1% yoy (vs. 0.9% expected). Meanwhile in Germany, Chancellor Merkel’s third coalition partner (the SPD) has now endorsed her migration plans.
Ironically on this morning of escalation, yesterday saw European automakers having their best day in 2 years after the story yesterday that German autoindustry executives met with U.S. Ambassador to Germany Richard Grenell on Wednesday where the latter was said to suggest that Washington was prepared to discuss a zero car duty regime. The Stoxx 600 Automobiles & Parts Index rose 3.41% percent with BMW (+1.70%), Fiat Chrysler (+5.98%), and VW (+3. 24%) all strong.
Staying with autos, after Europe closed Politico reported that the EU may offer to negotiate a plurilateral trade deal that would eliminate most tariffs on autos to persuade President Trump to avoid a trade conflict with the EU. The paper noted the proposal has the backing from Germany and the EC President Juncker could present the proposal to the US later in the month. Notably an unnamed official said the deal would have to cover c90% of global car exports to meet WTO rules, but DB’s George Saravelos noted that it should be relatively easy for other countries to sign up because their tariffs are already near zero. So it is a path for the EU to claim they have agreed to a multilateral deal under WTO rules when in practice it could be more of a negotiated bilateral tariffs with the US. Further, an unnamed WTO official said they have not been briefed on the proposal, but the “concept would be possible”. Meanwhile German Chancellor Merkel seems to back the idea of lower car tariffs too as she noted “talks on…reducing tariffs, for which I’m prepared, can’t only be done with the US….we’ve to do it with all countries with which we have trade in automobiles…”.
The highlight outside of trade today will be US payrolls. The consensus for June is 195k (with a high to low range of 154-242k) which compares to the above market 223k in May. The bigger focus, average hourly earnings, are expected to come in at +0.3% mom (DB agrees) which, if it holds, would push the annual rate up one-tenth to +2.8% yoy and match the post-recession high made in September last year. Our US economists are close to the consensus with a 190k projection for payrolls and their expectation is that this should be enough to keep the unemployment rate at 3.8%. Yesterday’s ADP didn’t really do anything to sway that view with the 177k reading pretty much as expected by our economists.
As markets yesterday. US equities rebounded c1% on thin volume as trading resumed post holidays (S&P +0.86%; Nasdaq +1.12%). Within the S&P, only the energy sector was slightly down while gains were led by tech stocks as Facebook (+2.97%) and chipmaker Micron Technology (+2.64%) both rebounded and lifted sentiment as the latter clarified that the Chinese court’s sales ban on some of the company’s products would only impact c1% of its annual revenue. Back in Europe, all the bourses were higher as the DAX led the gains (+1.19%) given the boost from car maker stocks while the Stoxx 600 (+0.41%) and FTSE (+0.40%) also advanced.
This followed a confusing day of price action in European bonds with 10yr bunds selling off 4bps in the first couple of hours of trading as the previous night’s ECB story reverberated and strong data from Germany came through. However it reversed all these gains as the day progressed, most likely due to early weakness in Italy and possibly softness in Oil later on in the day. On Italy, 2 and 10yr yields were +16.9bps and +7.4bp higher respectively. Finance Minister Giovanni Tria was quoted earlier on Bloomberg as saying that the new government will have both tax cuts and a universal basic income in its first budget to prove it’s sticking to its agenda. Elsewhere in global bond markets, curves continue to flatten with US 2s10s down to a fresh decade low of 28bps and long dated core European yields are continuing to do well as chatter persists about ECB doing an equivalent of ‘operation twist’ with reinvestments once QE ends.
In FX, Sterling initially traded 0.3% higher following BOE Governor Carney’s slightly hawkish comments that “the incoming data have given me greater confidence that the softness in the UK activity in 1Q was largely due to the weather, not the economic climate”, but gains were erased and the currency closed -0.06% weaker as Bloomberg cited unnamed German government officials who noted the UK PM May’s latest plans (due to be discussed today) for a customs union post Brexit is unworkable. Meanwhile WTI oil fell -1.62%, in part as EIA data showed higher than expected US crude inventories.
Turning to the FOMC minutes which were largely in line with our US economists’ views. Fed officials acknowledged rising trade tensions but flagged the US economy is very strong. On rates, DB’s Brett Ryan noted the Fed remains on path to neutral rates and beyond given their forecasts, as the minutes indicated “participants generally judged that with the economy already very strong….it would be appropriate to continue gradually raising the …federal funds rate to a setting that was at or somewhat above their estimate of its longer run level by 2019 or 2020”. Notably some members did argued that “it might soon be appropriate to modify the language in the post-meeting statement indicating that the stance of monetary policy remains accommodative.’” Elsewhere, the flattening yield curve was a concern, as “a number of participants thought it would be important to continue to monitor the slope of the yield curve” but the minutes also indicated that the curve “…. would be only one among many considerations in forming an assessment of appropriate policy.” On trade tensions, “most (participants) noted that uncertainty and risks associated with trade policy had intensified and were concerned that such uncertainty and risks eventually could have negative effects”. Further, “many district contacts expressed concerns” that the ongoing trade tensions was weighing on future investment activity. Finally on inflation, “a number” of participants noted it was “premature to conclude that the committee had achieved” its 2% inflation target on a sustainable basis.
Finally turning back to Brexit. Today sees the all-day cabinet meeting at the PM’s Chequers country residence where Mrs May and her cabinet will look to finalise their blueprint on the future relationship between the UK and EU post Brexit. Bloomberg reported that a group of seven pro-Brexit ministers met last night at Secretary of State for Foreign affairs Johnson’s office to coordinate their opposition to the PM’s policy on linking tariffs and goods regulations closely to those of the EU. Meanwhile, Bloomberg has also confirmed an earlier report by the Telegraph where the Brexit Secretary Davis has written to PM May to say her new proposal on the customs union will fail. So lots bubbling along before more details later today.
Before we take a look at today’s calendar, we wrap up with other data releases from yesterday. In the US, the June ISM non-manufacturing composite index was above market and rose 0.5pt to a four month high of 59.1 (vs. 58.3 expected). In the details, the activity index rose 2.6pts to 63.9 – the highest since August 2005, while the new orders index also jumped to a solid print of 63.2. Meanwhile the labour market cooled with the June weekly initial jobless claims (231k vs. 225k expected) and continuing claims (1739k vs. 1,718k expected) both slightly higher than expectations, but remaining at very low levels. The final readings of the June services PMI was confirmed at 56.5 while the composite PMI was revised up 0.2pt 56.2.
In Germany, the May factory orders was solid, up for the first time in five months and also above market at 2.6% mom (vs. 1.1% expected), leading to an annual growth of 4.4% yoy (vs. 1.7% expected). Excluding the impact of major transport items, manufacturing orders still rose a solid 2.2% mom and 4.3% yoy.
Looking at the day ahead, the June employment report in the US is the data highlight including of course the latest payrolls and average hourly earnings data. We will also get May industrial production in Germany along with the May trade balance and current account balance in France and Q1 unit labor costs in the UK. Aside from the data, the ECB’s Nouy and the EU’s Dombrovskis will be speaking at Central Bank of Austria’s annual conference.
3. ASIAN AFFAIRS
i)FRIDAY MORNING/THURSDAY NIGHT: Shanghai closed UP 13.34 POINTS OR 0.49% /Hang Sang CLOSED UP 133.53 POINTS OR 0.47%/ / The Nikkei closed UP 241.15 POINTS OR 1.12% /Australia’s all ordinaires CLOSED UP 0.84% /Chinese yuan (ONSHORE) closed DOWN at 6.6460 AS POBC RESUMES ITS HUGE DEVALUATION /Oil DOWN to 72,39 dollars per barrel for WTI and 76.64 for Brent. Stocks in Europe OPENED MIXED //. ONSHORE YUAN CLOSED UP AT 6.6460 AGAINST THE DOLLAR. OFFSHORE YUAN CLOSED DOWN ON THE DOLLAR AT 6.6611 :HUGE DEVALUATION/PAST SEVERAL DAYS NOW RESUMES: TARIFF WARS BEGIN//ONSHORE YUAN TRADING STRONGER AGAINST OFFSHORE YUAN/ONSHORE YUAN TRADING WEAKER AGAINST USA DOLLAR/OFFSHORE YUAN TRADING MUCH WEAKER AGAINST THE DOLLAR /CHINA RETALIATES WITH TARIFFS/ TRUMP RESPONDS TO NEW TARIFFS AND IT NOW A FULL TRADE WAR COMMENCED/
3 a NORTH KOREA/USA
North Korea/South Korea/usa
3 b JAPAN AFFAIRS
A mixture of good news and bad for Japan last night: Japanese wages finally soar at the fastest pace in 24 years as the aging population witnesses a declining labour pool. However this did not translate into higher spending which is what Japan desperately needs:
(courtesy zerohedge)
Japanese Wages Unexpectedly Soar At Fastest
Pace In 24 Years As Spending Crashes
In his summary of today’s (disappointing) ADP report, Mark Zandi said that “Business’ number one problem is finding qualified workers. At the current pace of job growth, if sustained, this problem is set to get much worse. These labor shortages will only intensify across all industries and company sizes.” As it turns out, this is just one more way in which the US is gradually becoming like Japan.
In his latest note, SocGen’s Albert Edwards cites a recent story in the Nikkei which reveals just how much worse America’s labor shortage problem could get as US demographics start to approximate those of Japan:
“A record-high 98.0% of newly minted university graduates in Japan have landed jobs at the beginning of this fiscal year in April. The employment rate of job-seeking graduates rose 0.4 percentage point from a year earlier, up for the seventh consecutive year, in an annual survey conducted since 1997 by the labour and education ministries. The employment rate among new high school graduates who sought jobs as of the end of March gained 0.1 percentage point to 98.1%, up for the eighth straight year.”
Now that’s what full employment looks like, and as Edwards further notes, “all this is happening without the help of large tax cuts and repatriated foreign earnings. Japan is enjoying what ostensibly appears to be a healthy, balanced recovery – albeit with the very large caveat that it is dependent on the most ludicrous QE ever seen in a modern economy.”
But why if Japanese labor shortages are so extensive, and with a near record low unemployment rate, does Japan’s wage inflation remain so muted. Well, it actually isn’t: as Edwards also points out, “extreme labor shortages have seen a jump in wage inflation and household incomes are now growing some 3% yoy, dragging consumer spending growth kicking and screaming in its wake.”

Then, on Friday morning Japan reported an absolutely barnburner of a number, confirming that wage inflation in Japan is indeed suddenly rampaging: nominal cash wages soared by 2.1% y/y in May, up from 0.6% in April and more than double the median estimate of 0.9%, matching the fastest increase since 1994. Basic wage growth accelerated to +1.5% yoy (April: +0.9%), and special wages rose 14.6%, lifting the overall wage reading by +0.6 points

As a result, real wage growth increased sharply to +1.3% yoy, from -0.2% in April, after adjusting for a 0.8% yoy rise in May in the CPI excluding imputed rent.

As a Bloomberg commentator said, “all that’s needed now is for Japanese households to start spending and the elusive inflation rise toward 2.0% may actually begin.”
Alas, that’s isn’t happening because in a separate report, Japanese household spending tumbled -3.9%, more than double the -1.5% decline expected, and the biggest drop since August 2016.

As Bloomberg’s Garfield Reynolds writes, “Japanese household thrift looks to be so ingrained as to dash any hopes that consumer demand will be able to spur economic growth and inflation.”
Or, perhaps, none of this is real, and Japan is merely the latest nation to “Chinafy” its data reporting: as Goldman Sachs writes in a note on today’s report, based on the old sample groups, wage growth actually stagnated in May:
As we have noted previously, roughly half of the sample group for the monthly labor statistics was replaced in January 2018, but the official statistics directly compare average wages for old and new sample groups on a yoy basis, possibly creating data distortion.
The Ministry of Health, Labour and Welfare (MHLW) discloses wage growth data for old sample groups (companies still included in the survey) for reference purposes. According to these data, basic wages rose sharply to +0.7% yoy in May, from +0.1% in April. However, this merely represents a return to the trend from October 2017 through March 2018 (basic wages briefly declined sharply in April). Nominal cash wages in May came in at +0.2% yoy on an old sample basis, a slight decline from April (+0.4%).

So which is it: is Japan simply statistically skewing the sample to fabricate and goal seek data it wants, “confirming” Abenomics is working when it isn’t, meanwhile Japan’s population refuses to spend (money which it may not have beyond some computer’s statistical model), or is the alternative more likely: that nothing at all has changed and that after 6 years of Abenomics, all Japan has to show for the biggest monetary experiment in history is a higher stock market, and a central bank which now owns 42% of the country’s bonds, and amount roughly equivalent to Japan’s GDP…

… and will soon run out of bonds to buy…
end
c) REPORT ON CHINA/HONG KONG
It began at midnight: trade wars commence between China and the USA
(courtesy zerohedge)
Trade War Begins In Hours, As Trump Confirms China Tariffs To Start At Midnight
If China was hoping for Trump to relent, and back down in the last minute before the start of tonight’s China tariffs, set to take place at 1 minute after midnight, it will be disappointed.
Speaking to reporters aboard air Force One on route to Montana, the president said that the planned tariffs on Chinese goods would go forward just after midnight, as previously reported, and in so doing will deliver on a promise to his political supporters that risks provoking retaliation and, if taken far enough, sending the global economy into a recession.
Trump then said that another $16 billion of goods could follow in two weeks, before suggesting the final total could eventually reach $550 billion, a figure that exceeds all of China’s annual goods exports to the U.S., but is below the total calculated recently by Goldman Sachs, which saw as much as $800 billion in total tariffs on Chinese goods.

As previously reported China has vowed to hit back moments after the Trump decision is enacted – so it does not appears to be the initiator – by imposing its own $34BN of tariffs in kind on goods ranging from American soybeans to pork, which may in turn prompt Trump to raise trade barriers even higher.
“Once these tariffs start going into effect, it’s pretty clear the conflict is real,” Robert Holleyman, former deputy U.S. trade representative under Barack Obama and now a partner Crowell and Moring, told Bloomberg. “If we don’t find an exit ramp, this will accelerate like a snowball going down a hill.”
Which of course is what a trade war is all about.
Meanwhile, as if it hasn’t been mocked enough already, such American companies as Harley-Davidson are among those set to suffer from China’s retaliation. Additionally, American businesses from Apple and Walmart to General Motors all operate in China and are keen to expand. As Bloomberg notes, that hands Chinese President Xi room to impose penalties such as customs delays, tax audits and increased regulatory scrutiny “if Trump delivers on his threat of bigger duties on Chinese trade.”
Ultimately, the question is who will be impacted more: the US or China: to be sure, Chinese stocks have taken a far greater beating than their US peers in recent weeks, entering a bear market, as concerns about the trade war have mingled with worries about China’s ability to control its debt and maintain growth. Meanwhile, U.S. stocks are up slightly more than 2 percent this year as investors have weighed the threat of trade frictions against the strong performance of the U.S. economy.

As the war of trade attrition begins, China may have more to lose: according to SocGen economists, the drag on the Chinese economy could be close to 1% of GDP and cost 3-4m Chinese jobs, while for the US, the drag on GDP would be more modest at just 0.1-0.2%. Both estimates assume no further escalation.
Other banks are more sanguine: according to BofA head of economics, Ethan Harris, the impact of the first round of tariffs on $34 billion in Chinese goods will be “quite small” but he doesn’t “see the war ending until there are casualties.”
“This plays out over the next few months, until both sides start to feel a little pain and realize this isn’t a bloodless march to victory,” said Harris.
And since the U.S. imports much more from China than the other way around, it gives the U.S. an advantage in a tariff dispute, at least in the beginning..

That means Beijing will likely focus on introducing bigger regulatory or tax burdens on American companies who operate in China or want to tap its growing market. It could even take the drastic steps of stopping to pretend it is not devaluing the yuan or reducing its $1.2 trillion holdings of U.S. Treasuries, measures that would hurt it as well as the U.S.
And while China’s response is yet to be determined, the biggest wildcard in the upcoming trade war is the surprise factor:
In the past, the U.S. used its economic clout to win trade skirmishes with developing countries, said James Boughton, a senior fellow at the Centre for International Governance Innovation in Waterloo, Ontario. China, whose economy has grown tenfold since it joined the World Trade Organization in 2001, poses a much more formidable adversary.
“The dynamic is different from anything we’ve seen,” said Boughton. “China has an ability to ride out this kind of pressure, to weather the storm, that a lot of countries didn’t have in the past.”
So what happens, and who will ultimately win? The answer remains to be seen, but the real war begins tonight at midnight.
end
4. EUROPEAN AFFAIRS
Putin Prepares To Make Major Concessions During Trump Summit
A senior Kremlin official tells Bloomberg that Vladimir Putin is preparing to offer significant concessions to President Trump at their July 16 summit in Helsinki, Finland in the hopes of beginning to repair strained relations between Russia and the United States. Chief among them, according to the official, is a discussion on Iran’s role in Syria – an issue that Moscow is simultaneously coordinating with Tehran.

Putin has agreed in principle to U.S. and Israeli demands that Iranian-backed forces in southern Syria be kept away from Israel’s border, replaced with troops loyal to the government in Damascus, two Kremlin advisers said.
After studying Trump’s meeting with North Korean leader Kim Jong Un, during which he announced a surprise halt to U.S. military exercises with South Korea, Putin decided he needs to negotiate with the billionaire personally, the senior official said, without elaborating. The two leaders may meet without aides, as Trump and Kim did in Singapore, Kremlin spokesman Dmitry Peskov said. –Bloomberg
In advance of the summit, U.S. ambassador to Russia, Jon Huntsman, briefed President Trump during a one-on-one conference call Thursday – saying that Trump will go into the meeting with “eyes wide open.”
Trump, meanwhile, has broken with Obama’s policy of demanding that Syrian leader Bashar al-Assad be removed from power, a position reportedly formed before Russia and Iran turned the tide of the Syrian civil war in Assad’s favor against U.S. backed rebels. This sentiment was backed by U.S. National Security Adviser John Bolton – who on Sunday told CBS News that Assad is no longer “the strategic issue” in Syria. Instead, Iran is now the focus.
“We’ll see what happens when the two of them get together,” said Bolton, who never met a regime he didn’t want to change. “There are possibilities for doing a larger negotiation on helping to get Iranian forces out of Syria and back into Iran, which would be a significant step forward.”

Russia views the upcoming Trump-Putin summit as an opportunity to mend fences with the United States. Relations have soured dramatically since the days Bill Clinton was hanging out at Putin’s Moscow estate – within hours of collecting $500,000 for a speech to a Kremlin investment bank – in the same month Russia assumed control over 20% of U.S. uranium under Hillary Clinton’s State Department. But that was 2010. Since then, Russia annexed Crimea in 2014 and allegedly hacked the 2016 U.S. election – which the Kremlin has been heavily sanctioned for.
Still, major questions remain over Putin’s ability to actually enforce any agreement governing Iran’s actions in Syria, even if he offers to stabilize the border with Israel by sending troops into the area. This has in turn caused some in Washington and among Western allies in Europe that Trump may prematurely tout the Helsinki meeting without actually achieving real concessions.
Russia may have supplanted America as the indispensable arbiter in various Mideast conflicts but there’s only so far Putin is willing to go to appease Trump when it comes to Iran, according to Andrei Kortunov, head of the Russian International Affairs Council, a research group set up by the Kremlin. –Bloomberg
“Trump can’t force Putin to turn away from Iran,” Kortunov said. “Putin is not willing to push Iran too hard and he cannot rely on Trump.”

end
Russia/USA
Russia joins the global trade war by imposing tariffs on USA energy and mining imports
(courtesy zerohedge)
Russia Joins Global Trade War – Imposes Tariffs On US Energy, Mining Imports
Whether this is a coordinated response is unclear – and certainly on a much smaller scale – but Bloomberg reports that Russian Prime Minister Dmitry Medvedev signed a decree this morning imposing higher tariffs on U.S. products in retaliation for U.S. duties on metals imports, according to Economy Ministry statement.

Reuters reports that Russia’s additional duties will apply to imports of fiber optics, equipment for road construction, oil and gas industry, metal processing and mining, according to an economy ministry statement.
Russia will impose duties on goods which have Russian-made substitutes, Economy Minister Maxim Oreshkin is quoted as saying in the statement.
“The compensation measures will be applied in the form of additional, higher rates of import duties ranging from 25% to 40% of the price of imported goods. Duties will be imposed on some U.S. goods, the analogues of which are produced in Russia. In particular, the measures cover some types of road construction equipment, oil and gas equipment, metalworking machines, rock drilling equipment, and optical fiber,” Minister Maxim Oreshkin said as quoted by the ministry.
“The financial damage inflicted on Russian exporters by the U.S. trade restrictions amounts to $537.6 million. This is the amount of additional duties that Russian suppliers have to pay in the U.S.
The current increase of duties allows us to compensate for only part of the damage amounting to $87.6 million. This is compensation that Russia has the right to recover under the WTO rules,” he said.
Russia will be able to compensate for the remaining part in three years since the introduction of the U.S. duties or after approval of the WTO dispute settlement body if it finds the U.S. restrictions violating the organization’s rules, the ministry said.
Makes you wonder how long Russia will stay with WTO – just like Trump – if this is all the response “you’re allowed.”
Shots fired…
6 .GLOBAL ISSUES
The huge amount of tariffs initiated by our major players: China/Russia and the EU will cause global growth to tumble
(courtesy zerohedge)
Analysts Brace For “Serious Disruption” As Trade Growth Tumbles Ahead Of Tariffs
While the US prepares to unleash its latest salvo in the trade war against China at midnight tonight, business surveys suggest that global trade is already collapsing
JPMorgan’s Global Purchasing Managers’ Index (PMI) data suggest that trade growth has already slowed dramatically this year, as tensions over tariffs have escalated.

“There is a huge correlation between the performance of Asian exports and Asian earnings. You can extend that analysis from global trade to global earnings,” said Tai Hui, chief markets strategist for Asia at J.P. Morgan Asset Management. Companies in sectors like consumer electronics are already suffering, he added.
As WSJ notes, the data signals that the synchronized world-wide growth that sustained global markets and company earnings for much of last year is already starting to run on empty. And that slowdown is likely to have a greater impact on trade than the developing conflict among the U.S., China and other major economies, analysts and investors say.
The global trade moderation helps explain the recent sell-off in emerging-market bonds and equities better than any fears of rising protectionism, BCA Research, an independent Canadian research firm, argued in a report last week. Any fall in trade is likely to first hit economies integral to globalized manufacturing processes, such as those of several emerging countries in Asia.
“When global trade expands, weak parts of the chain do well. Conversely, when global trade growth dwindles, these same weak links are the first to break,” said Arthur Budaghyan, chief emerging markets strategist at BCA Research.
But while the incessantly-threatened tariffs haven’t taken effect yet, some economists arge that there is a link to the protectionist chatter…
“It might be that companies are anticipating trade becoming more difficult with China or with the U.S. and are adjusting their supply chains,” said Joanna Konings, senior international trade economist at ING in Amsterdam.
But one thing seems certain, it is not about to improve anytime soon as ‘actual’ tariffs are enacted…and retaliated to.
“If the trade dispute becomes more complicated, if both sides are not willing to change their stance, you could end up with a much more serious disruption,” said William Yuen, investment director at Invesco.
All of which seems to be increasingly priced into the bond market…

END
7. OIL ISSUES
8. EMERGING MARKET
Your early morning currency/gold and silver pricing/Asian and European bourse movements/ and interest rate settings FRIDAY morning 7:00 am
Euro/USA 1.1709 UP .0017/ REACTING TO MERKEL’S FAILED COALITION/ SPAIN VS CATALONIA/REACTING TO +GERMAN ELECTION WHERE ALT RIGHT PARTY ENTERS THE BUNDESTAG/ huge Deutsche bank problems + USA election:///ITALIAN CHAOS /AND NOW ECB TAPERING BOND PURCHASES/JAPAN TAPERING BOND PURCHASES /USA RISING INTEREST RATES /FLOODING/EUROPE BOURSES MIXED /
USA/JAPAN YEN 110.64 UP 0.071 (Abe’s new negative interest rate (NIRP), a total DISASTER/SIGNALS U TURN WITH INCREASED NEGATIVITY IN NIRP/JAPAN OUT OF WEAPONS TO FIGHT ECONOMIC DISASTER/
GBP/USA 1.3232 UP 0.0009 (Brexit March 29/ 2017/ARTICLE 50 SIGNED/BREXIT FEES WILL BE CAPPED
USA/CAN 1.3141 UP .0003 (CANADA WORRIED ABOUT TRADE WITH THE USA WITH TRUMP ELECTION/ITALIAN EXIT AND GREXIT FROM EU/(TRUMP INITIATES LUMBER TARIFFS ON CANADA/CANADA HAS A HUGE HOUSEHOLD DEBT/GDP PROBLEM)
Early THIS FRIDAY morning in Europe, the Euro ROSE by 17 basis points, trading now ABOVE the important 1.08 level RISING to 1.1709; / Last night Shanghai composite CLOSED UP 13.35 POINTS OR 0.49% /Hang Sang CLOSED UP 133.53 POINTS OR 0.47% /AUSTRALIA CLOSED UP 0.84% / EUROPEAN BOURSES MIXED /
The NIKKEI: this FRIDAY morning CLOSED UP 241.15 POINTS OR 1.12%
Trading from Europe and Asia
1/EUROPE OPENED ALL IN THE GREEN
2/ CHINESE BOURSES / :Hang Sang UP 133.52 POINTS OR 0.47% / SHANGHAI CLOSED UP 13.35 POINTS OR 0.49%
Australia BOURSE CLOSED UP 0.84%
Nikkei (Japan) CLOSED UP 241.15 POINTS OR 1.12%
INDIA’S SENSEX IN THE GREEN
Gold very early morning trading: 1254.45
silver:$16.00
Early FRIDAY morning USA 10 year bond yield: 2.83% !!! UP 0 IN POINTS from THURSDAY night in basis points and it is trading WELL ABOVE resistance at 2.27-2.32%. (POLICY FED ERROR)/
The 30 yr bond yield 2.95 UP 0 IN BASIS POINTS from THURSDAY night. (POLICY FED ERROR)/
USA dollar index early FRIDAY morning: 94.32 DOWN 7 CENT(S) from THURSDAY’s close.
This ends early morning numbers FRIDAY MORNING
xxxxxxxxxxxxxxxxxxxxxxxxxxxxxxxxxxxxxxxxxxxxxxxxxxxxxxxxxxxxxxxxxxxxxxxxxxxxxxxxxxxxxxxxxxxxxxxxxxxxxxxxxxxxxxx
And now your closing FRIDAY NUMBERS \1: 00 PM
Portuguese 10 year bond yield: 1.804% UP 1 in basis point(s) yield from THURSDAY/
JAPANESE BOND YIELD: +.033% DOWN 5/10 in basis points yield from THURSDAY/JAPAN losing control of its yield curve/
SPANISH 10 YR BOND YIELD: 1.309% DOWN 2 IN basis point yield from THURSDAY/
ITALIAN 10 YR BOND YIELD: 2.715 DOWN 1 POINTS in basis point yield from THURSDAY/
the Italian 10 yr bond yield is trading 140 points HIGHER than Spain.
GERMAN 10 YR BOND YIELD: FALLS TO +.292% IN BASIS POINTS ON THE DAY
END
xxxxxxxxxxxxxxxxxxxxxxxxxxxxxxxxxxxxxxxxxxxxxxxxxxxxxxxxxxxxxxxxxxxxxxxxxxxxxxxxxxxxxxxxxxxxxxxxxxxxxxxxxxxxxxxxxxxxxxxxxxxxxxxxxxxxx
IMPORTANT CURRENCY CLOSES FOR FRIDAY
Closing currency crosses for FRIDAY night/USA DOLLAR INDEX/USA 10 YR BOND YIELD/1:00 PM
Euro/USA 1.1739 UP .0048(Euro UP 48 Basis points/ represents to DRAGHI A COMPLETE POLICY FAILURE/
USA/Japan: 110,52 DOWN 0.047 Yen DOWN 12 basis points/
Great Britain/USA 1.3262 UP .0040-( POUND UP 40 BASIS POINTS)
USA/Canada 1.3091 DOWN .0048 Canadian dollar UP 48 Basis points AS OIL FELL TO $73.16
xxxxxxxxxxxxxxxxxxxxxxxxxxxxxxxxxxxxxxxxxxxxxxxxxxxxxxxxxxxxxxxxxxxxxxxxxxxxxxxx
This afternoon, the Euro was UP 48 to trade at 1.1739
The Yen FELL to 110.52 for a GAIN of 5 Basis points as NIRP is STILL a big failure for the Japanese central bank/HELICOPTER MONEY IS NOW DELAYED/BANK OF JAPAN NOW WORRIED AS AS THEY ARE RUNNING OUT OF BONDS TO BUY AS BOND YIELDS RISE
The POUND GAINED 39 basis points, trading at 1.32620/
The Canadian dollar GAINED 48 basis points to 1.3091/ WITH WTI OIL FALLING TO : $73.16
The USA/Yuan closed AT 6.6430
the 10 yr Japanese bond yield closed at +.033% DOWN 5/10 IN BASIS POINTS / yield/
Your closing 10 yr USA bond yield UP 1 IN basis points from TUESDAY at 2.838 % //trading well ABOVE the resistance level of 2.27-2.32%) very problematic USA 30 yr bond yield: 2.938 DOWN 1 in basis points on the day /
THE RISE IN BOTH THE 10 YR AND THE 30 YR ARE VERY PROBLEMATIC FOR VALUATIONS
Your closing USA dollar index, 94.06 DOWN 33 CENT(S) ON THE DAY/1.00 PM/
Your closing bourses for Europe and the Dow along with the USA dollar index closing and interest rates for FRIDAY: 1:00 PM
London: CLOSED UP 14.48 POINTS OR 0.19%
German Dax :CLOSED UP 31.88 OR 0.26%
Paris Cac CLOSED UP 9.45 POINTS OR 0.18%
Spain IBEX CLOSED UP 38.80 POINTS OR 0.39%
Italian MIB: CLOSED UP 11.22 POINTS OR 0.05%
The Dow closed UP 99.74 POINTS OR 0.41%
NASDAQ closed UP 101.96 points or 1.34% 4.00 PM EST
WTI Oil price; 73.16 1:00 pm;
Brent Oil: 77.11 1:00 EST
USA /RUSSIAN ROUBLE CROSS: 62.99 DOWN 15/100 ROUBLES/DOLLAR (ROUBLE HIGHER BY 15 BASIS PTS)
TODAY THE GERMAN YIELD RISES TO +.292% FOR THE 10 YR BOND 1.00 PM EST EST
END
This ends the stock indices, oil price, currency crosses and interest rate closes for today 4:30 PM
Closing Price for Oil, 4:00 pm/and 10 year USA interest rate:
WTI CRUDE OIL PRICE 4:30 PM:$73.93
BRENT: $77.09
USA 10 YR BOND YIELD: 2.82% the dropping yields signify markets are in turmoil
USA 30 YR BOND YIELD: 2.93%/
EURO/USA DOLLAR CROSS: 1.1743 UP .0051 ( UP 51 BASIS POINTS)
USA/JAPANESE YEN:110.46 down 0.112 (YEN UP 11 BASIS POINTS/ .
USA DOLLAR INDEX: 94.00 DOWN 39 cent(s)/
The British pound at 5 pm: Great Britain Pound/USA: 1.3287 UP 65 (FROM LAST NIGHT UP 65 POINTS)
Canadian dollar: 1.3096 UP 29 BASIS pts
German 10 yr bond yield at 5 pm: +,292%
VOLATILITY INDEX: 14.97 CLOSED DOWN 1.17
LIBOR 3 MONTH DURATION: 2.338% .
And now your more important USA stories which will influence the price of gold/silver
TRADING IN GRAPH FORM FOR THE DAY
‘War With China’ Sparks Surge In Stocks As
Policy Uncertainty Hits ‘Brexit’ Highs
Can’t allow stocks to signal that starting a trade war is anything but ‘making American great again’…
First things first, today’s actions by US, China, and Russia are not a positive and Economic Policy Uncertainty has exploded to its highest since Brexit…

And ‘hard’ US economic data is at its weakest since Nov 2017…

For now, it seems like China is suffering the most, Russia the least and US and Europe duking it out…

If Small Caps are up 3% in a week when Trump unleashes $34 billion in tariffs on China, imagine how much it will be up when he brings the full weight of his planned $500 billion tariffs…

S&P and Nasdaq best day since June 1st.
Futures show the craziness best as we kneejerked on the US tariff hit, then tumbled when China actually responded, then was panic bid again on rising unemployment rate and disappointing earnings growth, then tumbled into the close on a big MOC for sale…

Of course, it was a big fucking short-squeeze again…”most shorted” stocks up 4.5% from Monday’s low open…the biggest 2-day short-squeeze in a month.

And all you have to do is look at the bond market to know stocks are a farce…

The S&P 500’s monthly pattern continues to hold… The last two days are the biggest jump for the S&P in 2 months!

And in case you’re wondering what the driver of that is – it’s a cyclical short-squeeze…

The big banks surged early after trade war started but ended ugly…

Of course, FANG stocks were panic bid the last two days back into the green for the week…

While 2Y yields ended the week marginally higher, the rest of the curve fell notably (despite surging stocks)…

10Y yield close today was the lowest since May 29th’s plunge (and lowest weekly yield close since April)…

Which sent 2s30s to 37bps at its intraday lows – a new low since August 2007

10s30s tested single-digits…

The Dollar Index suffered its biggest weekly loss since March, erasing all the post-Fed/ECB spike gains…

Emerging Markets FX had their best week since February!!?? Because trade wars are great for developing nations…

Offshore Yuan’s freefall stalled as PBOC intervened midweek… (but this was the 4th weekly decline in a row – 10th week of last 12)

Crytpos managed to end the week positive (for a change) – best week for Bitcoin in 3 months

Ugly week for copper as PMs and crude were relatively unchanged on the week…

Copper has plunged to its lowest since July 2017…

Even CNBC anchors said “it’s curious to me that stocks are up so much on this, the first day of the trade war.”
But Bridgewater’s Ray Dalio summed it all ominously:
Ray Dalio
✔@RayDalio
Today is the first day of the war with China.
end
Jobs report and job related data
(courtesy zerohedge)
The official report; 213,000 job gains, stronger than expected but hours earnings again disappoint as does the huge increase in unemployment as the total unemployed rises from 6.065 million to 6.564 million or a gain in unemployed at 499,000 poor souls.
Payrolls Rise 213K, Stronger Than Expected But Hourly
Earnings Disappoint Again, Unemployment Rate Rises
Ahead of today’s payrolls report, there was some confusion: will Trump tweet about it (like he did last month), or won’t he, and if not, is it because the number will be a disappointment?
Well, moments ago the BLS gave us the answer, and contrary to whispers of a miss to the 195K consensus expectation, in June the US labor market continued to chug along, with some 213K jobs created, stronger than expected, while May’s +223K payrolls were also revised higher to +244K. According to the household survey, the number of people employed also rose from 155,474K to 155,576K, an increase of 102K workers, while the number of unemployed Americans jumped by 499K from 6.065MM to 6.564MM.

Going further back, The April payrolls change was revised up from +159Kto +175K. With these revisions, employment gains in April and May combined were 37,000 more than previously reported. After revisions, job gains have averaged 211,000 per month over the last 3 months.
Yet while the payrolls report was solid, there was some disappointment in the Average Hourly Earnings print, which missed expectations of a 2.8% Y/Y increases, rising by 72 cents or 2.7%, unchanged from last month, with the monthly increase of 0.2% also missing the expected number of 0.3%. Average hourly earnings of private-sector production and non-supervisory employees increased by 4 cents to $22.62 in June.

The average earnings number was a little bit better on a weekly basis, which saw a 3.0% increase, while weekly hours for all employees were as expected, and unchanged from last month’s 34.5. In manufacturing, the workweek edged up by 0.1 hour to 40.9 hours, and overtime edged up by 0.1 hour to 3.5 hours. The average workweek for production and nonsupervisory employees on private nonfarm payrolls remained at 33.8 hours.

Meanwhile, the broader unemployment rate also surprised, rising from 3.8% to 4.0%, missing consensus of an unchanged print (which may explain the lack of a Trump tweet)…

… with the rise in the unemployment rate largely a function of the increase in number of unemployed people, which increased from 6.065MM to 6.564MM, and the rise in the labor force participation rate, which edged higher from 62.7% to 62.9%

Some more details from the report:
Total nonfarm payroll employment increased by 213,000 in June and has grown by 2.4 million over the last 12 months. Over the month, job gains occurred in professional and business services, manufacturing, and health care, while employment in retail trade declined.
Employment in professional and business services increased by 50,000 in June and has risen by 521,000 over the year.
Manufacturing added 36,000 jobs in June. Durable goods manufacturing accounted for nearly all of the increase, including job gains in fabricated metal products (+7,000), computer and electronic products (+5,000), and primary metals (+3,000). Motor vehicles and parts also added jobs over the month (+12,000), after declining by 8,000 in May. Over the past year, manufacturing has added 285,000 jobs.
Employment in health care rose by 25,000 in June and has increased by 309,000 over the year. Hospitals added 11,000 jobs over the month, and employment in ambulatory health care services continued to trend up (+14,000).
Construction employment continued to trend up in June (+13,000) and has increased by 282,000 over the year.
Mining employment continued on an upward trend in June (+5,000). The industry has added 95,000 jobs since a recent low point in October 2016, almost entirely in support activities for mining.
In June, retail trade lost 22,000 jobs, largely offsetting a gain in May (+25,000).
Employment showed little or no change over the month in other major industries, including wholesale trade, transportation and warehousing, information, financial activities, leisure and hospitality, and government.
Overall, a farirly solid payrolls number, yet the miss in earnings may give the market room for pause and pressure the dollar, as the Fed may reevaluate if the economy – or at least wages – is indeed strong enough to sustain 2 more rate hikes in 2018.
June Jobs Increase: All Part-Time Workers As Full-Time
Jobs Drop
While the headline prints in today’s jobs report were solid with the exception of hourly earnings, which disappointed consensus expectations on both a monthly and annual basis, however not too dramatically earning the report a “goldilocks” name, a look below the surface reveals at least one ugly side to today’s jobs report: all the job gains were for part-time workers, while full-time employment dipped modestly.
In June, the number of part-time workers rose by 145K to 27.028MM, while the full-time workers declined by a modest 89K to 128.658MM.

On a longer-term basis, however, this month’s jump in part-time workers appears to be an outlier, with the bulk of job additions in the past year manifesting in the form of full time jobs.

Finally, the part-time print may merely be a statistical anomaly, because on an unadjusted basis full-time workers surged by over 900K, while part-timers actually dropped by just under 500K.
Still, this is a series worth keeping an eye on as an increase in part-time workers at the expense of full-timers may explain the ongoing inability of a tight labor market to translate into higher wages, which as a reminder, was the biggest disappointment in this jobs report.
end
We got an increase in good paying jobs but it looks like we reached peak jobs numbers. It will be downhill from here:
(courtesy zerohedge)
Where The Jobs Were In June: Who’s Hiring And
Who Isn’t
After years of monthly payroll reports padded with excessive minimum wage waiter, bartender, educator or retail worker jobs, the June jobs report was notable for its top-line beat, and which was the record 93rd straight month of US job growth, offset by strong, if disappointing, wage growth, which at 2.7% came in below than 2.8% expected, perhaps due to the preponderance of part-time jobs, but nonetheless showed continued “late cycle” strength in most components even if some negative surprises were also present.
Of note: while last month’s jobs report was truly impressive in terms of job gains by industry, with the highest paying adding the most workers, in June we saw a continuation of many of the trends observed last month:
- Continued strength in Goods Production: Mining (+4K), Construction (+13K) and especially manufacturing (+36K).
- Trade & Transportation Continued to Rebound: Wholesale (+2.9) and Truck Transportation (+2.5K).
Here the surprise was perhaps that just 2.5K trucking jobs were added, following complaints from the major trucking employers, all of whom have noted they can’t find enough people to hire, which suggests there may be an upward revision next month.
As Southbay Research notes, there were several other factors that actually depressed the seasonally adjusted number from rising as much as 250K, chief among them a sharply negative Seasonal Adjustment (-35K) which took some wind out of the June NFP sails. According to Southbay, “usually we can blame weather (as in 2016), but this is just BLS monkeying around.”

Some other highlights:
- Manufacturing (+36K): Up on auto (+12K) rebound after fire led to factory shutdowns
- Retail (-21K): Falls on weak Food (-9K) and weak Merchandise (-18K). Merchandise stores is Toys-R-Us bankruptcy layoffs
- Professional Services (+50K): Strong on the back of white collar technical workers (+25K). relatively weak Temp workers (+9K) suggests some weakness: either lack of supply (insufficient qualified workers at level of pay) or demand (employer demand is softer than surveys relate)
- Healthcare (+35K): Higher payrolls create more demand for healthcare
Visually:

Looking over the past year, the following charts from Bloomberg show the industries with the highest and lowest rates of employment growth for the prior year. The latest month’s figures are highlighted.

Finally, what trends can we observe from the latest report? As Southbay summarizes, “H1 2018 has been solid and June reinforced the strength”:
- Not Seasonally Adjusted payrolls are now the highest this business cycle.
- Year-to-date Payroll (seasonally adjusted) is 213K (vs 2017 181K).
But June itself had the same level of payroll adds (not seasonally adjusted) as last year 2017. So heading into 3Q, the economy is strong but may no longer be surging faster than it was last year, same time, according to Southbay. This may also mean that the peak benefit from Trump’s fiscal policy is now behind us and going forward it will only serve to depress the economic trendline.
END
Market trading
Last night:
the trade war begins at midnight
(courtesy zerohedge)
Shots Fired – US Futures Spike As US-China Trade
War Officially Begins
While Chinese markets are still closed for lunch, the announcement of US tariffs on China being officially unleashed – followed swiftly by China commenting that “it’s forced to retaliate” – has, of course, been met with a sudden wave of panic-buying in US equity futures…
Shots Fired
0001ET *U.S. TARIFFS ON CHINA TAKE EFFECT AS TRUMP TRADE WAR ESCALATES
0004ET *CHINA SAYS IT HAS TO FIGHT BACK
0006ET *CHINA SAYS IT’S FORCED TO RETALIATE ON U.S. TARIFFS
And Dow Futures spike 100 points…

What a farce – if this holds then Trump will be more than pleased to follow through with more hundreds of billions in tariffs – and new record highs for The Dow?
After early weakness, onshore- and offshore-Yuan are now spiking too…

‘Goldilocks’ Jobs Print Sparks Dollar Dump,
Bond & Stock Buying
Update: Maybe not so Goldilocks after all…

* * *
Amid the low liquidity of a holiday week, US equity futures continue to kneejerk up and down (up in this case) after a so-called ‘Goldilocks’ jobs print that was just bad enough to leave The Fed on its slow path to normalization. Bond yields and the dollar are also sliding…
Quite wild ride for Dow futures in the last 12 hours…

Treasuries are bid with 10Y yields at 2.80% – the lowest since May…

And the dollar has dropped to its lowest since mid-June’s Fed/ECB spike…

Market DATA
The trade deficit improves from 43.6 billion down to 43.1 billion as the USA exports more and imports less. However the trade imbalance with China increases from 30.8 billion dollars to 32 billion dollars. This will be a positive to GDP growth figures
(courtesy zerohedge)
US Trade Deficit Plunges Most In 10 Years – Is Trump Winning?
Confirming the advance trade balance, it could be argued – by those of a particular persuasion – that Trump’s trade policies are working as the US trade deficit has collapsed to its lowest since September 2016.
The US trade balance for May printed a smaller deficit than expected at $43.1 bn (vs $43.6bn exp) and well down from the revised $46.1bn in April.

This is the lowest trade deficit since October 2016 and biggest 3-month reduction in the deficit in 10 years.
Exports of goods and services climbed to a record high, outpacing a pickup in imports.
Under the hood, the biggest driver of the improvement was US soybean exports rose 90% MoM in May.
Overall exports increased 1.9 percent to $215.3 billion as soybean shipments overseas almost doubled to $4.1 billion. Exports of civilian aircraft, a category that tends to be volatile, rose $1.9 billion in May.
Imports rose 0.4 percent to $258.4 billion, boosted by a record value of capital goods shipments from overseas.
However, the report also showedthe trade gap with China, the world’s second-biggest economy, widened to $32 billion in May from $30.8 billion.

This is the biggest trade gap with China for a May since records began.
Finally, ex-Petroleum, this is the smallest trade deficit since March 2017…

We would expected to see GDP models updated positively shortly as improvement in the trade gap may be a positive for second- quarter growth.
end
USA ECONOMIC STORIES
A good commentary from Simon Black on the problems facing New Jersey. Citizens are fleeing the state because of high state taxes. As more and more people leave, what do they do? Raise taxes again and thus they signed their own death warrant
(courtesy zerohedge)
The State Of New Jersey Just Signed Its Own Death Warrant
Authored by Simon Black via SovereignMan.com,
You would think New Jersey would have learned its lesson…
Two years ago, New Jersey’s richest resident – hedge fund billionaire David Tepper – decided to move himself and his business to Miami Beach.
Tepper, who personally earned more than $6 billion from 2012-2015, was tired of paying New Jersey’s top income-tax rate of 8.97% for the 20 years he lived there, in addition to the country’s highest property taxes, the estate tax and inheritance tax.

By moving to Florida, a state with ZERO income tax, Tepper stood to save hundreds of millions of dollars each year. And, as an added bonus, he’d be living in the Sunshine State.
Anyone with some common sense would have at least acknowledged the possibility that a guy like Tepper would consider moving to save a few hundred million bucks.
But New Jersey, content on milking its ultra-wealthy for tax revenue, was caught completely by surprise.
And Tepper’s departure left an enormous hole in its budget.
Think about that: the departure of literally ONE person caused big problems for New Jersey’s budget.
And Tepper wasn’t the only one leaving…
According to the New Jersey Business and Industry Association, the State of New Jersey lost a whopping 2 million residents between 2005 and 2014, earning a combined $18 billion in net adjusted gross income, i.e. income that would have been taxed by the state.
So it’s not just the masters of the universe that are tired of paying sky-high taxes. It’s also the regular wage earner and small business owner.
60% of these folks went to Florida, with a state income tax of zero.
So the message from New Jersey’s residents (well, now former residents) is pretty clear: taxes are too high.
Now, what do you think New Jersey is doing to solve this problem?
Instead of making the state friendlier to productive people and businesses, New Jersey decided to RAISE taxes on the sad saps that remain within its borders (for now).
New Jersey tax residents making more than $5 million will now pay 10.75%, up from 8.97%.
And the corporate rate on businesses with more than $1 million in net income increased from 9% to 11.5%.
(Proportionally, that’s a potentially 27% increase in the amount of tax a business might pay.)
The tax hike will give Jersey the fourth-highest marginal income tax rate on individuals and the second highest corporate rate after Iowa.
It’s the exact opposite of what New Jersey should have done.
Sadly, New Jersey is not alone in chasing away its citizens.
In the 12 months ended July 1, 2017, the State of New York lost a net 190,508 residents (bringing the total loss to 1 million people since 2010 – the largest of any state).
And people are likewise fleeing the People’s Republic of California– and its top marginal tax rate of 13.3%– in droves.
Lots of them are landing in Texas (another state with no income tax)… an average 60,000 Californians left for Texas every year from 2011 to 2015.
Any government trying to keep their productive, high-earning residents from leaving by raising taxes is absolutely foolish.
Paying zero state income tax is more attractive than paying any state income tax, much less an even higher state income tax like in New Jersey. Duh.
On the other hand, you have Puerto Rico…
In order to attract more productive residents, Puerto Rico enacted a number of incentives including Act 20 and Act 22, which allow eligible business to pay a 4% corporate tax rate and individuals to pay ZERO taxes on capital gains and dividends, respectively.
We recently hosted our Total Access members (our highest level of membership) at an event in San Juan. The Secretary of State, the Secretary of Economic Development and Commerce and several other top government officials spent the day with us.
You can read more about the event, and Puerto Rico’s incredible incentives, here.
(Puerto Rico’s incentives are enormous, so I strongly encourage you to consider the option. To give you an example, I will easily save more than $10 million in tax due to these incentives. And it’s all 100% legal.)
No surprise, these generous tax incentives are working.
The Secretary of Economic Development and Commerce told us tax incentive applications are up more than 100% year over year. And it’s just getting started.
Unfortunately, Puerto Rico’s stance is unusual.
The normal route, as we saw with New Jersey, is to keep squeezing until they’ve chased out all the taxpayers. Governments have done this for thousands of years, even before the Roman Empire.
But New Jersey will soon learn that its residents aren’t tied to the land like medieval serfs in the feudal system. Governments still have this antiquated view, but it’s no longer valid.
Americans who want to legally avoid state income tax can easily move to Florida, Texas, and the handful of other states with no state income tax.
And those who want to legally avoid federal income tax can move to Puerto Rico.
Most other nationalities, including Canadians, Brits, Australians, etc. can also legally avoid their home country’s income tax by relocating overseas to a place like Panama or BVI.
And given how interconnected the world is, relocation needn’t cause any significant problems for a business.
It’s 2018. Businesses can exist entirely online. You can earn your money while living in one place, servicing clients in another, and outsourcing to workers in another.
And, if need be, you can always get on a plane and find yourself on the other side of the planet tomorrow morning for a face-to-face meeting.
This is the world we live in. We’re no longer medieval serfs. We have options.
It’s pretty sad that Puerto Rico is one of the only places to have figured it out.
To be fair, Puerto Rico did have to hit rock bottom financially before making this drastic change.
But I’d guess that New Jersey won’t be far behind.
end
SWAMP STORIES
today is the deadline for the FBI to come clean and provide the necessary emails
(courtesy zerohedge)
Today Is The Deadline For The FBI To “Come Clean”
The Wall Street Journal continues to counter the liberal mainstream media’s anti-Trump-ness, dropping uncomfortable truth-bombs, exposing the real ‘constitutional crisis’, and refusing to back off its intense pressure to get to the truth and hold those responsible, accountable; in a forum that is hard for the establishment to shrug off as ‘Alt-Right’ or ‘Nazi’ or be ‘punished’ by search- and social-media-giants.

And once again Kimberley Strassel – who by now has become the focus of social media attacks for her truth-seeking reporting – does it again this morning, as she asks – rhetorically, we assume – will the FBI come clean?
In the trench war between congressional Republicans and the Federal Bureau of Investigation, we have arrived at a crucial battle. A House resolution sets Friday as the deadline for the Justice Department to come clean on the beginning of its investigation into the Trump campaign. We’ll find out if the FBI has been lying to the public.
That is, if the department complies. It has flouted so many subpoenas, and played so many games with redactions and deadlines, that the entire House GOP united last week to vote for the resolution demanding submission to Congress’s requests for documents. The vote was an order but also a warning—that this is the last chance to comply, and the next step will be to hold officials in contempt. It is a measure of the stakes that even that threat doesn’t guarantee cooperation.
At issue is the FBI’s “origin story,” in which it claims its full-fledged investigation into a presidential campaign was conducted, as it were, by the book. According to this narrative, the FBI did not launch its probe until July 31, 2016, only after Australia tipped it to a conversation junior Trump aide George Papadopoulos had with Australian diplomat Alexander Downer in the spring of 2016 in London. Only after this formal commencement of a counterintelligence probe—Crossfire Hurricane—did the FBI begin to target U.S. citizens with spying, wiretapping and other tools usually reserved for foreign infiltrators. Or so the story goes.
This account, relayed by the New York Times in December 2017, has proved highly convenient for the FBI. The Australian “government” connection allowed the bureau to infuse the meaningless Papadopoulos conversation with significance, justifying the probe. The origin story suggested the FBI had followed procedure. Mostly, it countered the growing suspicion that the bureau had been snooping on a presidential campaign on the basis of truly disreputable info—a dossier of salacious information compiled by an opposition research firm working for the rival campaign.
The story is full of holes, and they are widening. No one has explained why two months passed between the Papadopoulos-Downer conversation and the July 31 probe. We’ve learned that it wasn’t Australian intelligence that passed along the info, but Mr. Downer personally, to State Department personnel in violation of procedure. And a growing list of Trump officials now relate moments when they were approached by suspicious figures before July 31.
That’s why congressional investigators have come to suspect the real origin story is very different. They believe the FBI was investigating Trump officials well before July 31, on the basis of the dossier and dubious information from State Department officials. They think the bureau was employing a variety of counterintelligence tools before there was an official counterintelligence probe—and that this included deploying spies against political actors. They suspect that only when the FBI decided that it wanted to obtain a Foreign Intelligence Surveillance Act warrant against Trump aide Carter Page (which requires an official investigation) did it surface the Downer information (collected back in May) and make it the official pretext in July.
This theory is at the heart of the standoff with the Justice Department, which focuses on FBI actions prior to July 31. I’m told that multiple senior congressional members have repeatedly asked Justice Department leadership to affirm that the department had provided Congress everything relevant with regard to the Trump investigation. The department has said yes. Yet investigators have credible evidence pointing to the use of FBI informants against the Trump campaign earlier than July 31, and last week’s resolution requires the department to answer whether that is true, and if so, on what basis they were used.
The FBI and its media allies have waged a ceaseless campaign to lower the bar on what counts as appropriate.
We are told it is OK that the government opened a counterintelligence probe into a presidential campaign. OK that it obtained a warrant to spy on a U.S. citizen. OK that it based that warrant on an unverified dossier from the Democratic campaign, and then hid that true origin from the FISA court. OK that it paid a spy to target domestic political actors.
It’s not OK. Not so long ago, the FBI would have quailed at the idea of running an informant into any U.S. political operation—even into, say, a congressman under criminal investigation for bribery or corruption. These are the most sensitive of lines. But Mr. Trump’s opponents, in government and media, have a boundless capacity to justify any measures against the president.
And finally, Strassel has some advice on how to resolve this… Mr. Trump has an even quicker way to bring the hostility to an end.
If it turns out that the Justice Department and FBI lied about how and when this all started, that is scandalous. Worse if it comes out that senior officials lied to Congress about whether they had complied with its demands for information. And once again, it is a reason for Mr. Trump to step in and declassify everything.
Just what will the deep state do to avoid this eventuality? Do they have anything left to throw at Trump?

-END-
Here comes the first emails and they are dandies. They reveal that the FBI were scrambling to find dirt so that they could question people who interact with the President
I think this is prima facie evidence of political bias and then official actions just got connected.
(courtesy zerohedge)
“Hurry The F Up”: New Strzok-Page Email Reveals FBI Scramble For Dirt On Trump Campaign
Congressional investigators have received a trove of new communications between embattled FBI agent Peter Strzok and his counterintelligence team which reveal “troubling” evidence that the FBI was rushing at breakneck speed to dig up any possible dirt on the Trump campaign, reports The Hill‘s John Solomon, after the communications were described to him.

Memos the FBI is now producing to the Department of Justice (DOJ) inspector general and multiple Senate and House committees offer what sources involved in the production, review or investigation describe to me as “damning” or “troubling” evidence.
They show Strzok and his counterintelligence team rushing in the fall of 2016 to find “derogatory” information from informants, or a “pretext” to accelerate the probe and get a surveillance warrant on figures tied to the future president. –The Hill
One of the FBI’s targets, of course, was Trump campaign aide Carter Page – an energy consultant from New York who briefly volunteered as a foreign policy adviser for the GOP nominee’s campaign, and who visited Moscow the summer prior to the election.
The new batch of messages reveal Strzok, his reported lover, former FBI attorney Lisa Page, and others on the counterintelligence team monitoring news articles in September 2016 which revealed that the FBI was probing Page’s Moscow trip.
Said news articles prompted Page to send a letter to then-FBI director James Comey to complain about the “completely false leak,” which Strzok and Page then seized on as a “pretext” to sink their hooks into the Trump adviser.
“At a minimum, the letter provides us a pretext to interview,” Strzok wrote to Lisa Page on Sept. 26, 2016.
Within weeks, that “pretext” — often a synonym for an excuse — had been upsized to a Foreign Intelligence Surveillance Act (FISA) court warrant, giving the FBI the ability to use some of its most awesome powers to monitor Carter Page and his activities.
To date, the former Trump adviser has been accused of no wrongdoing despite being subjected to nearly a year of surveillance. –The Hill
More internal FBI memos shed light on the frustrations Strzok shared with Page over the Department of Justice (DOJ)’s slow response time. In one email exchange with the subject line “Crossfire FISA,” Strzok and Page strategized on the best way to get former FBI Deputy Director Andrew McCabe to convince a high-ranking DOJ official to sign off on the FISA warrant to spy on Page.
“At a minimum, that keeps the hurry the F up pressure on him,” Strzok emailed Lisa Page on Oct. 14, 2016, less than four weeks before Election Day.
Four days later the same team was emailing about rushing to get approval for another FISA warrant for another Russia-related investigation code-named “Dragon.”
“Still an expedite?” one of the emails beckoned, as the FBI tried to meet the requirements of a process known as a Woods review before a FISA warrant can be approved by the courts.
“Any idea what time he can have it woods-ed by?” Strzok asked Lisa Page. “I know it’s not going to matter because DOJ is going to take the time DOJ wants to take. I just don’t want this waiting on us at all.” –The Hill
As The Hill’s Solomon points out, there are multiple ongoing reviews of whether FBI agents’ political bias affected the Trump-Russia collusion case. Until all the reviews are complete, we won’t know exactly why the counterintelligence team “who normally take a methodical approach to investigation” were in such a mad scramble to find dirt on Trump – though we have our suspicions.
Were they concerned about losing a chance to gather evidence at a critical moment? Or maybe, as some Republicans long have suspected, they wanted to impact the election? -John Solomon
Two weeks after the “hurry the F up pressure” was a success and the agents got their FISA warrant for Page in October, 2016 – Democrats in congress such as then-Sen. Harry Reid (D-NV) along with many in the MSM were talking about the FBI “withholding word of a probe” that could hurt Trump. Solomon reports that the FBI agents monitored these reports as well.
After Trump won
In another batch of FBI emails between Strzok and Page the day after Trump’s upset win on November 9, 2016 – the two discuss a new mission to dig into Trump’s team.
“We need ALL of their names to scrub, and we should give them ours for the same purpose,” Strzok emailed Lisa Page on Nov. 10, 2016, citing a Daily Beast article about some of former Trump campaign chairman Paul Manafort’s allegedly unsavory ties overseas.
“Andy didn’t get any others,” Lisa Page wrote back, apparently indicating then-Deputy Director McCabe didn’t have names to add to the “scrub.”
“That’s what Bill said,” Strzok wrote back, apparently referring to then-FBI chief of counterintelligence William Priestap. “I suggested we need to exchange our entire lists as we each have potential derogatory CI info the other doesn’t.” CI is short for confidential informants. –The Hill
And as John Solomon notes, “It’s an extraordinary exchange, if for no other reason than this: The very day after Trump wins the presidency, some top FBI officials are involved in the sort of gum-shoeing normally reserved for field agents, and their goal is to find derogatory information about someone who had worked for the president-elect.”
As the Trump administration prepared for the post-election transition into the White House, the FBI made yet another odd move which has captured the attention of congressional investigators: “It named an executive with expertise in the FBI’s most sensitive surveillance equipment to be a liaison to the Trump transition.”
This is odd – as agents skilled in technical surveillance and espionage typically aren’t the first picks for “plum political assignments,” as Solomon writes. Even more odd was that the FBI counterintelligence team in charge of the Trump-Russia collusion probe were involved in the liaison’s appointment.
As Solomon notes:
Yet, now, irrefutable proof exists that agents sought to create pressure to get “derogatory” information and a “pretext” to interview people close to a future president they didn’t like.
Clear evidence also exists that an investigation into still-unproven collusion between a foreign power and a U.S. presidential candidate was driven less by secret information from Moscow and more by politically tainted media leaks.
And that means the dots between expressions of political bias and official actions just got a little more connected.
We’re sure all that and more will be outlined in “damning” detail in the upcoming Inspector General’s report on FISA abuse, which will then conclude that the Boy and Girl Scouts at the FBI were able to compartmentalize their bias.
end
Nunes expands the investigation of Spygate and other aspects of the Dossier and sent three letters outlining who to interview
(courtesy zerohedge)
Nunes Expands SpyGate Probe To House, Oversight Committees; Refers Dozens For Public Testimony
House Intelligence Committee chairman Devin Nunes (R-CA) has been a busy man.
In a Thursday letter to two fellow GOP chairmen, Nunes referred 15 people connected to the Russia investigation to testify in an “open setting.” Many of those on the list are tied directly to Hillary Clinton, Fusion GPS and the infamous “Steele dossier” – a collection of 17 memos full of compromising yet unverified claims about President Trump’s ties to Russia.

The names on the list include Sidney Blumenthal, Fusion GPS founders Glenn Simpson and Thomas Catan, Perkins Coie attorney Marc Elias, and former FBI agent and Feinstein staffer Daniel Jones, who is spearheading a $50 million Soros-funded effort to continue the Trump-Russia investigation with Fusion GPS and Steele.
The Steele dossier was compiled by former MI6 spy Christopher Steele on behalf of opposition research firm Fusion GPS, and was funded in part by Hillary Clinton and the DNC.
The Thursday letter to GOP House Chairmen Trey Gowdy and Bob Goodlatte is the third sent by Nunes in recent days referring people to Congressional panels in what appears to be a massive expansion of the “SpyGate” probe into the FBI/DOJ counterintelligence operation against the Trump campaign surrounding the 2016 US election.
All together, Nunes has referred 42 people to Gowdy and Goodlatte – highlighting that the individuals likely fall under the scope of their joint task force. Moreover, he’s not about to let them wiggle out of testimony.
“They can plead the Fifth,” Nunes told Fox News host Laura Ingraham. “This isn’t going to be like the documents where we’ve had to continue to fight with the Justice Department in order to have access to documents. This is much different. These are all American citizens. They will, if they do not agree to appear under oath, and testify, then they will be subpoenaed. That I could tell you for sure.”
What is Nunes up to?
As the Washington Examiner‘s Byron York notes, Nunes is up to something.
The short version is that the investigation is expanding to the two additional committees, even as Nunes devotes his own committee’s resources to learning whether the FBI used informants against the 2016 Trump campaign and, if so, how many, when, and how much money was spent on the project.
…
In the last week Nunes has sent three letters to Goodlatte and Gowdy, each recommending a number of people that the task force should interview. The first letter focused on current and former officials of the Justice Department and FBI, 17 in all, whose actions formed the focus of the first phase of Nunes’ investigation, on the Trump dossier. The second letter focused on current and former officials of the State Department and some other agencies, 10 in all, whose role in the dossier and other matters formed the second part of Nunes’ probe. And the third letter focused on people outside of government, 15 in all, whose names have popped up throughout the investigation. –Washington Examiner
So Nunes has sent three letters encircling three specific categories of individuals involved in the Trump-Russia investigation in some way or another, and has recommended that either Judiciary or Oversight committees interview each person.
Clock’s ticking
As York also points out, there is a very real risk that the House may return to Democrat control after midterm elections.
And if Democrats take over the House, there will be no more Republican chairmen. There will be no more Republican subpoenas, no more demands that Fusion GPS figures testify. The Intelligence, Judiciary, and Oversight committees will likely be run by Adam Schiff, Jerrold Nadler, and Elijah Cummings, or in any event by Democrats. It would be an understatement to say the committees’ investigative focus will radically change. The current GOP committee leadership has done a lot in the last year. But their time might be running out. –Byron York
Read Thursday’s referral below:
WE WILL SEE YOU ON MONDAY NIGHT.
HARVEY


