
GOLD:$1714.80 DOWN $0.30 The quote is London spot price
Silver:$17.67 UP 3 CENTS//LONDON SPOT PRICE
Closing access prices: London spot
i)Gold : $1738.00 LONDON SPOT 4:30 pm
ii)SILVER: $18.10//LONDON SPOT 4:30 pm
CLOSING FUTURES PRICES: KEY MONTHS
AUG GOLD: $1720.70 CLOSE 1.30 PM// SPREAD SPOT (LONDON) VS/FUTURE JUNE: $+5.90
CLOSING SILVER FUTURE MONTH
JULY: 1:30 PM: $17.79//1:30 PM //SPREAD SPOT LONDON VS FUTURE JULY: 12 CENTS PER OZ//
the gold market continues to be broken as future prices are much higher than spot prices. The comex is desperate to fix things but they have no available gold.
If one is to buy gold and or gold coins, the price is around $2800. usa per oz
and silver; $31.00 per oz//
LADIES AND GENTLEMEN: YOU ARE NOW WITNESSING FIRST HAND THE DIFFERENCE BETWEEN PAPER GOLD/SILVER AND THE REAL PHYSICAL STUFF!!
DO NOT PAY ANY ATTENTION TO WHAT THE CROOKS ARE DOING AT THE COMEX AND LONDON LBMA..PHYSICAL IS THE NAME OF THE GAME AND NOTHING ELSE
COMEX DATA
JPMorgan has been receiving gold with reckless abandon and sometimes supplying (stopping)
today RECEIVING: 845/1282
issued 276
EXCHANGE: COMEX
CONTRACT: JUNE 2020 COMEX 100 GOLD FUTURES
SETTLEMENT: 1,714.700000000 USD
INTENT DATE: 06/09/2020 DELIVERY DATE: 06/11/2020
FIRM ORG FIRM NAME ISSUED STOPPED
____________________________________________________________________________________________
072 C GOLDMAN 21
072 H GOLDMAN 115
104 C MIZUHO 2
118 H MACQUARIE FUT 25
132 C SG AMERICAS 3
167 C MAREX 1
190 H BMO CAPITAL 12
323 H HSBC 3
355 C CREDIT SUISSE 12
357 C WEDBUSH 1 2
555 C BNP PARIBAS SEC 1
555 H BNP PARIBAS SEC 800
624 C BOFA SECURITIES 31
657 C MORGAN STANLEY 55
657 H MORGAN STANLEY 57
661 C JP MORGAN 276 813
661 H JP MORGAN 82
685 C RJ OBRIEN 1
686 C INTL FCSTONE 89 1
690 C ABN AMRO 66 16
732 C RBC CAP MARKETS 2
737 C ADVANTAGE 2
800 C MAREX SPEC 7 10
845 C GOLDMAN SACHS C 1
880 C CITIGROUP 1
905 C ADM 43 13
____________________________________________________________________________________________
TOTAL: 1,282 1,282
MONTH TO DATE: 48,757
NUMBER OF NOTICES FILED TODAY FOR JUNE CONTRACT: 1282 NOTICE(S) FOR 128,200 OZ (3.987 tonnes)
TOTAL NUMBER OF NOTICES FILED SO FAR: 48,757 NOTICES FOR 4,875,700 OZ (151.657 TONNES)
SILVER
FOR JUNE
0 NOTICE(S) FILED TODAY FOR nil OZ/
total number of notices filed so far this month: 418 for 2,090,000 oz
BITCOIN MORNING QUOTE $9724 DOWN $51
BITCOIN AFTERNOON QUOTE.: $9862 UP 90
GLD AND SLV INVENTORIES:
WITH GOLD DOWN $.30 AND NO PHYSICAL TO BE FOUND ANYWHERE:
WITH ALL REFINERS CLOSED//MEXICO ORDERING ALL MINES SHUT: WHERE ARE THEY GETTING THE “PHYSICAL”?
A HUGE 4.02 TONNES OF GOLD DEPOSITED INTO THE GLD/
GLD: 1,129.50 TONNES OF GOLD//
WITH SILVER UP 3 CENTS TODAY: AND WITH NO SILVER AROUND
RESTING SLV INVENTORY TONIGHT:
SLV: 472.849 MILLION OZ./
XXXXXXXXXXXXXXXXXXXXXXXXX
Let us have a look at the data for today
xxxxxxxxxxxxxxxxxxxxxxxxxxxxxxxxxxxxxxxxxxxxxxxxxxxxxxxxxxxxxxxxxxxxxxxxxx
IN SILVER THE COMEX OI ROSE BY A STRONG SIZED 3788 CONTRACTS FROM 171,452 UP TO 175,240 AND CLOSER TO OUR NEW RECORD OF 244,710, (FEB 25/2020. THE STRONG SIZED GAIN IN OI OCCURRED WITH OUR SMALL 6 CENT LOSS IN SILVER PRICING AT THE COMEX. IT SEEMS THAT THE GAIN IN COMEX OI IS DUE TO STRONG BANKER SHORT COVERING PLUS A FAIR EXCHANGE FOR PHYSICAL ISSUANCE, ZERO LONG LIQUIDATION, ACCOMPANYING A ZERO INCREASE IN SILVER OZ STANDING AT THE COMEX FOR JUNE. WE HAD A NET GAIN IN OUR TWO EXCHANGES OF 4284 CONTRACTS (SEE CALCULATIONS BELOW).
WE HAVE ALSO WITNESSED A HUMONGOUS AMOUNT OF PHYSICAL METAL STAND FOR COMEX DELIVERY AS WELL WE ARE WITNESSING CONSIDERABLE LONGS PACKING THEIR BAGS AND MIGRATING OVER TO LONDON IN GREATER NUMBERS IN THE FORM OF EFP’S. WE WERE NOTIFIED THAT WE HAD A FAIR SIZED NUMBER OF COMEX LONGS TRANSFERRING THEIR CONTRACTS TO LONDON THROUGH THE EFP ROUTE: MAY: 0 AND JULY: 500 AND SEPT 0 FOR ZERO ALL OTHER MONTHS AND THEREFORE TOTAL ISSUANCE 500 CONTRACTS. WITH THE TRANSFER OF 500 CONTRACTS, WHAT THE CME IS STATING IS THAT THERE IS NO SILVER (OR GOLD) TO BE DELIVERED UPON AT THE COMEX AS THEY MUST EXPORT THEIR OBLIGATION TO LONDON. ALSO KEEP IN MIND THAT THERE CAN BE A DELAY OF 24-48 HRS IN THE ISSUING OF EFP’S. THE 225 EFP CONTRACTS TRANSLATES INTO 2.500 MILLION OZ ACCOMPANYING:
1.THE 6 CENT LOSS IN SILVER PRICE AT THE COMEX AND
2. THE STRONG AMOUNT OF SILVER OUNCES WHICH STOOD FOR DELIVERY IN THE LAST 12 MONTHS:
JUNE/2018. (5.420 MILLION OZ);
FOR JULY: 30.370 MILLION OZ
FOR AUG., 6.065 MILLION OZ
FOR SEPT. 39.505 MILLION OZ S
FOR OCT.2.525 MILLION OZ.
FOR NOV: A HUGE 7.440 MILLION OZ STANDING AND
21.925 MILLION OZ FINALLY STAND FOR DECEMBER.
5.845 MILLION OZ STAND IN JANUARY.
2.955 MILLION OZ STANDING FOR FEBRUARY.:
27.120 MILLION OZ STANDING IN MARCH.
3.875 MILLION OZ STANDING FOR SILVER IN APRIL.
18.845 MILLION OZ STANDING FOR SILVER IN MAY.
2.660 MILLION OZ STANDING FOR SILVER IN JUNE//
22.605 MILLION OZ STANDING FOR JULY
10.025 MILLION OZ INITIAL STANDING IN AUGUST.
43.030 MILLION OZ INITIALLY STANDING IN SEPT. (HUGE)
7.32 MILLION OZ INITIALLY STANDING IN OCT
2.630 MILLION OZ STANDING FOR NOV.
20.970 MILLION OZ FINAL STANDING IN DEC
5.075 MILLION OZ FINAL STANDING IN JAN
1.480 MILLION OZ FINAL STANDING IN FEB
23.005 MILLION OZ FINAL STANDING FOR MAR
4.660 MILLION OZ FINAL STANDING FOR APRIL
45.220 MILLION OZ FINAL STANDING FOR MAY
2.145 MILLION OF INITIALLY STANDING FOR JUNE
TUESDAY, AGAIN OUR CROOKS USED COPIOUS PAPER IN ORDER TO LIQUIDATE SILVER’S PRICE…AND THEY WERE SUCCESSFUL IN KNOCKING THE PRICE OF SILVER DOWN (IT FELL 6 CENTS).. AND,OUR OFFICIAL SECTOR/BANKERS WERE UNSUCCESSFUL IN THEIR ATTEMPT TO FLEECE ANY SILVER LONGS FROM THEIR POSITIONS. THE CONSIDERABLE GAIN AT THE COMEX WAS ACCOMPANIED BY : i) A FAIR ISSUANCE OF EXCHANGE FOR PHYSICALS 2) A ZERO INCREASE IN SILVER OZ STANDING CONSIDERABLE BANKER SHORT COVERING AND 4) ZERO LONG LIQUIDATION AS WE DID HAVE A STRONG NET GAIN OF 3918 CONTRACTS OR 19.590 MILLION OZ ON THE TWO EXCHANGES! YOU CAN BET THE FARM THAT OUR BANKER ARE DESPERATE TO LIQUIDATE THEIR HUGE SHORT POSITIONS IN SILVER
SPREADING OPERATIONS
OUR SPREADING OPERATION HAS NOW SWITCHED INTO SILVER…..
SPREADING OPERATION FOR OUR NEWCOMERS:
FOR NEWCOMERS, HERE ARE THE DETAILS:
SPREADING LIQUIDATION HAS NOW COMMENCED IN SILVER AS WE HEAD TOWARDS THE NEW ACTIVE FRONT MONTH OF JULY.
FOR THOSE OF YOU WHO ARE NEW, HERE IS THE MODUS OPERANDI OF THE SPREADERS AND THE CRIMINAL ELEMENT BEHIND IT:
HERE IS A BRIEF SYNOPSIS OF HOW THE CROOKS FLEECE UNSUSPECTING LONGS IN THE SPREADING ENDEAVOUR;
THE SPREADING LIQUIDATION OPERATION IS NOW OVER FOR GOLD..AND WE WILL NOW MORPH INTO AN ACCUMULATION PHASE OF SPREADING CONTRACTS FOR SILVER. THEY WILL ACCUMULATE CONSIDERABLE AMOUNT OF THE CONTRACTS AND THEN LIQUIDATE ONE WEEK PRIOR TO FIRST DAY NOTICE
MODUS OPERANDI OF THE CORRUPT BANKERS AS TO HOW THEY HANDLE THEIR SPREAD OPEN INTERESTS:
.
AS I HAVE MENTIONED IN PREVIOUS COMMENTARIES:
“AS YOU WILL SEE, THE CROOKS WILL NOW SWITCH TO SILVER AS THEY INCREASE THE OPEN INTEREST FOR THE SPREADERS. THE TOTAL COMEX SILVER OPEN INTEREST WILL RISE FROM NOW ON UNTIL ONE WEEK PRIOR TO FIRST DAY NOTICE AND THAT IS WHEN THEY START THEIR CRIMINAL LIQUIDATION.
HERE IS HOW THE CROOKS USED SPREADING AS WE ARE NOW INTO THE NON ACTIVE DELIVERY MONTH OF JUNE HEADING TOWARDS THE ACTIVE DELIVERY MONTH OF JULY FOR SILVER:
YOU WILL ALSO NOTICE THAT THE COMEX OPEN INTEREST STARTS TO RISE IN THIS NON ACTIVE MONTH OF JUNE. BUT SO IS THE OPEN INTEREST OF SPREADERS. THE OPEN INTEREST IN SILVER WILL CONTINUE TO RISE UNTIL ONE WEEK BEFORE FIRST DAY NOTICE OF AN UPCOMING ACTIVE DELIVERY MONTH (JULY), AND THAT IS WHEN THE CROOKS SELL THEIR SPREAD POSITIONS BUT NOT AT THE SAME TIME OF THE DAY. THEY WILL USE THE SELL SIDE OF THE EQUATION TO CREATE THE CASCADE (ALONG WITH THEIR COLLUSIVE FRIENDS) AND THEN COVER ON THE BUY SIDE OF THE SPREAD SITUATION AT THE END OF THE DAY. THEY DO THIS TO AVOID POSITION LIMIT DETECTION. THE LIQUIDATION OF THE SPREADING FORMATION CONTINUES FOR EXACTLY ONE WEEK AND ENDS ON FIRST DAY NOTICE.”
HISTORICAL ACCUMULATION OF EXCHANGE FOR PHYSICALS
JUNE
ACCUMULATION FOR EFP’S/SILVER/J.P.MORGAN’S HOUSE OF BRIBES, / STARTING FROM FIRST DAY /FOR MONTH OF JUNE:
3862 CONTRACTS (FOR 9 TRADING DAY(S) TOTAL 3862CONTRACTS) OR 19.310 MILLION OZ: (AVERAGE PER DAY: 429 CONTRACTS OR 2.155 MILLION OZ/DAY)
TO GIVE YOU AN IDEA AS TO THE HUGE SUPPLY THIS MONTH IN SILVER: SO FAR THIS MONTH OF MAY: 19.310 MILLION PAPER OZ HAVE MORPHED OVER TO LONDON. THIS REPRESENTS AROUND 3.08% OF ANNUAL GLOBAL PRODUCTION (EX CHINA EX RUSSIA)* JUNE’S 345.43 MILLION OZ IS THE SECOND HIGHEST RECORDED ISSUANCE OF EFP’S AND IT FOLLOWED THE RECORD SET IN APRIL 2018 OF 385.75 MILLION OZ.
ACCUMULATION IN YEAR 2020 TO DATE SILVER EFP’S: 1,085.42 MILLION OZ.
JANUARY 2020 EFP TOTALS SO FAR: 181.61 MILLION OZ
FEB 2020 EFP’S TOTAL : …… 259.600 MILLION OZ
MARCH EFP’S ….. 452.280 MILLION OZ //TOTALS//AND A NEW RECORD FOR THE MONTH)
APRIL EFP 95.355 MILLION OZ. (EX. FOR PHYSICALS BECOMING A LOT LESS)
MAY EFP FINAL: 77.27 MILLION OZ
JUNE EXP SO FAR 19.310 MILLION OZ.
EXCHANGE FOR PHYSICAL ISSUANCE FOR THE PAST 60 DAYS IS A LOT LESS. NO DOUBT THAT THE COST TO CARRY THESE THINGS HAS EXPLODED AND AS SUCH CANNOT BE DONE AS FREQUENTLY AS BEFORE.
RESULT: WE HAD AN EXTREMELY LARGE SIZED INCREASE IN COMEX OI SILVER COMEX CONTRACTS OF 3788, DESPITE OUR 6 CENT GAIN IN SILVER PRICING AT THE COMEX ///TUESDAY… THE CME NOTIFIED US THAT WE HAD A TINY SIZED EFP ISSUANCE OF 130 CONTRACTS WHICH EXITED OUT OF THE SILVER COMEX AND TRANSFERRED THEIR OI TO LONDON AS FORWARDS. SPECULATORS CONTINUED THEIR INTEREST IN ATTACKING THE SILVER COMEX FOR PHYSICAL SILVER
TODAY WE GAINED A STRONG SIZED OI CONTRACTS ON THE TWO EXCHANGES: 3918 CONTRACTS (DESPITE OUR 6 CENT LOSS IN PRICE)
THE TALLY//EXCHANGE FOR PHYSICALS
i.e 130 OPEN INTEREST CONTRACTS HEADED FOR LONDON (EFP’s) TOGETHER WITH A LARGE SIZED INCREASE OF 3788 OI COMEX CONTRACTS. AND ALL OF THIS DEMAND HAPPENED DESPITE A 6 CENT LOSS IN PRICE OF SILVER/AND A CLOSING PRICE OF $17.64 // TUESDAY’S TRADING. YET WE STILL HAVE A STRONG AMOUNT OF SILVER STANDING AT THE COMEX FOR DELIVERY.
In ounces AT THE COMEX, the OI is still represented by JUST UNDER 1 BILLION oz i.e. 0.846 BILLION OZ TO BE EXACT or 121% of annual global silver production (ex Russia & ex China).
FOR THE NEW JUNE DELIVERY MONTH/ THEY FILED AT THE COMEX: 0 NOTICE(S) FOR nil OZ OF SILVER.
IN SILVER,PRIOR TO TODAY, WE SET THE NEW COMEX RECORD OF OPEN INTEREST AT 244,196 CONTRACTS ON AUG 22.2018. AND AGAIN THIS HAS BEEN SET WITH A LOW PRICE OF $14.70//TODAY’S RECORD OF 244,705 IS SET WITH A PRICE OF: 18.91 (FEB 25/2020)
.
ON THE DEMAND SIDE WE HAVE THE FOLLOWING:
- HUGE AMOUNTS OF SILVER STANDING FOR DELIVERY (MARCH/2018: 27 MILLION OZ , APRIL/2018 : 2.485 MILLION OZ MAY: 36.285 MILLION OZ ; JUNE/2018 (5.420 MILLION OZ) , JULY 2018 FINAL AMOUNT STANDING: 30.370 MILLION OZ ) FOR AUGUST 6.065 MILLION OZ. , SEPT: A HUGE 39.505 MILLION OZ./ OCTOBER: 2,520,000 oz NOV AT 7.440 MILLION OZ./ DEC. AT 21.925 MILLION OZ JANUARY AT 5.825 MILLION OZ.AND FEB 2019: 2.955 MILLION OZ/ MARCH: 27.120 MILLION OZ/ APRIL AT 3.875 MILLION OZ/ A MAY: 18.845 MILLION OZ ..JUNE 2.660 MILLION OZ//JULY 22.605 MILLION OZ; AUGUST 10.025 MILLION OZ/ SEPT 43.030 MILLION OZ//OCT: 7.665 MILLION OZ// NOV: 2.630 MILLION OZ//DEC: 20.970 MILLION OZ; JAN: 5.075 MILLION OZ.//FEB 1.480 MILLION OZ//MAR: 23.005 MILLION OZ/APRIL 4.660 MILLION OZ//MAY 45.220 MILLION OZ//JUNE: 2.145 MILLION OZ//
- THE RECORD PRIOR TO TODAY WAS SET IN FEB 25/2018: 244,710 CONTRACTS, WITH A SILVER PRICE OF $18.90//.
- HUGE ANNUAL EFP’S ISSUANCE EQUAL TO 2.9 BILLION OZ OR 400% OF SILVER ANNUAL PRODUCTION/2017 RECORD SETTING EFP ISSUANCE FOR ANY MONTH IN SILVER; APRIL/2018/ 385.75 MILLION OZ/ AND THE SECOND HIGHEST RECORDED EFP ISSUANCE JUNE 2018 345.43 MILLION OZ
AND YET, WITH THE EXTREMELY HIGH EFP ISSUANCE, WE HAVE A CONTINUAL LOW PRICE OF SILVER DESPITE THE ABOVE HUGE DEMAND. TO ME THE ONLY ANSWER IS THAT WE HAVE SOVEREIGN (CHINA) WHO IS ENDEAVOURING TO GOBBLE UP ALL AVAILABLE PHYSICAL SILVER NO MATTER WHERE, EXACTLY WHAT J.P.MORGAN IS DOING. AND IT IS MY BELIEF THAT J.P.MORGAN IS HOLDING ITS SILVER FOR ITS BENEFICIAL OWNER..THE USA GOVERNMENT WHO IN TURN IS HOLDING THAT SILVER FOR CHINA.(FOR A SILVER LOAN REPAYMENT)
GOLD
IN GOLD, THE COMEX OPEN INTEREST ROSE BY A GOOD 5768CONTRACTS TO 475,661 AND CLOSER TO OUR NEW RECORD (SET JAN 24/2020) AT 799,541 AND PREVIOUS TO THAT: (SET JAN 6/2020) AT 797,110.
THE CONSIDERABLE SIZED GAIN OF COMEX OI OCCURRED WITH OUR STRONG GAIN IN PRICE OF $16.00 /// COMEX GOLD TRADING// TUESDAY// WE HAD STRONG BANKER SHORT COVERING, ANOTHER HUMONGOUS SIZED INCREASE IN GOLD OZ STANDING AT THE COMEX, ALONG WITH ZERO LONG LIQUIDATION ACCOMPANYING A FAIR EX. FOR PHYSICAL ISSUANCE. THIS ALL HAPPENED WITH OUR STRONG GAIN IN PRICE OF $16.00 .
WE HAD A VOLUME OF 0 4 -GC CONTRACTS//OPEN INTEREST 8
WE GAINED A STRONG SIZED 9455 CONTRACTS (29.40 TONNES) ON OUR TWO EXCHANGES.
E.F.P. ISSUANCE
THE CME RELEASED THE DATA FOR EFP ISSUANCE AND IT TOTALED A GOOD SIZED 3687 CONTRACTS:
CONTRACT JUNE 0.; AUG 3687 AND ALL OTHER MONTHS ZERO//TOTAL: 3687. The NEW COMEX OI for the gold complex rests at 475,661. ALSO REMEMBER THAT THERE WILL BE A DELAY IN THE ISSUANCE OF EFP’S. THE BANKERS REMOVE LONG POSITIONS OF COMEX GOLD IMMEDIATELY. THEN THEY ORCHESTRATE THEIR PRIVATE EFP DEAL WITH THE LONGS AND THAT COULD TAKE AN ADDITIONAL, 48 HRS SO WE GENERALLY DO NOT GET A MATCH WITH RESPECT TO DEPARTING COMEX LONGS AND NEW EFP LONG TRANSFERS. . EVEN THOUGH THE BANKERS ISSUED THESE MONSTROUS EFPS, THE OBLIGATION STILL RESTS WITH THE BANKERS TO SUPPLY METAL BUT IT TRANSFERS THE RISK TO A LONDON BANKER OBLIGATION AND NOT A NEW YORK COMEX OBLIGATION. LONGS RECEIVE A FIAT BONUS TOGETHER WITH A LONG LONDON FORWARD. THUS, BY THESE ACTIONS, THE BANKERS AT THE COMEX HAVE JUST STATED THAT THEY HAVE NO APPRECIABLE METAL!! THIS IS A MASSIVE FRAUD: THEY CANNOT SUPPLY ANY METAL TO OUR COMEX LONGS BUT THEY ARE QUITE WILLING TO SUPPLY MASSIVE NON BACKED GOLD (AND SILVER) PAPER KNOWING THAT THEY HAVE NO METAL TO SATISFY OUR LONGS. LONDON IS NOW SEVERELY BACKWARD IN BOTH GOLD AND SILVER AND WE ARE WITNESSING DELAYS IN ACTUAL DELIVERIES.
IN ESSENCE WE HAVE A STRONG SIZED INCREASE IN TOTAL CONTRACTS ON THE TWO EXCHANGES OF 9455 CONTRACTS: 5768 CONTRACTS INCREASED AT THE COMEX AND 3687 EFP OI CONTRACTS WHICH NAVIGATED OVER TO LONDON. THUS TOTAL OI GAIN OF 9455 CONTRACTS OR 29.40 TONNES. TUESDAY, WE HAD A STRONG GAIN OF $16.00 IN GOLD TRADING……
AND WITH THAT GAIN IN PRICE, WE HAD A STRONG SIZED GAIN IN TOTAL/TWO EXCHANGES GOLD TONNAGE OF 29.40 TONNES!!!!!! THE BANKERS/OFFICIAL SECTOR SUPPLIED INFINITE SUPPLIES OF SHORT GOLD COMEX PAPER WITH RECKLESS ABANDON. THE BANKERS WERE UNSUCCESSFUL IN THEIR ATTEMPT TO LOWER GOLD’S PRICE (IT ROSE $16.00).AND IT ALSO SEEMS THAT THEIR ATTEMPT TO FLEECE ANY GOLD LONGS FROM THE GOLD ARENA WAS UNSUCCESSFUL (SEE BELOW).
4 GC VOLUME: 0 // open interest 8
CALCULATIONS ON GAIN/LOSS ON OUR TWO EXCHANGES:
WE HAD A FAIR SIZED ISSUANCE IN EXCHANGE FOR PHYSICALS (3687) ACCOMPANYING THE CONSIDERABLE SIZED GAIN IN COMEX OI (5768 OI): TOTAL GAIN IN THE TWO EXCHANGES: 9455 CONTRACTS. WE NO DOUBT HAD 1 )CONSIDERABLE BANKER SHORT COVERING, 2.)ANOTHER HUMONGOUS INCREASE IN GOLD OUNCES STANDING AT THE GOLD COMEX FOR THE FRONT JUNE MONTH, 3) ZERO LONG LIQUIDATION; 4) CONSIDERABLE COMEX OI GAIN.. AND …ALL OF THIS WAS COUPLED WITH OUR STRONG GAIN IN GOLD PRICE TRADING//TUESDAY//$16.00.
WE ARE BEGINNING TO WITNESS A LACK OF EXCHANGE FOR GOLD PHYSICALS UNDERWRITTEN DUE TO PREMIUMS STARTING TO REAPPEAR IN THE FUTURE PRICE OF GOLD VS LONDON SPOT. THE COST TO THE BANKERS IS JUST TOO GREAT TO ENGAGE IN THESE VEHICLES ONCE THIS OCCURS.
THE FACT THAT WE ARE CONTINUALLY SEEING A DROP IN COMEX OPEN INTEREST AND VOLUMES COUPLED WITH LESS EXCHANGE FOR PHYSICALS PROBABLY MEANS THAT OUR LONGS ARE ALREADY DEPARTING NEW YORK FOR THE NEW PHYSICAL PLATFORM AT LONDON’S LME.
HISTORICAL ACCUMULATION OF EXCHANGE FOR PHYSICALS IN 2020 INCLUDING TODAY
JUNE
TO GIVE YOU AN IDEA AS TO THE STRONG SIZE OF THESE EFP TRANSFERS : THIS MONTH IN 9 TRADING DAY(S) IN TONNES: 76.41 TONNES
TOTAL ANNUAL GOLD PRODUCTION, 2019, THROUGHOUT THE WORLD EX CHINA EX RUSSIA: 3555 TONNES
THUS EFP TRANSFERS REPRESENTS 76.41/3550 x 100% TONNES =2.15% OF GLOBAL ANNUAL PRODUCTION
ISSUANCE OF EXCHANGE FOR PHYSICAL GOLD HAS DISSIPATED THIS MONTH…THE COST TO THE BANKERS TO CARRY THESE CONTRACTS IN LONDON IS BECOMING TOO GREAT FOR THEM.
ACCUMULATION OF GOLD EFP’S YEAR 2020 TO DATE: 2891.34 TONNES
JANUARY 2220 TOTAL EFP ISSUANCE; : 570.19 TONNES
FEB 2020 TOTAL EFP ISSUANCE : 653.78 TONNES
MARCH TOTAL EFP ISSUANCE 1,098.93 TONNES (*AND A NEW ALL TIME RECORD ISSUANCE//22 DAYS)
APRIL TOTAL EFP. ISSUANCE: 243.45 TONNES (EFP ISSUANCE BECOMING A LOT LESS)
MAY TOTAL EFP ISSUANCE: 248.68 TONNES (EFP ISSUANCE STILL LOW// PREMIUM COST TO THE BANKERS IS HUGE..SO ISSUANCE IS LESS)
JUNE TOTAL EFP ISSUANCE: 76.41 TONNES
WHAT IS ALARMING TO ME, ACCORDING TO OUR LONDON EXPERT ANDREW MAGUIRE IS THAT THESE EFP’S ARE BEING TRANSFERRED TO WHAT ARE CALLED SERIAL FORWARD CONTRACT OBLIGATIONS AND THESE CONTRACTS ARE LESS THAN 14 DAYS. ANYTHING GREATER THAN 14 DAYS, THESE MUST BE RECORDED AND SENT TO THE COMPTROLLER, GREAT BRITAIN TO MONITOR RISK TO THE BANKING SYSTEM. IF THIS IS INDEED TRUE, THEN THIS IS A MASSIVE CONSPIRACY TO DEFRAUD AS WE NOW WITNESS A MONSTROUS TOTAL EFP’S ISSUANCE AS IT HEADS INTO THE STRATOSPHERE.
First, here is an outline of what will be discussed tonight:
1.Today, we had the open interest at the comex, in SILVER, ROSE BY A STRONG SIZED 3788 CONTRACTS FROM 171,452 UP TO 175,240 AND CLOSER TO OUR COMEX RECORD //244,710(SET FEB 25/2020). THE LAST RECORDS WERE SET IN AUG.2018 AT 244,196 WITH A SILVER PRICE OF $14.78/(AUGUST 22/2018)..THE PREVIOUS RECORD TO THAT WAS SET ON APRIL 9/2018 AT 243,411 OPEN INTEREST CONTRACTS WITH THE SILVER PRICE AT THAT DAY: $16.53). AND PREVIOUS TO THAT, THE RECORD WAS ESTABLISHED AT: 234,787 CONTRACTS, SET ON APRIL 21.2017 OVER 2 3/4 YEARS AGO. THE PRICE OF SILVER ON THAT DAY: $17.89.
THE STRONG GAIN IN OI SILVER COMEX WAS DUE TO; 1) CONSIDERABLE BANKER SHORT COVERING , 2) A TINY ISSUANCE OF EXCHANGE FOR PHYSICALS (SEE BELOW), 3) A GOOD INCREASE IN SILVER OZ STANDING AT THE COMEX FOR JUNE AND 4) ZERO LONG LIQUIDATION
EFP ISSUANCE 130 CONTRACTS
OUR CUSTOMARY MIGRATION OF COMEX LONGS CONTINUE TO MORPH INTO LONDON FORWARDS AS OUR BANKERS USED THEIR EMERGENCY PROCEDURE TO ISSUE:
JULY: 500 CONTRACTS AND SEPT: 00 ALL OTHER MONTHS: ZERO. TOTAL EFP ISSUANCE: 130 CONTRACTS. EFP’S GIVE OUR COMEX LONGS A FIAT BONUS PLUS A DELIVERABLE PRODUCT OVER IN LONDON. IF WE TAKE THE COMEX OI GAIN OF 3784 CONTRACTS TO THE 130 OI TRANSFERRED TO LONDON THROUGH EFP’S, WE OBTAIN A STRONG GAIN OF 3918 OPEN INTEREST CONTRACTS FROM OUR TWO EXCHANGES. THUS IN OUNCES, THE GAIN ON THE TWO EXCHANGES 19.590 MILLION OZ!!! OCCURRED WITH THE 6 CENT LOSS IN PRICE///
RESULT: A STRONG SIZED INCREASE IN SILVER OI AT THE COMEX WITH THE 6 CENT LOSS IN PRICING THAT SILVER UNDERTOOK IN PRICING// TUESDAY. WE ALSO HAD A FAIR SIZED 500 EFP’S ISSUED TRANSFERRING COMEX LONGS OVER TO LONDON. TOGETHER WITH THE STRONG SIZED AMOUNT OF SILVER OUNCES STANDING FOR THIS MONTH, DEMAND FOR PHYSICAL SILVER CONTINUES TO INTENSIFY AS WE WITNESS SEVERE BACKWARDATION IN SILVER IN LONDON.
BOTH THE SILVER COMEX AND THE GOLD COMEX ARE IN STRESS AS THE BANKERS SCOUR THE BOWELS OF THE EXCHANGE FOR METAL
(report Harvey)
2 ) Gold/silver trading overnight Europe, Goldcore
(Mark O’Byrne/zerohedge
and in NY: Bloomberg
3. ASIAN AFFAIRS
i)WEDNESDAY MORNING/ TUESDAY NIGHT:
SHANGHAI CLOSED DOWN 12.36 POINTS OR 0.42% //Hang Sang CLOSED DOWN 7.49 POINTS OR 0.03% /The Nikkei closed UP 33.92 POINTS OR 0,15%//Australia’s all ordinaires CLOSED UP .10%
/Chinese yuan (ONSHORE) closed UP at 7.0606 /Oil DOWN TO 38.10 dollars per barrel for WTI and 40.47 for Brent. Stocks in Europe OPENED RED// ONSHORE YUAN CLOSED DOWN // LAST AT 7.0606 AGAINST THE DOLLAR. OFFSHORE YUAN CLOSED UP ON THE DOLLAR AT 7.0544 TRADE TALKS STALL//YUAN LEVELS GETTING DANGEROUSLY PAST 7:1//TRUMP INITIATES A NEW 25% TARIFFS FRIDAY/MAY 10/MAJOR PROBLEMS AT HUAWEI /CFO ARRESTED//CORONAVIRUS/PANDEMIC/USA RIOTS : /ONSHORE YUAN TRADING BELOW LEVEL OF OFFSHORE YUAN/ONSHORE YUAN TRADING STRONGER AGAINST USA DOLLAR/OFFSHORE YUAN TRADING STRONGER AGAINST THE DOLLAR /TRADE DEAL NOW DEAD..TRUMP RAISED RATES TO 25%
COMEX DATA//AMOUNTS STANDING//VOLUME OF TRADING/INVENTORY MOVEMENTS
GOLD
LET US BEGIN:
total dealer deposits: nil oz
i) We had 0 dealer withdrawal
total dealer withdrawals: nil oz
i)we had 1 deposits into the customer account
into JPMorgan: 0
ii)into Delaware: 172,986.355 oz
*** JPMorgan for most of 2017, 2018 and onward, has adding to its inventory almost every single day.
JPMorgan now has 160.819 million oz of total silver inventory or 51.22% of all official comex silver. (160.819 million/313.078 million
total customer deposits today: 172,986,355 oz
we had 1 withdrawals:
i) Out of CNT: 1,200,293.180 oz
total withdrawals; 1200,293.180 oz
We had 1 adjustments
i ) Out of CNT: 76,329.600 oz was adjusted out of dealer CNT into the customer CNT
total dealer silver: 85.324 million
total dealer + customer silver: 313.078 million oz
xxxxxxxxxxxxxxxxxxxxxxxxxxxxxxxxxxxxxxxxxxxxxxxxxxxxxxxxxxxxxxxxxxxxxxxxxx
The total number of notices filed today for the JUNE 2020. contract month is represented by 0 contract(s) FOR nil, oz
To calculate the number of silver ounces that will stand for delivery in JUNE we take the total number of notices filed for the month so far at 418 x 5,000 oz = 2,090,,000 oz to which we add the difference between the open interest for the front month of JUNE.(11) and the number of notices served upon today 0 x (5000 oz) equals the number of ounces standing.
.
Thus the INITIAL standings for silver for the JUNE/2019 contract month: 418 (notices served so far) x 5000 oz + OI for front month of JUNE (11)- number of notices served upon today 14) x 5000 oz of silver standing for the JUNE contract month.equals 2,145,000 oz.
We GAINED 0 contracts or an additional nil oz will stand for delivery as they refused to morphed into London based forwards as well as negating a fiat bonus
TODAY’S ESTIMATED SILVER VOLUME: 87,642 CONTRACTS // volume good/
FOR YESTERDAY: 78,770..,CONFIRMED VOLUME//volume good/
YESTERDAY’S CONFIRMED VOLUME OF 78,770 CONTRACTS EQUATES to 393 million OZ 56.2% OF ANNUAL GLOBAL PRODUCTION OF SILVER..
COMMODITY LAW SUGGESTS THAT OPEN INTEREST SHOULD NOT BE MORE THAN 3% OF ANNUAL GLOBAL PRODUCTION. THE CROOKS ARE SUPPLYING MASSIVE PAPER TRYING TO KEEP SILVER IN CHECK.
The record level of silver open interest is 234,787 contracts set on April 21./2017 with the price at that day at $18.42. The previous record was 224,540 contracts with the price at that time of $20.44
end
NPV for Sprott
1. Sprott silver fund (PSLV): NAV FALLS TO- 1.62% ((JUNE 10/2020)
2. Sprott gold fund (PHYS): premium to NAV FALLS TO -1.12% to NAV: (JUNE 10/2020 )
Note: Sprott silver trust back into NEGATIVE territory at +%-/Sprott physical gold trust is back into NEGATIVE/ 1.62%
(courtesy Sprott/GATA
3.SPROTT CEF.A FUND (FORMERLY CENTRAL FUND OF CANADA):
NAV 16.55 TRADING 16.49///NEGATIVE 0.98
END
And now the Gold inventory at the GLD/
JUNE 10/WITH GOLD DOWN $.30 TODAY: A HUGE CHANGE IN GOLD INVENTORY AT THE GLD//A DEPOSIT OF 4.02 TONNES AT THE GLD/INVENTORY RESTS AT 1129.50 TONNES
JUNE 9//WITH GOLD UP $16.00 TODAY: A HUGE CHANGE IN GOLD INVENTORY AT THE GLD//A WITHDRAWAL OF 2.63 TONNES OF GOLD AT THE GLD//INVENTORY RESTS AT 1125.48 TONNES
JUNE 8//WITH GOLD UP $18.70 TODAY: A HUGE CHANGE IN GOLD INVENTORY AT THE GLD//A WITHDRAWAL OF 4.10 TONNES AT THE GLD//INVENTORY RESTS AT 1128.11 TONNES
JUNE 5//WITH GOLD DOWN $40.40 TODAY: A HUGE CHANGE IN GOLD INVENTORY: A PAPER WITHDRAWAL OF 1.16 TONNES OUT OF THE GLD//INVENTORY RESTS AT 1132.21 TONNES
JUNE 4//WITH GOLD UP $20.60: A HUGE CHANGE IN GOLD INVENTORY AT THE GLD…A DEPOSIT OF 4.09 TONNES INTO THE GLD//INVENTORY RESTS AT 1133.37 TONNES
JUNE 3//WITH GOLD DOWN $26.15//A SMALL CHANGE IN GOLD INVENTORY//A DEPOSIT OF 0.78 TONNES OF GLD INTO THE GLD//INVENTORY RESTS AT 1129.28 TONNES
JUNE 2//WITH GOLD DOWN $11.20 TODAY: A HUGE CHANGE IN GOLD INVENTORY AT THE GLD: A DEPOSIT OF 5.26 TONNES OF GOLD INTO THE GLD////INVENTORY RESTS AT 1128.40 TONNES
JUNE 1//WITH GOLD UP $1.30//A HUGE CHANGE IN GOLD INVENTORY AT THE GLD: A DEPOSIT OF 4.06 TONNES OF GOLD//GLD INVENTORY RESTS TONIGHT AT 1123.14 TONNES
MAY 29/WITH GOLD UP $19.40 TODAY: NO CHANGE IN GOLD INVENTORY AT THE GLD///GLD INVENTORY RESTS THIS WEEKEND AT 1119.05 TONNES
MAY 28//WITH GOLD UP $4.00 TODAY/NO CHANGES IN GOLD INVENTORY TO THE GLD//INVENTORY RESTS AT 1119.05 TONNES
MAY 27/WITH GOLD UP $.10 TODAY: A STRONG 2.34 TONNES OF GOLD ADDED TO THE GLD//INVENTORY RESTS AT 1119.05 TONNES
MAY 26//WITH GOLD DOWN $23.05//NO CHANGES IN GOLD INVENTORY://RESTS TONIGHT AT 1116.71 TONNES
MAY 22//WITH GOLD UP $13.05//A BIG CHANGE IN GOLD INVENTORY:: A PAPER ADDITION OF 3.93 TONNES//INVENTORY RESTS THIS WEEKEND AT: 1116.71 TONNES
MAY 21//WITH GOLD DOWN $26.70//NO CHANGE IN GOLD INVENTORY AT THE GLD/INVENTORY RESTS AT 1112.32 TONNES
MAY 20/WITH GOLD UP $7.20: A HUGE CHANGE IN GOLD INVENTORY AT THE GLD: A PAPER WITHDRAWAL OF 1.46 TONNES FROM THE GLD////INVENTORY RESTS TONIGHT AT 1112.32 TONNES
MAY 19//WITH GOLD UP $10.60//NO CHANGES IN GOLD INVENTORY AT THE GLD////INVENTORY RESTS AT 1113.78 TONNES
MAY 18/WITH GOLD DOWN $15.40 TODAY: A HUGE CHANGE IN GOLD INVENTORY: A PAPER DEPOSIT OF 9.06 TONNES./INVENTORY RESTS AT 1113.78 TONNES
MAY 15.WITH GOLD UP $16.30 TODAY: A HUGE CHANGE IN GOLD INVENTORY AT THE GLD: A PAPER DEPOSIT OF 12.58 TONNES/ INVENTORY RESTS AT 1104.72 TONNES
MAY 14//WITH GOLD UP $19.25 TODAY: NO CHANGES IN GOLD INVENTORY AT THE GLD////INVENTORY RESTS AT 1092.14 TONNES
MAY 13//WITH GOLD UP $9.05 TODAY: A HUGE CHANGE IN GOLD INVENTORY AT THE GLD//A DEPOSIT OF 11.07 TONNES/INVENTORY RESTS AT 1092.14 TONNES
MAY 12//WITH GOLD UP $6.60 TODAY; A SMALL CHANGES IN GOLD INVENTORY AT THE GLD/: A WITHDRAWAL OF .58 TONNES FROM THE GLD///INVENTORY RESTS AT 1081.07 TONNES
MAY 11/WITH GOLD DOWN $12.65 TODAY: NO CHANGES IN GOLD INVENTORY: //INVENTORY RESTS AT 1081.65 TONES..
MAY 8/WITH GOLD DOWN $7.00 TODAY; A BIG CHANGE IN GOLD INVENTORY: A PAPER ADDITION OF 5.85 TONNES/INVENTORY RESTS AT 1081.65 TONNES
MAY 7/WITH GOLD UP $29.65 TODAY : A SMALL CHANGE IN GOLD INVENTORY AT THE GLD//A PAPER ADDITION OF .41 TONNES/INVENTORY RESTS AT 1075.80 TONNES
MAY 6//WITH GOLD DOWN $17.00 TODAY/ A HUGE CHANGE IN GOLD INVENTORY AT THE GLD//A PAPER ADDITION OF 3.68 TONNES/INVENTORY RESTS AT 1075.39 TONES
MAY 5/WITH GOLD DOWN $1.65 TODAY: A HUGE CHANGE IN GOLD INVENTORY AT THE GLD: A PAPER ADDITION OF 3.81 TONNES//INVENTORY RESTS AT 1071.71 TONNES
MAY 4//WITH GOLD UP $12.00 TODAY//A HUGE CHANGE IN GOLD INVENTORY AT THE GLD: A MASSIVE PAPER DEPOSIT OF 11.4 TONNES INTO THE GLD////GOLD INVENTORY RESTS AT 1067.90 TONNES
MAY 1/WITH GOLD UP $8.45 NO CHANGES IN GOLD INVENTORY AT THE GLD//INVENTORY RESTS AT 1056.50 TONNES
xxxxxxxxxxxxxxxxxxxxxxxxxxxxxxxxxx
Inventory rests tonight at
JUNE 10/ GLD INVENTORY 1129.50 tonnes*
LAST; 838 TRADING DAYS: +184.58 NET TONNES HAVE BEEN REMOVED FROM THE GLD
LAST 738 TRADING DAYS://+359.76 TONNES HAVE NOW BEEN ADDED INTO THE GLD INVENTORY.
end
Now the SLV Inventory/
JUNE 10/WITH SILVER UP 3 CENTS TODAY: NO CHANGES IN SILVER INVENTORY AT THE SLV//INVENTORY RESTS AT 472.849 MILLION OZ//
JUNE 9/WITH SILVER DOWN 6 CENTS TODAY//A HUGE CHANGE IN SILVER INVENTORY AT THE SLV: A DEPOSIT OF 2.605 MILLION OZ INTO THE SLV////INVENTORY RESTS AT 422.849 MILLION OZ//
JUNE 8/WITH SILVER UP 36 CENTS TODAY: TWO HUGE WITHDRAWALS OF 932,000 MILLION OZ AND 1.491 MILLION OZ FROM THE SLV//INVENTORY RESTS AT 470.240 MILLION OZ//
JUNE 5/WITH SILVER DOWN 46 CENTS TODAY: A SMALL CHANGE IN SILVER INVENTORY AT THE SLV: A PAPER WITHDRAWAL OF 648,000 OZ FROM THE SLV////INVENTORY RESTS AT 472.663 MILLION OZ
JUNE 4//WITH SILVER UP 8 CENTS TODAY: NO CHANGES IN SILVER INVENTORY AT THE SLV.//INVENTORY RESTS AT 473.315 MILLION OZ//
JUNE 3//WITH SILVER DOWN 23 CENTS TODAY//NO CHANGES IN SILVER INVENTORY AT THE SLV//
INVENTORY RESTS AT 473.315 MILLION OZ//
JUNE 2//WITH SILVER DOWN 31 CENTS TODAY; A HUGE CHANGES IN SILVER INVENTORY AT THE SLV: A HUMONGOUS 6.686 MILLION OZ ADDED TO THE SLV////INVENTORY RESTS TONIGHT AT 473.315 MILLION OZ//
JUNE 1//WITH SILVER UP 38 CENTS TODAY: A HUGE CHANGE IN SILVER INVENTORY AT THE SLV: A DEPOSIT OF 3.56 MILLION OZ INTO THE SLV////INVENTORY RESTS TONIGHT AT 466.629 MILLION OZ//
MAY 29//WITH SILVER UP 52 CENTS TODAY: A MASSIVE DEPOSIT OF 2.796 MILLION OZ INTO THE SLV//INVENTORY RESTS THIS WEEKEND AT 463.273 MILLION OZ//
MAY 28//WITH SILVER UP 9 CENTS TODAY: A MASSIVE CHANGE IN SILVER INVENTORY AT THE SLV: A DEPOSIT OF 4.660 MILLION OZ INTO THE SLV////INVENTORY RESTS AT 460.477 MILLION OZ//
MAY 27/WITH SILVER UP 13 CENTS TODAY: NO CHANGES IN SILVER INVENTORY AT THE SLV//INVENTORY RESTS AT 455.817 MILLION OZ//
MAY 26//WITH SILVER DOWN 9 CENTS TODAY: NO CHANGES IN SILVER INVENTORY AT THE SLV/// INVENTORY RESTS AT 455.817 MILLION OZ//
MAY 22/WITH SILVER UP 22 CENTS TODAY/ A HUGE PAPER WITHDRAWAL OF 1.864 MILLION OZ//INVENTORY RESTS AT 455.817 MILLION OZ/
LAST 5 DAYS: SILVER UP 60 CENTS: INVENTORY UP A WHOOPING 23.767 MILLION OZ///
MAY 21/WITH SILVER DOWN 50 CENTS TODAY: A HUGE PAPER DEPOSIT OF 7.923 MILLION OZ///INVENTORY RESTS AT 457.681 MILLION OZ//
MAY 20//WITH SILVER UP ANOTHER 11 CENTS TODAY: A HUGE CHANGE IN SLV INVENTORY: A HUGE PAPER DEPOSIT OF 9.601 MILLION OZ INTO THE SLV// //INVENTORY RESTS AT 449.758 MILLION OZ
MAY 19/WITH SILVER UP ANOTHER 29 CENTS TODAY: NO CHANGES IN SILVER INVENTORY AT THE SLV////INVENTORY RESTS AT 440.157 MILLION OZ//
MAY 18/WITH SILVER UP ANOTHER 48 CENTS TODAY: TWO BIG CHANGES IN SILVER INVENTORY AT THE SLV I.E. 2 PAPER DEPOSIT OF ( I) 8.39 MILLION OZ AND THEN ( 2) 8.109 MILLION OZ//INVENTORY RESTS AT 432.048 MILLION OZ// (TOTAL DEPOSITS 16.500 MILLION OZ///)
MAY 15/WITH SILVER UP 81 CENTS TODAY: NO CHANGE IN SILVER INVENTORY AT THE SLV: /INVENTORY RESTS AT 423.65 MILLION OZ.
MAY 14//WITH SILVER UP 33 CENTS TODAY: NO CHANGES IN SILVER INVENTORY AT THE SLV.//INVENTORY RESTS AT 423.65 MILLION OZ
MAY 13/WITH SILVER UP 2 CENTS TODAY: A HUGE CHANGES IN SILVER INVENTORY AT THE SLV: A PAPER DEPOSIT OF 2.79 MILLION OZ INTO THE SLV..//INVENTORY RESTS AT 423.65 MILLION OZ//
MAY 12/WITH SILVER UP 5 CENTS TODAY: A BIG CHANGES IN SILVER INVENTORY AT THE SLV: A DEPOSIT OF 3.076 MILLION OZ INTO THE SLV////INVENTORY RESTS AT 420.861 MILLION OZ//
MAY 11.WITH SILVER DOWN 5 CENTS TODAY: NO CHANGES IN SILVER INVENTORY AT THE SLV//INVENTORY RESTS AT 417.785 MILLION OZ//
MAY 8/WITH SILVER UP 11 CENTS TODAY: A HUGE CHANGE IN SILVER INVENTORY AT THE SLV: A MONSTER DEPOSIT OF 4.661 MILLION OZ OF SILVER INTO THE SLV..///INVENTORY RESTS AT 417.785 MILLION OZ//
MAY 7/WITH SILVER UP 45 CENTS TODAY: NO CHANGES IN SILVER INVENTORY AT THE SLV//INVENTORY RESTS AT 413.124 MILLION OZ//
MAY 6/WITH SILVER DOWN 6 CENTS TODAY: NO CHANGES IN SILVER INVENTORY AT THE SLV//INVENTORY RESTS AT 413.124 MILLION OZ//
MAY 5/WITH SILVER UP 17 CENTS TODAY: NO CHANGES IN SILVER INVENTORY AT THE SLV//INVENTORY RESTS AT 413.124 MILLION OZ///
MAY 4//WITH SILVER DOWN 5 CENTS TODAY:2 HUGE PAPER CHANGES IN SILVER INVENTORY AT THE SLV.i).A LARGE 1.399 MILLION OZ OF PAPER SILVER REMOVED FROM THE SLV//..//INVENTORY RESTS AT 411.427 MILLION OZ and ii) A LARGE 1.647 MILLION OZ OF PAPER SILVER ADDED TO THE SLV// INVENTORY RESTS AT 413.124 MILLION OZ//
MAY 1/WITH SILVER FLAT IN PRICE: NO CHANGES IN SILVER INVENTORY AT THE SLV//INVENTORY RESTS AT 412.826 MILLION OZ///
JUNE 10.2020:
SLV INVENTORY RESTS TONIGHT AT
472.849 MILLION OZ.
END
LIBOR SCHEDULE AND GOFO RATES// GOLD LEASE RATES
YOUR DATA…..
6 Month MM GOFO 2.70/ and libor 6 month duration 0.46
Indicative gold forward offer rate for a 6 month duration/calculation:
GOLD LENDING RATE: -2.24%
NEGATIVE GOLD LEASING RATES INCREASING BY A HUGE AMOUNT//GOLD SCARCITY AND CENTRAL BANKS CALLING IN ALL OF THEIR GOLD LEASES
XXXXXXXX
12 Month MM GOFO
+ 2.25%
LIBOR FOR 12 MONTH DURATION: 0.63
GOFO = LIBOR – GOLD LENDING RATE
GOLD LENDING RATE = -1.62%
PHYSICAL GOLD/SILVER STORIES
i) GOLDCORE BLOG/Mark O’Byrne
ii) Important gold commentaries courtesy of GATA/Chris Powell
Does China vault any gold at the New York Fed: totally unlikely
(Jan Nieuwenhuijs/GATA)
Jan Nieuwenhuijs: It’s unlikely China vaults gold at the New York Fed
Submitted by cpowell on Tue, 2020-06-09 15:41. Section: Daily Dispatches
11:40a ET Tuesday, June 9, 2020
Dear Friend of GATA and Gold:
Does China store gold at the Federal Reserve Bank of New York?
Voima Gold researcher Jan Nieuwenhuijs today addresses the question and concludes that such storage is highly unlikely.
But Nieuwenhuijs reprints the brief memoir of a former Bank of China official who handled gold and foreign exchange transactions for the Chinese government in the 1980s and in 1983 accompanied government gold flown from Beijing for vaulting at the Bank of England in London.
…
The memoir may be most interesting for suggesting that China’s government back then was interested in earning money by leasing its gold from the Bank of England.
Nieuwenhuijs’ report is headlined “Does the People’s Bank of China Store Gold at the Fed in New York?” and it’s posted at Voima Gold here:
https://www.voimagold.com/insight/does-the-pboc-store-gold-at-the-fed-in…
CHRIS POWELL, Secretary/Treasurer
Gold Anti-Trust Action Committee Inc.
CPowell@GATA.org
END
Pam and Russ talks about the financial crisis that has started well before the Covid 19.
(Pam and Russ Martens/Wall Street on Parade/GATA)
Pam and Russ Martens: Investors were blocked from fund withdrawals months before virus pandemic
Submitted by cpowell on Tue, 2020-06-09 15:50. Section: Daily Dispatches
By Pam and Russ Martens
Wall Street on Parade
Monday, June 8, 2020
Wall Street On Parade has previously written that a financial crisis was already well under way before the first case of Covid-19 was reported anywhere in the world. This should matter greatly to Americans because the Federal Reserve is attempting to blame the financial crisis on the virus to avoid congressional investigations of its second epic failure in a dozen years at regulating the behemoth Wall Street banks.
America needs a comprehensive investigation of what really triggered this financial crisis in order to restructure the U.S. financial system away from a casino culture into one that doesn’t regularly need massive Federal Reserve and government bailouts.
These bailouts are piling more and more debt on the shoulders of taxpayers and becoming a crushing drag on the U.S. economy, notwithstanding Fed Chairman Jerome Powell’s dismissive remark to Congress that we’ll worry about the debt later.
Today we’re expanding our financial crisis timeline to include pre-Covid-19 announcements of big job cuts at global banks; mutual funds and hedge funds taking the desperate measure of locking out investors from access to their money; and the massive sums investors were pulling from mutual funds and hedge funds throughout 2019 — all prior to the first case of Covid-19 anywhere in the world. …
… For the remainder of the analysis:
https://wallstreetonparade.com/2020/06/investors-were-being-blocked-from…
* * *
END
Gold’s rise is causing bullion banks to cover their shorts in a big way
(Craig Hemke/Sprott/GATA)
Craig Hemke at Sprott Money: Clearing the Comex decks
Submitted by cpowell on Wed, 2020-06-10 02:39. Section: Daily Dispatches
10:40p ET Tuesday, June 9, 2020
Dear Friend of GATA and Gold:
Positions of both speculators and bullion banks in gold futures contracts on the New York Commodities Exchange have been steadily declining, the TF Metals Report’s Craig Hemke writes tonight at Sprott Money.
This, Hemke writes, suggests that there is no speculative bubble and that the banks are getting out of the way of an imminent rally.
Hemke’s analysis is headlined “Clearing the Comex Decks” and it’s posted at Sprott Money here:
https://www.sprottmoney.com/Blog/clearing-the-comex-decks-craig-hemke-ju…
CHRIS POWELL, Secretary/Treasurer
Gold Anti-Trust Action Committee Inc.
CPowell@GATA.org
iii) Other physical stories:
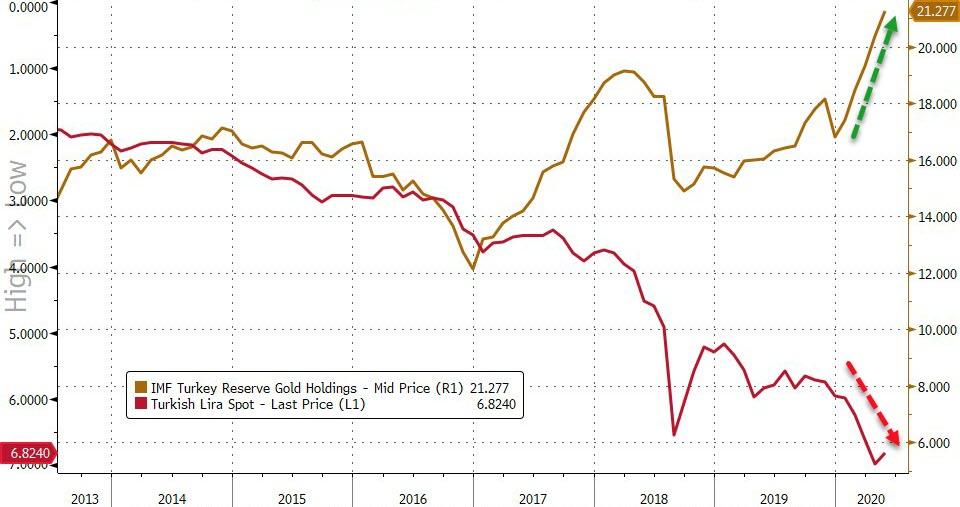
A good commentary tonight from Peter Schiff: Central banks added 32 tonnes of gold in April despite the lockdowns. Even bankrupt Turkey led the way
(Peter Schiff)
Central Banks Added Nearly 32 Tons Of Gold To Reserves In April, Led By Turkey
The pace has slowed somewhat this year, but central banks are still buying gold, and the World Gold Council expects central bank demand to continue over the next 12 months.

In April, central banks globally added another net 31.6 tons of gold to their reserves, despite Russia following through on its commitment to suspend its buying program.
According to the World Gold Council, the lower rate of purchases was entirely expected given the strength of central bank buying both in 2018 and 2019.
On the year, central banks have added a net 142 tons of gold to their reserves. This is off the near-record pace of purchases last year.
Central bank demand came in at 650.3 tons in 2019. That was the second-highest level of annual purchases for 50 years, just slightly below the 2018 net purchases of 656.2 tons. According to the WGC, 2018 marked the highest level of annual net central bank gold purchases since the suspension of dollar convertibility into gold in 1971, and the second-highest annual total on record.
The World Gold Council bases its data on information submitted to the International Monetary Fund.
Turkey drove purchases yet again in April. The Turks added 38.8 tons of gold to its hoard, bringing its total reserves to 524 tons. The Turkish lira dropped to near all-time lows in March and the Turkish central bank is frantically trying to backstop its currency. Meanwhile, Turkey is selling dollars. According to Bloomberg, state banks sold roughly $1.1 billion of foreign currency in just two days last month.
Serbia continued to buy small amounts of gold, adding another 0.1 ton. The Serbs bought 9 tons of the yellow metal back in October 2019 and have added at least 0.1 ton to its reserves every month since.
We saw a little bit of selling in April as well. Kazakhstan reduced its gold reserves by 4.1 tons and Uzbekistan’s holdings declined by 2.2 tons. Russia saw a modest drop of 0.4 tons in its reserves.
In March, the Central Bank of Russia announced it planned to suspend gold-purchases for the time being, effective April 1. But there is already pressure on the bank to resume purchases. In early April, Russian banks asked the Central Bank of Russia to resume buying gold for its reserves as gold exports were hobbled by the coronavirus pandemic. In a letter released on April 29, the Russian central bank said it did not see any need to resume buying gold at the time, but added it would continue to monitor the situation in both the global gold market and the banking sector.
For the seventh straight month, the People’s Bank of China did not report any gold purchases. It’s not uncommon for China to go silent and then suddenly announce a large increase in reserves.
Many analysts believe China holds far more gold than it officially reveals. As Jim Rickards pointed out on Mises Daily back in 2015, many people speculate that China keeps several thousand tons of gold “off the books” in a separate entity called the State Administration for Foreign Exchange (SAFE). Given the political dynamics and the ongoing trade war, it seems unlikely the Chinese suddenly stopped increasing their gold reserves in 2016.
Does the slowdown in purchases in recent months signal an absence of central bank demand going forward? The World Gold Council doesn’t think so.
As we noted in our Q1 2020 Gold Demand Trends report, the case for central banks holding gold remains strong. Especially considering the economic uncertainty caused by the COVID-19 pandemic.”
The WGC 2020 Central Bank Survey found that 20% of central banks globally plan to expand their gold holdings in the next 12 months.
Factors related to the economic environment – such as negative interest rates – were overwhelming drivers of these planned purchases. This was supported by gold’s role as a safe haven in times of crisis, as well as its lack of default risk.”
One thing is clear, the trend towards precious metals reserves continues…

https://www.jsmineset.com/2020/06/10/precious-metals-open-interest-is-showing-the-fear/
Precious Metals Open Interest Is Showing The Fear!
Posted June 10th, 2020 at 9:03 AM (CST) by J. Johnson & filed under General Editorial.
Great and Wonderful Wednesday Morning Folks,
It’s the final day of the FOMC meetings and Gold is inside a $10 trading range at $1,728.10, up $6.20 and right close to the high at $1,728.40 with the low at $1,718.70. Silver is leading again, in its choppy and sporadic way as it attempts to break free from all that applied calm, with the trade at $17.945, up 15.6 cents with the high – ½ penny away and the low at $17.715. The US Dollar, the topic of today’s FOMC meeting (it’s really about the set calculations against Silver and Gold), is valued at 96.020, down 30.1 points and near its low of 95.975 with the high up at 96.465. Of course, all this happened already, before 5 am pst, the Comex open, the London close, and after the FBI started looking and scooping up the idiots who used social media to brag about the stuff they stole while protesting a wrongful death.
Precious Metals are gaining across the board today. Venezuela’s Bolivar is getting weaker, continuing to make Gold more valuable with the trade at 17,259.40, gaining 110.86 Bolivar since yesterday with Silver now at 179.226 Bolivar finally gaining 1.049 after several days of applied calm. Argentinians are now paying 119,413.93 Peso’s for 1 ounce of Gold proving a gain of 1,164.14 with Silver also showing a 10.87 A-Peso gain with the trade at 1,239.99. The Turkish Lira’s price for Gold now sits at 11,734.46, proving a gain of 53.32 Lira with Silver also gaining 0.49 of a T-Lira with the last trade at 121.854.
June Silver’s Demand Count now sits at 11 fully paid for contracts and with no purchases made in the early morning as we wait for Mr. Resolute to make his mark once again. Hopefully he’ll be here just before the Gods of Print bless their own against the mass of investors they could not beat if they didn’t have control of the print. Yesterday’s delivery activity occurred at one price, $17.83 with a Volume of 1 with that adjusted price settled down at $17.774 as 14 buyers finally got their receipts. The fear is showing up behind the price as the Overall Open Interest continues to climb in order to keep the calm with the short trades adding another 3,788 contracts bringing the count to 175,237 Overnighters.
June Gold’s Delivery Requests now sit at 3,970 fully paid for contracts and with a Volume of 35 already posted up on the board inside a trading range between $1,724.80 and $1,716.10 with the last trade, of course, at the high. Yesterday’s final trading range occurred between $1,720.90 and $1,692 with the last trade (I could see) at $1,712 with the adjusted close higher at $1,714.70 with a final Volume of 690. Only 100 buyers got receipts during all that activity. The fear behind the price finally popped into Gold yesterday as 5,845 short contracts had to be added or Gold would have a much higher value than it is now with the total Short Vs Long reaching 475,987 Overnighters (buyers and sellers holding their positions overnight) on the first day of the FOMC.
As time rolls by, we continue to see the intrusion against truth in reporting as the Chinese Propaganda outlet called “China Watch”, paid millions to the Washington Post and the Wall Street Journal over the years, to run advertisements made to look like news reports. Then we have something very interesting, if true it’s a huge WOW, about ANTIFA management being picked up on the streets as they are walking, leaving the underlings in absolute fear as we once again state, how difficult is it to understand “we have the servers”? It may be time to Q the videos. Those that follow and believe in law and order, may be finally seeing it occur, but don’t expect the media to tell you about it, they are commercially compromised to not be truthful.
More and more people are bypassing all proclaimed media and are going directly to the sources, such as the White House Press meetings to hear the Scorched Earth Tongue of Kayleigh McEnany. It’s amazing to see how the presstitutes act now after trying their best to ask loaded and stupid questions. Many are also going directly to the president’s tweets as well in order to get what our legally elected is trying to do while the press proves it’s been on the side of foreign nations against our country and its people.
We sit with physicals, outside the financial mess called the markets, controlled by a (not really federal) Fed Reserve, that may have been swallowed up by the US Treasury. Then the compromising media, which is advertising pure bias claiming its news when many of us remember what news used to be, just the facts presented without bias. Have a great day! After all it’s all up to you to do so. Keep the faith, and a smile no matter what, because we are still right here, keeping watch, we believe higher prices in Silver and Gold are coming, because it’s a real product that fiat was made to trade against ….
Stay Strong!
Jeremiah Johnson
More J.Johnson content is available with purchase of a JSMineset subscription.
Top Primary Silver Mining Industry Production Yield Falls To The Lowest Ever
The era of high-grade silver mines may be coming to an end. Remarkably, the top primary silver miners’ average yield fell to the lowest ever in 2019. Which begs the question, will high-grade silver mines become extinct in the not-so-distant future? Well, if we look at the data, it seems to be already happening.
Since I started researching the primary silver mining industry, the yields at many high-grade silver mines have fallen drastically. For example, Fresnillo PLC’s Flagship mine, the Fresnillo Mine, had seen its average yield decline from 15 oz/t (ounce per tonne) in 2005 to only 5.3 oz/t last year. That is one hell of a reduction in just 14 years… nearly 10 oz/t of silver yield evaporated.
Take a look at how much more silver the Fresnillo Mine was producing in 2005 compared to 2019… processing LESS ORE!!
- Fresnillo Mine 2005 Production = 33.4 million oz
- Fresnillo Mine 2005 Processed Ore = 2.2 million tons
- Fresnillo Mine 2005 Average Yield = 15.2 oz/t
- Fresnillo Mine 2019 Production = 13.0 million oz
- Fresnillo Mine 2019 Processed Ore = 2.5 million tons
- Fresnillo Mine 2019 Average Yield = 5.3 oz/t
As we can see, workers at the Fresnillo Mine processed more ore in 2019 to produce 20 million fewer ounces of silver. No wonder the cost to produce silver has risen from $4-5 per ounce back in 2005 to over $15+ an ounce presently.
Now, if we combine the top seven primary silver miners in my group, the average yield fell to a record low of 6.0 oz/t in 2019:
The top primary silver mining companies’ average yield fell from 13 oz/t in 2005 to 6.0 oz/t last year. That’s a 54% decline in average yield from the top primary silver mining industry. This means these silver mining companies have to extract, transport, and process more than twice the amount of ore than they did in 2005 to produce the same amount of metal.
The companies that impacted the group’s average yield the most were from Peru. Peru’s Hochschild average yield declined from 7.5 oz/t in 2018 to 5.9 oz/t last year, while Buenaventura’s average yield fell from 10.6 oz/t to 7.5 oz/t during the same period. Mexico’s Fresnillo PLC’s average yield from its primary silver mines (Fresnillo, Saucito & San Julian) fell from 5.7 oz/t in 2018 to 5.0 oz/t in 2019.
Also, Russia’s Polymetal International, Dukat Operations, saw its average yield fall to 7.7 oz/t last year down from 8.5 oz/t in 2018. The only primary silver miner that saw an increase in yield was Hecla. Mainly due to Hecla’s Greens Creek Mine, the company’s average silver yield increased from 10 to 11.5 oz/t during the same period.
The world is running out of its HIGH-GRADE, easy to get to silver deposits. While there are still some high-grade silver deposits still remaining in the world, the primary mining industry continues to BURN through its better quality reserves. At some point, production from these top seven silver mines will no longer be able to offset the declines from falling ore grades.
Investors have no idea what a deal they are getting in acquiring silver for such a great deal when we compare it to most of the over-valued financial paper assets and real estate. The few silver miners in the world may just surprise the market when investors begin to move into them in a BIG WAY.
THANK YOU ALL FOR THE SUPPORT: I just wanted to thank all the individuals who continue to support the SRSrocco Report website and youtube channel. I know some of you have canceled memberships as times are tough. I understand. If you are new to the site and find the information valuable, please consider supporting the website, if you have the means to do so, at Paypal or Patreon below.
If you are new to the SRSrocco Report, please consider subscribing to my: SRSrocco Report Youtube Channel.
HOW TO SUPPORT THE SRSROCCO REPORT SITE:
I would also like to thank those foundation supporters, who have chosen to become a member by making donations through PayPal to further the research and publishing work at the SRSrocco Report.

US seeks halt in civil lawsuit accusing JP Morgan of manipulating metals market, citing criminal case
- The U.S. wants a federal judge to halt a civil lawsuit accusing J. P. Morgan of manipulating precious metals markets. The Justice Department cited an ongoing criminal case as its reason for the request.
- A former J. P. Morgan trader pleaded guilty in Connecticut last month to manipulation charges.
- In the guilty plea, the trader said he had learned to make bogus trade orders from senior traders at the bank and that he used the strategy hundreds of times with the knowledge and consent of his immediate supervisors.
CNBC.com
The Justice Department is asking a judge to put the brakes on a civil lawsuit against J. P. Morgan Chase, citing an ongoing probe into a “related criminal case” that involves alleged manipulation of precious metals markets.
The department wants a six-month postponement in the proceedings of the civil lawsuit, which was filed in 2015 by hedge fund manager Daniel Shak and two commodity traders. The government also says it could ask for a longer delay in the case, according to a court filing on Monday.
The move comes days after Shak’s lawyer, David Kovel, sought permission to reopen questioning of two former J. P. Morgan traders and the bank’s current global head of base and precious metals trading.
Kovel, in making the request with the Manhattan federal judge in the civil case, cited last month’s guilty plea by one of those former traders, John Edmonds, in federal court in Connecticut.
Edmonds admitted making bogus bids on precious metals contracts while working at the bank from 2009 to 2015.
Neither J. P. Morgan Chase nor Kovel’s clients have opposed the Justice Department’s request.
In arguing for a delay, the Justice Department said Shak’s lawsuit is “related” to Edmonds’ criminal case and that Edmonds has “pleaded guilty and acknowledged his own participation in such conduct, as well as that of other traders.”
“Edmonds awaits sentencing, but the broader investigation is ongoing,” the Justice Department said. The U.S. wants to delay the civil case “to protect the integrity of its ongoing criminal investigation,” it said.
J. P. Morgan did not respond to a request for comment by CNBC. Kovel declined to comment.
Tuesday night, after this story first was published, Judge Paul Engelmayer ordered the federal prosecutors to explain in detail by Monday why postponing proceedings in the civil lawsuit would not harm those involved, and why reopening questioning “would be detrimental to the Government’s ongoing criminal investigation.”
Englemayer also wrote that he regards Edmonds’ guilty plea “as potentially highly consequential” to the civil case.
In his guilty plea, the 36-year-old Edmonds said he had learned to make bogus trade orders from senior traders at the bank and that he used the strategy hundreds of times with the knowledge and consent of his immediate supervisors. He admitted to working with “unnamed co-conspirators” at J. P. Morgan, according to the Justice Department.
Kovel wants to question Edmonds again as well as Michael Nowak, the bank’s global head of base and precious metal trading, and former J. P. Morgan Chase Managing Director Robert Gottlieb. The three had previously answered questions under oath in the civil case.
Kovel said in court filings that Nowak was the immediate supervisor of Edmonds, while Gottlieb was Edmonds’ mentor.
In his prior deposition, Edmonds said that Gottlieb sat only a “couple feet” away from him for about five years, and that he was “somebody [he] looked up to in the business,” who helped guide and train him.
Nowak is described by Edmonds as his direct supervisor, with whom he would sometimes discuss trading strategies. Nowak was also the person responsible for overseeing the performance and risk of Edmonds’ portfolio, according to the deposition.
Edmonds also stated in his prior deposition that he would enter precious metals trades for both Nowak and Gottlieb, among others.
The civil lawsuit claims Shak and his fellow plaintiffs lost tens of millions of dollars as a result of actions by J. P. Morgan’s traders.
Federal judge tells traders they can combine cases accusing JP Morgan of rigging metals market
- Litigation in a separate civil case has been put on hold until at least May at the behest of the Justice Department, which is investigating a “related criminal case” that involves alleged market manipulation by precious metals traders at J. P. Morgan.
- Judge John Koeltl of the Southern District of New York appointed the White Plains, N.Y., law firm Lowey Dannenberg as interim lead counsel for the proposed class action.
A group of traders from across the U.S. who allege that J. P. Morgan Chase manipulated precious metals markets for years are one step closer to bringing a class action suit against the nation’s largest bank.
Earlier this month, a federal judge said five separate lawsuits making similar allegations against the bank could be combined, potentially including thousands of people who traded in the precious metals market from Jan. 2009 through Dec. 2015.
Litigation in a separate civil case has been put on hold until at least May at the behest of the Justice Department, which is investigating a “related criminal case” that involves alleged market manipulation by precious metals traders at J. P. Morgan.

J. P. Morgan declined to comment on this story.
Judge John Koeltl of the Southern District of New York appointed the White Plains, N.Y., law firm Lowey Dannenberg as interim lead counsel for the proposed class action.
Vincent Briganti, a partner at the firm, filed the first suit seeking class action status in November on behalf of Dominick Cognata, a trader who alleges he suffered losses due to J.P. Morgan’s illegal trading conduct in the silver and gold futures and options markets.
That was after the federal court in Connecticut unsealed a criminal plea agreement by John Edmonds, a former J.P. Morgan metals trader. In his guilty plea, Edmonds, who is 36-years old, admitted that he and other “unnamed co-conspirators” fraudulently manipulated the precious metals markets while they were employed at J. P. Morgan from 2009 to 2015.
Edmonds said he had learned the illegal trading tactics from senior traders, and then used them hundreds of times with the knowledge of and consent of his immediate supervisors.
Briganti’s lawsuit also names John Edmonds and a group of yet-to-be-identified precious metals traders and the bank as defendants.
On Wednesday, the lawyers sent a letter to Judge Koeltl saying they were having difficulty locating Edmonds to serve him legal papers and requested a 30-day extension to do so, which the judge granted on Thursday. Briganti noted that they have been in contact with Edmonds’ attorney in the criminal case. Edmonds’ attorney and Briganti could not be reached for comment.
“We are hopeful that this extension will result in completing service on Mr. Edmonds without formal motion practice and a request for alternative means of service,” Briganti said in the letter.
The next step in the civil case is for the plaintiffs to file an amended class action complaint and set a schedule for defendants to respond.
In addition to the proposed class action, J. P. Morgan also faces a separate civil suit which also accuses the bank of rigging precious metals markets.
end
March 4.2019
Parker City News
JP Morgan faces potential class action lawsuit after guilty pleas by a former metals trader
Traders from across the U.S. are banding together to accuse J. P. Morgan Chase of manipulating precious metals markets for years.
At least six lawsuits, all making similar allegations against the nation‘s largest bank, have been filed in New York federal court in the past month, since federal prosecutors in Connecticut with a former J. P. Morgan Chase metals trader.
The cases could potentially include thousands of people who traded in the precious metals market. The White Plains, N.Y., law firm Lowey Dannenberg is asking the court to combine the cases and name it as the lead.
The law firm‘s commodities group is led by Vincent Briganti, the attorney who filed the first lawsuit on behalf of Dominick Cognata, a New York resident who alleges he suffered losses due to J. P. Morgan‘s trading conduct in the silver and gold futures and options markets.
A combined case, seeking class action status, would include anyone who purchased or sold futures contracts or an option on NYMEX platinum or palladium or COMEX silver or gold between at least Jan. 1, 2009, and Dec. 31, 2015. The lawyers believe that “at least hundreds, if not thousands” of traders would be eligible to join the case.
Named as defendants in all of the lawsuits are John Edmonds, a 36-year old former metals trader at J. P. Morgan, a group of yet-to-be-identified precious metals traders and the bank.
Edmonds, a New York resident, pleaded guilty in October to one count of conspiracy to defraud the market and manipulate prices of precious metals futures contracts and one count of commodities fraud. In the criminal plea, Edmonds admitted that he and other “unnamed co- conspirators” at J. P. Morgan, fraudulently manipulated precious metals markets from 2009 to 2015, the same time frame covered in the class action suits.
Briganti filed the initial class action on Nov. 7, just one day after the Justice Department unsealed Edmonds‘ plea in the U.S. District Court of Connecticut.
Edmonds admitted in his guilty plea that he deployed the illegal trading scheme hundreds of times with the direct knowledge and consent of his immediate supervisors. Plaintiffs say they have suffered economic injury, including monetary losses, as a direct result of actions by Edmonds and the other unnamed J. P. Morgan metals traders in the futures and options contracts.
One of the suits alleges that “the number of unlawful trades that JP Morgan traders executed in precious metals futures markets is at least in the thousands.”
J. P. Morgan declined to comment. Lowey Dannenberg did not respond to a request for comment by CNBC.
The Justice Department‘s criminal investigation is still ongoing and recently caused a separate related civil case to be put on hold for at least six months while the government continues its investigation. That civil lawsuit, which also accuses J. P. Morgan of rigging the precious metals market, was filed in 2015 by hedge fund manager Daniel Shak and two commodity traders.
After reviewing the details of the plea agreement, David Kovel, the attorney for Shak‘s suit, sought to re- interview Edmonds, along with two other current and former senior traders at the bank. However, the government argued that reopening questioning would be detrimental to the ongoing criminal investigation. The federal judge overseeing the proceedings ordered a six-month stay in the civil case.
Kovel declined to comment.
Edmonds was originally scheduled to be sentenced in Hartford, Conn., on Wednesday, Dec. 19, but a court filing on Nov. 27 shows the sentencing has been postponed until June. A spokesman for the U.S. Attorney for Connecticut could not elaborate on why the sentencing was postponed since the court filing is under seal.
-END-
S&P Futures Jittery, Nasdaq Surge Continues Ahead Of Fed Decision
For the second night in a row, US equity futures peaked overnight then slumped around the time Europe opened, sliding along European stocks as investors were spooked by a grim economic forecast by the OECD (it is unclear why bad news isn’t good news in this case) ahead of what is expected to be another very dovish statement by the Fed, which pushed the dollar to the most oversold level since 2007.

The Fed will publish its first economic projections since the coronavirus pandemic set off a recession in February that ended a decade-long expansion. Investors will also look for any hints on yield curve control measures amid a recent surge in U.S. Treasury yields. Investors will be looking for reassurance on the central bank’s willingness to keep providing extraordinary support for the economy. Policy makers may also comment on potentially targeting yields for some Treasury maturities. Markets are balancing that with the OECD’s assessment that the economic hit from the pandemic may be deeper than anticipated.
The Fed is also expected to mark the first step away from a complete focus on crisis prevention towards more traditional goals of providing accommodation to support the recovery. As part of this, economists expect that the Fed will announce an open-ended QE program consistent with monthly Treasury purchases of between $65bn and $85bn, while the statement should slightly enhance the commitment to keep rates low by stating that the FOMC will keep rates at current levels until the economy is “close to achieving the Fed’s dual mandate goals of full employment and price stability”.
“Markets have been cautious before the Fed meeting and technical indicators are stretched after the recent powerful rally,” Credit Agricole strategist Jean-Francois Paren wrote in a client note. “For now, it sounds like yield-curve control is the necessary condition for markets to further rally, but it may not be sufficient by itself as it also highlights the fragility of the system we are now living in.”
Some speculate that the Fed may even step in to tame the insane retail investor froth that has gripped the market, but we find that unlikely.
Prospects of even more Fed stimulus, together with optimism about a rebound in the economy, have driven stocks higher in recent weeks, with the Nasdaq notching a record closing high for the second straight session on Tuesday and the S&P 500 ending about 5% below its all-time peak. Of course, the untouchable Nasdaq 100 futures traded in the green all morning, with Apple, Facebook and Amazon.com all rising about 0.5% in premarket trading. Meanwhile as the momentum-to-value rotation reverses, oil majors Exxon Mobil and Chevron dropped about 1.5% each, as oil prices weakened after a rise in U.S. crude inventories raised concerns of oversupply. AMC Entertainment Holdings rose about 4% after the world’s largest theater operator said it expected to reopen its theaters globally in July.
Shortly after 5am ET, Europe’s STOXX 600 Europe turned negative after climbing as much as 0.9% earlier, with travel and leisure and automakers leading losses among sectors. The Index dropped 0.1%, poised for the third consecutive session of declines. Sub-index tracking travel and leisure shares falls 1.3%, automakers down 1%. On the opposite end, personal and household goods advance 0.6%.
Earlier in the session, Asian stocks gained, led by health care and communications, after rising in the last session. Markets in the region were mixed, with Taiwan’s Taiex Index and India’s S&P BSE Sensex Index rising, and Jakarta Composite and Shanghai Composite falling. The Topix declined 0.2%, with Land Co and Besterra falling the most. The Shanghai Composite Index retreated 0.4%, with Shanghai Fengyuzhu Culture and Technology Co Ltd and Beijing Wantai Biological Pharmacy Enterprise posting the biggest slides.
In rates, Treasury futures traded near highs of the day in early US session as stock futures pare gains; the long end was leading, continuing this week’s bull-flattening trend ahead of the FOMC decision, with futures volume about 60% of the 5-day average. Yields are lower by 1bp to 3bp across the curve with 2s10s flatter by 2bp, 5s30s by 0.5bp; 10-year yields richer by 3bp at 0.795%, with bunds cheaper by 2bp ahead of expected syndicated 30- and 20-year deals from Germany and Finland.
In FX, the dollar resumed its recent decline, dropping to the most oversold level since 2007. The Bloomberg Dollar Spot Index fell to a three-month low and the greenback slumped against all of its Group-of-10 peers ahead of the Federal Reserve’s policy meeting.

The euro resumed its March toward $1.14; the Bund curve bull flattened modestly as bunds underperformed Treasuries. The pound continued its lengthy ascent over the dollar thanks to a broad improvement in risk sentiment and plans to raise the pace of reopening the U.K. economy, while short-covering pushed it to modest gains on the euro. The Aussie rose and the yen was set for its biggest three- day gain since March against the dollar into the FOMC meeting.
WTI and Brent futures remain subdued in early mid-week trade as sentiment across the market erodes alongside a number of bearish narratives for the complex. Yesterday’s EIA STEO report cut 2020 world oil demand growth forecast by 120k BPD to 8.34mln BPD but noted it sees US crude output declining 670k BPD (vs. Prev. 540k BPD) this year. In-fitting with the global 2020 contraction viewpoint, OECD forecasts a 2020 contraction of 6.0%, whilst the scenario with a second wave sees global GDP -11.5%. Elsewhere, the weekly Private Inventory data also proved to add to the bearish bias with the headline having printed a surprise build of 8.4mln barrels vs.
Looking at the day ahead, the highlight is the aforementioned Fed decision. Otherwise, data releases include the US CPI reading for May and French industrial production for April. We’ll also hear from the ECB’s de Guindos, Schnabel, Muller and Knot, while the OECD will also be publishing their Economic Outlook.
Market Snapshot
- S&P 500 futures up 0.5% to 3,221.00
- STOXX Europe 600 up 0.6% to 371.62
- MXAP up 0.4% to 162.10
- MXAPJ up 0.5% to 521.14
- Nikkei up 0.2% to 23,124.95
- Topix down 0.2% to 1,624.71
- Hang Seng Index down 0.03% to 25,049.73
- Shanghai Composite down 0.4% to 2,943.75
- Sensex up 0.7% to 34,183.19
- Australia S&P/ASX 200 up 0.06% to 6,148.43
- Kospi up 0.3% to 2,195.69
- German 10Y yield fell 1.0 bps to -0.319%
- Euro up 0.3% to $1.1372
- Brent Futures down 1.6% to $40.52/bbl
- Italian 10Y yield rose 13.8 bps to 1.372%
- Spanish 10Y yield rose 0.9 bps to 0.646%
- Brent Futures down 1.6% to $40.52/bbl
- Gold spot up 0.3% to $1,720.21
- U.S. Dollar Index down 0.3% to 96.08
Top Overnight News
- Investors are waiting to see if Fed officials discuss a possible return to the 1940s-era policy of yield-curve control
- The top U.S. specilaist in infectious diseases called the coronavirus pandemic his “worst nightmare” and warned that the deadly outbreak is far from over
- The ECB’s first three-month dollar swap allotment for $75.8 billion is set to mature on Thursday, making Wednesday’s operation the time to rollover. This accounts for over half of the total outstanding ECB swap lines
- U.K. Chancellor of the Exchequer Rishi Sunak is being asked by members of the ruling Conservative party to take decades to pay off the record debt the country is racking up as it tries to weather the coronavirus pandemic
- The global iron ore market may flip to a deficit if a virus-driven mine halt in Brazil persists and prices are now “on a knife edge,” UBS Group AG said in a warning that reflects a rising tide of concern over the suspension’s potential implications. Futures held above $100 a ton
- China’s factory deflation deepened in May and consumer price gains slowed, signaling that the recovery isn’t yet strong enough to produce inflation pressures
Asian equity markets traded somewhat indecisively after the mostly negative lead from global peers amid cautiousness heading into the FOMC, which saw all major indices on Wall St stall aside from the Nasdaq as tech resilience boosted it briefly above the historic 10K milestone. ASX 200 (+0.1) declined at the open with Australia dragged by weakness in financials and energy but with the losses gradually pared amid gains in defensives and improved consumer sentiment, while Nikkei 225 (+0.1%) was also initially pressured due to a firmer currency and larger than expected contraction in Machine Orders before staging a rebound to take back the 23K level. Hang Seng (U/C) and Shanghai Comp. (-0.4%) were varied with Hong Kong lifted at the open after the government’s bailout of Cathay Pacific which saw the airline’s shares take-off at the open, while the mainland lagged from the get-go as participants digested a somewhat tepid PBoC liquidity operation and softer than expected Chinese inflation data. Furthermore, tensions also lingered in the background as the Global Times suggested China could restrict the use of Qualcomm chips in government entities and key sectors related to national security, while it may also conduct anti-monopoly investigations and impose tariffs on US firms. Finally, 10yr JGBs were choppy around 152.00 amid similar indecision seen in the regional stock markets and with prices failing to benefit from today’s Rinban announcement in which the BoJ were present in the market for JPY 800bln of JGBs heavily concentrated in the belly.
Top Asian News
- Indonesian Stocks Slump Most in Five Weeks on Pandemic Concern
- Architect of Japan’s Virus Strategy Sees Flaw in West’s Approach
- China Protests Japan’s Plan For a G-7 Statement on Hong Kong
European equities have given up earlier gains and fall deeper into negative territory [Euro Stoxx 50 -0.8%] as stocks market failed to sustain the mostly positive APAC lead as players take some chips off the table ahead of some key risk events including the latest FOMC decision (full preview available on the newsquawk research suite) alongside the Eurogroup meeting later this week. News-flow has been light for the session but nonetheless bourses broadly post mild losses. Sectors are mostly in negative territory with more of an anti-cyclical bias and thus pointing to a more risk averse session. The detailed breakdown paints a picture in a similar vein and sees Travel & Leisure underperforming the region. In terms of individual movers, Spanish giant Inditex (+2.8%) erased earlier earning-induced downside of around 3% amid a jump in online sales. Commerzbank (+0.3%) holds its head above water but has waned off prior highs of c.3% which initially emanated from reports its second largest shareholder Cerberus (5% holding) demanded a fix-up of the group’s board. Shares thereafter drifted lower in tandem with yields. Elsewhere, Julius Baer (-1.5%) extended on losses amid reports the firm is facing another enforcement proceeding by FINMA over proper anti-money-laundering procedures.
Top European News
- Swedes Finally Learn Who Shot Their Prime Minister Olof Palme
- Frankie and Benny’s Owner to Close About 125 Restaurants
- KKR Considers Minority Investment in Italy’s Open Fiber: MF
In FX, the Dollar continues to depreciate amidst increasingly bearish price action as the index falls further from early June recovery highs in a declining pattern of daily ranges. Indeed, after a couple of attempts to revisit 97.000+ post-NFP peaks, the DXY has faded on each occasion, and the latest effort to bounce fell short of 96.500 to leave the index precarious above the round number below and eyeing the FOMC for fresh direction. However, Fed expectations do not suggest much in the way of a reprieve for the Greenback even though the aforementioned US jobs data was encouraging in terms of hopes for a relatively speedy rebound from the deep COVID-19 depths of unemployment, with the economic outlook still shrouded in uncertainty and hardly helped by violent protests or renewed global trade tensions. From a technical perspective, nearest support for the DXY comes in at 95.914 (March 11 low), while resistance remains at 97.069 (Monday’s apex) and the current range is 96.460-057.
- NZD/CHF/AUD – All vying for top G10 ranking, with the Kiwi firmly back above 0.6500 and not far from Tuesday’s best, while the Aussie is testing 0.7000 amidst reports of bids under the big figure from exporters and leverage accounts. Elsewhere, the Franc has forged more gains towards 0.9450 and 1.0750 vs the Euro, albeit still not cleanly or convincingly through the 200 DMA as the single currency maintains its bullish momentum against the Buck.
- JPY/GBP/EUR/CAD – The next best majors in descending order, with Usd/Jpy extending its marked retreat from circa 109.85 last Friday through more apparent supports, including the 30 DMA (107.54) to expose the only real downside chart level left before 107.00, at 107.09 (May 29 reaction low). Similarly, if Cable can sustain a break above Fib resistance around 1.2778 then 1.2800 beckons ahead of 1.2849 (March 12 high) and a more meaningful technical trendline at 1.2860, while Eur/Usd is inching closer to its post-NFP pinnacle (1.1384), but may find 1.1400 protected by decent option expiry interest between 1.1390-95 (1.2 bn). Turning to Usd/Cad, 1.3400 is still proving pivotal as crude prices consolidate off post-OPEC+ peaks and the pair looks to US CPI data before the Fed for additional impetus in the absence of anything scheduled on the Canadian front.
- SCANDI/EM – Waning risk sentiment and softer oil has thwarted another sub-10.5000 Eur/Nok move aided by firmer than expected Norwegian inflation metrics, while Eur/Sek has bounced from just shy of 10.4100 following further declines in Swedish household consumption and awaiting commentary from Riksbank Governor Ingves. Conversely, ongoing Dollar weakness has kept the HKMA active in defence of the currency peg and the Turkish Lira has derived traction from closer FX position monitoring by the CBRT rather than a fall in the jobless rate.
In commodities, WTI and Brent futures remain subdued in early mid-week trade as sentiment across the market erodes alongside a number of bearish narratives for the complex. Yesterday’s EIA STEO report cut 2020 world oil demand growth forecast by 120k BPD to 8.34mln BPD but noted it sees US crude output declining 670k BPD (vs. Prev. 540k BPD) this year. In-fitting with the global 2020 contraction viewpoint, OECD forecasts a 2020 contraction of 6.0%, whilst the scenario with a second wave sees global GDP -11.5%. Elsewhere, the weekly Private Inventory data also proved to add to the bearish bias with the headline having printed a surprise build of 8.4mln barrels vs. Expectations for a draw of 1.7mln. Meanwhile in Libya, production at the El-Sharara oil field (300k BPD) was reportedly shut-off again and the NOC later confirmed the continuation of a force majeure at the Sharara oil field. WTI July extends losses below USD 38/bbl (vs. high) and Brent August moves in tandem below USD 40.50/bbl (vs. high) as traders await the weekly EIA inventory data ahead of the FOMC rate decision. In terms of metals, spot gold ekes mild gains amid the risk-reversal from the APAC session coupled with a softer USD, but price action remains somewhat muted in anticipation of the Fed policy decision. Copper prices are underpinned by a weaker USD despite the deteriorating sentiment – Shanghai copper rose to near 20-week highs amid strong demand from China. Dalian iron meanwhile failed to benefit from the China demand as rising shipments from miners pressure prices.
US Event Calendar
- 8:30am: US CPI Ex Food and Energy MoM, est. 0.0%, prior -0.4%; CPI Ex Food and Energy YoY, est. 1.3%, prior 1.4%
- 8:30am: US CPI MoM, est. 0.0%, prior -0.8%; 8:30am: US CPI YoY, est. 0.3%, prior 0.3%
- 8:30am: Real Avg Hourly Earning YoY, prior 7.5%; Real Avg Weekly Earnings YoY, prior 6.9%
- 2pm: Monthly Budget Statement, est. $544.0b deficit, prior $207.8b deficit
- 2pm: FOMC Rate Decision
DB’s Jim Reid concludes the overnight wrap
I suspect the Fed will have a bigger audience today at the conclusion of their FOMC meeting and let’s hope they aren’t as stuck as acoustic chill radio. In their preview, our US economists write (link here) that they expect today’s meeting to mark the first step away from a complete focus on crisis prevention towards more traditional goals of providing accommodation to support the recovery. As part of this, they expect that the Fed will announce an open-ended QE program consistent with monthly Treasury purchases of between $65bn and $85bn, while the statement should slightly enhance the commitment to keep rates low by stating that the FOMC will keep rates at current levels until the economy is “close to achieving the Fed’s dual mandate goals of full employment and price stability”.
In terms of what else to look out for, the return of the quarterly Summary of Economic Projections will be a key highlight. This wasn’t released in March because of the difficulties in forecasting as the pandemic took hold. It will have the FOMC’s range of views on the path forward for growth, inflation and unemployment. In terms of the dot plot, our economists expect that all participants will project the fed funds target range to remain at its current level through 2021. Beyond that, a few may see lift-off in 2022 but they think the median dot will still be at current levels through the end of the forecast horizon in 2022.
Ahead of the Fed, there was an unwinding of investor risk appetite yesterday and a reversal of the recent catch-up trade that has been dominating over the last 1-2 weeks. By the end of the session, the S&P 500 was down -0.78%, its biggest setback in nearly 3 weeks, while the VIX index of volatility was up +1.76pts to a one-week high. This was in spite of tech stocks outperforming after a week or so of lagging, with the NASDAQ advancing +0.29% to reach a new record high. In fact, Information Technology and Communication Services (headlined by Google, Netflix and Facebook) were the only US sectors positive yesterday. Over in Europe, equities lagged behind the US after a good recent run, with the STOXX 600 down -1.22%. Banks certainly didn’t help, as the STOXX Banks index ended a run of 11 gains in the last 12 sessions to fall by -3.78%.
EU finance ministers met yesterday over video conference at the annual meeting of the EIB Board of Governors. While there was little new information, the meeting did highlight the differing viewpoints that will be negotiated at the European Council meeting later this month. The ministers discussed the overall size of the additional stimulus needed for the bloc, as well as what percent of those funds would be grants vs. loans. The other key topic discussed was whether conditions may be placed on the funds, and what they would be. German Finance Minister Scholz indicated that a €500bn fund would be a good outcome (note that the Commission has proposed €750bn), which would appear disappointing. The original Merkel-Macron announced plan was for €500bn, but it was fully in the form of grants, which is likely a non-starter.
Earlier in the day, Bloomberg reported that EU leaders could hold an emergency summit on the recovery fund on July 9-10. That would be in addition to an already planned European Council video conference on June 19 to discuss the matter. Meanwhile the Austrian finance minister said in a statement that the recovery fund’s size and shape wasn’t acceptable for the country.
Against this backdrop, sovereign debt sold off in Europe yesterday, with yields on 10yr bunds up +1.0bp, as the spread of Italian (+8.7bps) and Spanish (+7.9bps) 10yr yields over bunds saw a noticeable widening. Safe havens outperformed yesterday as equities pulled back, with the Japanese yen (+0.62% vs. USD) and the Swiss franc (+0.72%) the top two G10 currencies yesterday. This trend was seen elsewhere, with gold rallying by +0.99% and yields on 10yr treasuries falling by -5.0bps.
In terms of how Asia is trading this morning, it’s been another fairly mixed session with the Nikkei flat, and Shanghai Comp (-0.50%) down and the Hang Seng (+0.15%) and Kospi (+0.11%) both posting modest gains. Meanwhile, futures on the S&P 500 are up +0.46%. Elsewhere, WTI oil prices are down -1.87% overnight after a report from the American Petroleum Institute said that the US crude stockpiles rose by 8.42 million barrels last week. If confirmed by the EIA this would be the largest build since end of April. In terms of overnight data releases China’s May CPI printed at +2.4% yoy (vs. +2.7% yoy expected) while PPI came in at -3.7% yoy (vs. -3.3% yoy expected).
As mentioned at the top DB has recently become bearish on the dollar and on a related theme one of our FX Strategists, Robin Winkler, put out a report yesterday (link here ) highlighting the lack a of holistic reopening plan across US regions and how this could raise risks of a prolonged infection period. The analysis uses Rt, the effective transmission rate, to judge whether a second wave is imminent. If Rt is above 1, cases can grow exponentially, while when below 1, cases fall and the virus is suppressed. When aggregating state-level Rt estimates up to the national level, reopening since mid-April caused a fairly linear rise in the effective transmission rate with a 0.02 rise in Rt for every 10% reopened. That beta implies that a full reopening of the country from -25% mobility back to normal would take Rt to nearly 1.00, using Google mobility data. The problem with this analysis is that not all states are average, indeed some larger states like Texas and California have transmission rates far closer to 1 already, making their reopening more risky. 40% of the country may be able to get back to normal currently, mostly rural and lower infected regions, while the rest of the country would need to retain some degree of lockdown until transmission rates fall lower. Coordination would help with this issue, but this is unlikely during an election year as the issue of lockdowns has become partisan. According to transmission rates a coordinated response would likely reopen states that voted Democrat in the last Presidential election rather than Republican, and so the federal government may be less inclined to orchestrate. One of the best predictors of any given state’s return from lockdown today is how the state voted in the 2016 election. Given the inability to close state borders, a lack of coordination means that reopening plans for some states may be drawn out for longer or alternatively open those states up to a second wave. See the full report for more.
In terms of yesterday’s data, the number of US job openings in April fell to a lower-than-expected 5.046m (vs. 5.750m expected), which is the lowest number since December 2014. Meanwhile the quits rate, which is the number who are voluntarily leaving their job as a share of the labour force, fell to a 9-year low of 1.4%. However, the NFIB small business optimism index for May did rise to 94.4 (vs. 92.5 expected). In German data, April exports fell by -25.0% month/month (vs. -15.6% expected and -11.7% last month), and down -31.1% on a year/year basis. This was the largest one month change in the data series going back to 1950. Finally, there was a slight positive revision to the Euro Area’s economic contraction in Q1, with the decline revised down to -3.6% (vs. -3.8% previously).
To the day ahead now with the aforementioned Federal Reserve decision and Chair Powell’s subsequent press conference likely to be the highlight. Otherwise, data releases include the US CPI reading for May and French industrial production for April. We’ll also hear from the ECB’s de Guindos, Schnabel, Muller and Knot, while the OECD will also be publishing their Economic Outlook.
3A/ASIAN AFFAIRS
i)WEDNESDAY MORNING/ TUESDAY NIGHT:
SHANGHAI CLOSED DOWN 12.36 POINTS OR 0.42% //Hang Sang CLOSED DOWN 7.49 POINTS OR 0.03% /The Nikkei closed UP 33.92 POINTS OR 0,15%//Australia’s all ordinaires CLOSED UP .10%
/Chinese yuan (ONSHORE) closed UP at 7.0606 /Oil DOWN TO 38.10 dollars per barrel for WTI and 40.47 for Brent. Stocks in Europe OPENED RED// ONSHORE YUAN CLOSED DOWN // LAST AT 7.0606 AGAINST THE DOLLAR. OFFSHORE YUAN CLOSED UP ON THE DOLLAR AT 7.0544 TRADE TALKS STALL//YUAN LEVELS GETTING DANGEROUSLY PAST 7:1//TRUMP INITIATES A NEW 25% TARIFFS FRIDAY/MAY 10/MAJOR PROBLEMS AT HUAWEI /CFO ARRESTED//CORONAVIRUS/PANDEMIC/USA RIOTS : /ONSHORE YUAN TRADING BELOW LEVEL OF OFFSHORE YUAN/ONSHORE YUAN TRADING STRONGER AGAINST USA DOLLAR/OFFSHORE YUAN TRADING STRONGER AGAINST THE DOLLAR /TRADE DEAL NOW DEAD..TRUMP RAISED RATES TO 25%
3 a./NORTH KOREA/ SOUTH KOREA
South Korea
b) REPORT ON JAPAN
3 C CHINA
CHINA
China releases terrible numbers: CPI, PPI. Both at multi year lows.
(zerohedge)
Whatever China’s Doing Isn’t Working: CPI, PPI Miss, Tumble To Multi-Year Lows
Whatever China is doing to stimulate its economy, it isn’t working.
For the second month in a row China’s CPI and PPI missed badly, with CPI sliding from 3.3% Y/Y yo just 2.4%, below the expected 2.7%, and the lowest since March of 2019. PPI meanwhile slumped from -3.3% to -3.7%, the lowest gate inflation since early 2016, and a testament to just how much pricing power Chinese companies are losing.

While Chinese 10Y TSY yields initially dipped in kneejerk response, they have since rebounded to up on the day, rising to 2.824%, and close the highest level since February. In recent weeks Chinese yields have been on a tear as it became clear that the PBOC will not pursue a wholesale rate cut despite vowing to do just that during last month’s People’s Congress.
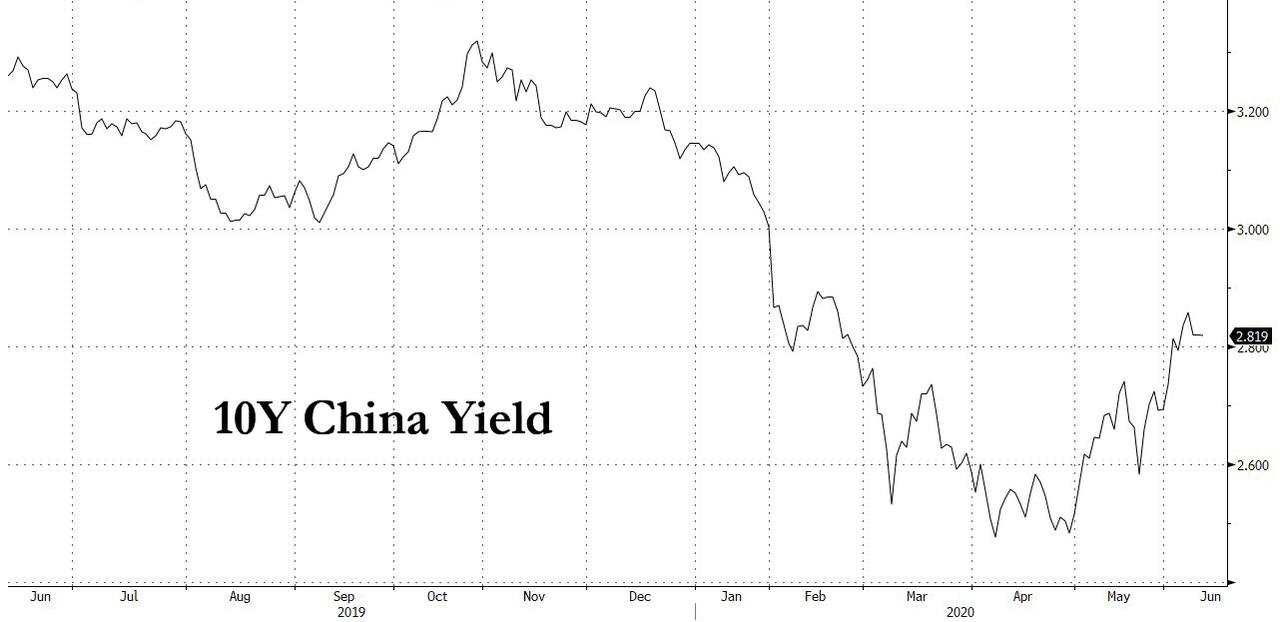
Bizarrely, Chinese stocks are actually lower on the news – if only for the time being – a shocking and logical response in a world where everything has long since gone upside down.
end
4/EUROPEAN AFFAIRS
SPAIN
TOTAL INSANITIY
EMAIL ROBERT TO ME
|
5. RUSSIAN AND MIDDLE EASTERN AFFAIRS
SYRIA
Economically, Syria’s economy is a free fall as sanctions have basically killed the country. They are running out of dollars. Prior to the civil war the Syrian pound was trading at 50 to one USA dollar. Now 3,500 to one as goods disappear off their shelves
(AlmasdarNews/zerohedge)
As Syria’s Currency Plummets, US Mocks Economic Crisis: “Our Sanctions Contributed To The Collapse”
Syria criticized the statements of the American envoy, James Jeffrey, about the current situation in Syria, stressing that it affirms that the United States is looking at the region with “Israeli eyes”, and it also represents a recognition by Washington of its responsibility for the suffering of the Syrian people.
An official source in the Syrian Ministry of Foreign Affairs told state-owned SANA, “The intensification of sanctions is the other side of the declared war on Syria after the aggressive project staggered in the face of successive defeats of its tools from terrorist groups,” according to the Syrian News Agency.
The source said, “These statements confirm once again that the United States is looking at the region with Israeli eyes, because the demands that Jeffrey talks about are old and renewed Israeli demands to impose their control on the region.”
He continued: “This American policy, which constitutes a flagrant violation of the most basic human rights and international humanitarian law, will fail again in the face of the Syrians insistence to adhere to the sovereignty of their homeland and the independence of their political and economic options.”
The U.S. envoy to Syria, James Jeffrey, said in a video interview with a number of Syrians abroad two days ago that the U.S. sanctions against Damascus “contributed to the collapse of the value of the Syrian pound” and that “the Syrian regime is no longer able to manage an effective economic policy, or launder money from Lebanese banks, due to the economic crisis that is also affecting Lebanon.”
For years just prior to the outbreak of the war beginning in 201150 Syrian Pounds equaled $1…
Joshua Landis
✔@joshua_landis
Syrian pound exchange reaches 3500 SYL against US dollar.
Syria’s inflation rate is about 11.5% per month. It’s generally considered that hyperinflation sets in around 50% per month, when currency can no longer be used as a store of value.https://www.syriahr.com/en/?p=168771 https://twitter.com/joshua_landis/status/1269694780335968260 …
Currency slump | Syrian pound keeps plummeting as exchange rate records 3500 SYL against US dollar…
The Syrian Observatory for Human Rights has monitored during the last 24 hours a very rapid collapse of the Syrian pound against the U.S. dollar. Markets are witnessing an astronomical rise in the…
syriahr.com
Joshua Landis
✔@joshua_landis
The floor is falling out from under the Syrian Pound. Syria is in the thick of an economic crisis. https://twitter.com/ibrahimhamidi/status/1269677708914679810 …


He added that “the U.S. Congress stood behind (Caesar’s law), and that the sanctions covered by the law to protect Syrian civilians, will automatically affect any economic activity, as well as any dealings with the Iranian regime.”
The U.S. administration recently approved the “Caesar Law” which comes into effect this month.
The Caesar Law, in addition to the Syrian government, targets all individuals and companies who provide funding or assistance to Syria, as well as a number of Syrian industries, including those related to infrastructure, military maintenance, and energy production.


In this context, Jeffrey indicated that his country had presented Syrian President Bashar al-Assad with a way out of this crisis, and that if he was “interested in his people, he would accept the offer. Washington wants to see a political process and it may not lead to a regime change.”
Jeffrey boasted of US sanctions as the population suffers for extreme lack of resources and basic staples:
“Do sanctions work?… But as we see with the total freefall of the Syrian pound right now and other indicators – shortages of gas and other fuels – the Assad regime is under tremendous economic pressure...”
Kuwaiti newspaper Al-Qabas revealed Jeffrey’s offer, noting that “it requires going to a political solution to implement Security Council Resolution 2254 and the cision, and ompletion of a new constitution and holding elections under U.N. supervision after achieving a safe and neutral environment and acceptance of international decisions,” stressing that Washington’s offer is Assad’s commitment to the “Geneva 1” statement, which he says is not possible to stay in power.
6.Global Issues
World Bank now asserts no V shaped recovery in all of the global economy in 2021. China’s stimulus is not working, many nations still in lockdown and the uSA is facing boarded up businesses
(zerohedge)
What No “V”? World Bank Forecasts “Subdued” Recovery In Global Economy In 2021
The World Bank has just released its new “Global Economic Prospects” report, describing how the COVID-19 pandemic has unleashed a “devastating blow” on the global economy — shredding all hopes that a V-shaped recovery will be seen this year.
The report goes on to say the global economy will contract for the first time since World War II and emerging market economies will shrink for the first time in six decades — the result of the global economic downturn is between 70 to 100 million people will be thrown into instant poverty.
The report investigates the depth and breadth of the economic impacts triggered by worldwide virus lockdowns in the first half of 2020, along with the socio-economic consequences thereafter. We make sense of this in the piece titled “Global Instability, Soaring Deficits And Civil Disobedience: Are We Back In The 1960s, And What Happens Next?.”
It said the 2020 baseline forecast for Global GDP would be a contraction of 5.2%— the deepest global recession in eight decades despite unprecedented monetary and fiscal policy by central banks and governments. Emerging markets will shrink by at least 2.5%, the report said, adding that it will be the worst performance for the data since the early 1960s.
The virus-induced recession is the first since 1870 to be triggered solely by a pandemic. The speed and depth at which it hit developed and emerging economies suggest a sluggish recovery will be seen in 2020, with low probabilities of a V-shaped recovery this year. Additional rounds of stimulus to restart the global economy will need to be seen.
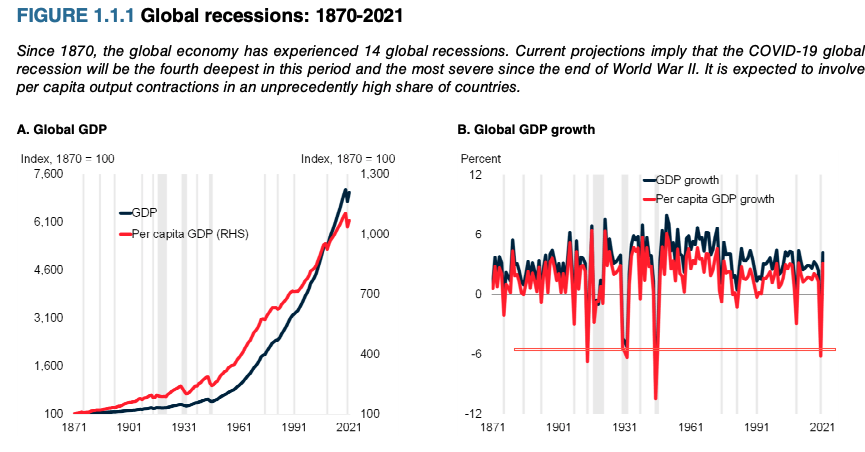
“While a global recovery is envisioned in 2021, it is likely to be subdued,” the World Bank said.
The World Bank expects developed economies will contract by 7%, led by a 9.1% decline in growth for Europe this year. Breaking down the numbers, the US is expected to contract by 6.1% — while China could post a 1% expansion.
The global lender proposed two alternative scenarios. The first is a COVID-19 second wave that triggers another round of travel restrictions that would result in the worldwide economy plunging by 8% this year. If the virus can be controlled and reopenings are continued through the back half of the year, the contraction would be around 4% — still, this figure is twice the depth at which it was during the recession a decade ago.
“The global recession would be deeper if bringing the pandemic under control took longer than expected, or if financial stress triggered cascading defaults,” the World Bank said.
As for the socio-economic impacts, the decline may push 70-100 million people into extreme poverty – the economic scarring of today’s downturn will be long-lasting with a new era of high unemployment, low growth, and breakdowns in world trade and supply linkages.
Read: “Hopes Of ‘V-Shaped’ Recovery Sink As World Trade Refuses To Rebound”
The World Bank’s latest report paints a “grave near-term outlook” — and does not support a V-shaped recovery for this year.
But-but-but — equity futures believe in the V-shaped recovery!
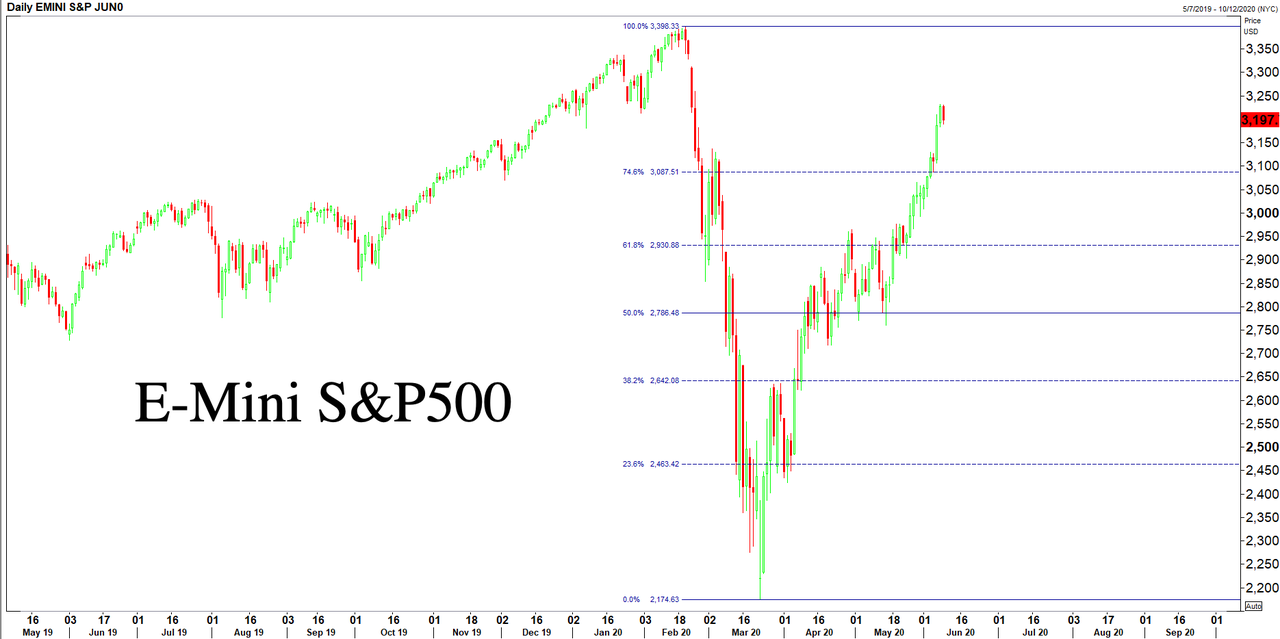
7. OIL ISSUES
figures!!
Goldman Made $1 Billion As Oil Plunged Below Zero
Back in late March, Goldman stunned commodity traders when its energy strategist Jeffrey Currie predicted that landlocked oil (such as WTI, and unlike Brent) could trade negative in the very near future as a result of the massive demand plunge in oil and gasoline consumption resulting from the coronavirus shutdowns. This forecast was impressive for two reasons: just 20 days later, the prompt WTI contract indeed plunged into negative territory for the first time ever as those who were set to receive delivery of WTI barrels had no space to store it and ending paying buyers to take it off their hands, sending the price of the maturing contract to as low as negative $40. The second reason, is that Goldman’s trading desk actually took Goldman’s advice and prepared for oil to crater.
As a result, while countless of (most retail) traders suffered massive losses as oil plunged from $15 to -$40 in one session, Goldman made a killing. According to Bloomberg, Goldman’s commodities desk generated more than $1 billion in revenue this year through May, benefitting from oil’s wild swings for its best start in a decade.
The unprecedented mayhem in oil markets sent crude plunging below zero, left corporate risk managers scrambling and forced retail investors to unwind bets. But it presented an opportunity for Wall Street traders to score big gains. The windfall is a redemption for the unit, which less than two years ago faced an uncertain future under new boss David Solomon, who frowned upon a business that wasn’t making enough money.
As Bloomberg adds, much of the boost came from oil trading overseen by Anthony Dewell and Qin Xiao, “who correctly positioned their desks for the collapse in prices” by which Bloomberg means they actually read and traded on Goldman’s own in house research – which is traditionally meant to lure clients to take positions opposite to the house’s own prop positions but in this case actually was spot on – such as this report from March 30 which laid out precisely what would happen.

As Bloomberg further details, the bank’s early gains from that turmoil were under Xiao:
The Singapore-based partner, known as QX to colleagues, oversees the commodities business in Asia. Even as stocks ticked toward record highs, Xiao anticipated the risk of an economic meltdown. It soon came to pass as the pandemic took hold in Asia and went global. He was positioned accordingly for oil and a variety of related products as prices slumped by two-thirds in the first quarter.
Dewell, as Xiao’s London-based counterpart, ran trades that correctly anticipated a collapse in the WTI futures market in April as storage tanks filled and prices spiraled toward zero. That move prompted a wave of forced selling from investor products such as exchange-traded funds that weren’t designed with the possibility of negative prices in mind.
The blockbuster trade was reminiscent of an era a decade ago when Goldman’s commodity unit generated annual revenue of around $3 billion. But it later fell out of favor as those earnings slumped, and it even faced the risk of getting dismantled as Solomon’s team took over and questioned its necessity. Ultimately, the new management backed off, and instead carried out modest cuts and publicly affirmed support for the division. Considering the $1 billion return on that decision, DJ-Sol may want to reconcisder if scrapping what was once Wall Street’s most respected trading desk and replacing it with a credit card and loan business for subprime Americans is really what Goldman wants to be remembered for.
8 EMERGING MARKET ISSUES
Your early morning currency/gold and silver pricing/Asian and European bourse movements/ and interest rate settings WEDNESDAY morning 7:00 AM….
Euro/USA 1.1386 DOWN .0008 REACTING TO MERKEL’S FAILED COALITION/ REACTING TO +GERMAN ELECTION WHERE ALT RIGHT PARTY ENTERS THE BUNDESTAG/ huge Deutsche bank problems ///ITALIAN CHAOS//CORONAVIRUS/PANDEMIC// /AND NOW ECB TAPERING BOND PURCHASES/JAPAN TAPERING BOND PURCHASES /USA RISING INTEREST RATES /FLOODING/EUROPE BOURSES /ALL RED
USA/JAPAN YEN 107.36 DOWN 0.430 (Abe’s new negative interest rate (NIRP), a total DISASTER/NOW TARGETS INTEREST RATE AT .11% AS IT WILL BUY UNLIMITED BONDS TO GETS TO THAT LEVEL…
GBP/USA 1.2794 UP 0.0085 (Brexit March 29/ 2019/ARTICLE 50 SIGNED/BREXIT FEES WILL BE CAPPED/
USA/CAN 1.3384 DOWN .0038 CANADA WORRIED ABOUT TRADE WITH THE USA WITH TRUMP ELECTION/ITALIAN EXIT AND GREXIT FROM EU/(TRUMP INITIATES LUMBER TARIFFS ON CANADA/CANADA HAS A HUGE HOUSEHOLD DEBT/GDP PROBLEM)
Early THIS WEDNESDAY morning in Europe, the Euro FELL BY 8 basis points, trading now ABOVE the important 1.08 level FALLING to 1.1219 Last night Shanghai COMPOSITE CLOSED DOWN 12.36 POINTS OR 0.42%
//Hang Sang CLOSED DOWN 7.49 POINTS OR 0.03%
/AUSTRALIA CLOSED UP 0,10%// EUROPEAN BOURSES ALL RED
Trading from Europe and Asia
EUROPEAN BOURSES ALL RED
2/ CHINESE BOURSES / :Hang Sang CLOSED DOWN 7.49 POINTS OR 0.03%
/SHANGHAI CLOSED DOWN 12.36 POINTS OR 0.42%
Australia BOURSE CLOSED UP. 10%
Nikkei (Japan) CLOSED UP 33.92 POINTS OR 0.15%
INDIA’S SENSEX IN THE GREEN
Gold very early morning trading: 1724.20
silver:$17.87-
Early WEDNESDAY morning USA 10 year bond yield: 0.81% !!! DOWN 2 IN POINTS from TUESDAY’S night in basis points and it is trading WELL BELOW resistance at 2.27-2.32%.
The 30 yr bond yield 1.56 DOWN 2 IN BASIS POINTS from TUESDAY night.
USA dollar index early WEDNESDAY morning: 96.03 DOWN 36 CENT(S) from TUESDAY’s close.
This ends early morning numbers WEDNESDAY MORNING
xxxxxxxxxxxxxxxxxxxxxxxxxxxxxxxxxxxxxxxxxxxxxxxxxxxxxxxxxxxxxxxxxxxxxxxxxxxxxxxxxxxxxxxxxxxxxxxxxxxxxxxxxxxxxx6
And now your closing WEDNESDAY NUMBERS \1: 00 PM
Portuguese 10 year bond yield: 0.64% UP 5 in basis point(s) yield from YESTERDAY/
JAPANESE BOND YIELD: +.02% DOWN 0 BASIS POINTS from YESTERDAY/JAPAN losing control of its yield curve/56
SPANISH 10 YR BOND YIELD: 0.67%//UP 5 in basis point yield from yesterday.
ITALIAN 10 YR BOND YIELD:1,54 UP 8 points in basis points yield from yesterday./
the Italian 10 yr bond yield is trading 87 points higher than Spain.
GERMAN 10 YR BOND YIELD: FALLS TO –.33% IN BASIS POINTS ON THE DAY//
THE IMPORTANT SPREAD BETWEEN ITALIAN 10 YR BOND AND GERMAN 10 YEAR BOND IS 1.87% AND NOW ABOVE THE THE 3.00% LEVEL WHICH WILL IMPLODE THE ENTIRE ITALIAN BANKING SYSTEM. AT 4% SPREAD THERE WILL BE A HUGE BANK RUN…
END
IMPORTANT CURRENCY CLOSES FOR WEDNESDAY
Closing currency crosses for WEDNESDAY night/USA DOLLAR INDEX/USA 10 YR BOND YIELD/1:00 PM
Euro/USA 1.1348 UP .0015 or 8 basis points
USA/Japan: 107.23 DOWN .560 OR YEN UP 56 basis points/
Great Britain/USA 1.2491 UP .0057 POUND UP 57 BASIS POINTS)
Canadian dollar UP 29 basis points to 1.3396
xxxxxxxxxxxxxxxxxxxxxxxxxxxxxxxxxxxxxxxxxxxxxxxxxxxxxxxxxxxxxxxxxxxxxxxxxxxxxxxx
The USA/Yuan,CNY: AT 7.0610 ON SHORE (UP)..GETTING DANGEROUS
THE USA/YUAN OFFSHORE: 7.0565 (YUAN UP)..GETTING REALLY DANGEROUS
TURKISH LIRA: 6.7905 EXTREMELY DANGEROUS LEVEL/DEATH WISH.
the 10 yr Japanese bond yield closed at +.02%
Your closing 10 yr US bond yield DOWN 5 IN basis points from TUESDAY at 0.78 % //trading well ABOVE the resistance level of 2.27-2.32%) very problematic USA 30 yr bond yield: 1.54 DOWN 4 in basis points on the day
Your closing USA dollar index, 96.23 DOWN 9 CENT(S) ON THE DAY/1.00 PM/
Your closing bourses for Europe and the Dow along with the USA dollar index closing and interest rates for WEDNESDAY: 12:00 PM
London: CLOSED DOWN 6.78 0.19%
German Dax : CLOSED DOWN 39.63 POINTS OR .31%
Paris Cac CLOSED DOWN 24.37 POINTS 0.48%
Spain IBEX CLOSED DOWN 65.60 POINTS or 0.85%
Italian MIB: CLOSED DOWN 148.63 POINTS OR 0.55%
WTI Oil price; 38.30 12:00 PM EST
Brent Oil: 40.85 12:00 EST
USA /RUSSIAN / RUBLE FALLS: 68.76 THE CROSS LOWER BY 0.08 RUBLES/DOLLAR (RUBLE HIGHER BY 8 BASIS PTS)
TODAY THE GERMAN YIELD FALLS TO –.33 FOR THE 10 YR BOND 1.00 PM EST EST
END
This ends the stock indices, oil price, currency crosses and interest rate closes for today 4:30 PM
Closing Price for Oil, 4:00 pm/and 10 year USA interest rate:
WTI CRUDE OIL PRICE 4:30 PM : 39.02//
BRENT : 41.15
USA 10 YR BOND YIELD: … 0.73 1/2 down 10 basis points…
USA 30 YR BOND YIELD: 1.51 down 7 basis points..
EURO/USA 1.1370 ( UP 38 BASIS POINTS)
USA/JAPANESE YEN:107.17 DOWN .625 (YEN UP 63 BASIS POINTS/..
USA DOLLAR INDEX: 96.04 DOWN 28 cent(s)/
The British pound at 4 pm Britain Pound/USA:1.2739 UP 28 POINTS
the Turkish lira close: 6.7758
the Russian rouble 68.46 UP 0.14 Roubles against the uSA dollar.( UP 14 BASIS POINTS)
Canadian dollar: 1.3414 UP 9 BASIS pts
German 10 yr bond yield at 5 pm: ,-0.32%
The Dow closed DOWN 282.31 POINTS OR 1.04%
NASDAQ closed UP 66.60 POINTS OR 0.77%
VOLATILITY INDEX: 27.63 CLOSED UP .06
LIBOR 3 MONTH DURATION: 0.314%//libor dropping like a stone
LIBOR/OIS: .194%
TED SPREAD (3 MONTH TREASURY VS LIBOR) = .133%
USA trading today in Graph Form
“Chaos Is Coming” – Bullion, Bonds, & Big-Tech Bid As Dollar & Dow Dumped
Hugh Hendry warned that “Chaos is coming”…
Hugh Hendry Eclectica@hendry_hughCHAOS is coming!

And, by many measures, it’s already here – as these two muppet-mutilating stocks show…
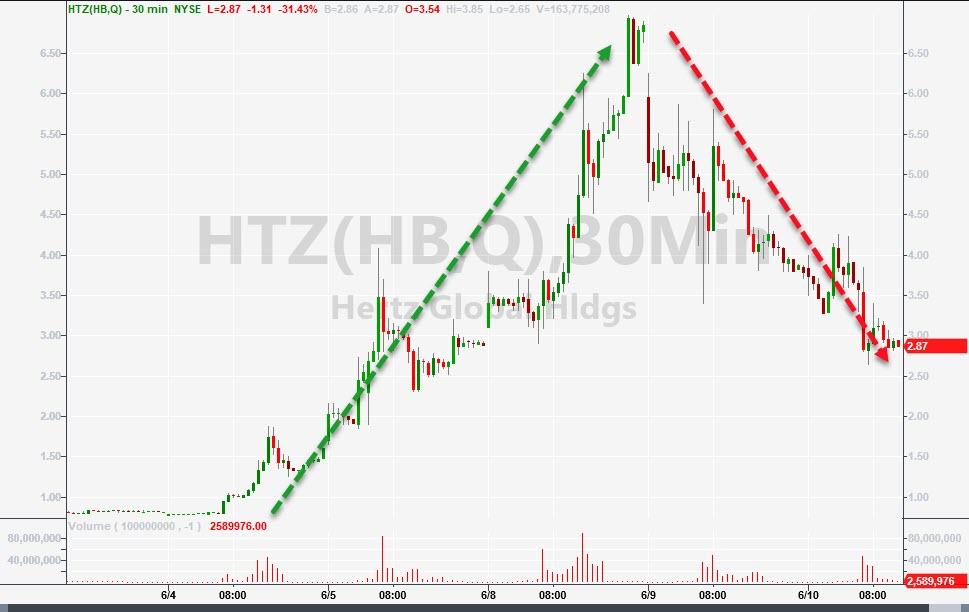
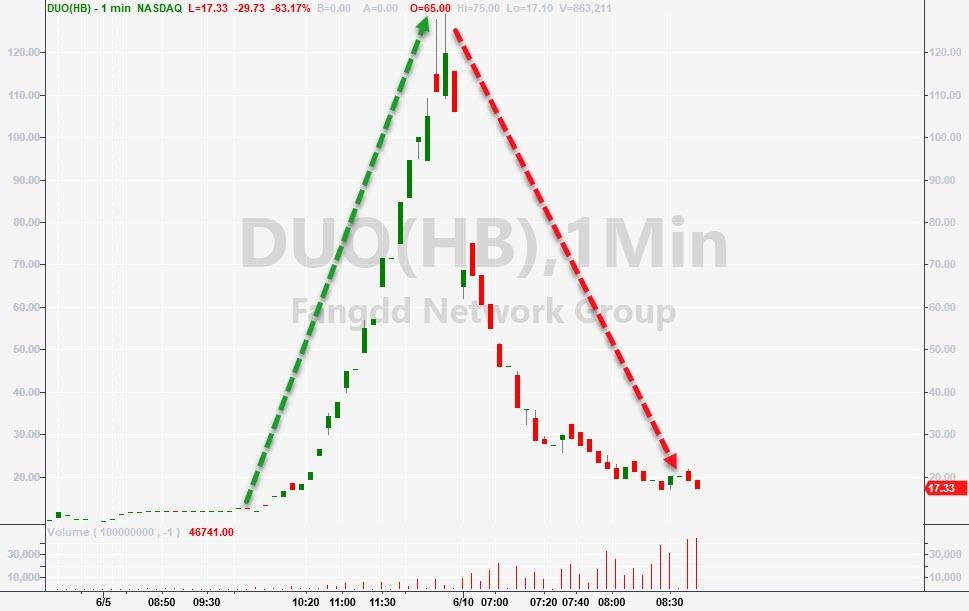
And here’s a preview of tomorrow’s carnage-inducing stock…
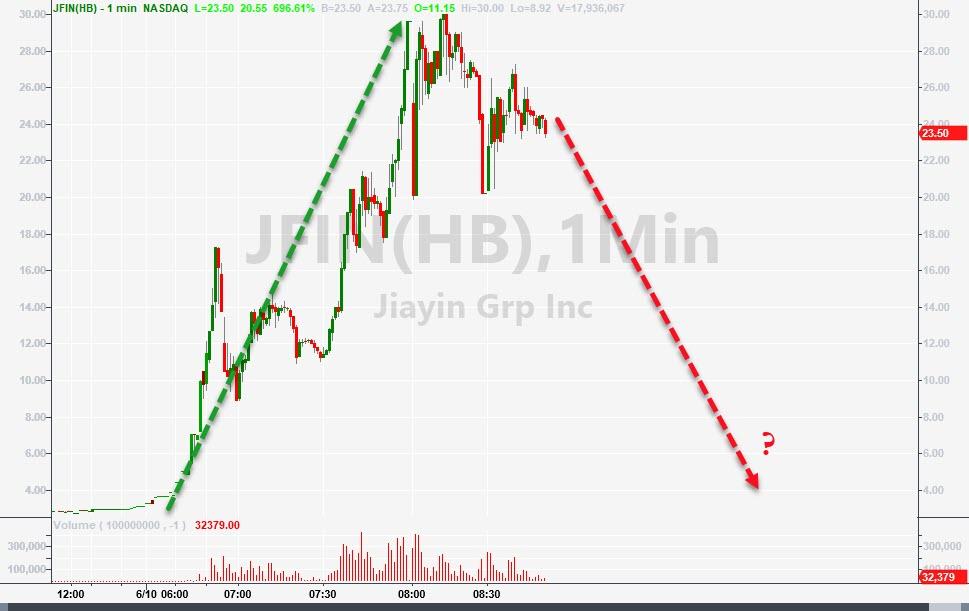
Well played Robinhood!
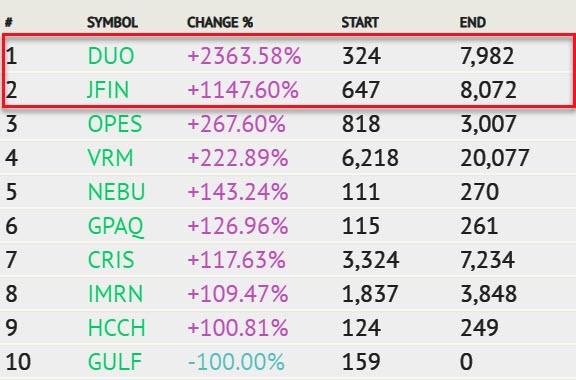
FANG stocks were bid once again – with many of the mega-tech stocks hitting record highs…
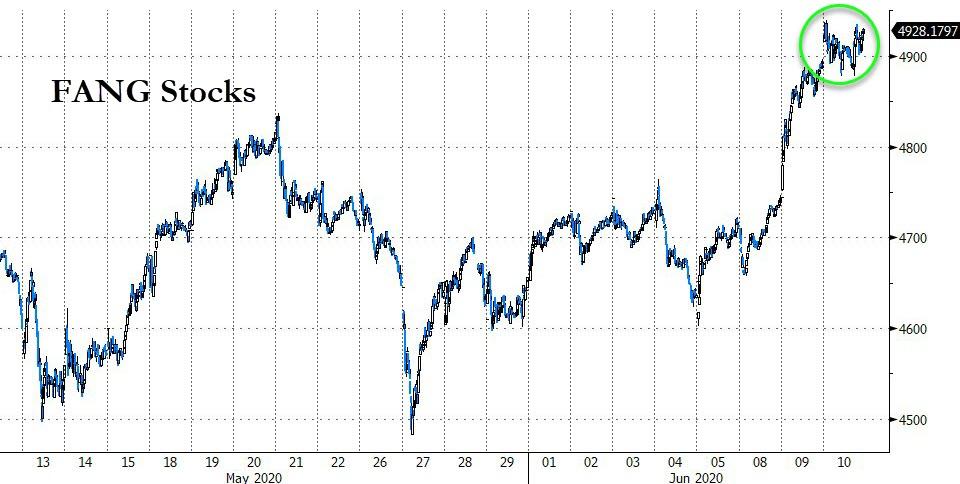
Source: Bloomberg
Lifting Nasdaq on the day as Small Caps were slammed…
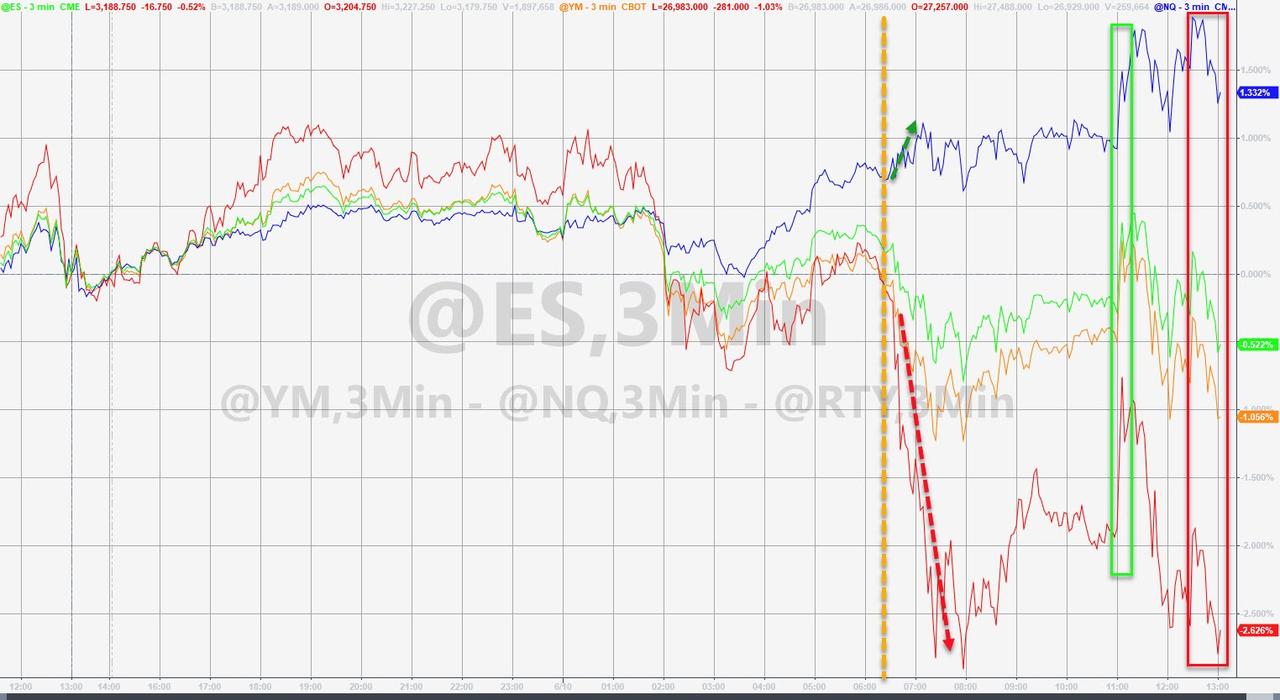
Bank stocks were battered again as rates fell and flattened…
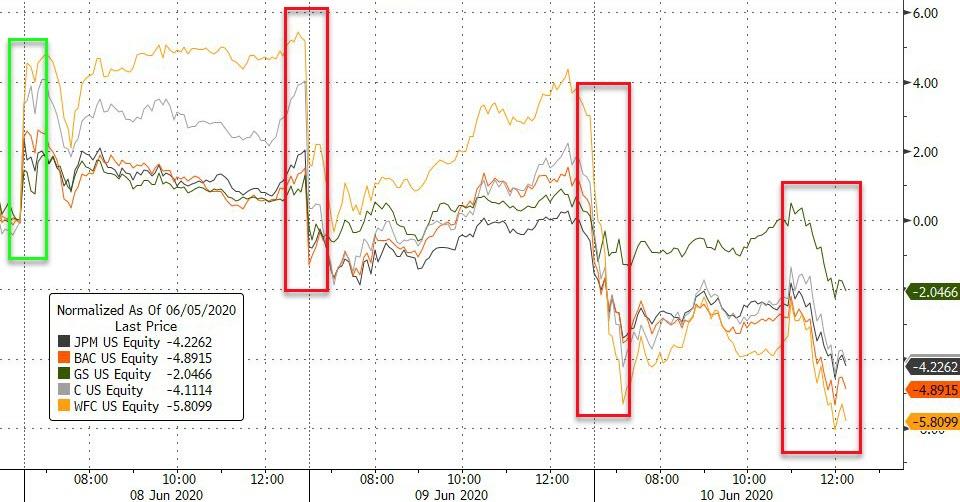
Source: Bloomberg
Banks relative performance has tracked the yield curve almost too perfectly…

Source: Bloomberg
Market-neutral momentum bounced hared again today after briefly touching unchanged on the year…
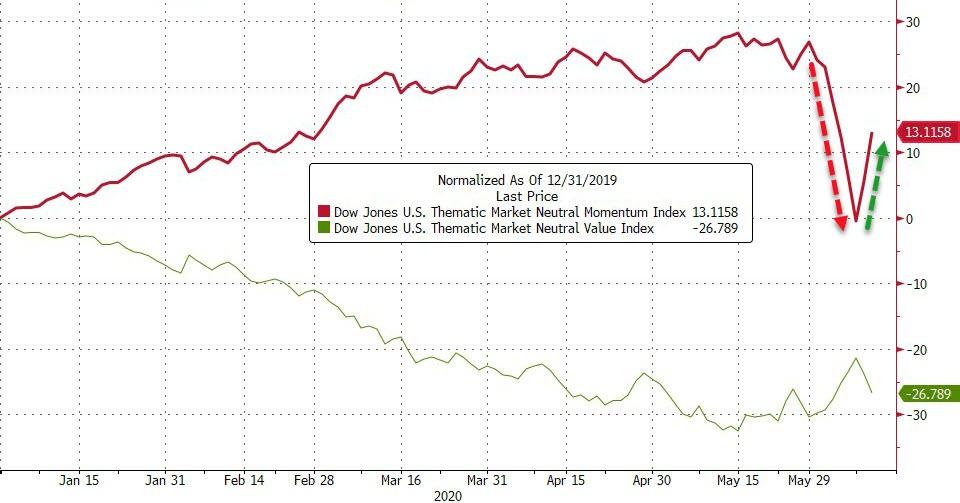
Source: Bloomberg
Here’s what The Fed did…
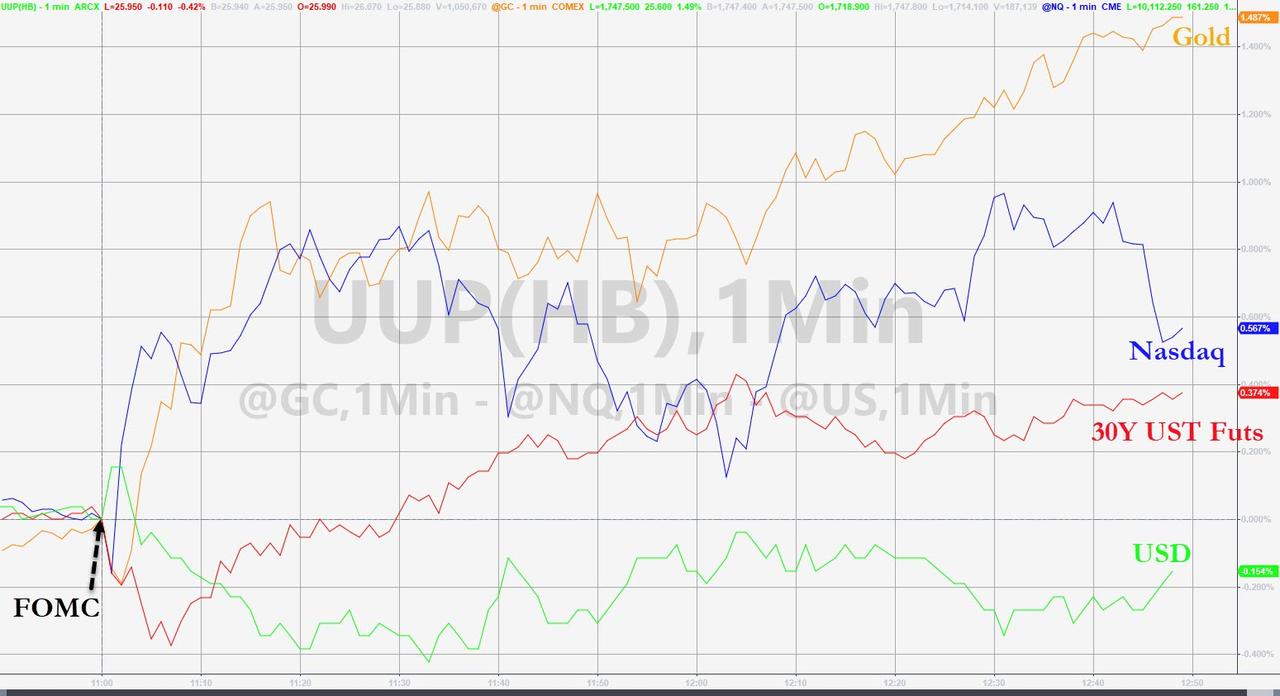
But Gold was the big gainer after The Fed unleashed formal QE, pretty much monetizing America’s deficits going forward…

Silver also surged, back above $18…
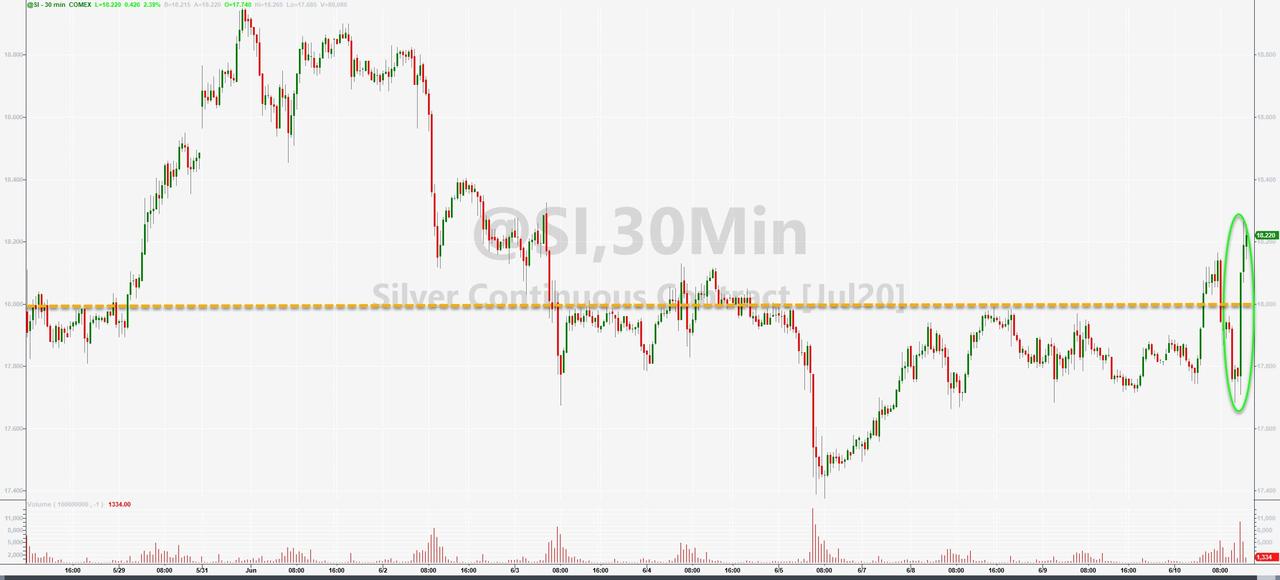
The dollar was monkey-hammered lower… (this is the 9th down day for the dollar in the last 10 and 14th down day in the last 18)
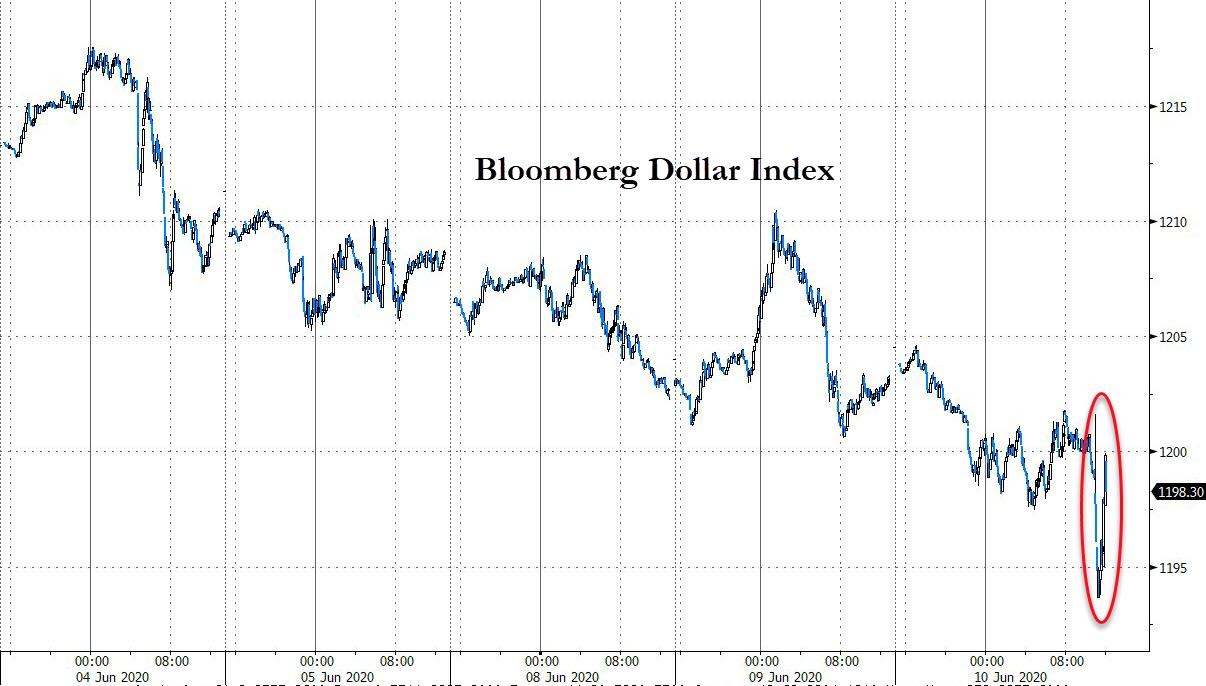
Source: Bloomberg
To its lowest since early March…
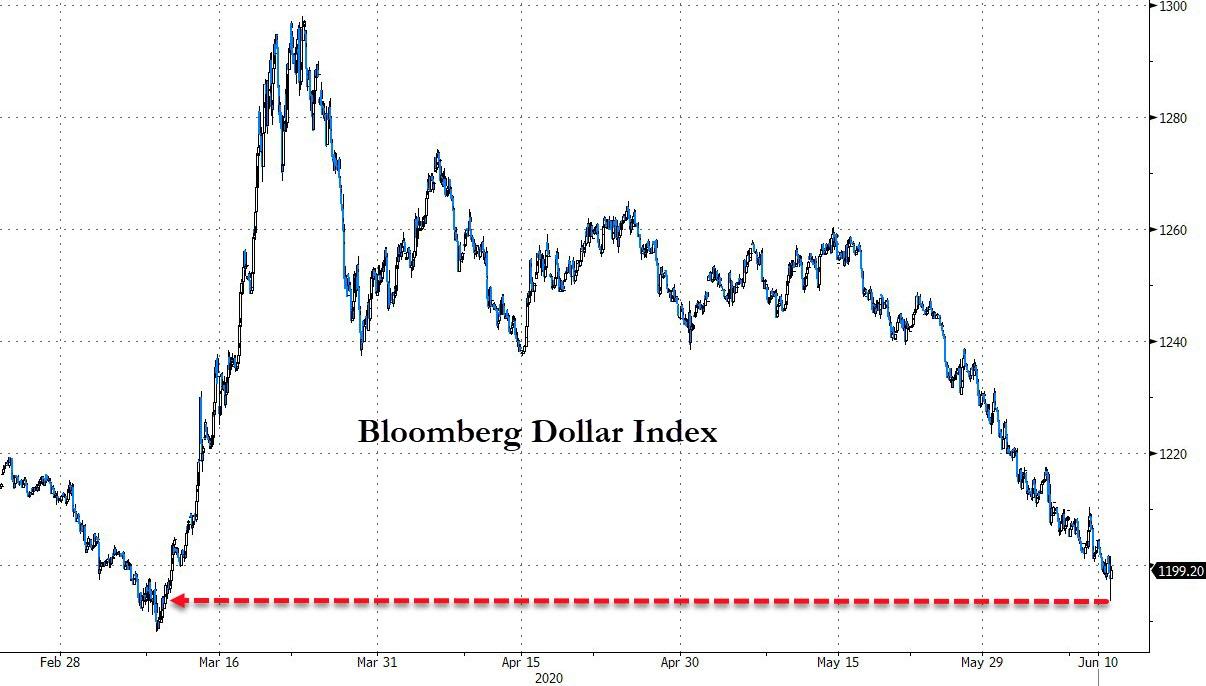
Source: Bloomberg
Treasury yields tumbled…

Source: Bloomberg
The belly of the curve outperformed (7Y -9bps, 2Y -3bps, 30Y -6bps)…

Source: Bloomberg
Short-term rate expectations eased…
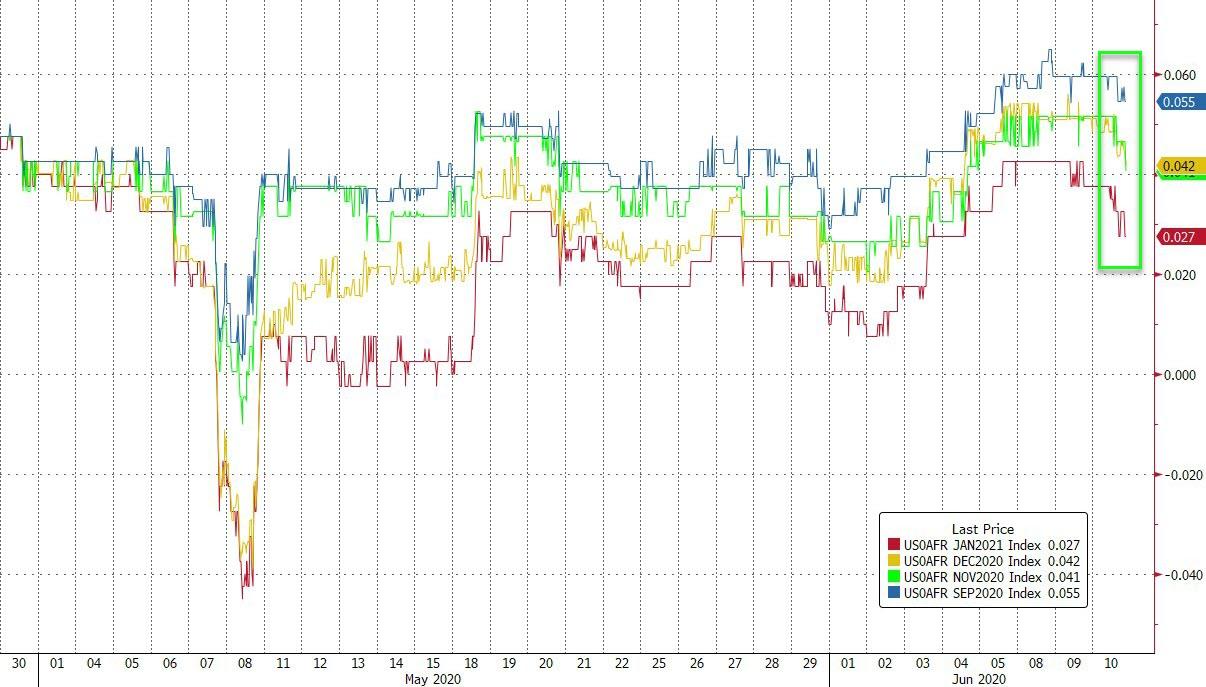
Source: Bloomberg
Oil prices rose despite a big crude build to record high US stockpiles… (but it did fall after The Fed)…
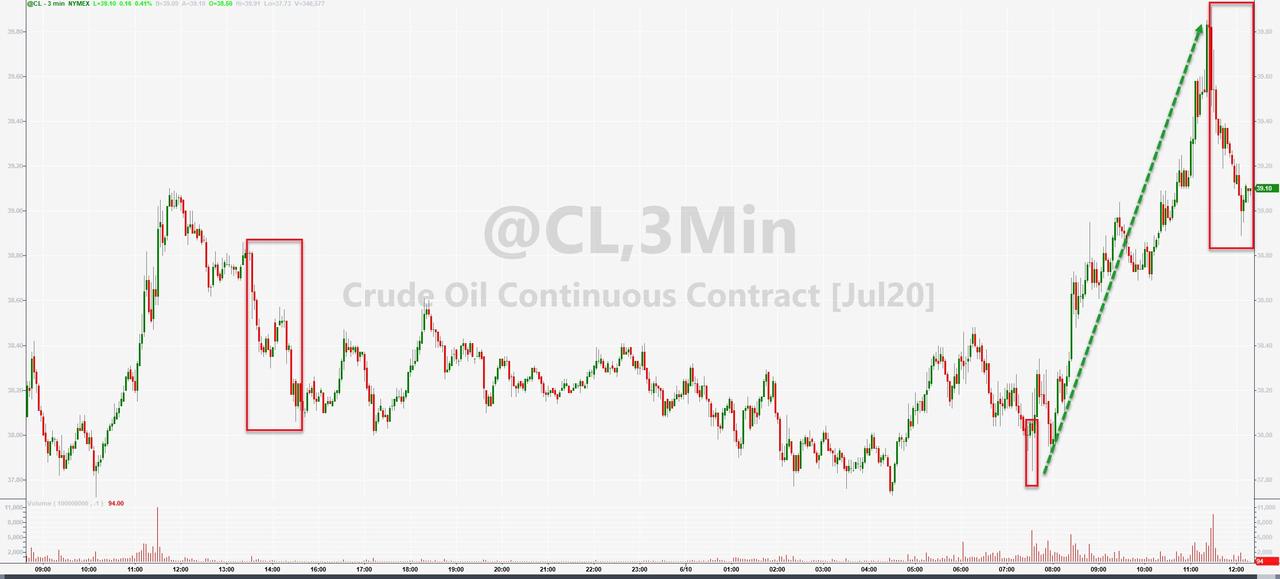
Bitcoin briefly spiked above $10k after The Fed…
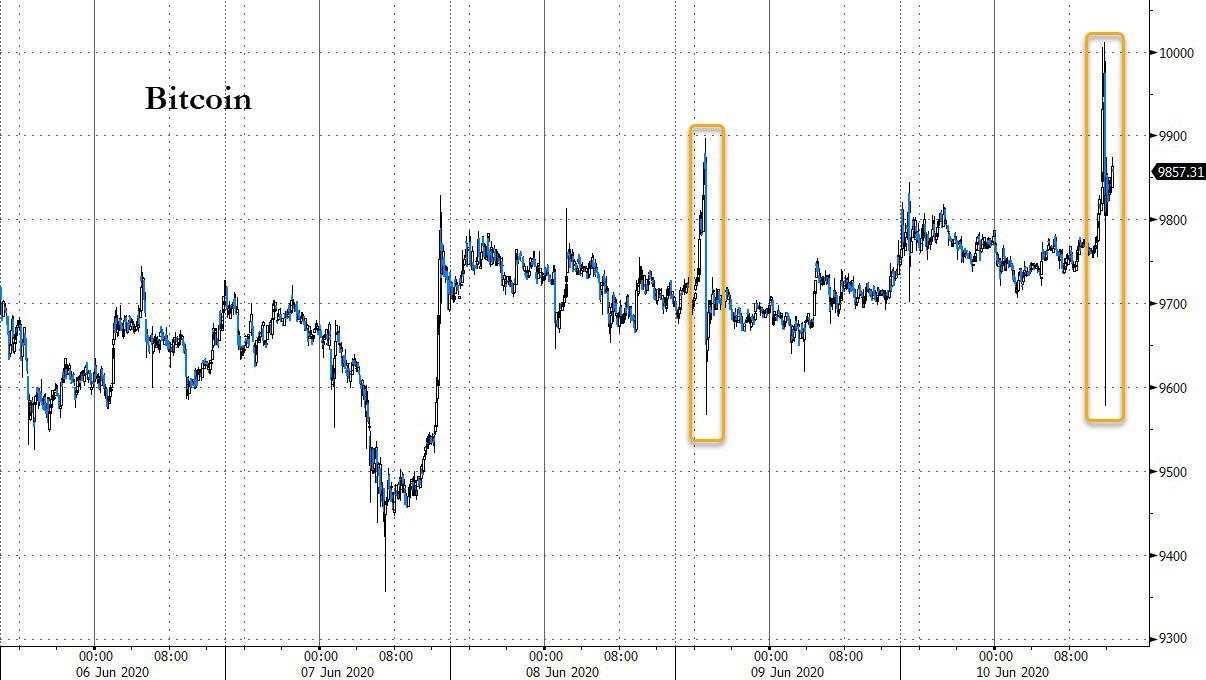
Source: Bloomberg
Silver outperformed gold today…

Source: Bloomberg
Finally, there’s this… Fed Chair Powell basically admitted to The Fed Put (but stocks still stumbled)
- *POWELL: WE WANT INVESTORS TO PRICE IN RISK LIKE MARKETS SHOULD
- *POWELL: POPPING ASSET BUBBLE WOULD HURT JOB-SEEKERS
As Bloomberg notes, stocks may be the ultimate beneficiary of trillions of dollars in economic stimulus from the Federal Reserve, according to Savita Subramanian, Bank of America Corp.’s chief U.S. equity strategist.
“Liquidity looking for a home” is bolstering the FANG stocks…
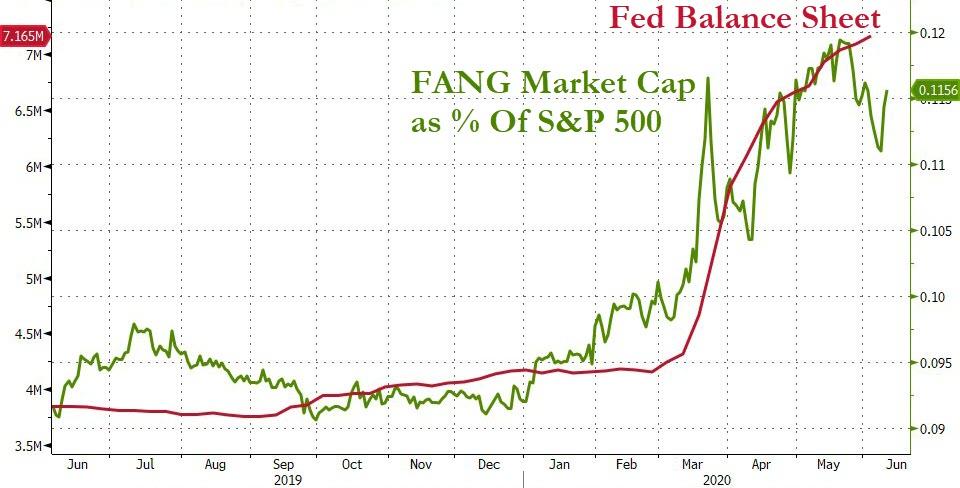
Source: Bloomberg
To infinity and beyond!
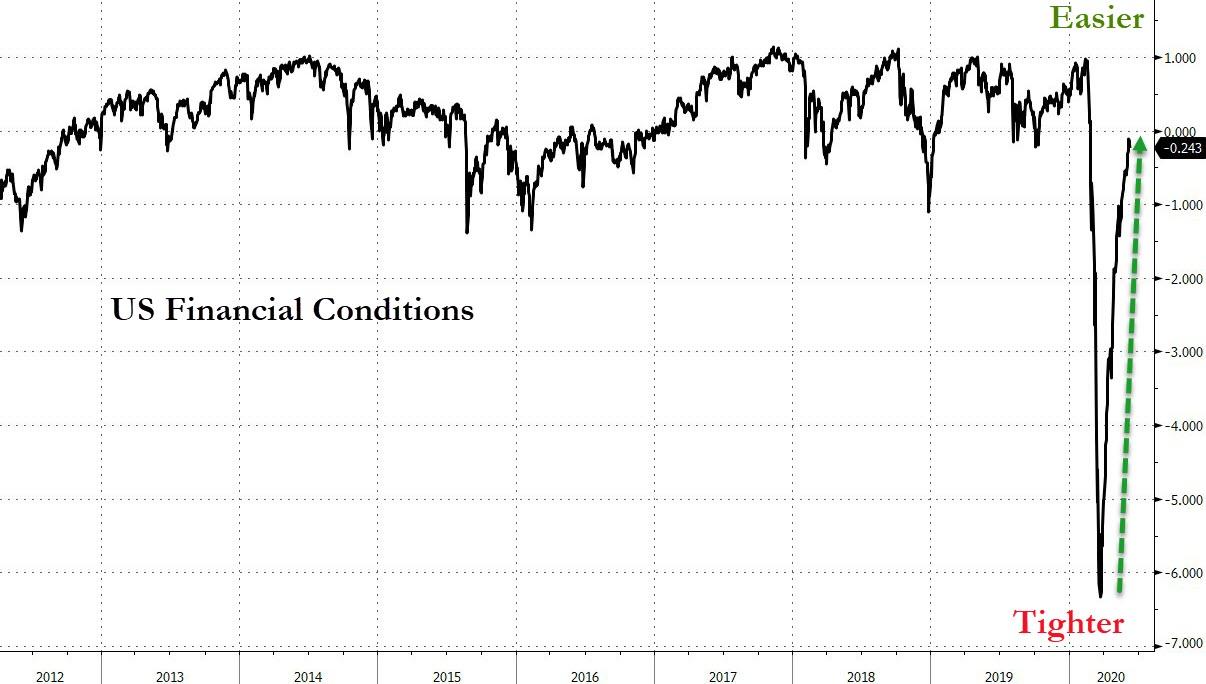
Source: Bloomberg
end
And now your more important USA stories which will influence the price of gold/silver
MARKET TRADING//USA
a)Market trading/THIS MORNING/USA
Dow Dives, Nasdaq Roars As Robinhood & TD Ameritrade Go Down… Again…
As the US equity market opened, both Robinhood and TD Ameritrade websites ‘mysteriously’ went down.
Robinhood actually started to suffer outages at around 0840ET…
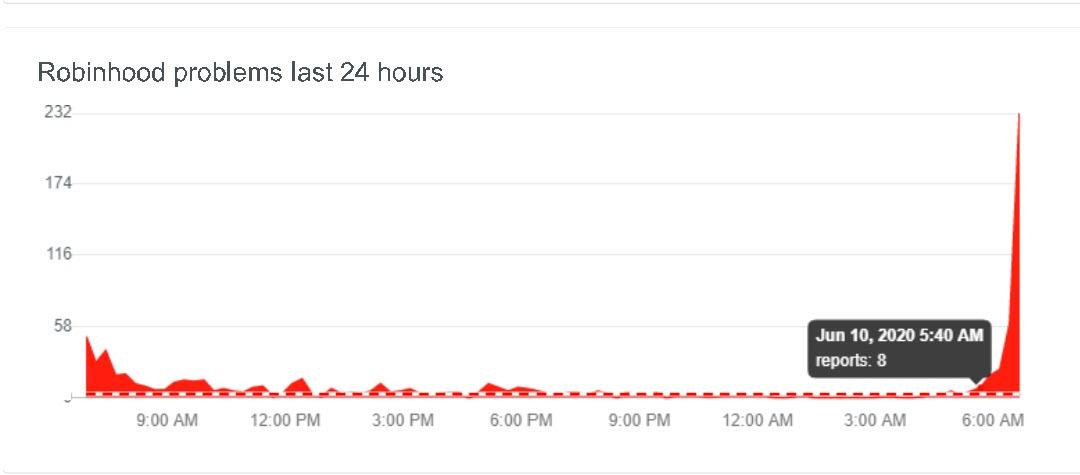
And TD Ameritrade at 0925ET…
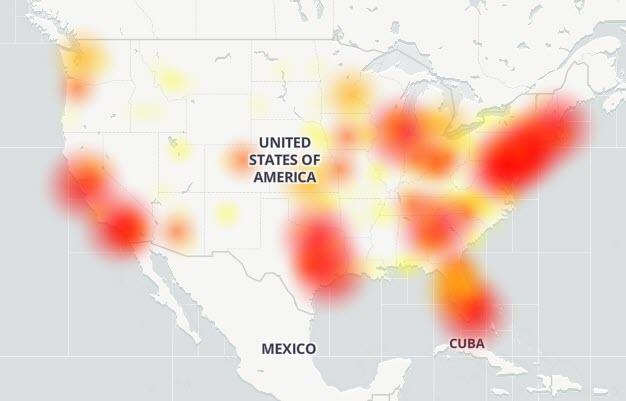
And as that happened, The Dow dumped…

And Nasdaq Soared…

end
b)MARKET TRADING/USA/AFTERNOON
FOMC Formalizes $80Bn/Month QE, No Negative-Rates Signaled, Slashes GDP Forecast
Since The Fed’s last statement, on April 29th, one “asset class” has done particularly well as bonds, bullion, and the greenback have slipped lower. Spot the odd one out…
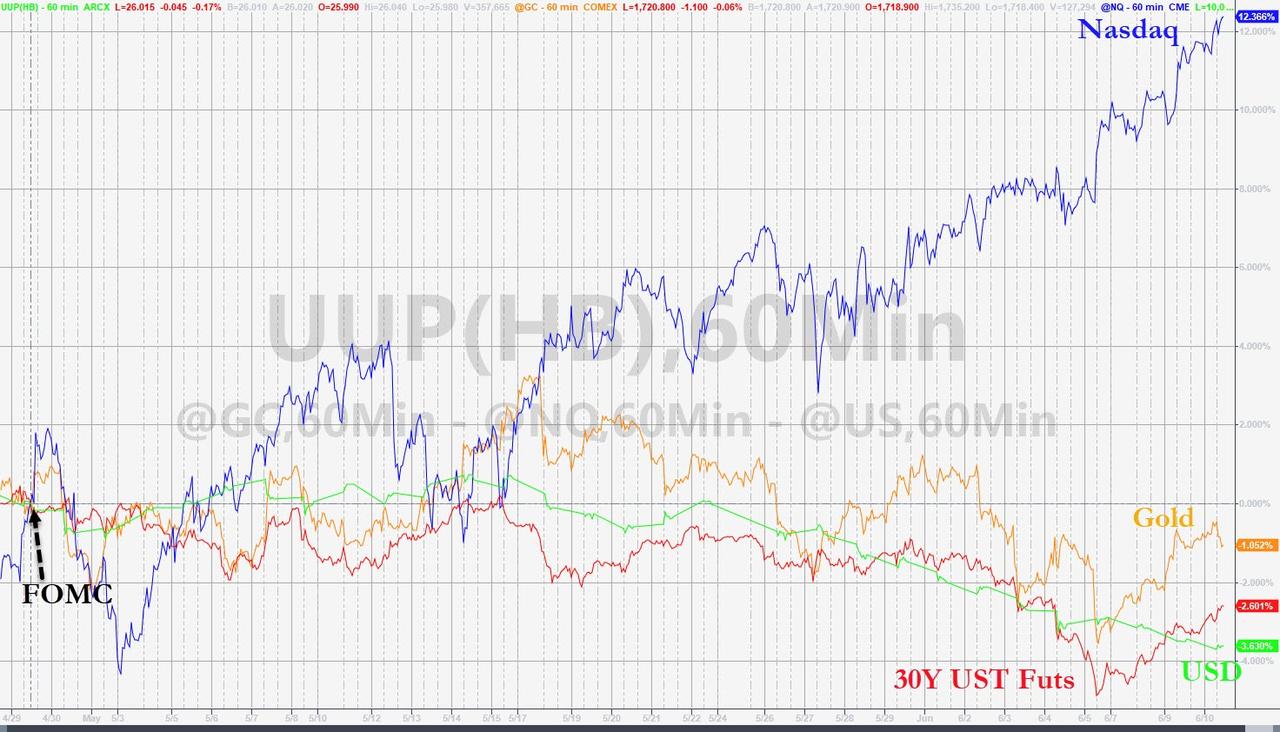
Rate trajectory expectations have had a wild ride in the six weeks since the last FOMC (drifting ionto negative rate expectations at one point) but are now back to being modestly ‘easier’ than at the last meeting…
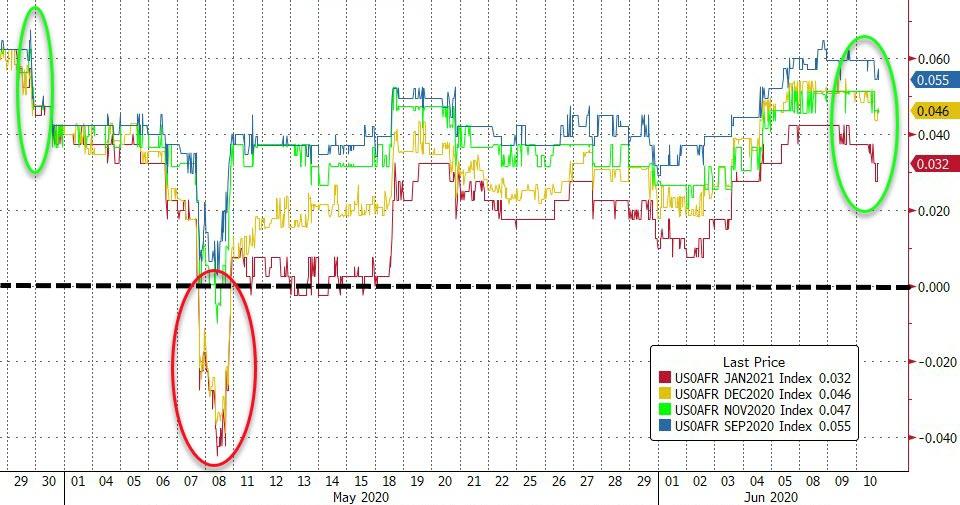
Source: Bloomberg
As we detailed earlier, the Fed is likely to focus on forward guidance on rates and asset purchases: it is a given that rates are on hold until normal economic service has been resumed, and then some, and also that the FOMC will continue to expand its special lending facilities even further despite the fact that the worst of the economic downturn is already behind us. However, the markets are only really going to be focused on four things:
- Will the Fed open the door even a crack to negative rates? The Fed does not seem to be in a hurry to tweak the IOER rate, even though that would help reduce the occurrence of negative implied Fed Funds rates and thus quell some of the speculation about negative US rates in our view. However, despite market chatter we believe that European- and Japanese-style negative rates are a no-go for the Fed.
- Will we see Yield Curve Control (YCC)? If so, which parts of the US Treasury curve will, Japanese- and Aussie-style, cease to function as a real market? Would it just be the short end of the curve? That leaves the door open for curve steepening of the kind seen in recent sessions, which carries the risk of real pain for borrowers. Moreover, with the massive expansion of US Federal debt, YCC out to 2 years would mean issuance at the short end and constantly having to roll it over. In other words, raising the Fed Funds rate again would not be possible until public debt was under more control – which realistically means never. Or might YCC be longer, say out to 7 years? This would give greater room to spread the looming trillions that will flow, and perhaps enough time for some optimists to presume an economic turn-around within that period is possible. Yet could we even see that financial totem of all totems, the US 10-year, under YCC? If so the global debt benchmark is not looked at, but sat on like a bench. Japan is already doing it.
- Can the Fed manage to do either of the above without the US Dollar falling out of bed? The structural bull argument for USD is still there, but current momentum is such that hinting at negative rates and/or pegging US yields could easily push it down. The Fed aren’t responsible for the USD, but they certainly know that is true. The question is whether they are either desperate enough about the outlook not to care, or are happy about a currency weakness they can pretend is nothing to do with them. Hello FX Wars! Join the queue behind the trade war (as China cancels some shipments of US goods already en route) and the Cold War (as the US senate de facto opens the door to banning all Chinese telcos from the US market). That said, there is also an emerging argument –one we have put forward since 2017– that in a Cold War it is a strong USD and not a weak one that is the greater US weapon. There is still unlikely to be a line of communication between China hawks in DC and the Eccles Building where the FOMC sit, but it’s still worth remembering what the geopolitical backdrop is.
- Can the Fed find a way to do even more than it already is without encouraging what many see –even by the standards of the mind-blowingly stupid examples around the word in recent decades– as an epic, lunatic, *dangerous* stock-market bubble? Indeed, can they do so without stocks tumbling down on top of the retail money arriving late to the party? “Excessive exuberance”: anyone recall how many years and bubbly Fed Chairs ago that was?
All eyes will be on the dotplots today to see if any Fed heads are forecasting negative rates (and if so prepare for chaos to break out).
And how Powell will explain The Fed’s tapered bond-buying as repo-liquidity needs are resurging…
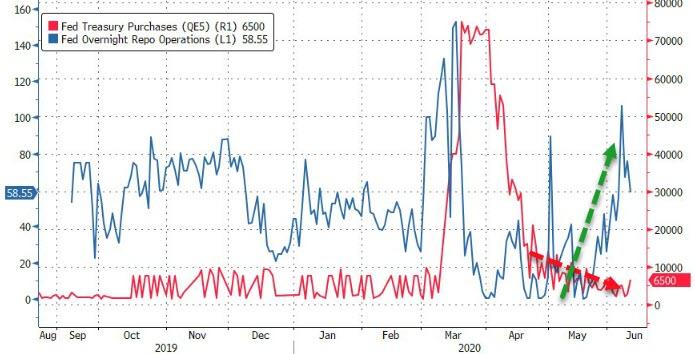
Good luck Jay!

And so, the question is, did they deliver what the market was demanding?
The Fed has no plans to raise rates through 2022…
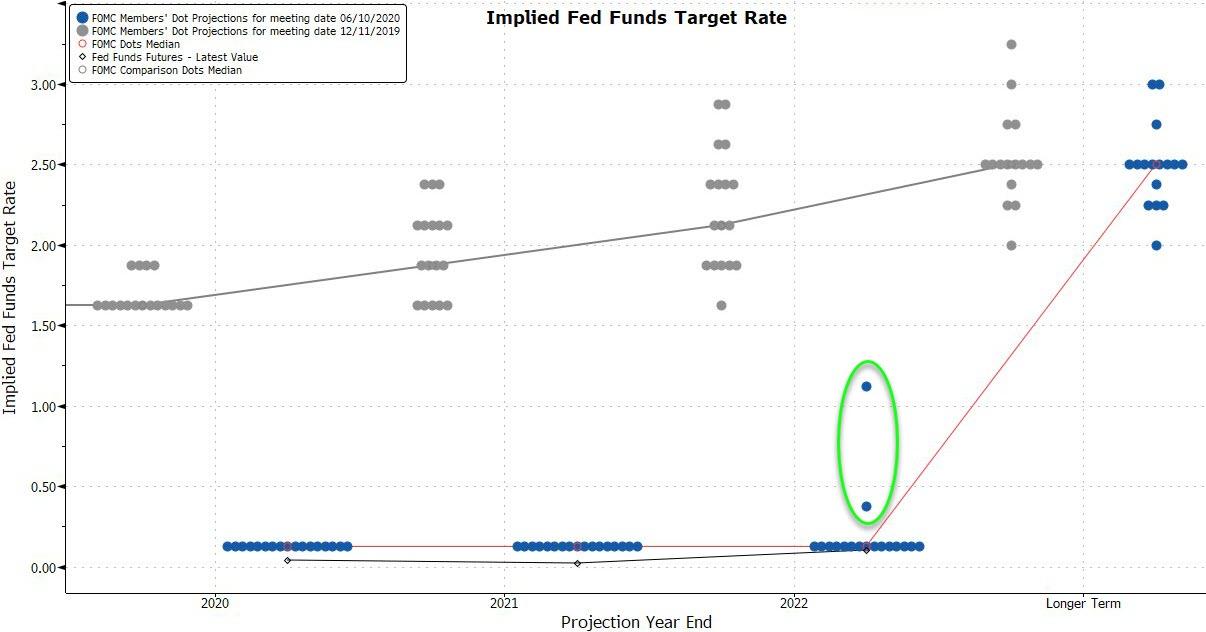
How wrong has The Fed been before? Remember in 2018 they expected 2020 rates to be up at least 3.5%… not ZERO…
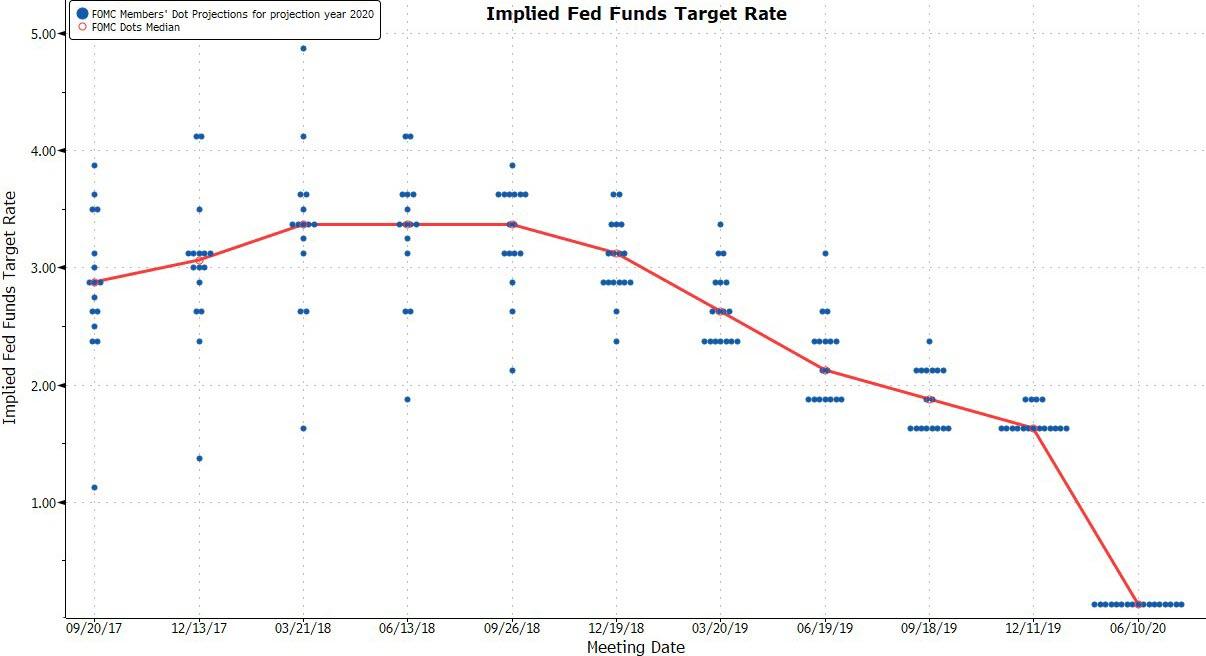
The Fed does not mention Yield Curve Control in the statement (wait for the presser).
The Fed commits to buy Treasuries, MBS, “at least at the current pace.”
The Fed has formalized an $80 billion per month bond buying QE:
Consistent with this directive, the Desk plans to continue to increase SOMA holdings of Treasury securities at the current pace, which is the equivalent of approximately $80 billion per month. Treasury purchases will be conducted on a monthly basis, starting with the period from mid-June to mid-July, and will continue to be conducted across a range of maturities and security types. The Desk will continue to roll over at auction all principal payments from SOMA holdings of maturing Treasury securities.
The Fed forecasts 2020 GDP to plunge 6.5% but rebound to 5.0% in 2021 and 3.5% in 2022

But sees a ‘v’-shaped recovery in employment: *Fed Officials See 9.3% Unemployment In 2020, 6.5% In 2021, 5.5% In 2022.
As Bloomberg Economics Associate Eliza Winger notes:
“Assuming the economy contracts 37% in the second quarter, in-line with Bloomberg Economics’ projection, U.S. GDP will need to recover by an average pace of 12.6% in the second half of the year to achieve the Fed’s forecast of -6.5% for the year as a whole.”
* * *
Full redline below:
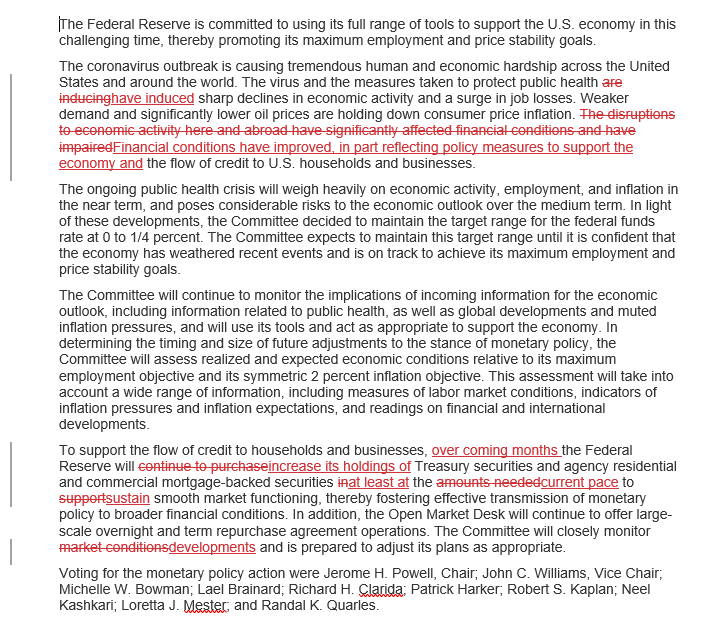
END
FOMC STATEMENT
Fed Will Purchase “Approximately” $80BN In Treasurys Per Month, $40BN In MBS
With traders curious if the Fed will leave open-ended QE or will formalize asset purchases to a specific monthly amount, the Fed left it somewhat open-ended, with the Fed statement saying “the Federal Reserve will increase its holdings of Treasury securities and agency residential and commercial mortgage-backed securities at least at the current pace to sustain smooth market functioning”, however in a separate Operating Policy note from the NY Fed, we read that:
- the Desk plans to continue to increase SOMA holdings of Treasury securities at the current pace, which is the equivalent of approximately $80 billion per month
and:
- the Desk plans to continue to increase SOMA holdings of agency MBS at the current pace, which is the equivalent of approximately $40 billion per month
In other words, while not explicit, one can expect the current run-rate of about $4BN per day/$20BN per week in TSY purchases to continue. It also means that, all else equal, the Fed will monetize just under $1 trillion in Treasury per year at the current pace, which however may be less than the market was expecting in light of the massive debt issuance on deck.
Commenting on this, Grant Thornton economist Diane Swonk said that “Acting on mortgage-backed securities and Treasuries underscores their belief that more support is needed….The Fed does not see a victory in the employment bounce-back. The risk of deflation is still high and the economy needs more support to heal more fully.”
The NY Fed also said that “Treasury purchases will be conducted on a monthly basis, starting with the period from mid-June to mid-July, and will continue to be conducted across a range of maturities and security types. The Desk will continue to roll over at auction all principal payments from SOMA holdings of maturing Treasury securities.”
Separately, for MBS, the NY Fed said that “Agency MBS purchases will be conducted on a monthly basis, starting with the period from mid-June to mid-July. Total purchases during this monthly period are expected to be approximately $96 billion, which includes approximately $56 billion in purchases to reinvest principal payments from existing SOMA holdings of agency debt and agency MBS anticipated to be received in the month of June. Agency MBS purchases will continue to generally be concentrated in recently produced coupons in 30-year and 15-year fixed rate agency MBS in the To-Be-Announced (TBA) market.”
The statement also adds that going forward, POMO schedules won’t be handed out every Friday, but will switch over to a once a month event:
The Desk will announce the planned monthly amount of Treasury and agency MBS purchases on or around the ninth business day of each month and will release tentative schedules of purchase operations twice a month, on or around the ninth and the nineteenth business days. The first monthly purchase period will begin on June 12, 2020 and continue through July 13, 2020. Updated information on purchase amounts and schedules can be found on the Treasury Securities Operational Details and the Agency MBS Operation Schedule pages.
In addition, the Desk will continue to buy agency CMBS at the current pace by conducting weekly operations of approximately $250 to $500 million with purchases including the reinvestment of principal payments from SOMA holdings of agency CMBS.”
Finally, in picking a line from the ECB, the NY Fed said that consistent with the FOMC directive, the Desk is prepared to increase the size and adjust the composition of its purchase operations as needed to sustain the smooth functioning of the Treasury, agency MBS, and agency CMBS markets.”
In short, this is about as close to a full commitment to debt monetization as the Fed is ready to go.
end
ii)Market data/USA
CPI core consumer growth the lowest in 9 years. However their calculations on CPI are hedonistic..they are much higher !
(zerohedge)
Core Consumer Price Growth Hits 9 Year Low Despite Soaring Food & Booze Costs
After plunging in April, economists expected the deflationary impulse in consumer prices to stabilize in May and it did with headline and core CPI both falling just 0.1% MoM (exp was 0.0%).
This sent headline CPI growth lower (to just +0.1% YoY) and core CPI grew at +1.2% YoY – the slowest since 2011.

Source: Bloomberg
Lots of deflationary prints in the Energy and Autos sector but food surged…
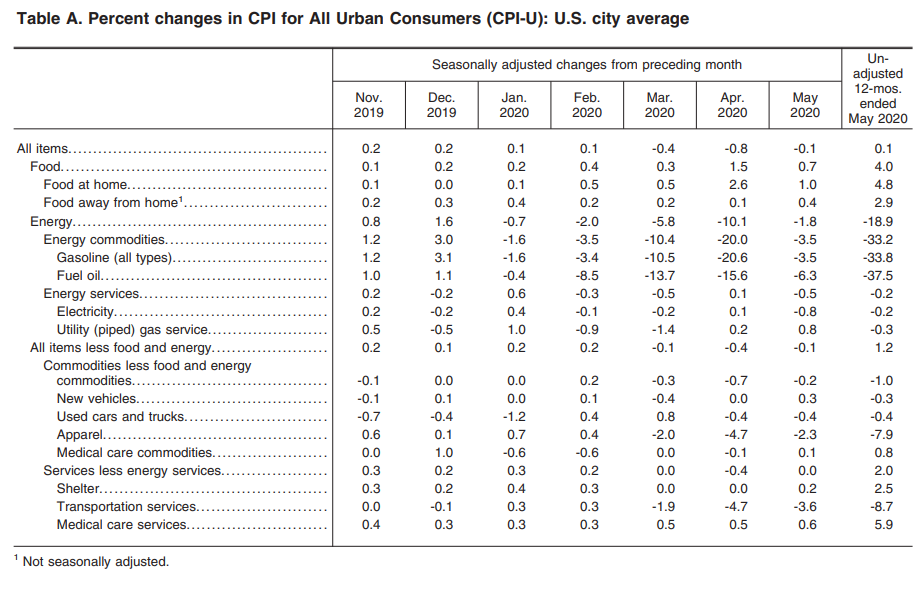
Goods are suffering the worst deflation since 2004 and services costs are growing at the slowest pace since 2011…
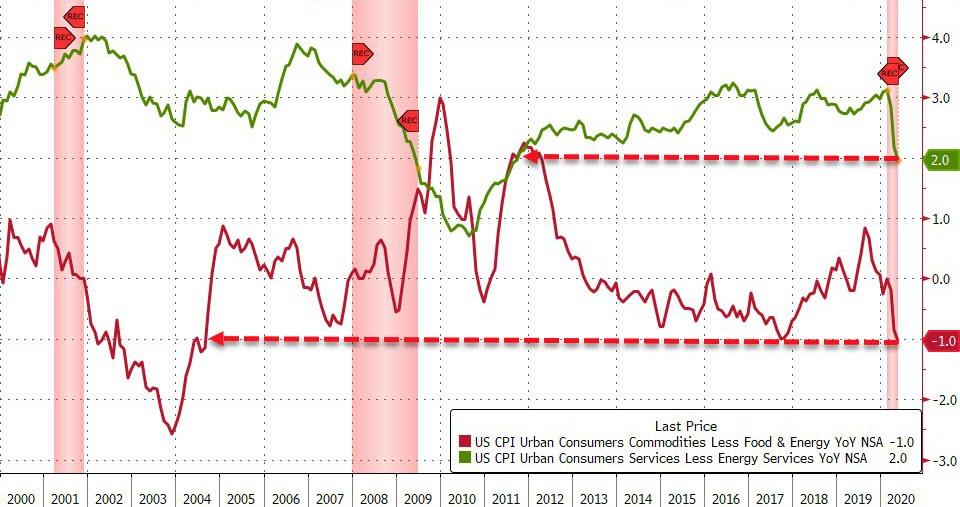
The energy index fell 18.9 percent over the past 12 months as all of the major energy component indexes declined. The gasoline index decreased 33.8 percent, while the fuel oil index fell 37.5 percent. The index for electricity fell 0.2 percent over the last year, while the index for natural gas declined 0.3 percent.
The index for all items less food and energy decreased 0.1 percent in May. The index for motor vehicle insurance continued to decline, falling 8.9 percent in May after a 7.2-percent decrease in April. The apparel index also continued to decline, falling 2.3 percent in May after decreasing 4.7 percent the prior month.
The index for airline fares fell 4.9 percent in May, and the index for used cars and trucks declined 0.4 percent, the same decrease as in April.
The food at home index increased 4.8 percent over the last 12 months, with all six major grocery store food group indexes rising over that span.

The index for meats, poultry, fish, and eggs rose 10.0 percent over the last year, its largest 12-month increase since the period ending May 2004.
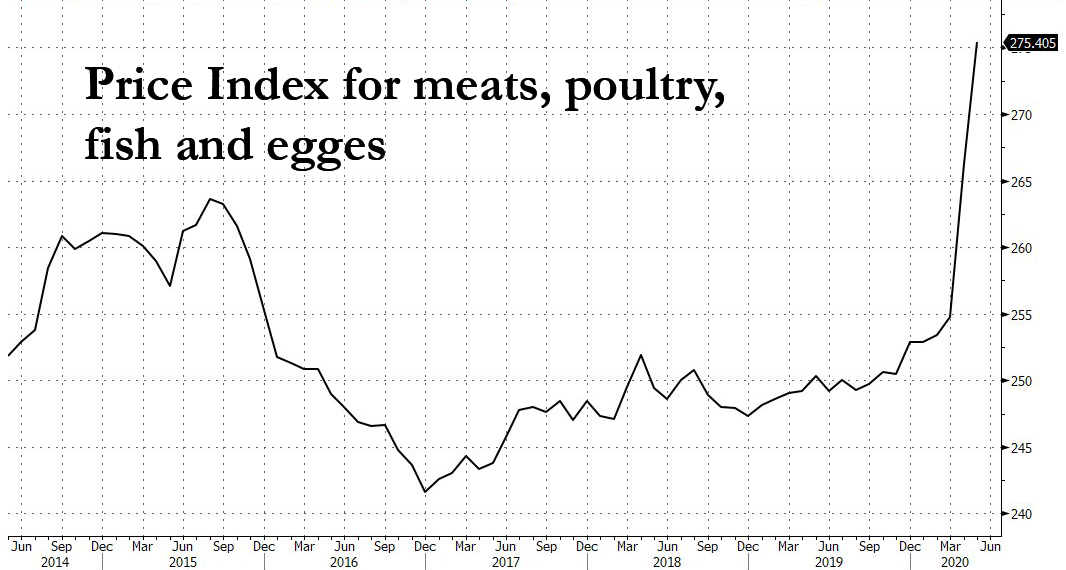
This reflects a sharp increase in the beef index, which rose 18.2 percent over the span. The index for dairy and related products increased 5.7 percent, and the index for nonalcoholic beverages rose 4.1 percent over the year. The remaining groups posted smaller increases. The index for food away from home rose 2.9 percent over the last year. The index for limited service meals increased 3.6 percent and the index for full service meals rose 2.4 percent over the last 12 months.
Additionally, the index for alcoholic beverages increased 0.8 percent in May, its largest increase since January 2012.
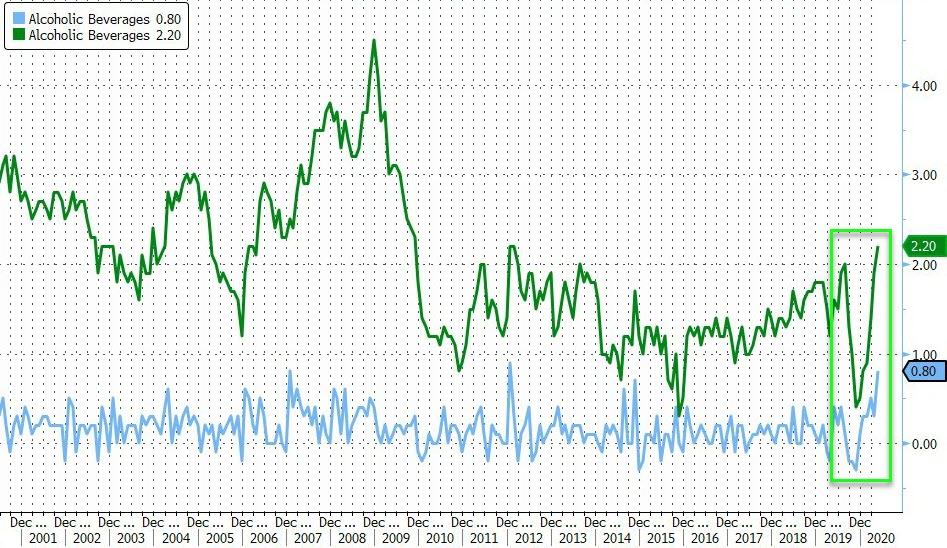
The shelter index rose 0.2 percent in May. The indexes for rent and for owners’ equivalent rent both increased 0.3 percent in May after rising 0.2 percent in April. The index for lodging away from home continued to decline, falling 1.5 percent in May.
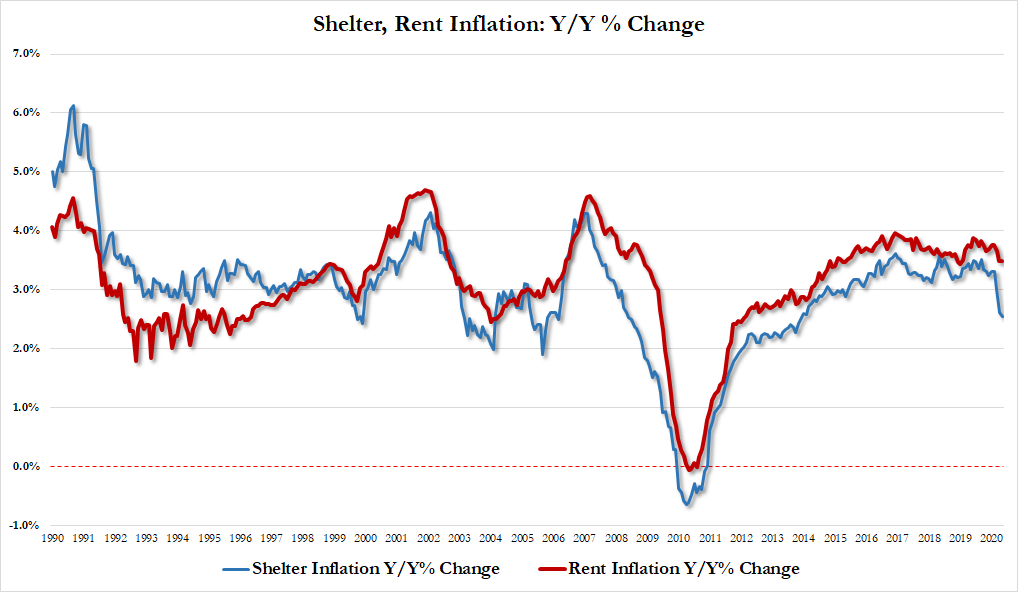
Of course, this somewhat disinflationary print provides further greenlighting for The Fed to stay the course (or ease even more).
iii) Important USA Economic Stories
Michael Every discusses what options the Fed has in dealing with its economy
a must read..
Michael Every…
Rabobank: Will The Fed Today Encourage The “Epic, Lunatic, Dangerous Stock-Market Bubble” And Even More Protests Against Inequality
Submitted by Michael Every of Rabobank
Fiddle No-Reserve
Today Mr Jerome Powell esquire, Chair of the FOMC at the US Federal Reserve, is going to be in the spotlight once again. The Fed concludes their two-day meeting and will give an updated set of projections, including the ‘dot plot’ of their own collation of expectations for rates. What a tricky task this will prove. As our Fed watcher Philip Marey puts it, the Fed conveniently skipped the March forecast round and left it to others to prepare the public for the awful economic data that we have since seen. They can’t get away with that kind of trick again, surely? Let’s see if they agree with the horrendous expectations that the IMF, World Bank, and even real-time Fed data all hold.
In terms of its statement, the Fed is likely to focus on forward guidance on rates and asset purchases: it is a given that rates are on hold until normal economic service has been resumed, and then some, and also that the FOMC will continue to expand its special lending facilities even further despite the fact that the worst of the economic downturn is already behind us. However, the markets are only really going to be focused on four things:
- One, will the Fed open the door even a crack to negative rates? The Fed does not seem to be in a hurry to tweak the IOER rate, even though that would help reduce the occurrence of negative implied Fed Funds rates and thus quell some of the speculation about negative US rates in our view. However, despite market chatter we believe that European- and Japanese-style negative rates are a no-go for the Fed.
- Two, will we see Yield Curve Control (YCC)? If so, which parts of the US Treasury curve will, Japanese- and Aussie-style, cease to function as a real market? Would it just be the short end of the curve? That leaves the door open for curve steepening of the kind seen in recent sessions, which carries the risk of real pain for borrowers. Moreover, with the massive expansion of US Federal debt, YCC out to 2 years would mean issuance at the short end and constantly having to roll it over. In other words, raising the Fed Funds rate again would not be possible until public debt was under more control – which realistically means never. Or might YCC be longer, say out to 7 years? This would give greater room to spread the looming trillions that will flow, and perhaps enough time for some optimists to presume an economic turn-around within that period is possible. Yet could we even see that financial totem of all totems, the US 10-year, under YCC? If so the global debt benchmark is not looked at, but sat on like a bench. Japan is already doing it.
- Three, can the Fed manage to do either of the above without the US Dollar falling out of bed? The structural bull argument for USD is still there, but current momentum is such that hinting at negative rates and/or pegging US yields could easily push it down. The Fed aren’t responsible for the USD, but they certainly know that is true. The question is whether they are either desperate enough about the outlook not to care, or are happy about a currency weakness they can pretend is nothing to do with them. Hello FX Wars! Join the queue behind the trade war (as China cancels some shipments of US goods already en route) and the Cold War (as the US senate de facto opens the door to banning all Chinese telcos from the US market). That said, there is also an emerging argument –one we have put forward since 2017– that in a Cold War it is a strong USD and not a weak one that is the greater US weapon. There is still unlikely to be a line of communication between China hawks in DC and the Eccles Building where the FOMC sit, but it’s still worth remembering what the geopolitical backdrop is.
- Four, can the Fed find a way to do even more than it already is without encouraging what many see –even by the standards of the mind-blowingly stupid examples around the word in recent decades– as an epic, lunatic, *dangerous* stock-market bubble? Indeed, can they do so without stocks tumbling down on top of the retail money arriving late to the party? “Excessive exuberance”: anyone recall how many years and bubbly Fed Chairs ago that was?
In short, we are to see fiddling with no reserve. Fed fiddling with growth projection they weren’t brave enough to touch at a time when everyone else had to whether they liked it or not. Fiddling with rate projections. Fiddling with rates, perhaps. Fiddling with the yield curve. Tacitly fiddling with the USD, perhaps. Certainly fiddling with the equity market by liquidity proxy.
Yet we should also add a fifth point of concern. As the Fed go “all in” on fiddling, can they ignore the other political backdrop in DC: street protests linked to inequality? Are the FOMC going to take account of the fact that they are deliberately worsening inequality with their actions? It may not be what they WANT to do; they may argue there is nothing else they CAN do given the tools they have; yet it has been clear for years that this is clearly what they are doing.
Don’t believe me that the Fed are worried about this? Note the recent Bloomberg opinion piece ‘Fed Needs Better Answers on Runaway Markets and Inequality’ that points out the New York Fed recently detailed a new event series called “The Fed and Main Street,” which aims “to discuss the challenges faced by vulnerable communities and highlight opportunities to work together toward an equitable economic recovery.” and underlines “Such a statement sounds a little tone-deaf after the events of the past few months.”…unless the Fed is going to repeat what Janet Yellen said a few years back: if the poor just had more assets then they wouldn’t be poor! Besides the incredible tautology there one hopes the Fed is asking itself “Is manipulating (mal-distributed) asset prices higher the best basis for achieving social justice?” The Bloomberg piece ponders if the Fed should include financial conditions in its rate modelling to raise rates if stocks race ahead too fast, in the same way they are prepared to do when wage growth threatens to pick up. Quite an Austrian argument!
Still don’t believe me that the Fed are culpable? Sheila Bair, former head of the FDIC, has publicly stated the Fed contributes to inequality and that monetary policy, which largely helps the wealthy, fails to adequately trickle down to other demographics, adding “I think it would be good for the Fed to acknowledge that and try to find better ways to use their tools in a way that doesn’t exacerbate the problem.” The problem is one either goes the Austrian route and raises rates, or one goes the MMT route and offers to buy Treasury bonds for specific social targets that reduce inequality. Do you think this Fed is ready for that, even as it fiddles with everything else? For now they are just thinking “zero” (rates) and “hero” for Wall Street: and so the risk is clearly they are also “Nero”.
Indeed, smell the burning with a woeful set of Asian data so far today. Japanese core machine orders plunged 12% in April, worse than the -7% expected, while Chinese CPI missed expectations at 2.4% y/y (consensus was 2.7%) and PPI came in at -3.7% y/y, down from -3.1% and vs. the expectation of -3.3%. Clearly Japan is deep in recession and China is deep in industrial deflation: which means that the PBOC, like the BOJ and the FOMC, is going to be fiddling a whole lot more going forwards too. Which would at least relieve some of the potential downwards pressure on USD while increasing it on CNY.
CORONAVIRUS UPDATE/USA WEDNESDAY
More Than 10 States See COVID-19 Hospitalizations Hit Record Highs Amid Rebound In New Cases: Live Updates
Summary:
- 9 states see COVID hospitalizations hit record highs
- National guardsmen deployed in Washington DC test positive
- AP weighs in on WHO’s latest flip-flop
- Gottlieb warns Texas on the brink of losing control of the outbreak
- Greater New York area continues to bend the curve
* * *
Update (0750ET): In this morning’s “AP Morning Wire” letter, the wire service shared a piece addressing the WHO’s latest flip flop, which cast doubt on its previous guidance on mask wearing (also the product of a flip-flop on Friday that came long after most countries had already made masks mandatory), when a top researcher claimed that examples of asymptomatic spread are much less common than researchers had initially expected.
For those who are just learning about this now, the WHO’s technical lead on COVID-19 was asked about transmission rates during a press conference earlier this week when she claimed that “it appears to be rare that asymptomatic individuals can actually transmit onward.” Following an international uproar over the claim, which, if true, would seemingly have major repercussions for coronavirus-related policy.
On Tuesday, Dr. Van Kerkhove said she was referring to a few studies, not the complete picture, while other scientists vehemently disagreed with Dr. Van Kerkhove’s characterization.
“I was surprised by the conviction of that statement because there have clearly been people who have transmitted the infection before they go on to develop symptoms,” said Keith Neal, an infectious diseases expert at the University of Nottingham who has advised the British government.
As the AP notes, exactly how the virus is transmitted from person to person is still not well understood, and the WHO has claimed for months that the vast majority of infections are from people with symptoms like a fever or cough. Coughing and sneezing aerosolizes the virus, helping it spread.
At a hastily arranged pres briefing on Tuesday to try to clear up confusion,the WHO’s Dr. Michael Ryan claimed that “both symptomatic and asymptomatic individuals are part of the transmission cycle”. In a section of its report subtitled “Why Can’t The Scientists Agree?”, the AP explained that there’s a genuine debate in the scientific community.
Although numerous studies have suggested people can spread the virus before they show symptoms, WHO has largely dismissed those as anecdotal or pointed out that they were based on modelling.
Babak Javid, an infectious diseases doctor at Cambridge University Hospital, says many scientists are persuaded by the studies published so far and think WHO should publish the data it is citing to explain why it believes transmission of the disease in people without symptoms is “rare.”
“If you’re going to make a really important statement like that, it would be good to back it up,” Javid said. “I think WHO is an important organization, but they’ve made a lot of statements that have been misleading.”
WHO’s Ryan said the agency was committed to being honest and transparent and welcomed the scientific debate it has prompted.
Which scientist do you believe?
* * *
Even as US stocks tumbled on Tuesday for the first time in a week following reports that a dozen states, including Puerto Rico, had reported record numbers of new COVID-19 infections (nearly half of US states have reported a troubling resurgence in the weeks since MDW), most market analysts attributed the move to a healthy “pause” in the blistering 10-week rally that returned the Nasdaq to its ATH. But that still-sunny outlook has apparently changed overnight, following reports, which we noted last night, that Texas has seen COVID-19-related hospitalizations bounce back to their highest levels since the outbreak began.
While the Greater New York area has seen cases, deaths and hospitalizations continue to fall, the rebound in other parts of the US has kept the number of new cases reported each day from falling more sharply.
On Wednesday morning, the Washington Post reported that hospitalizations in at least nine states are on the rise. Some readers might remember that at the outset of the lockdowns back in March, Dr. Fauci and others insisted that the goal of the American response to the outbreak was to “flatten” the curve enough to prevent hospitals from being totally overwhelmed. Here’s more from WaPo:
In Texas, North and South Carolina, California, Oregon, Arkansas, Mississippi, Utah and Arizona, there are an increasing number of patients under supervised care since the holiday weekend because of coronavirus infections. The spikes generally began in the past couple weeks and in most states are trending higher.
Data from states that are now reporting some of their highest seven-day averages of new cases is disproving the notion that the country is seeing such a spike in cases solely because of the continued increase in testing, according to data tracked by The Washington Post.
The sheer number of states that have reported rebounds suggests that the increase in new cases can’t be attributed (at least, not entirely) to an expansion of testing. Anybody who has been paying attention to the numbers out of Texas probably notice that the state has reported several record daily totals of new cases. Texas has reported 75,616 cases since the pandemic began, but during 10 of the past 15 days, the state’s 7-day average (a metric that’s preferred to the un-smoothed daily data) reached new highs.
One reason that the jump in hospitalizations may have been overlooked by the market up until now is because those numbers are difficult to track, since not all states release the numbers, and reporting criteria vary from state to state.
That this is happening in Texas is important, since the state embraced an aggressive reopening timeline, just like Georgia did, and for a time, it looked like these decisions might pan out. Now, journalists and ‘experts’ are apparently revisiting that view.
North Carolina has reported the second-largest spike in hospitalizations (behind Texas) since Memorial Day, though NC’s trend began before the holiday weekend. On May 26, the state reported 621 hospitalizations, but two weeks later, that number had climbed to 774.
In South Carolina, hospitalizations have increased sharply since the start of the week. In the span of just a day, there have been 30 new hospitalizations, a 6% jump in total capacity, according to the state’s health department. In Utah, new cases are on the rise, and so are hospitalizations. Like other states, Utah has seen newly reported cases climb since MDW, with the average number of new cases increasing in 12 of the past 15 days. Over that two-week span, Utah has reported a 42% jump in hospitalizations, with 230 patients hospitalized with the condition as of Tuesday afternoon.
During an interview on CNBC’s “Squawk Box”, former FDA Commissioner Scott Gottlieb, who has been warning about the uptick in new cases and hospitalizations for at least the past week, warned that Texas is going to need to devise a new intervention plan if it wants to avoid another round of lockdowns.
“Texas is going to have to figure out how to target interventions…remember they’re in phase 3 of reopening and they’re reopening everything…but the state has already been open a while…they’re going to have to figure out where the spread is occurring and take more mitigation steps,” Dr. Gottlieb said.
Whatever it decides, Texas – particularly the area around Houston where the outbreak is most severe – needs to get its arms around this thing soon, or it could lose control.
Squawk Box
✔@SquawkCNBC
“When you look at hotspot regions like Arizona and Texas, they have to be concerned, particularly areas around Houston right now. they could lose control of this very quickly,” says @ScottGottliebMD on balancing re-opening with public health.

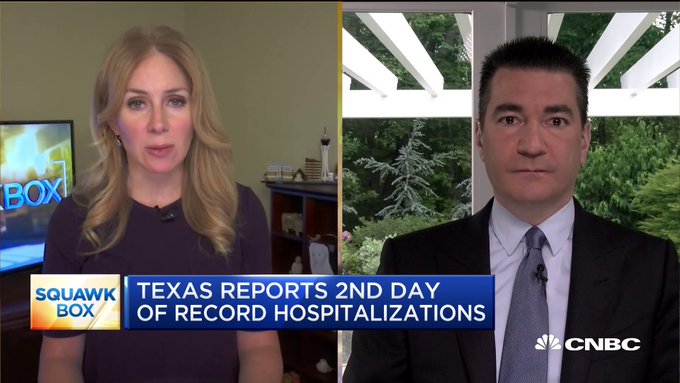
Gottlieb also warned that the “seasonal effect” which may have helped lower the number of new cases in some areas has likely already run its course.
“Certainly in the tri-state area we’re in much better shape than the rest of the country…but in more rural areas they need to be concerned,” he added, citing Arizona as another example.
“We might not get more seasonal effect as we get into July and August so this might be it.”
Dr. Fauci meanwhile sat for another interview with CNN Wednesday morning where he largely repeated comments from his interview with the NYT published last night, including his colorful comment about COVID-19 being “my nightmare” and his belief that a vaccine could be secured by the beginning of next year.
Before we go, readers would be well-served to remember one more thing: although some national guard members – first in Minnesota, and then in Washington DC – have tested positive for the virus, most experts say that any spike in new cases associated with the protests likely won’t manifest until later this week.
END
USA
It looks like 25,000 more store closures are expected
(zerohedge)
25,000 More Store Closures Expected As Pandemic-Fueled “Retail Apocalypse” Rolls On
The one discussion bulls chose to ignore while equity markets soar to new highs is the permanent economic damage story due to months of coronavirus lockdowns. A new report shows tens of thousands of brick and mortar shops could close their doors this year, which would indicate the “retail apocalypse” is accelerating.
The report, commissioned by Coresight Research, forecasts that in 2020, upwards of 25,000 retailers could shutter operations after months of lockdowns decimated mall traffic — collapsing store sales and resulting in delinquent rent payments.

Even before the pandemic, we noted the “retail apocalypse was particularly bad in 2019,” with about 10,000 stores closed for good. Most of the closures were mall-based retailers as consumerism and spending shifted online. Lockdowns, in the last few months, accelerated the shift to buying items online while strict social distancing rules enforced by the government led to non-essential shop closures.
Coresight CEO Deborah Weinswig wrote in the report, a closure wave of “anchor tenants” in shopping malls will lead to surrounding shops closing up as well. She said if that happens, her firm would then expect 20,000 to 25,000 shops to close by year-end.
“Department and large apparel-chain store closures in malls will, therefore, create a ripple effect that spells bad news for malls,” Weinswig said.
In early June, Simon Property Group, one of the largest mall operators in the US, sued GAP, it’s the largest tenant, claiming the retailer failed to pay more than $65.9 million in rent and other charges during shutdowns.
The lawsuit “highlights the mounting tension between retail landlords and their tenants, many of which stopped paying rent after the crisis forced them to shut stores,” CNBC noted.
So far, US retailers have planned about 4,000 permanent store closures, with hundreds from Pier 1 Imports, Neiman Marcus, Tuesday Morning, JC Penney, Stage Stores, and L. Brands. Before the virus outbreak, Coresight was already forecasting 15,000 stores would close this year.
Store closures this year have already triggered an unprecedented implosion in US commercial real estate. The latest remittance data by Trepp shows a massive surge in newly delinquent CMBS loans.
“CMBS Delinquency Rate registered at 2.29% in April, in May the Delinquency Rate logged its largest increase in the history of this metric since 2009. The May reading was 7.15%, a jump of 481 basis points over the April number. Almost 5% of that number is represented by loans in the 30-day delinquent bucket,” we said last week.
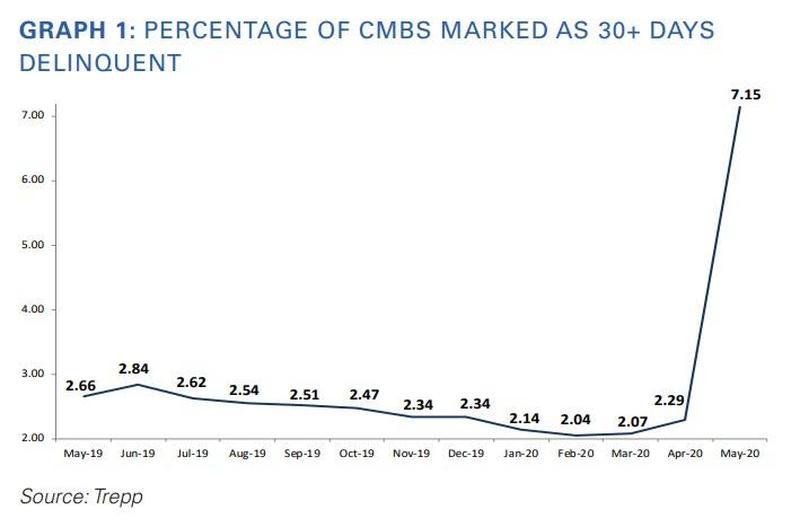
As stores close up shop, jobs are also lost, which we recently noted, 18 million workers could be at risk of permanent job loss.
And if you’re curious to learn just how big the impending commercial real estate bust will be, your questions will be answered in “Sizing The Commercial Real Estate Bust.”
END
We have been following this story for many years; It now looks like USA pensions will run out of money in 8 years
(zerohedge)
Alarming Study Finds US Public Pensions To Run Out Of Money By 2028
At a moment a number of US public pension plans have barely recovered – if at all from the 2008 financial crisis – now to be hit with continuing economic fallout from the corona-crisis and domino effect of historic unemployment, an alarming report in FT warns that seven major public pension plans are due to deplete their assets by 2028.
“The correction in the US stock market has increased the long-term structural problems across the entire US public pension system, particularly for the weakest funds,” FT observes.

A new, detailed study attempting to forecast the near term struggles of public pensions at the Center for Retirement Research at Boston College found: “Public plans with extremely low funded ratios in 2020 may face the risk of running out of assets in the foreseeable future if markets are slow to recover,” according to researcher Jean-Pierre Aubry.
The depletion would impact many hundreds of thousands of Americans and their retirement, assuming a potential slow recovery for the US stock market.
FT summarizes the Center for Retirement Research’s analysis according to the following study highlights:
- Over 320,000 members of the New Jersey Teachers and Chicago Municipal public pension plans: “A slow recovery for the US stock market could result in Chicago Municipal’s funded position falling from 21 per cent this year to just 3.6 per cent by 2025. This would leave assets to cover just three months of the fund’s retirement payments…”
- New Jersey Teachers: “…funded position projected to decline from 39.2 per cent to 23.2 per cent over the next five years. By that time, New Jersey Teachers would have assets to cover 19 months of retirement payments.”
- Police and fire departments: “public pension plans of Kentucky and Providence along with Dallas Police and Fire, Charleston Fire and Chicago Police could all end up with less than three years of retirement benefit payments saved as assets.”
- “Chicago has particularly high pension risks. The city has built up very large unfunded liabilities through years of very weak pension contributions,” a senior credit officer at Moody’s.
Of course, the structural weaknesses existed long before the coronavirus crisis, only to be exacerbated in the covid-lockdown domino effect of debt problems most expect to cascade in the next years.
The Center Square@thecentersquareStates nationwide are facing a pension crisis that existed well before the coronavirus economic shutdown ever hit, according to independent reviews of state budgets. https://www.thecentersquare.com/national/states-facing-public-pension-crisis-nationwide/article_aa70b626-a5bc-11ea-9805-130671cc54e8.html#utm_campaign=blox&utm_source=twitter&utm_medium=social …
States facing public pension crisis nationwide
(The Center Square) – States nationwide are facing a pension crisis that existed well before the coronavirus economic shutdown ever hit, according to independent reviews of state budgets.
thecentersquare.com


All of this also suggests increasing heavy reliance on Social Security for retirement – nothing new – but further alarming given all three legs of the “stool” – including private pensions and individual savings, are now at huge risk.
Tucker Carlson: “The Rise Of Left Wing Mobs In America”
During last night’s monologue, Fox News primetime host Tucker Carlson stood up to the left wing mobs that have been empowered by weak Democratic leaders who have “reflexively bowed to their demands”, allowing the establishment ofan “autonomous zone” in downtown Seattle, that will exist for about as long as the city’s techno-corporate overlords deem it in their political interest to allow it to exist.
Left wing mobs have seemingly come for everyone who doesn’t 100% agree with their radical views on endemic white supremacy in American society. And now they’ve renewed their attacks on Carlson and his producers (who have already survived one coordinated advertiser boycott), along with many others who don’t have nearly as many resources as the prime time Fox News host.
Benny
✔@bennyjohnson
TUCKER: The Rise of Left-Wing Mobs in America


Radical leftists have never had so much influence in the culture, largely thanks to weak political leaders and celebrities who share and support their propaganda as if it were the most fundamental truth.
“For now it’s enough to say that the country’s defenses have been badly weakened by decades of propaganda...we are too sinful to resist we deserve whatever we get…shut up and take it America,” Carlson said.
He then aired a clip from “Sesame Street” explaining the protests and how America has a “huge problem” with racism.
Tucker brought up examples like the
“Who are we? Well, at this point, we’re becoming North Korea. We now believe in blood guilt; we punish people for the sins of their relatives…we demand that the innocent plead guilty to things we know they didn’t do…then we order them to read their forced confessions in public…terrifying ideas now have free reign because nobody pushes back…some professional activist says something insane like “defund the police” – because that’s what professional activists do…and the rhetoric gets more disgusting.”
Two UCLA professors have been punished by the school, and threatened by the students, for seemingly minor transgressions like reading Martin Luther King out loud or requiring students to take an exam.
“Today the left has singled out one ethnic group but tomorrow it will be another…bigots never stop at just one,” Carlson said.
America doesn’t always live up to its ideals of freedom, equality and equal treatment under the law, but that’s why they’re ideals. People aren’t perfect, and neither is the American justice system.
Let’s not throw the baby out with the bathwater
end
let us see if they are right. I think it will be a lot less..so let’s see
(zerohedge)
Additional 1,100 Daily COVID-19 Deaths Predicted Depending On Size Of Floyd Protests
After liberal leaders and their trusted science community warned of mass COVID-19 deaths without drastic and lasting lockdowns, millions of activists around the world paid exactly zero attention to said warnings – gathering in tightly-packed crowds to protest the killing of George Floyd.

Now, a Seattle researcher behind early genomic analysis of the coronavirus says that daily deaths in the United States could more than double – adding between 200 and 900 deaths per day for each day of protests involving at least 600,000 people, according to Hot Air.
Trevor Bedford is the Seattle researcher who used genomic analysis early on in the pandemic to detect hidden community spread in Seattle, the first big clue that America had a more significant COVID-19 problem than it realized. He’s watching the mass demonstrations against police brutality this week with growing concern, knowing that from an epidemiological standpoint the “mass” part is all that matters. The virus won’t make exceptions in the name of progress. –Hot Air
Trevor Bedford
✔@trvrb
If we have 3000 infections sparked by protests each day, we can expect that these infections will eventually lead to ~54k downstream infections. 6/12


Trevor Bedford
✔@trvrb
These infections will percolate through the community and be realized over the coming weeks. Assuming an IFR of between 0.5% and 1%, we would expect these ~54k infections to result in 270-540 eventual deaths per day of protests. 7/12
Trevor Bedford
✔@trvrb
If we have 6000 infections sparked by protests each day, we would expect ~108k eventual infections and 540-1080 deaths per day of protests. 8/12
Trevor Bedford
✔@trvrb
My (updated) best guess is that each day of protests involving 600k people will result in between 200 and 1100 eventual deaths. 9/12
Meanwhile, as Hot Air‘s Allahpundit notes, from the Floyd protests, to Las Vegas, to the rest of the country reopening, there isn’t a lot of social distancing or mask-wearing going on.
Arash Markazi
✔@ArashMarkazi
Las Vegas is officially back.


The Vegas clip shocked me more than the protest clips did because of how normally everyone is behaving. Mass demonstrations are many things but “normal” isn’t one; the Vegas footage looks like it came from an alternate dimension in which there’s no coronavirus, though, with a few stray masks being worn by gamblers the only hint of a lurking threat. Most Americans aren’t behaving that recklessly — majorities still say they’d be “somewhat uncomfortable” eating at a restaurant or attending a public gathering — but the backsliding on social distancing has clearly begun. –Hot Air
Read the rest of the report here.
end
Mall massacre continues as Simon Group cancels its teal with Taubman
(zerohedge)
Mall Massacre Claims First Mega-Merger Casualty: Simon Scraps Takeover Of Taubman
On February 10, just as the world we becoming aware of the coronavirus pandemic which would become the final nail in the coffin of brick and mortar retail outlets, sending countless of companies to a long overdue date with bankruptcy judges, mall giant Simon Property Group stunned the market when it went against the grain of imploding malls and said it would acquire Taubman Centers for $52.50 a share, a 51% premium to where the shares had been trading.
The deal, which was expected to close within about six months, came as mall operators facing sharply lower foot traffic (and a total collapse thereof just one month later), were under increasing pressure to lure shoppers, who more and more favor buying products online or at strip malls where it is easy to dart in and out with purchases.
Well, moments ago we learned that that particular deal is not going to close, because Simon, which is known for owning and operating top-tier shopping malls, announced that it has exercised its contractual rights to terminate its February 9, 2020 merger agreement with Taubman Centers. SPG filed an action today in the Circuit Court for the 6th Judicial Circuit of Oakland County, Michigan against Taubman Centers and The Taubman Realty Group Limited Partnership requesting a declaration that Taubman has suffered a Material Adverse Event under the Merger Agreement and has breached the covenants in the Merger Agreement governing the operation of Taubman’s business.
This is what Simon said in the press release as grounds for invoking the MAE:
As detailed in the complaint filed this morning, Simon’s termination of the Merger Agreement is based on two separate and independent grounds.
First, the COVID-19 pandemic has had a uniquely material and disproportionate effect on Taubman compared with other participants in the retail real estate industry.
Second, in the wake of the pandemic, Taubman has breached its obligations, which are conditions to closing, relating to the operation of its business. In particular, Taubman has failed to take steps to mitigate the impact of the pandemic as others in the industry have, including by not making essential cuts in operating expenses and capital expenditures.
The Merger Agreement specifically gave Simon the right to terminate the transaction in the event that a pandemic disproportionately hurt Taubman. Taubman’s significant proportion of enclosed retail properties located in densely populated major metropolitan areas, dependence on both domestic and international tourism at many of its properties, and its focus on high-end shopping have combined to impact Taubman’s business disproportionately due to the COVID-19 pandemic when compared to the rest of the retail real estate industry. In addition, Taubman has breached its obligation to operate its business in the ordinary course.
The terminated deal which lasted all of four months, becomes the first major casualty of the collapse in malls suffered in the aftermath of the coronavirus crisis.
In kneejerk reaction Taubman shares plunged 38%, reversing all gains from the February deal announcement…
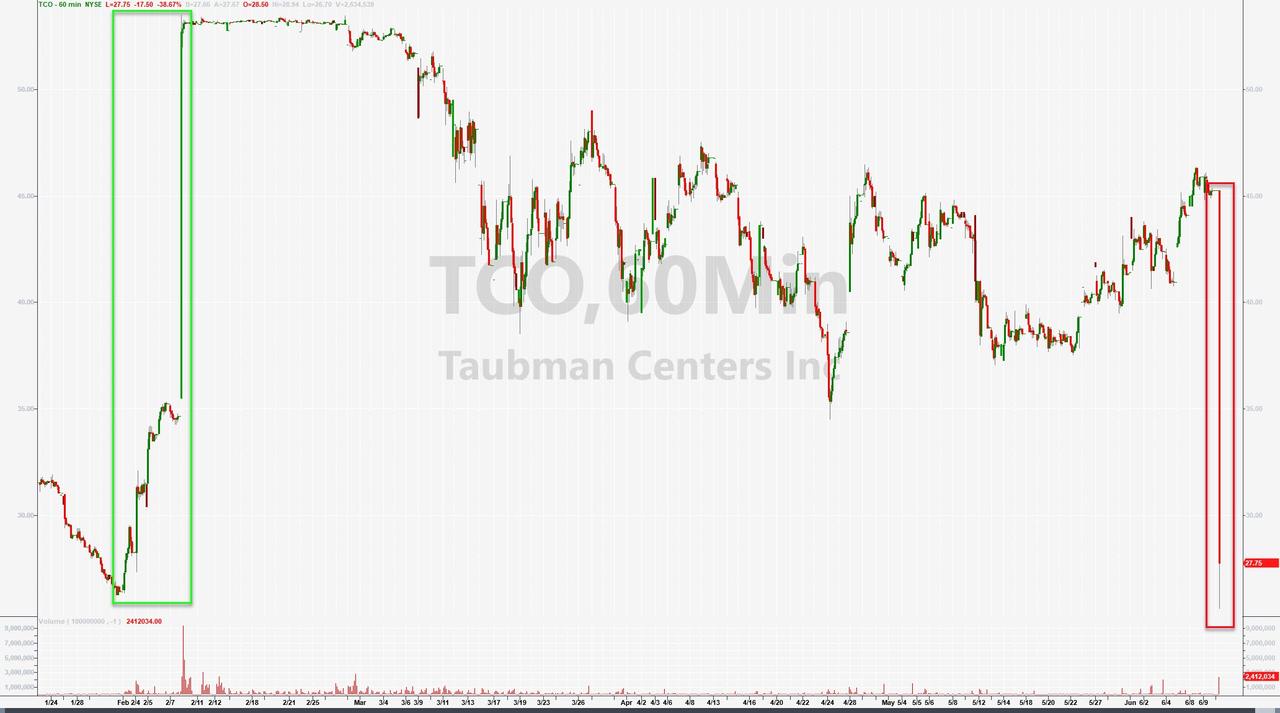
… while sending Tiffany and Casears shares sharply lower as investors grow concerned that other similar pending mergers may also be unwound.
end
Prof Lieber has been indicted again with this time for making false statements to federal authorities concerning his involvement in Chinese programs
Copeland Campus/Reform)
Harvard Prof Indicted For Lying About China Ties
Authored by Maria Copeland via Campus Reform,
Charles Lieber, the former chair of Harvard University’s Chemistry and Chemical Biology Department, was indicted Tuesday for making false statements to federal authorities concerning his involvement in Chinese programs.
As the Principal Investigator of the Lieber Research Group at Harvard University, Lieber worked with funding provided by the National Institutes of Health and the Department of Defense. In order to use these research grants, Lieber was required to fully disclose his sources of research support, which included foreign collaboration.
U.S. authorities allege that Lieber became a “strategic scientist” at Wuhan University of Technology in 2011 and worked as a “contractual participant” in China’s Thousand Talents Program from 2012 through 2015, during which time WUT paid him a sizable salary and living expenses totaling about $200,000 in U.S. dollars, as well as over $1.5 million in funding to start a research laboratory at WUT.

Lieber not only allegedly failed to report these affiliations but also denied their existence in 2018 and in 2019.
When Lieber’s activities were investigated in November 2018, Harvard told NIH at Lieber’s behest that the professor’s formal association with WUT ended after 2012, that WUT exaggerated his involvement with them in later years, and that he had never participated in the Thousand Talents Plan.
In January, Lieber was arrested for lying about his ties to Chinese scientific initiatives.
His lawyer, Marc Mukasey, claims that “the government has this wrong.”
“Professor Lieber has dedicated his life to science and to his students. Not money, not fame, just his science and his students. He is the victim in this case, not the perpetrator,” Mukasey said, Politico reported.
“We’re fighting back. And when justice is done, Charlie’s good name will be restored and the scientific community again will be able to benefit from his intellect and passion.”
Lieber will be arraigned in federal court in Boston at a later date.
iv) Swamp commentaries)
AG Barr Closing In On Charges In Biggest Political Scandal In History

For months, the DOJ has been investigating the Obama administration’s spying of Trump’s 2016 campaign. The case has long been upgraded from an inquiry into a full-blown criminal investigation. Barr’s “bulldog” John Durham has been hunting down leads in order to uncover what really went on. Now, Barr admits he’s “very troubled” by what he’s learning.
From what we already know about Obama’s DOJ’s probe against the Trump campaign, it’s pretty disturbing. The FBI and DOJ used a fake dossier from Hillary Clinton to get a warrant to spy on one of Trump’s staffers, Carter Page. The FBI had to falsify an email, removing information that would have cleared Page’s name.
Such an important detail suggests Obama’s administration knew that Page was doing nothing wrong, but wanted to make it look like he was a bad guy. Considering the circumstances, that’s pretty bad. It means that Obama’s DOJ was targeting Trump for political reasons, not to enforce the law.
That’s because, SPOILER, that’s exactly what they were doing.
There’s plenty of other ugly details connected to their ugly scheme against Trump. As the case progresses, A.G. Barr himself says we will be seeing some familiar names come out.
Attorney General Bill Barr told Fox News’ Bret Baier in an exclusive interview aired Tuesday that Americans will be able to recognize “some” of the names under investigation as part of U.S. Attorney John Durham’s ongoing probe into federal surveillance abuses — and that he is “very troubled” by “what has been called to” his attention so far…
“For the first time in American history, police organizations and the national security organizations were used to spy on a campaign, and there was no basis for it,” Barr said. “The media largely drove that — and all kinds of sensational claims were being made about the president that could have affected the election. And then and then later on, in his administration, there were actions taken that really appear to be efforts to sabotage his campaign. And that has to be looked at. And if people want to say that I’m political because I am looking at those potential abuses of power, so be it. But that’s the job of the attorney general.” [Source: Fox News]

Some accuse the “deep state” of trying to stop Trump from winning and later trying to interfere with his administration. But let’s be clear: these “deep state” operatives were really just Democrats.
Officials from the Obama administration apparently abused their power to spy on Trump’s campaign, hoping to find dirt that would confirm the bogus dossier’s accusations that he was a Russian puppet. When that didn’t work, evidence suggests they tried to set up several members of his campaign—including Donald Trump Jr.—to make it look like they were working with Russia.
They later hatched a scheme to set up Michael Flynn, who was only doing his job during the transition.
All evidence points to an underhanded scheme by Democrat allies to disrupt Trump’s rightful election and transition to the White House. After that, they continued to try to undermine him by spreading this propaganda through the media.
The Democrats’ lust for power is so great, they’d stop at nothing to get the upper hand. In a fair election, when Trump was elected, they bent and twisted the law to get what they wanted. Even today we see what great lengths Democrats will go to, to wrap their tentacles around America. They let riots ravage major cities, denied Americans access to church or work, and promised to dismantle police forces.
Why? So, that we’d be too weak to oppose their crooked agenda.
The scheme against the Trump campaign should be no shock to us. The real question is: when will the culprits be brought to justice?
Barr says that the process is slow, but it will happen.
v) King report/Courtesy of Chris Powell of GATA which includes the major swamp stories.
Hundreds of Thousands of Tiny Buyers Swarm to Insolvency Stocks
Hertz, Whiting Petroleum, Chesapeake Energy shares surge
Just in the last week, 96,000 people on the Robinhood investing app opened a position in Hertz Global Holdings Inc. The number of users holding Whiting Petroleum Corp. grew roughly 10,000 in the last 24 hours… https://www.bloomberg.com/news/articles/2020-06-09/hundreds-of-thousands-tiny-investors-swarm-to-insolvency-stocks
Satellite data suggests coronavirus may have hit China earlier: Researchers [Harvard]
“Something was happening in October,” said Brownstein, the chief innovation officer at Boston Children’s Hospital and director of the medical center’s Computational Epidemiology Lab. “Clearly, there was some level of social disruption taking place well before what was previously identified as the start of the novel coronavirus pandemic.”… [More evidence that the outbreak began in October]
Chinese Propaganda Outlet Has Paid US Newspapers $19 Million for Advertising, Printing
China Daily, an English-language newspaper controlled by the Chinese Communist Party, has paid more than $4.6 million to The Washington Post and nearly $6 million to The Wall Street Journal since November 2016, the records show. Both newspapers have published paid supplements that China Daily produces called “China Watch.” The inserts are designed to look like real news articles, though they often contain a pro-Beijing spin on contemporary news events…
https://dailycaller.com/2020/06/08/chinese-propaganda-china-daily-washington-post/
Barr says familiar names among those DOJ is investigating in Durham probe, calls findings ‘very troubling’ – He is “very troubled” by “what has been called to” his attention so far… “People should not draw from the fact that no action has been taken that taken yet, that that means that people or people are going to get away with wrongdoing…
For the first time in American history, the police organizations and the national security organizations were used to spy on a campaign and there was no basis for it,” Barr said. “The media largely drove all kinds of sensational claims were being made about the president. That could have affected the election. And then and then later on in his administration, there were actions taken that really appear to be efforts to sabotage his campaign. And that has to be looked at. And if people want to say that I’m political because I am looking at those potential abuses of power, so be it. But that’s the job of the attorney general.”… https://www.foxnews.com/politics/barr-says-familiar-names-among-those-doj-is-investigating-in-durham-probe
Terry McAuliffe recorded saying Dems prefer Biden stay ‘in the basement’
Top Joe Biden surrogate Terry McAuliffe told a videoconference meeting of Virginia Democrats over the weekend that the former vice president should remain in his basement… and that Democratic officials are broadly “preferring” that Biden stay out of the limelight…
“People say all the time, ‘Oh, we got to get the vice president out of the basement,'” McAuliffe told the “monthly breakfast” of the Norfolk City Democratic Committee. “He’s fine in the basement. Two people see him a day: his two body people. That’s it…”
George P. Bush says he’ll vote for Trump: “Only thing standing between America and socialism” http://hill.cm/goPLYjm
Antifa Seizes Seattle PD, Sets Up ‘Autonomous Zone’ Just Like ISIS and the Paris Commune
“Seattle [Mayor Jenny Durkan] is allowing a dangerous situation to fester. [Antifa] militants have taken over & created an ‘autonomous zone’ in city w/their own rules. Police precinct abandoned. Antifa set up barricades to create a border. Calling for volunteers to provide armed guard,” Ngo tweeted…
One Week after Condemning Trump Church ‘Photo-Op,’ Media Praises Pelosi Kneeling
Mayor Lightfoot Pleads with Walmart, Other Retailers to Not Abandon Chicago https://wbbm780.radio.com/articles/mayor-lightfoot-pleads-with-walmart-to-not-abandon-chicago
Reeling Chicago communities ask, ‘Who invests in us now?’
‘There are neighborhoods in the city that will never recover,’ the Rev. William Hall says. But business leaders say merchants will return despite the spasms of destruction… Two big retailers, Target and Walmart, wouldn’t say whether they will reopen ransacked stores…
https://chicago.suntimes.com/news/2020/6/5/21281013/chicago-looting-business-investment-comeback
‘What Are We Going To Have Left In Our Community?’ [Chicago] Aldermen React with Panic, Sorrow to Unrest [transcript of conference call between Chicago mayor and aldermen/women]
The recording begins with Ald. Michelle Harris (8th Ward) wondering how she could convince businesses like Walmart and CVS to rebuild on the South Side after the destruction…
The Chicago City Council’s Black Caucus criticized Lightfoot’s decision to use 375 members of the Illinois National Guard to block off the Loop and the central business district starting Sunday morning, making business corridors on the South and West sides an “easy target” for looters and criminals because they “did not have the same level of protection.”…
Ald. Emma Mitts (37th) said her West Side ward was like “the wild, wild west out there.”…
Lightfoot vowed to launch a “Herculean effort” to convince businesses to rebuild and reopen…
“I have never seen the likes of this,” Sadlowski-Garza said. “I’m scared.”…
Ald. Raymond Lopez (15th Ward) demanded that Lightfoot develop a plan to stabilize Chicago’s neighborhoods for five days, calling his Southwest Side ward “a virtual war zone” where gang members armed with AK-47’s were threatening to shoot black people…
“This is far worse than it was in 1968,” said Burke, who was elected to the City Council in 1969…
@cbschicago: Chicago is facing a $700 million budget shortfall this year due to the effects of the COVID-19 pandemic, and Mayor Lori Lightfoot said she can’t rule out a property tax hike or layoffs to address the problem. [Not counting riot costs?]
@FOXLA: The Los Angeles Police Department announced Tuesday that homicides in the city increased 250% over the previous week… people who were shot increased by 56% during the same period.
Top De Blasio Aid Quits in Protest, Accuses NYC Mayor of Being Too Kind to Police [not a parody!]
LA City Council President Nury Martinez, Who Introduced Motion to Cut Police Funding, Caught Using Private LAPD Protection at Her Home https://www.thegatewaypundit.com/2020/06/busted-la-city-council-president-nury-martinez-introduced-motion-cut-police-funding-caught-using-private-lapd-protection-home/
Mayor Bill de Blasio said Tuesday that his wife, Chirlane McCray, was behind the major decision to shift funding from the NYPD toward city youth groups and social services…[You can’t make this up!]
https://nypost.com/2020/06/09/chirlane-mccray-was-behind-decision-to-shift-nypd-funding/
Ex-military intel & Texas Ranger @RoscoeBDavis1: Okay enough already with the peaceful protester in Buffalo being pushed down crap… Martin Gugino is a 75 year old long time radical protester that been arrested over 300 times for his radical trouble making 82 times for inciting…Gugino is a longtime hard left agitator, with a documented long time criminal record of inciting riots and astro-turfing. He’s an Open Society funded radical, this is what he does…Earlier in the day he was called out by peaceful protesters for trying to stir shit up. All caught on video. Gugino was arguing with other protesters before the event trying to stir the pot… I ran his NCIC [National Crime Information Center, an electronic clearinghouse of crime data]… https://twitter.com/RoscoeBDavis1/status/1270383520951738370
The NFL rebounded in 2019 with fans after ratings and attendance declined for a few years due to outrage over kneeling during the anthem. Now, NFL players are threatening to stage even more strident protests. NFL owners are in a pickle with their employees on one side and their customers on the other side.
2016 FLASHBACK: Ruth Bader Ginsburg on kneeling for the national anthem; ‘It’s dumb and disrespectful’ ‘terrible thing to do https://trendingpolitics.com/video/216-flashback-ruth-bader-ginsburg-on-kneeling-for-th
Well that is all for today
I will see you THURSDAY night.


