
ONLY PUBLISHING PRELIMINARY COMEX OPEN INTEREST NUMBERS AND AMOUNTS STANDING
GOLD CLOSED UP 21.50 TO $4068.60
SILVER CLOSED UP $0.96 TO $58.69
JULY 24
EXCHANGE: COMEX
CONTRACT: JULY 2026 COMEX 100 GOLD FUTURES
SETTLEMENT: 4,046.600000000 USD
INTENT DATE: 07/23/2026 DELIVERY DATE: 07/27/2026
FIRM ORG FIRM NAME ISSUED STOPPED
099 H DEUTSCHE BANK AG 2
363 H WELLS FARGO SECURITI 6
732 C RBC CAP MARKETS 3
905 C ADM 5
TOTAL: 8 8
MONTH TO DATE: 12,870
GOLD: NUMBER OF NOTICES FILED FOR JULY/2026: 8CONTRACTs NOTICES FOR 800 OZ or 0.02488 TONNES
total notices so far: 12,870 contracts FOR 1,287,000 OZ OR 39.741 TONNES
MONTH TO DATE: 9,162
SILVER NOTICES: 23 NOTICE(S) FILED FOR 115,000 OZ /
total number of notices filed so far this month : 9162 CONTRACTS (NOTICES) for 45.810 million oz
GLD AND SLV
GLD
NO DATA FOR THURSDAY
INITIAL STANDING FOR JANUARY: 22.915 MILLION OZ FOLLOWED BY TODAY’S 1.185 MILLION OZ QUEUE JUMP//NEW NORMAL STANDING ADVANCES TO 49.445 MILLION OZ// TO WHICH WE ADD OUR FIRST EXCHANGE FOR RISK FOR .100 MILLION OZ//NEW STANDING ADVANCES TO 49.545 MILLION OZ!!
INTIAL STANDING FOR FEBRUARY/SILVER: 13.505 MILLION OZ FOLLOWED BY TODAY’S HUGE 0.005 MILLION OZ QUEUE JUMP / : NEW STANDING FOR SILVER AT THE COMEX ADVANCES TO 25.180 MILLION OZ. BUT WE MUST ADD OUR FIRST EXCHANGE FOR RISK OF 25 CONTRACTS FOR .125 MILLION OZ AND THEN OUR SECOND EXCHANGE FOR RISK OF .0600 MILLION OZ TO OUR THIRD HUGE 2.825 MILLION OZ EXCHANGE FOR RISK!!
INITIAL STANDING FOR MARCH: A SURPRISINGLY LOW 31.076 MILLION OZ/ FOLLOWED BY A TINY QUEUE JUMP OF XX CONTRACTS OR XXX OZ/NEW STANDING ADVANCES TO 46.060 MILLION OZ
INITIAL STANDING FOR APRIL: 7.120 MILLION OZ FOLLOWED BY TODAY’S 1 CONTRACT QUEUE JUMP WHERE 5,000 OZ WILL TAKE DELIVERY OVER ON THIS SIDE OF THE POND. NEW STANDING FOR SILVER AT THE COMEX THUS ADVANCES SLIGHTLY TO 16.565 MILLION OZ PLUS WE MUST ADD OUR 4TH EXCHANGE FOR RISK ISSUANCE OF 17 CONTRACTS OR 0.085 MILLION OZ. THESE WILL BE ADDED TO OUR OTHER 3 ISSUANCES //NEW TOTAL EXCHANGE FOR RISK//1.165 MILLION OZ// NEW TOTAL SILVER STANDING 17.730 MILLION OZ//
INITIAL STANDING FOR MAY: 31.495 MILLION OZ FOLLOWED BY ANOTHER 3 CONTRACT EXCHANGE FOR PHYSICAL JUMP TO LONDON FOR 0.015 MILLION OZ// AND THEN TO BOOT WE HAD OUR FIRST EXCHANGE FOR RISK ISSUANCE FOR 51 CONTRACTS OR 255,000 OZ MAY 21./STANDING BEFORE EXCHANGE FOR RISK: 32.070 MILLION OZ/NEW STANDING THUS REDUCES TO 32.325 MILLION OZ/.//(32.070 MILLION OZ NORMAL STANDING PLUS .255 MILLION OZ EXCHANGE FOR RISK = 32.325 MILLION OZ)
JUNE INITIAL STANDING FOR SILVER:10.935 MILLION OZ TO WHICH WE ADD OUR NEXT QUEUE JUMP OF 10,000 OZ//NEW STANDING ADVANCES TO 12.970 MILLION OZ// TO WHICH WE ADD OUR FIRST EXCHANGE FOR RISK OF 20 CONTRACTS FOR 100,000 OZ//NEW STANDING ADVANCES TO 13.070 MILLION OZ. (IN EXCHANGE FOR RISK THE BUYER ASSUMES THE RISK AND ONLY A CENTRAL BANK WOULD TAKE THAT RISK. THE BUYER IS PROBABLY THE CENTRAL BANK OF INDIA.)
JULY INITIAL STANDING: 37.110 MILLION OZ FOLLOWED BY A STRONG 62 CONTRACT QUEUE JUMP OR 1.340 MILLION OZ WHERE DELIVERY WILL OCCUR ON THE THIS SIDE OF THE POND//STANDING ADVANCES TO 45.840 MILLION OZ///
SUMMARY OF OUR JULY 2026 COMEX CONTRACT MONTH
JULY: 50.925 MILLION OZ (QUITE SMALL)
AUGUST: 59.455 MILLION OZ (QUITE SMALL)
SEPT. 50.510 MILLION OZ.(QUITE SMALL)
OCT; 82.020 MILLION OZ (WILL BE STRONG THIS MONTH)/ OCC WANTS TO REIN IN THESE ISSUANCES!
NOVEMBER: 36.425 MILLION OZ
DEC: 45.765 MILLION OZ
JANUARY 2026: 134.270 MILLION OZ (WILL BE A VERY STRONG MONTH FOR EXCHANGE FOR PHYSICAL!)
FEB : 82.130 MILLION OZ
MARCH: 56.075 MILLION OZ
APRIL; 44.44 MILLION OZ//FINAL.. SMALL THIS MONTH.
MAY 59.79 MILLION OZ
JUNE. 64.065 MILLION OZ//FINAL AND FAIR SIZED THIS MONTH.
JULY: 33.705 MILLION OZ
AND JULY: 46.720 MILLION OZ//
AUGUST: 4.70 MILLION OZ INITIAL STANDING PLUS TODAY;S 5,000 OZ QUEUE JUMP //NEW STANDING ADVANCES TO 10.960 MILLION OZ
SEPTEMBER: 68.040 MILLION OZ NORMAL DELIVERY(INCLUDES ALL QUEUE JUMPING AND EXCHANGE FOR PHYSICAL TRANSFERS) PLUS 3.0 MILLION OZ EX FOR RISK = 71.040 MILLION OZ. (THIS IS THE FIRST AND ONLY ISSUANCE OF EXCHANGE FOR RISK FOR SILVER SINCE MAY.)
OCTOBER: 39.565 MILLION OZ OF NORMAL DELIVERY INCLUDES ALL QUEUE JUMPING
PLUS
2.110 MILLION OZ EXCHANGE FOR RISK//TOTAL OZ STANDING IN OCT ADVAN
NOVEMBER: INITIAL STANDING AT 11.575 MILLION OZ FOLLOWED BY TODAY’S 195,000 OZ QUEUE JUMP WHICH FOLLOWS ALL OTHER QUEUE JUMPS OF 9.155 MILLION OZ//STANDING ADVANCES TO 19.670 MILLION OZ/
DECEMBER: INITIAL AMOUNT STANDING FOR DELIVERY: 49.33 MILLION OZ// FOLLOWED BY ANOTHER STRONG 835,000OZ QUEUE JUMP+ DEC. FIRST EXCHANGE FOR RISK 0F .850 MILLION OZ + LAST WEEK.S 495,000 OZ EXCHANGE FOR RISK AND THEN A 3RD ISSUANCE IF 1.00MILLION OZ THEN FINALLY DEC 249ISSUANCE OF 1.35 MILLION OZ EXCHANGE FOR RISK//NEW TOTAL EX FOR RIS IS 3.685 MILLION OZ // STANDING ADVANCES TO 68.415 MILLION OZ//
JANUARY: INITIAL STANDING 22.915 MILLION OZ FOLLOWED BY TODAY’S 1.185 MILLION OZ QUEUE JUMP//NORMAL STANDING ADVANCES TO 49.445 MILLION OZ// TO WHICH WE ADD OUR FIRST EXCHANGE FOR RISK OF 0.100 MILLLION OZ//NEW STANDING ADVANCES TO 49.545 MILLION OZ
FEB: 13.399 MILLION OZ IS OUR INITIAL STANDING FOR SILVER! TO WHICH WE ADD OUR NEXT QUEUE JUMP FOR 5,000 OZ AND THEN ADD OUR 3 EXCHANGE FOR RISK FOR 3.010 MILLION OZ STANDING ADVANCES TO 28.190 MILLION OZ!!
MARCH: INITIAL AMOUNT OF SILVER STANDING IS 31.076 MILLION OZ FOLLOWED BY A FINAL 0.210 MILLION OZ QUEUE JUMP //NEW TOTAL STANDING ADVANCES TO 46.060 MILLION OZ
APRIL 2026: INITITAL AMOUNT OF SILVER STANDING 7.120 MILLION OZ FOLLOWED BY TODAY’S 5,000 OZ QUUE JUMP //NEW STANDING ADVANCES TO 16.565MILLION OZ PLUS 1.165 MILLION OZ EXCHANGE FOR RISK.NEW TOTALS 17.730 MILLION OZ
MAY: INITIAL AMOUNT OF SILVER WILLING TO STAND; 31.495 MILLION OZ/ TO WHICH WE ADD OUR NEXT EXCHANGE FOR PHYSICAL JUMP OF 15,000 OZ//NEW STANDING REDUCES TO 32.070 MILLION OZ//(FOLLOWING MANY EXCHANGE FOR PHYSICAL TRANSFERS TO LONDON DURING THIS MAY DELIVERY MONTH). THERE SEEMS TO BE A SCARCITY OF SILVER OVER AT THE COMEX). THEN WE ADD OUR FIRST EXCHANGE FOR RISK OF 51 CONTRACTS FOR 255,000 OZ//STANDING ADVANCES TO 32.325 MILLION OZ//
JUNE: INITIAL AMOUNT OF SILVER WILLING TO STAND: 10.935 MILLION OZ PLUS OUR NEXT QUEUE JUMP OF 10,000 OZ//NEW STANDING ADVANCES TO 12.960 MILLION OZ TO WHICH WE ADD OUR FIRST EXCHANGE FOR RISK OF 20 CONTRACTS FOR 100,000 OZ//NEW STANDING ADVANCES TO 13.070 MILLION OZ
JULY : INITIAL STANDING: 37.110 MILLION OZ FOLLOWED BY TODAY’S STRONG 1.340 MILLION OZ QUEUE JUMP //STANDING THUS ADVANCES TO 45.840 MILLION OZ//
GOLD//OUTLINE
1.MAY SUMMARY FOR MAY TONNES WHICH STOOD FOR DELIVERY:
4. AUGUST: 60.547 TONNES OF INITIAL GOLD FIRST DAY NOTICE FOLLOWED BY THE NET MONTH’S QUEUE JUMP OF 47.2312 TONNES TO WHICH WE ADD THE FOLLOWING EXCHANGE FOR RISK ISSUANCE RECEIVED FOR THE MONTH: 5.4432 TONNES EX FOR RISK/AUG 7 , AUG 11: 2.413 TONNES EX FOR RISK AND AUG. 12 OF 2.
5.SEPT: INITIAL 8.093 TONNES OF GOLD PLUS TODAY’S QUEUE JUMP OF 0.4883 TONNES PLUS 2.2827 TONNES OF EXCHANGE FOR RISK TODAY//NEW TOTAL EX. FOR RISK/MONTH = 22.923//NEW TOTAL STANDING FOR GOLD SEPT ADVANCES TO = 48.801 TONNES!!
6.OCTOBER: 90.012 TONNES OF INITIAL GOLD STANDING WITH TODAY’S TINY 0.00311 TONNES QUEUE JUMP WHICH FOLLOWS ALL OTHER QUEUE JUMPS DURING OCT OF 76.1656 TONNES
THEN WE MUST ADD OUR 14.553 TONNES OF OUR ISSUANCE OF EXCHANGE FOR RISK/6 OCCASIONS//NEW TOTAL OF GOLD STANDING ADVANCES TO 197.5141 TONNES OF GOLD.
7.NOVEMBER BEGINS WITH 15.651 TONNES INITIALLY STANDING FOR DELIVERY FOLLOWED BY TODAY’S QUEUE JUMP OF 2.323 TONNES FOLLOWED BY ALL PREVIOUS QUEUE JUMPS IN OF OF 21.3775 TONNES TO WHICH WE ADD OUR TWO EXCHANGE FOR RISK ISSUANCE OF 4.5596 TONNES//NEW STANDING ADVANCES TO 43.9716 TONNES OF GOLD.
8. DECEMBER BEGINS WITH INITIAL STANDING OF 83.813 TONNES OF GOLD FOLLOWED BY TODAY’S 0.0TONNE QUEUE JUMP WHICH FOLLOWS ALL OTHER QUEUE JUMPS OF: 37.163 TONNES//NEW STANDING ADVANCES TO 115.390 TONNES TO WHICH WE ADD OUR 4 EXCHANGE FOR RISK FOR DECEMBER OF 6.587 TONNES/NEW STANDING ADVANCES TO 121.977 TONNES
9. JANUARY: INITITAL STANDING: 13.785 TONNES TO WHICH WE ADD OUR FIRST EXCHANGE FOR PHYSICAL TRANSFER OF 0.08709 TONNES WHICH FOLLOWS ALL OTHER QUEUE JUMPS OF 30.7117TONNES //NEW TOTAL QUEUE JUMPS 30.7117//NORMAL DELIVERY OF GOLD ADVANCES TO 36.8958 TONNES TO WHICH WE ADD OUR SIX EXCHANGE FOR RISK OF 22.315 TONNES//NEW STANDING ADVANCES TO 59.2108 TONNES.
FEB; INITIAL AMOUNT OF GOLD STANDING FOR DELIVERY: 93.567 TONNES OF GOLD TO WHICH WE ADD OUR NEXT 0.0248 TONNES 0.1555 TONNES QUEUE JUMP TO 41.2082 TONNES/ NEW NET QUEUE JUMP INCREASES TO 41.233 TONNES// AND THEN WE ADD OUR SIX EXCHANGE FOR RISK: 10,080 CONTRACTS OR 31.251 TONNES//NEW STANDING REDUCES TO 157.878 TONNES
MARCH:: INITIAL AMOUNT OF GOLD STANDING FOR DELIVERY: 8.099 TONNES TO WHICH WE ADD TODAY’S FAIR 4600 OZ QUEUE JUMP (0.2320 TONNES) AND THEN WE ADD OUR THREE EXCHANGE FOR RISK OF 22.3818 TONNES //NEW STANDING ADVANCES TO 67.6648 TONNES/
APRIL: INITIAL AMOUNT OF GOLD STANDING FOR DELIVERY: 52.600 TONNES FOLLOWED BY OUR 345 CONTRACT QUEUE JUMP FOR 34,500 OZ/ (1.073 TONNES)/NEW STANDING ADVANCES TO 70.286 TONNES TO WHICH WE ADD OUR 2ND EXCHANGE FOR RISK OF 1498 CONTRACTS FOR 149800 OZ OR 4.659 TONNES. THE NEW TOTAL EXCHANGE FOR RISK FOR THE MONTH OF APRIL IS 2239 CONTRACTS OR 223900 OZ OR 6.964 TONNES AND THIS WILL BE ADDED TO OUR NORMAL DELIVERY TOTALS (70.762 TONNES) TO GIVE US WHAT WILL STAND IN APRIL (77.726 TONNES)
MAY: INITIAL AMOUNT OF GOLD WILLING TO STAND: 12.24 TONNES OF GOLD TO WHICH WE ADD OUR NEXT QUEUE JUMP OF 345 CONTRACTS OR 34500 OZ (1.073 TONNES) TO WHICH WE ADD OUR FIVE EXCHANGE FOR RISK ISSUANCES FOR 24.635 TONNES/STANDING NOW ADVANCES TO 51.554 TONNES OF GOLD.
JUNE; INITIAL AMOUNT OF GOLD WILLING TO STAND; 64.496 TONNES.(CME CORRECTED) TO WHICH WE ADD OUR NEXT EXCHANGE FOR PHYSICAL TRANSFER OF 0.0186 TONNES/NEW STANDING REDUCES TO 127.03 TONNES
JULY: INITIAL AMOUNT OF GOLD WILLING TO STAND: 23.306 TONNES TO WHICH WE ADD OUR NEXT QUEUE JUMP OF 0.2115 TONNES//NEW STANDING ADVANCES TO 40.0404TONNES
STANDING FOR THE LAST 7 MONTHS JANUARY TO JULY:
FINAL STANDING FOR GOLD, JANUARY CONTRACT AT 59.2108 TONNES OF GOLD
FEBRUARY: INITIAL STANDING FOR GOLD: 157.878 TONNES!! WHICH INCLUDES ALL QUEUE JUMPING, THREE EXCHANGE FOR PHYSICAL TRANSFERS TO LONDON AND OUR SIX ISSUANCES EXCHANGE FOR RISK!!
MARCH: INITIAL STANDING AT 8.099 TONNES TO WHICH WE ADD OUR FINAL DAY: 0.2320 TONNES QUEUE JUMP AND THEN ADD +22.3818 TONNES EXCHANGE FOR RISK//NEW STANDING ADVANCES TO 67.6648 TONNES
APRIL: INITIAL STANDING 52.600 TONNES PLUS 27,800 OZ QUEUE JUMP (0.8648TONNES): NEW STANDING ADVANCES TO 70.286 TONNES PLUS OUR TWO EXCHANGE FOR RISK FOR 223,900 OZ OR 6.964 TONNES/NEW FINAL STANDING: 77.726 TONNES
MAY: INITIAL AMOUNT OF GOLD WILLING TO STAND; 12.24 TONNES TO WHICH WE ADD OUR NEXT QUEUE JUMP FOR 345 CONTRACTS/34,500 OZ// 1.073 TONNES/ THEN WE MUST ADD OUR EXCHANGE FOR RISK ISSUANCE: TOTAL EXCHANGE FOR RISK MAY// 5 OCCASIONS: 24.635 TONNES///NEW FINAL STANDING NOW ADVANCES TO 51.554 TONNES
JUNE: INITIAL AMOUNT OF GOLD WILLING TO STAND: 64.496 TONNES TO WHICH WE ADD OUR NEXT EXCHANGE FOR PHYSICAL TRANSFER JUMP OF 0.0186 TONNES//NEW STANDING 127.03 TONNES//FINAL
JULY: INITIAL AMOUNT OF GOLD WILLING TO STAND: 23.306 TONNES OF GOLD TO WHICH WE ADD OUR NEXT QUEUE JUMP OF 0.2115 TONNES//NEW STANDING FOR GOLD ADVANCES TO 40.0404 TONNES.
JAN. 2025: 257.919 TONNES (ISSUANCE WILL BE PRETTY GOOD THIS MONTH BUT MUCH LOWER THAN LAST MONTH)
FEB: 207.21 TONNES//EX FOR PHYSICAL ISSUANCE (WILL BE A FAIR SIZED ISSUANCE THIS MONTH)
MARCH 130.84 TONNES//QUITE SMALL THIS MONTH.
APRIL; 208.57 TONNES. STRONG THIS MONTH
MAY: 113.499 TONNES OF GOLD EFP ISSUANCE//QUITE SMALL THIS MONTH
JUNE: 97.79 TONNES OF GOLD EFP ISSUANCE/EXTREMELY SMALL
JULY : 150.877 TONNES// QUITE SMALL
AUGUST: 175.86 TONNES A LOT LARGER THIS MONTH.
SEPT. 116.13 TONNES VERY SMALL
OCT. 252.72 TONNES//CERTAINLY MUCH LARGER THIS MONTH/VERY STRONG
NOV: 124.74 TONNES
DEC: 190.04 TONNES//GOOD SIZED THIS MONTH FINAL.
TOTAL EXCHANGE FOR PHYSICAL ISSUED FOR YEAR 2025: 2,026.20 TONNES (LOWER THAN LAST YR 2,569.00 TONNES
JANUARY: 209.08 TONNES ( (WILL BE A STRONG MONTH FOR EXCHANGE FOR PHYSICAL)
FEB. 176.35 TONNES (WHICH IS A FAIR ISSUANCE)
MARCH: 214.67 TONNES//WILL BE STRONG ISSUANCE THIS MONTH
APRIL; 88.00 TONNES// WILL BE VERY SMALL THIS MONTH
MAY 118.430 TONNES
JUNE: 142.053 TONNES
JULY: 89.198 TONNES
HERE IS A BRIEF SYNOPSIS OF HOW THE CROOKS FLEECE UNSUSPECTING LONGS
YOU WILL ALSO NOTICE THAT THE COMEX OPEN INTEREST STARTS TO RISE BUT SO IS THE OPEN INTEREST OF SPREADERS. THE OPEN INTEREST IN WILL CONTINUE TO RISE UNTIL ONE WEEK BEFORE FIRST DAY NOTICE OF AN UPCOMING ACTIVE DELIVERY MONTH (OCT), AND THAT IS WHEN THE CROOKS SELL THEIR SPREAD POSITIONS BUT NOT AT THE SAME TIME OF THE DAY. THEY WILL USE THE SELL SIDE OF THE EQUATION TO CREATE THE CASCADE (ALONG WITH THEIR COLLUSIVE FRIENDS) AND THEN COVER ON THE BUY SIDE OF THE SPREAD SITUATION AT THE END OF THE DAY. THEY DO THIS TO AVOID POSIT
WHAT IS ALARMING TO ME, ACCORDING TO OUR LONDON EXPERT ANDREW MAGUIRE IS THAT THESE EFP’S ARE BEING TRANSFERRED TO WHAT ARE CALLED SERIAL FORWARD CONTRACT OBLIGATIONS AND THESE CONTRACTS ARE LESS THAN 14 DAYS. ANYTHING GREATER THAN 14 DAYS, THESE MUST BE RECORDED AND SENT TO THE COMPTROLLER, GREAT BRITAIN TO MONITOR RISK TO THE BANKING SYSTEM. IF THIS IS INDEED TRUE, THEN THIS IS A MASSIVE CONSPIRACY TO DEFRAUD AS WE NOW WITNESS A MONSTROUS TOTAL EFP’S ISSUANCE AS IT HEADS INTO THE STRATOSPHERE.
The crooks also use the spread in the TAS account (trade at settlement). They buy the spot TAS (e.g. June) and sell the future TAS two months out (e.g. August). Then they unload the front month (i.e. unload the buy side first so the price of gold/silver falls. This occurs in the middle of the front delivery month cycle. They unload the sell side of the equation, two months down the road. The crooks violate position limits as the OCC refuse to hear our complaints.
First, here is an outline of what will be discussed tonight:
SILVER:
1.TODAY WE HAD THE OPEN INTEREST AT THE COMEX IN SILVER FELLBY A TINY 10 CONTRACTS TO AN OI OF 106,728
EFP ISSUANCE 15 CONTRACTS
OUR CUSTOMARY MIGRATION OF COMEX LONGS CONTINUE TO MORPH INTO LONDON FORWARDS AS OUR BANKERS USED THEIR EMERGENCY PROCEDURE TO ISSUE:
SEPT 15 CONTRACTS and 0 ALL OTHER MONTHS: ZERO. TOTAL EFP ISSUANCE: 0 CONTRACTS. EFP’S GIVE OUR COMEX LONGS A FIAT BONUS PLUS A DELIVERABLE PRODUCT OVER IN LONDON. IF WE TAKE THE COMEX OI LOSS OF 409 CONTRACTS AND ADD TO THE 15 E.FP. ISSUED
WE OBTAIN A TINY LOSS OF 10 OI OPEN INTEREST CONTRACTS FROM OUR TWO EXCHANGES WITH OUR LOSS OF $2.18
THUS IN OUNCES, THE LOSS ON THE TWO EXCHANGES TOTALS 0.25 MILLION PAPER OZ
AND YET WE HAD A STRONG 1.340 MILLION OZ QUEUE JUMP
STANDING ADVANCES TO 45.840 MILLION OZ
OCCURRED WITH OUR GAIN IN PRICE.OF $1.45
2.ASIAN AFFAIRS JULY 24 /2025
HANGHAI CLOSED DOWN 62.58PTS OR 1.61%
HANG SENG CLOSED DOWN 247.58 PTS OR 0.98%
Nikkei CLOSED DOWN 1811.45PTS OR 2.73%
//Australia’s all ordinaries CLOSED DOWN 0.04%
//Chinese yuan (ONSHORE) CLOSED UP TO 6.7722
/ OFFSHORE CLOSED UP AT 6.7733 Oil UP TO 8977 dollars per barrel for WTI and BRENT UP TO 97.45 Stocks in Europe OPENED ALL GREEN
ONSHORE USA/ YUAN// WITH YUAN TRADING UP (6.7722) OFFSHORE YUAN TRADING UP TO 6.7732 ONSHORE YUAN TRADING ABOVE LEVEL OF OFF SHORE AND UP ON THE DOLLAR// / AND THUS STRONGER/OFF SHORE YUAN TRADING UP AGAINST US DOLLAR/ AND THUS STRONGER
XXXXXXXXXXXXXXXXXXXXXXXXXXXXXXXXXXXXX
XXXXXXXXXXXXXXXXXXXXXXXXXXXXXXXXXXXXX
XXXXXXXXXXXXXXXXXXXXXXXXXXXXXXXXXXXXX
1. COMEX DATA//AMOUNTS STANDING//VOLUME OF TRADING/INVENTORY MOVEMENTS
LET US BEGIN:
THE TOTAL COMEX GOLD OPEN INTEREST ROSE BY A SMALL 980 CONTRACTS TO 388,215 STILL WELL ABOVE ITS NEW LOW OF 326,052 OI SET JUNE 3, CLOSE TO THE PREVIOUS ALL TIME LOW OF 345,705 SET (MAY 28) AND CLOSE TO THE PREVIOUS ALL TIME LOW IN OI OF 353,490 SET MAY 27.. PREVIOUS TO THAT THE ALL TIME LOW IN OI WAS 390,000 SET IN THE YEAR 2001 WHEN GOLD WAS TRADING $260.00. THE CME SHOULD BE PROUD OF THEMSELVES AS MANY HAVE ABANDONED THIS CROOKED ARENA!!THUS OUR NEW ALL TIME LOW OF COMEX OI HAS NOW BEEN SET AT 326,052 //JUNE 3 2026 WITH GOLD AT AN EXTREMELY HIGH $4,450.00 WHICH MAKES ABSOLUTELY NO SENSE!!!
WE HAD HUGE T.A.S. LIQUIDATION DURING THURSDAY’S COMEX TRADING/. IT SEEMS THAT MANY OF THE SPECULATORS THAT HAVE NOW CONTINUED AGAIN TO BE ON THE SHORT SIDE WITH BANKERS ON THE LONG SIDE AND THESE GUYS WERE OBLITERATED YESTERDAY WHEN THE LONGS TENDERED FOR DELIVERY:
CENTRAL BANKS TENDERED THEIR NEW LONG CONTRACTS AT THE END OF THE DAY FOR PHYSICAL GOLD. YOU CAN VISUALIZE THIS WITH THE STRONG AMOUNT OF GOLD STANDING AT THE COMEX FOR THIS JULY CONTRACT MONTH!!
THE STRONG SIZED GAIN ON OUR TWO EXCHANGES (5134CONTRACTS) OCCURRED WITH OUR STRONG LOSS IN PRICE IN GOLD (UP $98.40)
WE THUS HAD A STRONG SIZED GAIN IN OI ON BOTH OF OUR EXCHANGES (5134 CONTRACTS), WITH OUR GAIN IN PRICE, AS WE WERE INFORMED OF A STRONG CONTRACT EXCHANGE FOR PHYSICAL ISSUANCE EQUATING TO 4154 CONTRACTS.
THEN WE WERE NOTIFIED TODAY OF A 0 CONTRACT FOR RISK ISSUANCE IN GOLD CONTRACTS FOR 0 OZ OR 0 TONNES OF GOLD. ON FRIDAY, BY FAR WE HAD THE HIGHEST EVER EXCHANGE FOR RISK EVER ISSUED AT ONE TIME BEATING THE PREVIOUS SINGLE HIGHEST ISSUE BY ONE TONNE. THUS MAY 22 RECORDS THE HIGHEST EVER EXCHANGE FOR RISK AT 12.4416 TONNES. WE HAD OUR FIRST ISSUANCE FOR EXCHANGE FOR RISK IN THE MONTH OF MAY ON MAY 7, THEN OUR 2ND ISSUANCE FOR OUR MAY GOLD MONTH ON MAY 12. THE THIRD ON MAY 18 , THEN MAY 21 OUR 4TH ISSUANCE AND THEN FINALLY FRIDAY, OUR 5TH ISSUANCE. THIS GOLD WILL BE ADDED TO OUR NORMAL MAY DELIVERIES TO GIVE US OUR FINAL AMOUNT OF GOLD WILLING TO STAND AT THE COMEX..
HISTORY OF EXCHANGE FOR RISK ISSUANCE THIS YEAR: FEBRUARY THROUGH JUNE AND JULY
FEBRUARY:
DURING THE MIDDLE OF THE FEBRUARY CONTRACT MONTH, WE HAD TWO IDENTICAL MONSTER 3,000 CONTRACT ISSUED FOR THE SAME 9.33 TONNES OF GOLD, AND THESE WERE THE HIGHEST EVER IN TONNAGE EVER ISSUED BY THE COMEX. ALTOGETHER THE TOTAL ISSUANCE FOR FEB TOTALLED SIX.(31.251 TONNES).
MARCH:
THURSDAY MARCH 17 WE RECEIVED ITS INITIAL 2000 CONTRACT EXCHANGE FOR RISK ISSUANCE FOR 6.22 TONNES. LAST FRIDAY: 0 ISSUANCE OF EXCHANGE FOR RISK. BUT ON MONDAY MARCH 23 WE RECEIVED NOTICE OF OUR SECOND EXCHANGE FOR RISK ISSUANCE FOR 2,200 CONTRACTS (220,000 OZ OR 6.843 TONNES) AND NOW FRIDAY WITH A MONSTER 2996 CONTRACTS FOR 9.3138 TONNES. THESE THREE ISSUANCES WILL NOW BE ADDED TO THE REGULAR AMOUNT OF GOLD STANDING, I.E. 22.3818 TONNES TO OUR NORMAL GOLD STANDING TO GIVE US WHAT WILL STAND FOR PHYSICAL GOLD FOR MARCH!
APRIL;: 2 EXCHANGE FOR RISK SO FAR, I.E. 2239 CONTRACTS FOR 223,900 OZ OR 6.964 TONNES AND THIS TOTAL TONNES WILL BE ADDED TO OUR NORMAL DELIVERY TO GIVE US WHAT WILL STAND IN APRIL
MAY: FIVE ISSUANCES SO FAR FOR 7920 CONTRACTS OR 792,000 OZ OR 24.635 TONNES.
JUNE: 0 IN GOLD. THUS FOR THE ENTIRE MONTH IN GOLD ZERO NOTICES WERE FILED.
JULY 0
XXXXXXXXXXXXXXXXXXXXXXXXXXXXXXXXX
A LITTLE HISTORY OF EXCHANGE FOR RISK DECEMBER THROUGH TO JUNE/JULY:
IN DECEMBER WE HAVE RECORDED 5 ISSUANCES OF EXCHANGE FOR RISK/4 FOR DEC AND THE LAST ONE ON DEC 31 FOR JANUARY. WE NOW HAVE 3 CHOICES FOR THE RECIPIENT OF THIS ISSUANCE AND IT MUST BE A CENTRAL BANK. YOU WILL RECALL THAT THE BUYER ASSUMES THE RISK OF THAT DELIVERY. (THUS TOTAL EXCHANGE FOR RISK FOR THE MONTH OF DECEMBER IS 6.56 TONNES/4 OCCASIONS.
MONTH OF JANUARY/EXCHANGE FOR RISK
IN JANUARY THEY HAVE 6 TOTAL ISSUANCE : 3.446 TONNES EARLY, THEN JAN 9 ISSUANCE OF 9,331 TONNES AND THEN JAN 16: 0.1996 TONNES JAN 26: 1.499 TONNES, JAN 27: 3.160 AND FINALLY JAN 29: 4.659 TONNES TONNES//TOTAL EXCHANGE FOR RISK JANUARY 22.315 TONNES WHICH WAS ADDED TO OUR NORMAL DELVERIES.
AND FEBRUARY:
FEB EXCHANGE FOR RISK: NOW 6 ISSUANCES: 10,080 CONTRACTS FOR 1,008,000 OZ OR 31.251 TONNES!
HERE ARE THE CHOICES FOR THE RECIPIENT OF THOSE ISSUANCES:
1 THE CENTRAL BANK OF ENGLAND. BUT THEY RECEIVED CLEARANCE THAT THEIR GOLD IS BACK SO IT IS NOT LIKELY THAT THEY WOULD LIKE TO ADD TO THEIR RESERVES.
2. THE CENTRAL BANK OF THE USA: THE FED. LOGICAL CHOICE AS THEY CLAMOUR TRYING TO REDUCE THEIR 146+ TONNES OF SHORTAGE. HOWEVER THEY SEEM NOT TO BE IN A HURRY TO COVER THEIR HUGE SHORTFALL
3. THE CENTRAL BANK OF CHINA AS THEY BATTLE WITS WITH THE USA.
TOTAL EXCHANGE FOR RISK FOR DECEMBER IS 6.56 TONNES AND THIS WAS ADDED TO OUR NORMAL DELIVERY TOTALS..
THE JANUARY ISSUANCE OF 17.656 TONNES WAS ADDED TO OUR DAILY DELIVERY TOTALS!!
FEBRUARY ISSUANCES 6 FOR; 31.251 TONNES !! AND THIS WAS ADDED TO OUR DELIVERY TOTALS FOR THIS MONTH.
MARCH: CME ANNOUNCES ITS FIRST EXCHANGE FOR RISK FOR 2000 CONTRACTS FOR 200,000 OZ OR 6.22 TONNES OF GOLD DURING THE FIRST WEEK OF MARCH, AND THEN MONDAY, MARCH 22, WE RECEIVED ITS SECOND NOTICE ISSUANCE OF 2200 CONTRACTS OR 220000 OZ (6.843 TONNES). THEN FINALLY WE RECEIVED NOTICE OF OUR THIRD EXCHANGE FOR RISK OF 2996 CONTRACTS OR 9.3188 TONNES. TOGETHER ALL 3 ISSUANCES TOTAL 22.3818 TONNES WHICH WILL BE ADDED TO OUR NORMAL DELIVERY SCHEDULE.
APRIL: 2 EXCHANGE FOR RISK SO FAR FOR 223,900 OZ OR 6.964 TONNES. AND THIS TOTAL WILL BE ADDED TO OUR NORMAL DELIVERY TO GIVE US WHAT WILL STAND FOR APRIL!!
MAY: FIVE ISSUANCES SO FAR FOR 7920 CONTRACTS, 792,000 OZ OR 24.635 TONNES OF GOLD. THIS TOTAL WILL BE ADDED TO OUR NORMAL DELIVERIES IN MAY TO GIVE US WHAT WILL STAND IN MAY.
JUNE: ZERO
JULY 0
DETAILS ON OUR NEW JULY COMEX CONTRACT MONTH//
IN TOTAL WE HAD A STRONG GAIN ON OUR TWO EXCHANGES OF 5134 CONTRACTS DESPITE OUR LOSS IN PRICE ($98.70). HOWEVER, OUR FRIENDLY PHYSICAL LONDON BOYS HAD ANOTHER FIELD DAY AGAIN THROUGHOUT THIS WEEK AS THEY WERE READY FOR THE FRBNY.S CONTINUED ORCHESTRATED ATTACKS VERY EARLY IN THE COMEX SESSIONS AS THEY TRIED TO ABSORB EVERYTHING IN SIGHT FROM THEIR DAILY ATTACKS. LONDONERS EXERCISED THEIR BOUGHT CONTRACTS FOR PHYSICAL GOLD VIA THE EXCHANGE FOR PHYSICAL ROUTE AND THANKED THE FRBNY AND OUR SHORT SPECULATORS FOR THEIR THOUGHTFULNESS.
LONDON ANNOUNCED EARLY IN THE YEAR (AND SCARCITY CONTINUES TO THIS DAY) THAT THEY WERE OUT OF GOLD. WRONGLY IT WAS ATTRIBUTED TO THEIR SHIPPING PHYSICAL GOLD TO COMEX FOR STORAGE DUE TO TRUMP’S INITIATION OF TARIFFS. THE TRUTH OF THE MATTER IS THAT THIS GOLD LEFT LONDON TO OTHER CENTRAL BANKS, AND COMEX BANKS HAVE BEEN PAPERING THEIR LOSSES (DERIVATIVE) WITH KILOBAR ENTRIES. BOTH COMEX AND LBMA ARE WITNESSING MASSIVE AMOUNTS OF GOLD LEAVING THEIR VAULTS.
THE LIQUIDATION OF T.A.S. CONTRACTS THROUGHOUT THE MONTHS OF JUNE/JULY CONTINUES TO DISTORT OPEN INTEREST NUMBERS GREATLY ALTHOUGH THE T.A.S. ISSUANCES IN GOLD HAVE GENERALLY BEEN ON THE LOW SIDE COMPARED TO SILVER WHICH HAVE BEEN HUGE. TODAY’S NUMBER HOWEVER IS A FAIR SIZED T.A.S ISSUANCE CONTRACTS .THE CME NOTIFIES US THAT THEY HAVE ISSUED 1258 T.A.S CONTRACTS. THESE ARE GENERALLY USED FOR RAID PURPOSES TO STOP GOLD’S RISE AND TO TEMPER HUGE LOSSES IN OTC DERIVATIVE BETS.
IT SURE LOOKS LIKE THE BIS HAS SOMEHOW LOOKED THE OTHER WAY WITH ITS GOLD SWAPS WITH THE FRBNY AS THIS ENTITY FOR THE FED REFUSES THE BIS MARCHING ORDERS TO COVER AND THAT MAY EXPLAIN THE STRONG NUMBER OF T.A.S. ISSUANCES IN DECEMBER , JANUARY AND THROUGHOUT FEBRUARY TO GO ALONG WITH OUR HUGE NUMBER OF EXCHANGE FOR RISK ISSUED DURING THESE MONTHS INCLUDING FEBRUARY’S 6 EXCHANGE FOR RISK WHICH ALSO INCLUDED TWO MONSTER 9.3312 TONNE ISSUANCE (FEB 10 AND FEB 12). TOTAL EXCHANGE FOR RISK/FEB EQUALS 31.251 TONNES!! AND MARCH’S THREE ISSUANCES FOR 22.3818 TONNES! OTHER CENTRAL BANKS ARE PAYING ATTENTION AS THEY TAKE DELIVERY OF HUGE AMOUNTS OF PHYSICAL GOLD. APRIL HAD 2 EXCHANGE FOR RISK ISSUANCES FOR 6.694 TONNES. AND NOW MAY WITH ITS 5TH ISSUANCE FOR 12.4436 TONNES///TOTAL EXCHANGE FOR RISK FOR MAY: 24.635 TONNES ISSUED MAY 6 ,MAY 12, MAY 18 MAY 21 AND NOW MAY 22..
JUNE: ZERO FOR THE MONTH
JULY: ZERO SO FAR
WE MUST ALSO REMEMBER THAT THE FRBNY IS SHORT 146+ TONNES OF GOLD, THIS COMMENCED ON JAN 2 2023 AS THEY REFUSE TO COVER DESPITE THE BIS’S PLEA TO DO SO.
HERE IS A SUMMARY OF GOLD STANDING FOR DELIVERY ON OUR LAST 12 MONTHS:
1.APRIL AT 209 TONNES
2. AND THIS CONTINUED INTO MAY WITH FINAL STANDING AT 90.23 TONNES.
3. JUNE WHICH IS A HUGE DELIVERY MONTH , FINAL STANDING WAS RECORDED AT A STRONG 93.085 TONNES. //(TOTAL NET QUEUE JUMPING FOR THE JUNE MONTH: 31.027 TONNES.)
4. IN JULY WE HAD HUGE DELIVERY NOTICES ESPECIALLY FOR A NON ACTIVE DELIVERY MONTH WITH INITIAL STANDING AT 17.947 TONNES PLUS MANY QUEUE JUMPS + 3.75 TONNES EX FOR RISK = 41.106 TONNES OF GOLD // FINAL TOTAL TONNES STANDING JULY: 41.106 TONNES
5. FOR THE MONTH OF AUGUST:
INITIAL AMOUNT OF GOLD STANDING FOR AUGUST: 60.547 TONNES PLUS THE MONTHS HUGE QUEUE JUMPS OF 47.2312 TONNES +44.696 TONNES EX FOR RISK (7 ISSUANCES) //NEW STANDING 152.208 TONNES WHICH IS MONSTROUS!!!
6. FINAL AMOUNT OF GOLD STANDING FOR SEPT; INITIAL STANDING; 2,602 CONTRACTS OR 260,200 OZ FOR 8.093 TONNES OF GOLD FOLLOWED BY TODAY’S 0.4883 TONNES QUEUE JUMP TO GO ALONG WITH TODAY’S 1.244 TONNES OF EXCHANGE FOR RISK ISSUANCE TODAY AND // TOTAL EXCHANGE FOR RISK ISSUANCE SEPT: 22.923 TONNES//NEW TOTALS STANDING ADVANCES TO 48.801 TONNES OF GOLD!!!
7. OCTOBER:
OCTOBER: INITIAL STANDING FOR GOLD: 90.164 TONNES TO WHICH WE ADD OUR LATEST OCT 30 QUEUE JUMP OF 0.00311 TONNES WHICH FOLLOWS OCT 29 QUEUE JUMP OF .4096 WHICH FOLLOWS; OCT 28 QUEUE JUMP OF .5069 TONNES WHICH FOLLOWS OCT 27 OF 0.3048 TONNES WHICH FOLLOWS: OCT 24 OF 0.8615 TONNES, FOLLOWING OCT 23 QUEUE JUMP OF 1.695 TONNES OCT 22 JUMP OF 8.622 TONNES WHICH FOLLOWS OCT 21: 3.8600 TONNES TO OCT 20 QUEUE JUMP OF 7.695 TONNE
SUMMARY FOR OCTOBER STANDING:
NOVEMBER WHERE INITIAL AMOUNT OF GOLD STANDING IS REGISTERED AT 15.651 TONNES OF GOLD FOLLOWED BY TODAY’S QUEUE JUMP OF 2 TONNES AND FOLLOWED BY ALL OTHER NOV QUEUE JUMPS OF 21.3775 TONNES TO WHICH WE ADD OUR TWO EXCHANGE FOR RISK ISSUANCE FOR 4.5596 TONNES.
/STANDING ADVANCES TO 43.9716 TONNES OF GOLD.
DECEMBER: INITIAL AMOUNT OF GOLD STANDING FOR DELIVERY IN THIS ACTIVE MONTH IS 83.813 TONNES FOLLOWED BY TODAY’S 0.05 TONNES QUEUE JUMP. THIS FOLLOWS ALL OTHER QUEUE JUMPING: 37.163 TONNES//NEW STANDING ADVANCES TO 115.390 TONNES TO WHICH WE ADD OUR FOUR EXCHANGE FOR RISK ISSUANCE OF 6.559 TONNES//NEW STANDING THUS INCREASES TO 121.977 TONNES
JANUARY: INITITAL STANDING: 13.785 TONNES TO WHICH WE ADD OUR QUEUE JUMP OF 0.000 TONNES WHICH FOLLOWS ALL OTHER QUEUE JUMPS OF 30.7117TONNES //NEW TOTAL QUEUE JUMPS 30.7117//NORMAL DELIVERY OF GOLD ADVANCES TO 36.8958 TONNES TO WHICH WE ADD OUR SIX EXCHANGE FOR RISK OF 22.315 TONNES//NEW STANDING ADVANCES TO 59.2108 TONNES.
FEBRUARY: . FEBRUARY: INITIAL STANDING: 93.566 TONNES TO WHICH WE ADD OUR NEXT QUEUE JUMP OF 0.0248 TONNES WHICH MUST BE ADDED ALL OTHER QUEUE JUMPS OF 41.2087 TONNES QUEUE JUMP//TOTAL QUEUE JUMP FOR FEB::ADVANCES TO 41.233 TONNES///STANDING ADVANCES TO 126.628 TONNES TO WHICH WE ADD OUR SIX EXCHANGE FOR RISK OF 31.251 TONNES/NEW STANDING FINALIZES AT 157.879 TONNES, ITS HIGHEST STANDING RECORDED IN OVER 4 YEARS.
MARCH: INITIAL STANDING FOR GOLD: 8.099 TONNES TO WHICH WE ADD OUR NEXT QUEUE JUMP OF 0.2320 TONNES AND THEN WE ADD OUR THREE EXCHANGE FOR RISK OF 22.3818 TONNES////NEW STANDING FOR GOLD ADVANCES TO: 67.6648TONNES WHICH IS ABSOLUTELY HUGE FOR A NON ACTIVE DELIVERY MONTH!!
APRIL 2026: INITIAL STANDING FOR GOLD: 52.20 TONNES FOLLOWED BY TODAY’S SMALL 500 OZ QUEUE JUMP/ TO WHICH WE ADD OUR TWO EXCHANGE FOR RISK ISSUANCES TOTALLING 223,900 OZ OR 6.964 TONNES//STANDING ADVANCES TO 77.726 TONNES WHICH IS ABSOLUTELY HUGE
MAY: INITIAL AMOUNT OF GOLD WILLING TO STAND: 12.24 TONNES OF GOLD TO WHICH WE ADD OUR NEXT HUGE QUEUE JUMP OF 34,500 OZ (1.073 TONNES) TO WHICH WE ADD OUR FIVE EXCHANGE FOR RISK ISSUANCE FOR 792,000 OZ OR 24.635 TONNES////NEW TOTALS STANDING FOR GOLD ADVANCES TO 51.554 TONNESS
JUNE: INITIAL AMOUNT OF GOLD WILLING TO STAND: 64.496 TONNES TO WHICH WE SUBTRACT AN EXCHANGE FOR PHYSICAL TRANSFER TO LONDON OF 0.0186 TONNES//NEW STANDING REDUCES TO 127.03 TONNES// TOTAL QUEUE JUMPING FOR THE MONTH FINALIZES AT 62.4217 TONNES OR AVERAGING 3.285 TONNES PER DAY IN JUNE.
JULY: INITIAL AMOUNT OF GOLD WILLING TO STAND: 749,300 OZ OR 23.306 TONNES OF GOLD TO WHICH WE ADD OUR NEXT QUEUE JUMP OF 0.2115 TONNES//NEW STANDING ADVANCES TO 40.0404TONNES. TOTAL QUEUE JUMPING SO FAR: 16.794 TONNES OR 0.9878 TONNES ON EACH TRADING DAY LEAVING COMEX FOR EASTERN SHORES.
HERE ARE THE AMOUNTS THAT STOOD FOR DELIVERY IN THE PRECEDING 48 MONTHS 2021-2024
DEC 2021: 112.217 TONNES
NOV. 8.074 TONNES
OCT. 57.707 TONNES
SEPT: 11.9160 TONNES
AUGUST: 80.489 TONNES
JULY 7.2814 TONNES
JUNE: 72.289 TONNES
MAY 5.77 TONNES
APRIL 95.331 TONNES
MARCH 30.205 TONNES
FEB ’21. 113.424 TONNES
JAN ’21: 6.500 TONNES.
TOTAL YEAR 2021 (JAN- DEC): 601.213 TONNES
YEAR 2022: STANDING FOR GOLD/COMEX
JANUARY 2022 17.79 TONNES
FEB 2022: 59.023 TONNES
MARCH: 36.678 TONNES
APRIL: 85.340 TONNES FINAL.
MAY: 20.11 TONNES FINAL
JUNE: 74.933 TONNES FINAL
JULY 29.987 TONNES FINAL
AUGUST:104.979 TONNES//FINAL
SEPT. 38.1158 TONNES
OCT: 77.390 TONNES/ FINAL
NOV 27.110 TONNES/FINAL
Dec. 64.000 tonnes
(TOTAL YEAR 656.076 TONNES)
JAN/2023: 20.559 tonnes
FEB 2023: 47.744 tonnes
MAR: 19.0637 TONNES
APRIL: 75.676 tonnes
MAY: 19.094 TONNES + 1.244 tonnes of exchange for risk = 20.338
JUNE: 64.354 TONNES
JULY: 10.2861 TONNES
AUGUST: 38.855 TONNES(INCLUDING .6842 EXCHANGE FOR RISK)
SEPT: 15.281 TONNES FINAL
OCT. 35.869 TONNES + 1.665 EXCHANGE FOR RISK =37.0355 tonnes
NOV: 18.7122 TONNES + 16.2505 EX. FOR RISK = 34.9627 TONNES
DEC. 47.073 + 4.634 TONNES OF EXCHANGE FOR RISK = 51.707 TONNES
TOTAL 2023 YEAR : 436.546 TONNES
2024/STANDING FOR GOLD/COMEX
JAN ’24. 22.706 TONNES
FEB. ’24: 66.276 TONNES (INCLUDES 1.723 TONNES EX. FOR RISK)
MARCH: 18.8398 TONNES + 1.1695 EX FOR RISK = 20.093 TONNES
APRIL: 2024: 53.673TONNES FINAL
MAY/ 2024 8.5536 TONNES + 3.3716 TONNES EX FOR RISK/= 11.9325
JUNE; 95.578 TONNES. + 1.045 TONNES EXCHANGE FOR RISK =96.623 THIS IS THE HIGHEST RECORDED GOLD STANDING SINCE AUGUST 2022
JULY: 11.692 TONNES
AUGUST 69.602 TONNES//FINAL STANDING
SEPT. 13.164 TONNES.
OCT 39.474 TONNES + + 20.917 TONNES EXCHANGE FOR RISK =60.391 TONNES
NOV . 11.265 TONNES +4.665 TONNES EXCHANGE FOR RISK/TUESDAY + 3.11 TONNES OF EX. FOR RISK/PRIOR = 19.0425 TONNES
DEC: 80.4230 TONNES PLUS DEC MONTH EXCHANGE FOR RISK TOTAL 14.6836 TONNES EQUALS 95.1066 TONNES
total year 2024: 540.30 tonnes
COMEX GOLD TRADING BEGINNING JULY,. CONTRACT;
THE SPECS/HFT WERE SUCCESSFUL IN LOWERING GOLD’S PRICE( IT FELL BY $98.40)
WE HAD ZERO T.A.S. SPREADER LIQUIDATION THURSDAY // COMEX SESSION// WITH OUR LOSS IN PRICE
OTHER EASTERN CENTRAL BANKS TENDERED FOR PHYSICAL EVERY NIGHT WHICH ALSO EXPLAINS THE HUGE NUMBER OF TONNES OF GOLD THAT STOOD FOR GOLD DURING THESE PAST SEVERAL MONTHS
THURDAY NIGHT/FRIDAY MORNING
THE CROOKS COULD NOT STOP OTHER CENTRAL BANK LONGS, SEIZING THE MOMENT, THEY EXERCISED AGAIN FOR PHYSICAL IN A BIG WAY TENDERING FOR PHYSICAL THURDAY EVENING //FRIDAY MORNING AND THUS OUR HUGE NUMBER OF GOLD CONTRACTS STANDING FOR DELIVERY AT THE COMEX. CENTRAL BANKERS WAIT PATIENTLY FOR THE GOLD
ALL OF THIS WAS ACCOMPLISHED WITH OUR LOSS IN PRICE TO THE TUNE OF $98.40
WE HAD 231 CONTRACTS ADDED TO OUR OI AT THE COMEX TRADES TO OPEN INTEREST (CROOKS)//PRELIMINARY TO FINAL.
NET GAIN ON THE TWO EXCHANGES: 5134 CONTRACTS OR 513400 OZ (15.970 TONNES)
JULY DELIVERY MONTH
JULY 24
| Gold | Ounces |
| Withdrawals from Dealers Inventory in oz | nil |
| Withdrawals from Customer Inventory in oz | ONE ENTRY i) Out of HSBC: 160.755 5 kilobars oz total withdrawal; 160.755 oz |
| Deposit to the Dealer Inventory in oz | 0 ENTRY |
| Deposits to the Customer Inventory, in oz | DEPOSITS/CUSTOMER//gold NTRIES: 2 i) Into Loomis Customer acct: 9645.000oz (300 kilobar)s ii) Into Stonex 96,453 oz (3 kilobars) total deposit: Customer acct 9741.35 oz (3003 kilobars) of ,3003 tonne xxxxxxxxxxxxxxxx |
| No of oz served (contracts) today | 8 CONTRACTS OR 800 OZ 0.02488 TONNES OF GOLD |
| No of oz to be served (notices) | 3 Contracts 2800 OZ 0.00933 TONNES |
| Total monthly oz gold served (contracts) so far this month | 12,870 notices 1,287,000 OZ 40.031TONNES |
| Total accumulative withdrawals of gold from the Dealers inventory this month | NIL oz |
| Total accumulative withdrawal of gold from the Customer inventory this month |
dealer deposits: 0
DEPOSITS/CUSTOMER
ENTRIES: 2
i) Into Loomis Customer acct: 9645.000oz (300 kilobar)s
ii) Into Stonex 96,453 oz (3 kilobars)
total deposit: Customer acct 9741.35 oz
(3003 kilobars) of ,3003 tonnes
xxxxxxxxxxxxxxxxxx
comex withdrawal
ONE ENTRY
ONE ENTRY
i) Out of HSBC: 160.755
5 kilobars oz
total withdrawal; 160.755 oz
adjustments: 1//customer to dealer brinks
8005.597 oz (249 kilobars)
COMEX IS DRAINING GOLD
chaos inside the comex
THE FRONT MONTH OF JULY OI STANDS AT 11 CONTRACTS HAVING A LOSS OF 106 CONTRACTS. WE HAD A GAIN IN OZ STANDING OF 68 CONTRACTS FOR 6800 OZ OR 0.2115 TONNES, ANOTHER QUEUE JUMP AS CENTRAL BANKS CONTINUE TO TAKE PHYSICAL GOLD OUT OF THE COMEX!!
AUGUST LOST 18,835 CONTRACTS TO AN OI OF 173,687
SEPTEMBER GAINED 240 CONTRACT UP TO AN OI OF 2743
.
We had 8 contracts filed for today representing 800 oz
Today, 0 notice(s) were issued from J.P.Morgan dealer and 45 notices issued from their client or customer account. The total of all issuance by all participants equate to 8 contract(s) of which 0 notices were stopped (received) by j.P. Morgan dealer and 0 notice(s) was (were) stopped (received) by J.P.Morgan//customer account
To calculate the INITIAL total number of gold ounces standing for JULY. /2026. contract month, we take the total number of notices filed so far for the month (12,870) to which we add the difference between the open interest for the front month of JULY (11 CONTRACTS) minus the number of notices served upon today 8x 100 oz per contract) equals 1,287,300 OZ OR (40.0404 Tonnes of gold)
THUS: INITIAL total number of gold ounces standing for JULY. /2026. contract month, we take the total number of notices filed so far for the month (12,870) to which we add the difference between the open interest for the front month of JULY( 11) contracts minus the number of notices served upon today 8 x 100 oz per contract) equals 1,287,300 OZ OR (40.0404Tonnes of gold)
Yesterday’s standing: 39.828 tonnes//today: 40.0404tonnes// (queue jump = 0.2115tonnes)
new total of gold standing in JULY becomes 40.0404 TONNES//
TOTAL COMEX GOLD STANDING FOR JULY 40.0404TONNES TONNES WHICH IS NOW REALLY HUGE FOR THIS NON ACTIVE DELIVERY MONTH OF JULY. ALSO THIS MAKES NO SENSE THAT WE HAVE A MASSIVE DEMAND FROM A CENTRAL BANK AND WHILE THIS IS GOING ON THEY RAIDED HUGELY THESE PAST FEW WEEKS?
confirmed volume THURSDAY confirmed 228,936/ fair// many have left the arena
COMEX GOLD INVENTORIES/CLASSIFICATION
NEW PLEDGED GOLD:
241,794.285 oz NOW PLEDGED /HSBC 5.94 TONNES
204,937.290 OZ PLEDGED MANFRA 3.08 TONNES
83,657.582 PLEDGED JPMorgan no 1 1.690 tonnes
265,999.054, oz JPM No 2
1,152,376.639 oz pledged Brinks/
Manfra: 33,758.550 oz
Delaware: 193.721 oz
International Delaware:: 11,188.542 oz
total pledged gold: 1,825,758.183 oz 56.788 tonnes pledged gold lowers
total inventories in gold declining rapidly
total pledged gold: 1,825,758.183tonnes oz 56.788 tonnes
TOTAL OF ALL GOLD ELIGIBLE AND REGISTERED GOLD 27,017,403,730oz
TOTAL REGISTERED GOLD 14,756,941.186 tonnes (459.00onnes)
TOTAL OF ALL ELIGIBLE GOLD 12,224,218.270 oz//eligible gold leaving hand over fist
REGISTERED GOLD THAT CAN BE SERVED UPON 12,930,983oz ((REG GOLD- PLEDGED GOLD)=
402.207 Tonnes //
total inventories in gold declining rapidly
SILVER COMEX
JULY DELIVERY MONTH
JULY 24
| Silver | Ounces |
| Withdrawals from Dealers Inventory | NIL oz |
| Withdrawals from Customer Inventory | 1 entries i) into CNT: 30,170.710 oz total wuthdrawal 30,170,710 oz |
| Deposits to the Dealer Inventory | ENTRY:0 |
| Deposits to the Customer Inventory | ENTRY: 1 i) Into CNT 599,524.210oz total deposit: 599,524.210oz |
| No of oz served today (contracts) | 23 CONTRACT(S) ( 115,,000 OZ) |
| No of oz to be served (notices) | 6 Contracts (30,000 oz) OR .030 MILLION |
| Total monthly oz silver served (contracts) | 9162 contracts 45.810 MILLION oz |
| Total accumulative withdrawal of silver from the Dealers inventory this month | NIL oz |
| Total accumulative withdrawal of silver from the Customer inventory this month |
DEPOSITS INTO DEALER ACCOUNTS
ENTRY:0
DEPOSIT ENTRIES/CUSTOMER ACCOUNT
ENTRY: 1
i) Into CNT 599,524.210oz
total deposit: 599,524.210oz
xxxxxxxxxxxxxxxxxxxxxxxxx
withdrawals: customer side/eligible
1 entries
i) into CNT: 30,170.710 oz
total wuthdrawal 30,170,710 oz
adjustments :1
dealer ti customer Manfra: 103,790.510 oz
xxxxxxxxxxxxxx
TOTAL REGISTERED SILVER: 96.236 MILLION OZ//.TOTAL REG + ELIGIBLE. 330.856 Million oz
registered silver dropping in numbers
CALCULATIONS FOR THE NEW STANDING FOR SILVER FOR JULY
silver open interest data:
FRONT MONTH OF JULY /2026 OI: 29 OPEN INTEREST CONTRACTS FOR A LOSS OF 1292 CONTRACTS.
STANDING FOR SILVER TODAY IS REPRESENTED BY 44.500 MILLION OZ. YESTERDAY’S STANDING: 44.500MILLION OZ. THUS WE GAINED 268 CONTRACTS OR A STRONG QUEUE JUMP OF 1.340 MILLION OZ WHERE THESE GUYS WILL TRY AND STAND FOR DELIVERY ON THIS SIDE OF THE POND.
AUGUST SAW A LOSS OF 90CONTRACTS DOWN TO 1824…
SEPTEMBER SAW A LOSS OF 516 CONTRACTS UP TO AN OI OF 81,565 CONTRACTS
TOTAL NUMBER OF NOTICES FILED FOR TODAY: 23or 115,000oz
CONFIRMED volume THURSDAY; 40,178// extremely poor//
XXX
AND NOW JULY. DELIVERIES:
To calculate the number of silver ounces that will stand for delivery in JULY. we take the total number of notices filed for the month so far at 9162 X5,000 oz = 45.810 MILLION oz.
We now take the total number of oz standing today and subtract the total standing yesterday and we have a GAIN of 268 contracts for 1.340MILLION oz and this represents a huge queue jump
YESTERDAY: 44.500 MILLION OZ//STOOD FOR DELIVERY// TODAY 45.840 MILLION OZ// THUS A STRONG QUEUE JUMP OF 268 CONTRACTS OR 1.340 MILLION OZ
Thus the standings for silver for the JULY 2026 contract month: (9123 )Notices served so far) x 5000 oz + OI for the front month of JULY ( 29) minus number of notices served upon today (23x 5000 oz equals silver standing for the JULY..contract month equating to 45.840 MILLION OZ. ( a very strong delivery month)
We must also keep in mind that there is considerable silver standing in London coming from our longs
There are ONLY 96.236 million oz of registered silver
JPMorgan as a percentage of total silver: 137.898/330.856million: 41.70%
The record level of silver open interest is 234,787 contracts set on April 21./2017 with the price on that day at $18.42.
The previous record was 224,540 contracts with the price at that time of $20.44.
BOTH GLD AND SLV ARE MASSIVE FRAUD//
JULY 24/2026/WITH GOLD UP 21.50 /HUGE CHANGES IN GOLD AT THE GLD A DEPOSIT OF 1.43TONNES OF GOLD INTO THE GLD. : //:/INVENTORY RESTS AT 1009.30TONNES
JULY 23/2026/WITH GOLD DOWN 98.60 /HUGE CHANGES IN GOLD AT THE GLD A DEPOSIT OF 2.00 TONNES OF GOLD INTO THE GLD. : //:/INVENTORY RESTS AT 1007.87TONNES
JULY 22/2026/WITH GOLD UP $73.30 /HUGE CHANGES IN GOLD AT THE GLD A DEPOSIT OF 2.28 TONNES OF GOLD INTO THE GLD. : //:/INVENTORY RESTS AT 1005.87 TONNES
JULY 21/2026/WITH GOLD DOWN $1.40 /HUGE CHANGES IN GOLD AT THE GLD A DEPOSIT OF 2.572 TONNES OF GOLD OUT OF GLD. : //:/INVENTORY RESTS AT 1004.45 TONNES
JULY 20/2026/WITH GOLD UP $59.75 /HUGE CHANGES IN GOLD AT THE GLD A WITHDRAWAL OF 0.860 TONNES OF GOLD OUT OF GLD. : //:/INVENTORY RESTS AT 1003.59 TONNES
JULY 17/2026/WITH GOLD UP $26.55 /HUGE CHANGES IN GOLD AT THE GLD A WITHDRAWAL OF 2.572 TONNES OF GOLD OUT OF GLD. : //:/INVENTORY RESTS AT 1001.878 TONNES
JULY 16/2026/WITH GOLD DOWN $110.60 /NO CHANGES IN GOLD AT THE GLD : //:/INVENTORY RESTS AT 1004.45 TONNES
JULY 15/2026/WITH GOLD DOWN $15.05 /HUGE CHANGES IN GOLD AT THE GLD : A DEPOSIT OF 1.94 TONNES OF GOLD INTO THE GLD/ //:/INVENTORY RESTS AT 1004.45 TONNES
JULY 14/2026/WITH GOLD UP $63.45 /NO CHANGES IN GOLD AT THE GLD : / //:/INVENTORY RESTS AT 1002.510 TONNES
JULY 13/2026/WITH GOLD DOWN $105.20 /HUGE CHANGES IN GOLD AT THE GLD : A WITHDRAWAL 0F 3.108 TONNES OF GOLD OUT OF THE GLD/ //:/INVENTORY RESTS AT 1002.510 TONNES
JULY 10/2026/WITH GOLD DOWN $27.25 /HUGE CHANGES IN GOLD AT THE GLD : A DEPOSIT 0F 3.138TONNES OF GOLD INTO THE GLD/ //:/INVENTORY RESTS AT 1005.618 TONNES
JULY 9/2026/WITH GOLD UP $58.60 /SMALL CHANGES IN GOLD AT THE GLD : A WITHDRAWAL OF 0.28 TONNES OF GOLD FROM THE GLD/ //:/INVENTORY RESTS AT 1002.510 TONNES
JULY 8/2026/WITH GOLD DOWN $73.30 /NO CHANGES IN GOLD AT THE GLD //:/INVENTORY RESTS AT 1002.79 TONNES
JULY 7/2026/WITH GOLD DOWN $28.05 /HUGE CHANGES IN GOLD AT THE GLD:A DEPOSIT OF 1.42 TONNES OUT INTO THE GLD/ ./ //:/INVENTORY RESTS AT 1002.79 TONNES
JULY 6 /2026/WITH GOLD DOWN $19.55 /HUGE CHANGES IN GOLD AT THE GLD:A WITHDRAWAL OF 3.954 TONNES OUT OF THE GLD/ ./ //:/INVENTORY RESTS AT 1001.366 TONNES
JULY 3 /2026/WITH GOLD UP $62.95 /NO CHANGES IN GOLD AT THE GLD: ./ //:/INVENTORY RESTS AT 1005.077 TONNES
JULY 2 /2026/WITH GOLD UP $44,05 /NO CHANGES IN GOLD AT THE GLD: ./ //:/INVENTORY RESTS AT 1005.077 TONNES
JULY 1 /2026/WITH GOLD UP $42.95 /NO CHANGES IN GOLD AT THE GLD: ./ //:/INVENTORY RESTS AT 1005.077 TONNES
JUNE 30 /2026/WITH GOLD UP $2.85 /NO CHANGES IN GOLD AT THE GLD: ./ //:/INVENTORY RESTS AT 1005.077 TONNES
JUNE 29 /2026/WITH GOLD DOWN $58.30 /HUGE CHANGES IN GOLD AT THE GLD: A MASSIVE WITHDRAWAL OF 8.223 TONNES OF GOLD FROM THE GLD // ./ //:/INVENTORY RESTS AT 1005.077 TONNES
JUNE 26 /2026/WITH GOLD UP $49.10 /HUGE CHANGES IN GOLD AT THE GLD: A MASSIVE WITHDRAWAL OF 4.287 TONNES OF GOLD FROM THE GLD // ./ //:/INVENTORY RESTS AT 1013.350 TONNES
JUNE 25 /2026/WITH GOLD UP $42.70 /NO CHANGES IN GOLD AT THE GLD: // ./ //:/INVENTORY RESTS AT 1017.637 TONNES
JUNE 24 /2026/WITH GOLD DOWN $141.55 /HUGE CHANGES IN GOLD AT THE GLD: A WITHDRAWAL OF 4.563 TONNES OF GOLD OUT OF THE GLD/./ //// ./ //:/INVENTORY RESTS AT 1017.637 TONNES
JUNE 19 /2026/WITH GOLD UP $36.85 /HUGE CHANGES IN GOLD AT THE GLD: A DEPOSIT OF 7.421 TONNES OF GOLD INTO THE GLD/./ //// ./ //:/INVENTORY RESTS AT 1020.49 TONNES
JUNE 18 /2026/WITH GOLD DOWN $135.20 TODAY/HUGE CHANGES IN GOLD AT THE GLD: A DEPOSIT OF 0.856 TONNES OF GOLD INTO THE GLD/./ //// ./ //:/INVENTORY RESTS AT 1013.069 TONNES
JUNE 17 /2026/WITH GOLD UP $20.80 TODAY/HUGE CHANGES IN GOLD AT THE GLD: A WITHDRAWAL OF 1.427 TONNES OF GOLD FROM THE GLD/./ //// ./ //:/INVENTORY RESTS AT 1012.213 TONNES
JUNE 16 /2026/WITH GOLD UP $4.45 TODAY/NO CHANGES IN GOLD AT THE GLD: //// ./ //:/INVENTORY RESTS AT 1013.640 TONNES
JUNE 15 /2026/WITH GOLD UP $111.10 TODAY/NO CHANGES IN GOLD AT THE GLD: //// ./ //:/INVENTORY RESTS AT 1013.640 TONNES
JUNE 12 /2026/WITH GOLD UP $123.30 TODAY/NO CHANGES IN GOLD AT THE GLD: //// ./ //:/INVENTORY RESTS AT 1013.640 TONNES
JUNE 11 /2026/WITH GOLD DOWN $15.15 TODAY/HUGE CHANGES IN GOLD AT THE GLD: A WITHDRAWAL OF 2.855 TONNES OF GOLD FROM THE GLD//// ./ //:/INVENTORY RESTS AT 1013.640 TONNES
JUNE 10 /2026/WITH GOLD DOWN $153.05 TODAY/HUGE CHANGES IN GOLD AT THE GLD: A WITHDRAWAL OF 3.426 TONNES OF GOLD FROM THE GLD//// ./ //:/INVENTORY RESTS AT 1016.495 TONNES
GLD INVENTORY: 1009.30 TONNES, TONIGHTS TOTAL GOLD INVENTORY
SILVER
JULY 24 WITH SILVER UP $1.45: :NO CHANGES IN INVENTORY AT THE SLV : // :INVENTORY RESTS AT 484.413 MILLION OZ
JULY 23 WITH SILVER DOWN 2.18: :HUGE CHANGES IN INVENTORY AT THE SLV : A DEPOSIT OF 0.723MILLION OZ OUT OF THE SLV// :INVENTORY RESTS AT 484.413 MILLION OZ
JULY 22 WITH SILVER UP $1.45: :SMALL CHANGES IN INVENTORY AT THE SLV : A WITHDRAWAL OF 0.217 MILLION OZ OUT OF THE SLV// :INVENTORY RESTS AT 483.690 MILLION OZ
JULY 21 WITH SILVER UP $1.89: :HUGE CHANGES IN INVENTORY AT THE SLV : A WITHDRAWAL OF 0.217 MILLION OZ OUT OF THE SLV// :INVENTORY RESTS AT 483.961 MILLION OZ
JULY 20 WITH SILVER UP $0.97: :HUGE CHANGES IN INVENTORY AT THE SLV : A DEPOSIT OF 2.17 MILLION OZ INTO THE SLV// :INVENTORY RESTS AT 484.232 MILLION OZ
JULY 17 WITH SILVER UP $0.25: :HUGE CHANGES IN INVENTORY AT THE SLV : A DEPOSIT OF 1.175 MILLION OZ// :INVENTORY RESTS AT 482.062 MILLION OZ
JULY 16 WITH SILVER DOWN $1.48: :NO CHANGES IN INVENTORY AT THE SLV// :INVENTORY RESTS AT 480.887 MILLION OZ
JULY 15 WITH SILVER DOWN $1.52: :HUGE CHANGES IN INVENTORY AT THE SLV/ A DEPOSIT OF 3.30 MILLLION OZ OZ INTO THE SLV// :INVENTORY RESTS AT 480.887 MILLION OZ
JULY 14 WITH SILVER UP $1.18: :HUGE CHANGES IN INVENTORY AT THE SLV/ A WITHDRAWAL OF 543,000 OZ FROM THE SLV// :INVENTORY RESTS AT 477,587 MILLION OZ
JULY 13 WITH SILVER DOWN $2.07: :NO CHANGES IN INVENTORY AT THE SLV/ :INVENTORY RESTS AT 478.130 MILLION OZ
JULY 10 WITH SILVER DOWN $0.67: :SMALL CHANGES IN INVENTORY AT THE SLV A WITHDRAWAL OF 0.904 MILLION OZ INTO THE SLV/ :INVENTORY RESTS AT 478.130 MILLION OZ
JULY 9 WITH SILVER UP $2.64: :SMALL CHANGES IN INVENTORY AT THE SLV A WITHDRAWAL OF 0.497 MILLION OZ INTO THE SLV/ :INVENTORY RESTS AT 479.531 MILLION OZ
JULY 8 WITH SILVER DOWN $2.70: :HUGE CHANGES IN INVENTORY AT THE SLV A DEPOSIT OF 0.497 MILLION OZ INTO THE SLV/ :INVENTORY RESTS AT 479.531 MILLION OZ
JULY 7 WITH SILVER DOWN $1.36: :HUGE CHANGES IN INVENTORY AT THE SLV A WITHDRAWAL OF 1.266 MILLION OZ OUT OF THE SLV/ :INVENTORY RESTS AT 479.034 MILLION OZ
JULY 6 WITH SILVER DOWN $0.51: :HUGE CHANGES IN INVENTORY AT THE SLV A DEPOSIT OF 940,000 OZ INTO THE SLV/ :INVENTORY RESTS AT 480.300 MILLION OZ
JULY 3 WITH SILVER UP $1.81: :SMALL CHANGES IN INVENTORY AT THE SLV A DEPOSIT OF 940,000 OZ INTO THE SLV.// :INVENTORY RESTS AT 479.360 MILLION OZ
JULY 2 WITH SILVER UP $0.58: : NO CHANGES IN INVENTORY AT THE SLV// :INVENTORY RESTS AT 479.360 MILLION OZ
JULY 1 WITH SILVER UP $0.48: : SMALL CHANGES IN INVENTORY AT THE SLV A DEPOSIT OF 0.233 MILLION OZ OUT OF THE SLV/./ // :INVENTORY RESTS AT 479.360 MILLION OZ
JUNE 30 WITH SILVER UP $1.35: : HUGE CHANGES IN INVENTORY AT THE SLV A WITHDRAWAL OF 1.447 MILLION OZ OUT OF THE SLV/./ // :INVENTORY RESTS AT 479.127 MILLION OZ
JUNE 29 WITH SILVER DOWN $1.08: : HUGE CHANGES IN INVENTORY AT THJE SLV A WITHDRAWAL OF 1.402 MILLION OZ OUT OF THE SLV/./ // :INVENTORY RESTS AT 480.574 MILLION OZ
JUNE 26 WITH SILVER UP $0.86: : HUGE CHANGES IN INVENTORY AT THJE SLV A DEPOSIT OF 2.352 MILLION OZ INTO THE SLV/./ // :INVENTORY RESTS AT 481.976 MILLION OZ
JUNE 25 WITH SILVER UP $0.69: : SMALL CHANGES IN INVENTORY AT THJE SLV A WITHDRAWAL OF 769,000 OUT OF THE SLV/./ // :INVENTORY RESTS AT 479.624 MILLION OZ
JUNE 24 WITH SILVER DOWN $4.18: : SMALL CHANGES IN INVENTORY AT THJE SLV A DEPOSIT OF 93,000 MILLION OZ INTO THE SLV/./ // :INVENTORY RESTS AT 480.393 MILLION OZ
JUNE 19 WITH SILVER UP $1.11: : NO CHANGES IN INVENTORY AT THJE SLV/./ // :INVENTORY RESTS AT 480.302 MILLION OZ
JUNE 18 WITH SILVER DOWN $4.80: SMALL CHANGES IN SILVER INVENTORY AT THE SLV: HUGE CHANGES IN INVENTORY A WITHDRAWAL OF 1.086 MILLION OZ FROM THE SLV././ // :INVENTORY RESTS AT 480.302 MILLION OZ
JUNE 17 WITH SILVER UP $0.79: SMALL CHANGES IN SILVER INVENTORY AT THE SLV: NO CHANGE IN INVENTORY AT THE SLV /./ // :INVENTORY RESTS AT 481.388 MILLION OZ
JUNE 16 WITH SILVER DOWN $0.13: SMALL CHANGES IN SILVER INVENTORY AT THE SLV: A DEPOSIT OF 0.362 MILLION OZ INTO THE SLV /./ // :INVENTORY RESTS AT 481.388 MILLION OZ
JUNE 15 WITH SILVER UP $3.25: HUGE CHANGES IN SILVER INVENTORY AT THE SLV: A WITHDRAWAL OF 1.357 MILLION OZ OUT THE SLV /./ // :INVENTORY RESTS AT 481.026 MILLION OZ
JUNE 12 WITH SILVER UP $3.34: HUGE CHANGES IN SILVER INVENTORY AT THE SLV: A WITHDRAWAL OF 0.769 MILLION OZ OUT THE SLV /./ // :INVENTORY RESTS AT 482.383 MILLION OZ
JUNE 11 WITH SILVER DOWN $0.12: SMALL CHANGES IN SILVER INVENTORY AT THE SLV: A WITHDRAWAL OF 0.226 MILLION OZ OUT THE SLV /./ // :INVENTORY RESTS AT 483.152 MILLION OZ
JUNE 10 WITH SILVER DOWN $0.50: HUGE CHANGES IN SILVER INVENTORY AT THE SLV: A WITHDRAWAL OF 0.909 MILLION OZ OUT THE SLV /./ // :INVENTORY RESTS AT 483.378 MILLION OZ
CLOSING INVENTORY 484.413 MILLION OZ OF SILVER
GOLD COMMENTARIES:
1.PETER SCHIFF
2. MATHEW PIEPENBERG/EGON VON GREYERZ
ALASDAIR MACLEOD.
Gold and silver in wartime
Some analysts tell us that gold goes down in war. This is rubbish. Otherwise, why would countries in the past have suspended their gold standards at wartime?
There are some specious arguments being advanced for the lacklustre performance of gold and silver in recent weeks, and the argument above is just one of them. But what makes current financial markets interesting is that the entire investment establishment with very few exceptions are Keynesian in their outlook. We can define this in a simple phrase — there is an unfounded belief that governments can manage economic outcomes.
The problem is that by managing outcomes governments always make things worse. And just occasionally the consequence is a crisis. Drop the Keynesian la-la stuff, and we can see the approaching crisis clearly. There are a number of elements to it which give MacleodFinance easy copy, but the purpose of this report is to look at it with respect to precious metals.
This week, gold and silver showed signs of turning a corner after their major declines since end-January. This morning they are tickling a little better, but investors need to focus on the big picture.

America’s war against Iran is intensifying, with the prospect of further escalation this weekend. Already, oil prices are moving higher, with WTI challenging the $90 level. Furthermore, this crisis is spreading to the Red Sea, closing off the Saudi terminal at Yanbu which we are told delivers about 5,000,000bpd. The crisis appears to be accelerating, with oil price increases entering a second phase.
It is worth looking in some detail at a similar situation in the past, which brings us to the 1973—74 OPEC crisis. The relationship between gold and oil is shown below:

In August 1973, OPEC raised the reference price of a barrel of oil from $3.56 to $4.31, a 21% hike. The price of gold continued its decline before hitting a low point of $90 on 26th November. Meanwhile, the Fed was cutting its funds rate from 10.75% to 10%. Stocks rallied about 14% on those cuts before selling off into the year-end. Stocks briefly consolidated in early-1974 as the Fed continued easing, a policy reversed on the second OPEC oil price rise to $10.11 in late-January. Stocks then resumed a vicious bear market into Q4, triggered by the Fed’s funds rate being increased from 9% in February 1974 to 9.3% in March and then 10.5% in April.
Several points stand out, but the principal one is that in the initial stages of an oil price hike, risk-off safety is perceived to be cash dollars, not gold. But as it became obvious that Sheik Yamani leading OPEC was not satisfied by the first price increase and would impose another larger one gold began to rally as risk-off perceptions rapidly moved from cash dollars towwards gold. By the time Yamani imposed the second larger hike in late-January, gold had already risen 50% in only two months to the equivalent of $6000 today before going on to a near-doubling by 27th February.
The situation today appears similar to the OPEC experience. Markets are beginning to see that Trump has no exit from the war against Iran, a point reinforced by the Houthis closing the Red Sea to tankers loading at the Saudi port of Yanbu. This evolution away from regarding cash currency as risk free appears to be starting, with the gold price resisting further declines.
The 1973—74 precedent is clear. All financial markets are about to see a dramatic sea-change as the seriousness of the Gulf war and its inevitable consequences for the global economy, highly indebted governments, and the geopolitical consequences are rammed home. It is now easier to visualise crashing bonds, crashing equities, government debt traps springing, and gold doubling in just a few months.
It will be a very unpleasant wake-up call for the neo-Keynesians.
3. CHRIS POWELL AND HIS GATA DISPATCHES
4. ANDREW MAGUIRE/LIVE FROM THE VAULT; 281 AND 279
VAULT 281//MUST VIEW
Central Bank Wars: Fortress China Targets LBMA

by Kinesis Money
Thursday, Jul 16, 2026 – 11:03
In this week’s Live from the Vault, Andrew Maguire details how China’s launch of the Hong Kong SGE gold gateway marks a historic shift in global gold pricing, as Beijing moves to challenge London and New York’s long-held grip on the market.
With the PBOC systematically draining Western gold reserves and central banks accelerating their shift away from dollar holdings, the precious metals expert outlines why he sees a US Treasury gold revaluation as no longer a distant prospect.
279
282 ALASDAIR MACLEOD…
END
5. COMMODITY REPORT/
YOUR EARLY CURRENCY VALUES/GOLD AND SILVER PRICING/ASIAN AND EUROPEAN BOURSE MOVEMENTS/AND INTEREST RATE SETTINGS WEDNESDAY MORNING.7:30 AM
SHANGHAI CLOSED DOWN 62.58PTS OR 1.61%
HANG SENG CLOSED DOWN 247.58 PTS OR 0.98%
Nikkei CLOSED DOWN 1811.45PTS OR 2.73%
//Australia’s all ordinaries CLOSED DOWN 0.04%
//Chinese yuan (ONSHORE) CLOSED UP TO 6.7722
/ OFFSHORE CLOSED UP AT 6.7733 Oil UP TO 8977 dollars per barrel for WTI and BRENT UP TO 97.45 Stocks in Europe OPENED ALL GREEN
ONSHORE USA/ YUAN// WITH YUAN TRADING UP (6.7722) OFFSHORE YUAN TRADING UP TO 6.7732 ONSHORE YUAN TRADING ABOVE LEVEL OF OFF SHORE AND UP ON THE DOLLAR// / AND THUS STRONGER/OFF SHORE YUAN TRADING UP AGAINST US DOLLAR/ AND THUS STRONGER
XXXXXXXXXXXXXXXXXXXXXXXXXXXXXXXXXXXXX
ONSHORE YUAN: CLOSED UP AT 6.7722
OFFSHORE YUAN: UP TO 6.7733
1.HANG SANG CLOSED DOWN 247.58 PTS OR 0.98%
2. Nikkei closed DOWN 1811.45 PTS OR 2.73%
WEST TEXAS INTERMEDIATE OIL UP TO 89.77
BRENT; 97.45
3. Europe stocks SO FAR: ALL GREEN
USA dollar INDEX UP TO 101.24// EURO RISES TO 1.1379 UP 3 BASIS PTS
3b Japan 10 YR bond yield:RISES TO. +2.818 UP 8FULL BASIS PTS/ VERY TROUBLESOME//Japan buying 100% of bond issuance)/Japanese YEN vs USA CROSS NOW AT 163.793… JAPANESE YEN NOW FALLING AS WE HAVE NOW REACHED THE ENDING OF THE YEN CARRY TRADE AGAIN AND THE REPATRIATION OF YEN DENOMINATED BONDS TRADING IN THE USA/EUROPE. JAPAN 30 YR BOND YIELD: 3.978 UP 9 FULL BASIS PT
3c Nikkei now ABOVE 17,000
3d USA/Yen rate now well ABOVE the important 120 barrier this morning
3e Gold UP /JAPANESE Yen DOWN CHINESE ONSHORE YUAN: UP 6.7722) AND OFFSHORE: UP AT 6.7732
3f Japan is to buy INFINITE TRILLION YEN worth of BONDS. Japan’s GDP equals 5 trillion USA. CENTRAL BANK OF JAPAN WILL NO LONGER DO QE.
Japan to buy 100% of all new Japanese debt and NOW they will have OVER 50% of all Japanese debt. GOVERMENT ASKED JAPAN PENSION FUNDS AND INSURANCE FUNDS TO BUY MORE JAPANESE BONDS AND REPATRIATE ALL FOREIGN BONDS.
3g Oil UP for WTI and UP UP this morning
3h European bond buying continues to push yields HIGHER on all fronts in the EU German 10yr bund YIELD UP TO +3.1878/ Italian 10 Yr bond yield UP AT 4.0266 SPAIN 10 YR BOND YIELD DOWN TO 3.649%
3i Greek 10 year bond yield UP TO 3.909%
3j Gold at $4056.500//Silver at: 58.33 1 am est) SILVER NEXT RESISTANCE LEVEL AT $100.00
3k USA vs Russian rouble;// Russian rouble UP 0 AND 38 100 roubles/77.91
3m oil (WTI) into the 89 dollar handle for WTI and 97 handle for Brent/
3n Higher foreign deposits moving out of China// huge risk of outflows and a currency depreciation. This can spell financial disaster for the rest of the world/
JAPAN ON JAN 29.2016 CONTINUES NIRP. THIS MORNING RAISES AMOUNT OF BONDS THAT THEY WILL PURCHASE UP TO .5% ON THE 10 YR BOND///YEN TRADES TO 163.798 // 10 YEAR YIELD AFTER FIRST BREAKING .54% LAST YEAR NOW EXCEEDS THAT LEVEL TO 2.818% UP 8 BASIS PTS STILL ON CENTRAL BANK (JAPAN) INTERVENTION//YEN CARRY TRADE NOW UNWINDING//YEN BOND TRADING OVERSEAS TO BE REPATRIATED.//JAPAN 30 YR: 3.978 UP 10 PTS..: USA/SF this 0.81275as the Swiss Franc . Euro vs SF: 0.9301
USA 10 YR BOND YIELD: 4.685DOWN 2 BASIS PTS…
USA 30 YR BOND YIELD: 5.160 DOWN 1 BASIS PTS/
USA 2 YR BOND YIELD: 4.333 UP 1 BASIS PTS
USA DOLLAR VS TURKISH LIRA: 47.235UP 13 BASIS PTS/LIRA GETTING KILLED//IDIOTS FOR SELLING GOLD AND USA DOLLAR RESERVES.
10 YR UK BOND YIELD: 5.0563 DOWN 5 PTS
30 YR UK BOND YIELD: 5.7451 DOWN 4BASIS PTS
10 YR CANADA BOND YIELD: 3.629 DOWN 2 BASIS PTS
5 YR CANADA BOND YIELD: 3.251 UP 2 BASIS PTS.
Futures Rebound As Brent Dips Below $100
by Tyler Durden
Friday, Jul 24, 2026 – 07:37 AM
US equity futures are seeing a modest rebound after posting their biggest drop this month, as Brent crude dropped back under $100 a barrel, and bond yields and rate hike odds – which track the price of oil one to one – halted their ascent. As of 6:00am ET, S&P 500 futures rose 0.3%, with the index still on track for its first back-to-back weekly loss since the early stages of the Iran war. Tech stocks remained under pressure as South Korea’s memory and Japanese chip giants were pummeled. Treasury yields hovered just below their highest levels this year, while Brent fell more than 3% toward $97 a barrel.

In premarket trading, Tesla leads gains among Mag 7 stocks after the electric vehicle maker plunged about 15% on Thursday (Tesla +1.3%, Microsoft +1.1%, Alphabet +0.7%, Meta +0.7%, Amazon +0.5%, Apple +0.2%, Nvidia -0.4%)
- Amkor Technology (AMKR) rallies 11% after the company announced a $1.5 billion multi-year binding agreement with Nvidia to develop advanced semiconductor packaging and test technologies for next-generation AI and accelerated computing platforms.
- Intel (INTC) gains 4% (well below the kneejerk surge 12% higher) after the chipmaker’s third-quarter forecast was much stronger than analysts’ expectations. The results highlighted both the durability of AI-related demand, as well as the success of Intel’s turnaround.
- MaxLinear (MXL) slides 11% after the semiconductor device company reported second-quarter results that were only modestly ahead of expectations. While its third-quarter revenue forecast was stronger than expected, its view for adjusted gross margin was largely in line at the midpoint of the range.
- Oracle (ORCL) is up 2.6% after the software company said it had been awarded a 10-year IDIQ contract by the US Department of Defense under its Enterprise Software Initiative. The contract is valued at $3.31 billion for the first five years and up to $6.99 billion if options are exercised.
In other corporate news, SpaceX is said to have started to turn away satellite operators seeking dedicated rides to orbit aboard its staple Falcon 9 rocket beyond 2028, underscoring the massive bet Elon Musk is making on its unproven Starship. The pause on Paramount Skydance’s takeover of Warner Bros. Discovery has been extended two weeks to Aug. 17 by the federal judge in California
PayPal shares fell in extended trading following a Wall Street Journal report that Stripe is in talks to acquire startup OpenRouter
JPMorgan is said to have moved more than 30 quant researchers from mainland China to Singapore and Hong Kong.
Traders are moving cautiously after a week in which stocks and bonds were rattled by the intensifying war in Iran, soaring oil prices and fresh concerns over whether massive investments in AI will pay off. Investors are now bracing for a weekend that could bring further escalation in the Middle East, ahead of a stack of earnings from AI hyperscalers next week.
Michael Hewson, analyst at iForex, said he was surprised by how well markets are holding up despite the sharp increase in oil prices. As for earnings, “next week is a really big week and it could be make-or-break in terms of where markets go next,” he said. “There’s an awful lot more nervousness now about capex, particularly when you’re talking about AI and where’s the return on investment coming.”
To be sure, investors are contending with a growing wall of worry over AI spending, rising competition from Chinese frontier models, and increasingly crowded positioning. Amid soaring Chinese competition with open models which some accuse of being offered at dumping prices, the cost of tokens has tumbled and erased the entire recent “agentic” surge; not surprisingly, stock prices of hyperscalers have followed suit.

Die-hard tech bulls got some good news on Thursday when Intel delivered a revenue forecast that shattered Wall Street estimates as booming data center spending fuels a long-awaited turnaround. The company forecast sales of $15.8 billion to $16.8 billion in the third quarter, with even the low end of that range easily clearing the $15.1 billion average analyst estimate.
On Thursday, Brent surged above $100, Oil headed for a weekly surge with Brent trading above $100. President Trump said damage to ships and cargo would be paid for by Iranian funds frozen by the US after new strikes by Houthi rebels. Trump also threatened to step up strikes on Iran.
“Were it not for the resurgence of the conflict in the Middle East, the picture would have looked encouraging,” wrote ING economist Bert Colijn. “As uncertainty returns, renewed (though mild) stagflationary pressures are likely to weigh on the euro-zone economy over summer.”
In tariff-related news, the US will collect duties of between 10% and 12.5% on imports from most major trading partners, its biggest move yet to reconstruct Trump’s tariff wall – this time under Section 301 of the Trade Act of 1974 – that was pierced by the Supreme Court, which nullified Section 122 duties that expire today.
Elsewhere, volatility dispersion has performed well since the end of March given a crush in implied correlation. The S&P 500’s top 50 basket has been one expression of the trade which tactical and systematic players entered prior to earnings reports for the first quarter. However, extremely low implied-correlation levels have some investors concerned about a reversal. Hence, there has been some unwinding of positions and, indeed, contrarians entering tactical “reverse dispersion” trades — buying index volatility, and selling single-stock volatility.

Sebastian Raedler, head of European strategy at Bank of America, cautions the global equity picture is “not bullish,” and investors aren’t being compensated for risk. “Margin expectations at an all-time high, you’ve expected five-year forward earnings growth at an all-time high, you’ve got market cap-to-GDP globally at an all-time high and you’ve got risk premia at a 20-year low — what the market is pricing is a scenario where everything goes right and there are no risks,” Raedler said in a Bloomberg TV interview.
A quick note on earnings: EPS growth in the US and Europe is looking better than expected at this early stage of the reporting season, according to JPMorgan strategists. With about a quarter of companies having reported, JPM’s Mislav Matejka says earnings growth is at +23% y/y in the US, and +22% y/y in Europe. That implies a positive surprise factor of 13% and 2%, respectively. Looking at actual beats and misses, of the 129 S&P 500 companies to have reported thus far, 85% have beaten analysts’ forecasts, while 11% have missed. 71% of companies have positively surprised on sales, while 14% have missed. Around 170 index constituents are due to release earnings next week which will be the busiest of earnings season.
In Europe, the Stoxx 600 climbed 0.5%, led by gains in software stocks after SAP SE reported better-than-expected sales for cloud products; SAP was the region’s most significant outperformer on its latest results, while Finland’s Valmet surged after announcing it is mulling a demerger. Here are the biggest movers Friday:
- SAP shares rise as much as 6.8%, bouncing back from a more than 30% drop since the start of the year, after the software company reported 2Q cloud backlog growth that beat estimates
- Valmet surges as much as 29%, the most on record, after the Finnish process technology firm announced it is evaluating a potential separation of its two core businesses into two standalone publicly listed companies
- Acerinox shares rise as much as 10%, hitting their highest level since 2008, after the stainless steel firm reported second-quarter earnings that comfortably beat expectations and outlined guidance for the third quarter
- Metso shares rise as much as 6.7% after the industrial machinery maker reported better order intake from its Minerals arm than expected, with Jefferies flagging the figure was much stronger than what has been reported by its peers
- Atoss Software shares rise as much as 7.5%, with Jefferies analysts saying the workforce management software company delivered earnings ahead of expectations in the first half and raised its Ebit margin goal for 2027
- Arcadis shares rose as much as 12% to €44.08 on Friday after the Dutch engineering firm said it is reviewing a second unsolicited proposal from WSP Global for all outstanding shares at a price of €51.50 per share in cash and WSP stock
- Volkswagen shares fall as much as 3.2% after the German carmaker cut its revenue forecast for the full year and after posting what Morgan Stanley described as a tough quarter
- Carrefour shares fall as much as 7.8%, the most since June 2025, after the French supermarket operator reported recurring operating income for the first half-year that missed the average analyst estimate
- Mapfre shares declined as much as 6.1%, most since March, after the Spanish insurer reported net income for the first half-year that missed the average analyst estimate. The insurer has also announced an acquisition in the US
- Neste falls as much as 11% after the Finnish energy company reported disappointing second-quarter earnings. Analysts say adjusted Ebitda was 2% below consensus, but the performance for its Renewable Products division was a bright spot
- Ipsen shares fall as much as 4.3% after the French biopharma company said its experimental treatment for a rare infant liver disease failed to meet the primary endpoint in a late-stage trial
- Sanofi shares drop as much as 3% after the French pharmaceutical company ended clinical development of amlitelimab, an experimental drug for atopic dermatitis
Sentiment got a boost after UK consumer confidence climbed six points to minus 17, the largest increase since November 2023, according to GfK’s indicator. Sentiment is now back to levels last seen in January. Meanwhile, bond traders, economists and even BOE staff are warning of QT’s impact, as pressure mounts on gilts from the return of hostilities in the Middle East and the arrival of a new prime minister with big spending promises. Still, escalating tensions in the Middle East threaten to scupper the optimism once again.
Asian tech shares fall sharply following Thursday’s Mag7 selloff amid growing doubts on popular AI trade’s durability. Kospi plunged about 5%, led by another crash in SK Hynix, and Nikkei falls almost 3%. The MSCI Asia Pacific Index fell as much as 2.5%, paring its gain for the week to 0.9%.

Elsewhere, Hang Seng, Shanghai Composite and Taiex indexes all tumbled. Samsung and SK Hynix dropped almost 8% each, among the biggest drags on the gauge along with TSMC and Kioxia. A look at the past 10 days of SK Hynix trading in Korea shows just how broken “price discovery” has become:
- 7/12: -2.31%
- 7/13: -16.95%
- 7/14: +6.18%
- 7/15: +4.17%
- 7/16: -9.50%
- 7/20: +0.60%
- 7/21: +1.68%
- 7/22: -2.24%
- 7/23: +6.39%
- 7/24: -8.12%
The losses tracked declines in the Magnificent Seven overnight on worries over the durability of the AI trade. “A second wave of geopolitical tension and tariffs landing back on the table just when markets had convinced themselves the worst was over is reviving inflation and growth concerns simultaneously, while the AI, chip and technology trade has lost much of the momentum that previously helped hold the region together,” said Hebe Chen, a senior market analyst for Vantage Global Prime.
In FX, the dollar is tightly rangebound against most majors. The yen hovered around 163.80/USD.
In rates, treasury 10-year yield adds a basis point to 4.71% as sovereign bonds remain under pressure. Australian 3-year yield jumps more than 10 bps. JGB futures decline following Japan inflation uptick. European bonds across the region staged a rebound after days of losses. The average yield on the Bloomberg Global Treasury Index — which tracks investment-grade government bonds — surged to 3.68%, surpassing a peak from three years ago to reach the highest since the global financial crisis in 2008. Treasury 10-year yields rose a basis point to 4.70%, while bonds fell in Japan, Australia and New Zealand.
Asian stocks fell, with the Kospi index sliding more than 4%, and benchmarks in Japan and Taiwan also dropping more than 2%. The Magnificent Seven technology behemoths suffered their biggest one-day drop since the tariff tantrum in April 2025 on Thursday. Intel shares rose in US post-market trading after its revenue forecast shattered estimates, indicating that booming data center spending is helping fuel a long-awaited turnaround.
In commodities, WTI crude futures hover around $91.50 while Brent contracts remain above $100 a barrel. Gold eases to near $4,030 an ounce.
Market Snapshot

Top Overnight News
- Trump imposes forced labor tariffs, drawing protests from trading partners. EU’s Kallas questions US rationale for tariffs on bloc, seeks clarification. Brazil says US tariffs related to forced labor are ‘arbitrary’ and ‘unjustified’: RTRS
- Stocks Get Some Relief as Brent Slips Below $100: BBG
- Trump Is Losing Patience Over an Iran War With No Clear End in Sight: WSJ
- Trump vows to punish Iran and Houthis for attacks in Red Sea: AP
- Iran flew IRGC commanders, missile gear to Yemen’s Houthis: RTRS
- The Houthis Have Opened a New Front in the U.S.‑Iran War: WSJ
- UK says armed forces ready to defend country after Iran warns over US bombers: RTRS
- Iran strikes on CIA facilities prompt questions about possible Russian role: RTRS
- US to Use Iran’s Frozen Funds to Pay for Ship Damage, Trump Says: BBG
- SpaceX Is Turning Away Falcon Customers in Major Bet on Starship: BBG
- Inside China’s All-Out Push to Catch Up With American AI Chips: WSJ
- Canada to mark Gordie Howe bridge opening without US after trade war deepens: RTRS
- Overseas Buyers In Hot Pursuit of US Crude as Wars Escalate: BBG
- Samsung, SK Hynix to Ink Large Chip Supply Deals With US Firms: BBG
- ECB Officials Avoid Clear Hints on Possible Hike for Now: BBG
- VW Sees Another Sales Drop as China Decline Complicates Turnaround: BBG
A more detailed look at global markets courtesy of Newsquawk
APAC stocks followed suit to the losses on Wall Street where the Nasdaq was heavily pressured following Alphabet and Tesla earnings, while sentiment was also weighed on by rising oil prices and yields as geopolitical escalation continues. ASX 200 retreated with underperformance in tech and miners leading the downside, while the improvement in Australian flash PMIs did little to spur a rebound. Nikkei 225 fell beneath the 65,000 level with tech stocks heavily pressured and over-represented in the list of worst performers, while inflation data did little to shift the dial and printed in line with expectations. KOSPI suffered the brunt of the tech selling with sidecars activated on the KOSPI and KOSDAQ. Hang Seng and Shanghai Comp conformed to the broad downbeat mood with notable pressure in miners and tech stocks.
Top Asian News
- Japanese Inflation Rate YoY (Jun) Y/Y 1.7% vs. Exp. 1.7% (Prev. 1.5%).
- Japanese Core Inflation Rate YoY (Jun) Y/Y 1.6% vs. Exp. 1.6% (Prev. 1.4%).
- Japanese Inflation Rate Ex-Food and Energy YoY (Jun) Y/Y 1.7% vs. Exp. 2% (Prev. 1.8%).
- Japanese Inflation Rate MoM (Jun) M/M 0.3% vs. Exp. 0.2% (Prev. 0.4%).
- Japanese S&P Global Composite PMI Flash (Jul) 53.10 vs. Exp. 52.8 (Prev. 52.8).
- Japanese S&P Global Manufacturing PMI Flash (Jul) 54.7 vs. Exp. 54.5 (Prev. 54.8).
- Japanese S&P Global Services PMI Flash (Jul) 51.9 vs. Exp. 53 (Prev. 52.2).
- Australian S&P Global Composite PMI Flash (Jul) 52.6 vs. Exp. 50.1 (Prev. 50.4).
- Australian S&P Global Manufacturing PMI Flash (Jul) 51.7 vs. Exp. 51.1 (Prev. 51.5).
- Australian S&P Global Services PMI Flash (Jul) 53.0 vs. Exp. 50.2 (Prev. 50.5).
European bourses start the final trading day entirely in the green, with outperformance in the IBEX 35 and DAX 40, given positive earnings from SAP and the rebound in European banks. Supporting the equity space is the lower energy prices, possibly as investors take profits heading into the weekend. On the data front, flash PMIs surprised to the upside across the EZ and the UK. The commentary broadly highlighted the cooling of cost pressures, however, while noting that inflationary pressures remain elevated. Another caveat is that the survey period was between the 9th-22nd July, which doesn’t include the recent return of Brent above USD 100/bbl. Sectors point to a mixed, but slightly positive, picture. Tech tops the sector pile, with Financial Services and Banks rounding out the top 3 sectors. Telecoms is the sector laggard, followed by Energy and Autos. Two of Germany’s biggest companies reported earnings before the market open. Starting with SAP, its Q2 revenue and cloud revenue beat estimates, with its cloud business increasing 24% Y/Y. This is driving the majority of gains, printing gains in excess of 6%. In terms of guidance, its FY adj. operating profit shifted EUR 100mln lower to 11.8-12.2bln (prev. guided 11.9-12.3bln). On the other hand, Volkswagen reported its Q2 metrics. Revenue beat estimates; however, the Co. cut its FY revenue guidance to between -3% and 0% (prev. guided 0-3%). Co. execs highlighted the increased competitiveness in China, with vehicle sales falling 31.6% in the region. The CFO also stated that current planned initiatives are not sufficient to compete in China. As such, shares have fallen by over 1.5%.
Top European News
- German Chancellor Merz said Nina Warken will be appointed chief of staff and Linnemann will be appointed health minister. Merz added that further cabinet changes in the future, but will take more time.
FX
- G10s are entirely firmer (excl. NOK) against the Buck, which has been offered throughout the morning, likely due to some profit-taking after gains in energy on Thursday. Generally a risk-on environment with high-beta Antipodeans outperforming.
- DXY weakened throughout the morning as crude succumbed to profit-taking after Brent Sept’26 gained c. 7%, and DXY saw gains of 0.3% on Thursday. Another factor potentially is the fresh US tariffs being lower than feared, also exempting oil, gas, fertiliser and foodstuffs. DXY fell from its 101.46 session high to a trough of 101.25. The 21DMA is below at 101.05 before support at 101. The US calendar is light, with the first read for July’s PMI scheduled, where EZ figures released this morning were stronger than expected.
- EZ PMIs saw modest EUR strength following the French figure, which was extended by a couple of pips after Germany; Bunds were unreactive. EUR was lacklustre overnight in the wake of the ECB, though attempted a bounce towards 1.14 following the strong PMI read, foiled just above that level.
- Much stronger than expected UK Retail Sales had little follow-through to Sterling amid World Cup/weather related demand, with the purchase of Fans and Football shirts influencing the figure. Pantheon Macro still looks for consumer spending to ease to 0.1% quarter-to-quarter across H2, with a reversal in the aforementioned components likely to weigh. Elsewhere, UK composite PMI surprisingly rose to expansionary by a decent margin, though the strong caveats of the data not encompassing the recent geopolitical escalation saw the handful of pips strength in EUR/GBP pared. GBP/USD lifted from the 1.33 mark to a session high of around 1.3350.
- Barclays’ month-end rebalancing model indicates a weak USD buying signal against most majors by month-end. The model suggests moderate bearish signals for CAD and GBP.
- US Treasury said no major US trading partner manipulated its currency to gain an unfair trade advantage in 2025, while 10 leading trading partners remain on a list for enhanced monitoring of their foreign exchange practice. The Treasury added that yen weakness has persisted despite narrowing of US-Japan interest rate differentials and excess volatility in the yen is unwanted.
Fixed Income
- A contained start for most benchmarks as Brent held at just over USD 100/bbl throughout APAC trade and into the European morning. Thereafter, as energy pulled back from highs taking Brent down to a USD 98/bbl handle, yields followed suit and by extension fixed lifted.
- At most, USTs to a 108-09 peak, notably shy of Thursday’s 108-15 best and while firmer by c. five ticks today, it remains near enough a full point lower WTD. Ahead, we have Flash PMIs which will help to inform the debate around the Fed tightening this year or not, though as we have seemingly seen with the EZ figures it is perhaps too early for the energy resurgence to be fully visible in the flash data.
- Bunds lifted to a 124.46 peak around the cash equity open, spurred by the mentioned energy move and as the German Cabinet reshuffle was relatively limited and as expected. Since, a kneejerk lower occurred on the French flash figures before more pronounced pressure after the German and EZ metrics. Albeit, energy continues to trim and and the c. 10 tick pullback has unwound, with Bunds back at highs and firmer by over 20 ticks.
- Moving to Gilts, the morning’s stronger than expected Retail Sales were overshadowed by the mentioned pullback in energy and as such Gilts opened on the front foot by 17 ticks and have since extended another 30 to a 86.36 peak, where it remains.
- On the morning’s data, the EZ PMIs were firmer across the board aside from France’s Manufacturing. Commentary was encouraging and pointed to a rebound after a “largely stagnant” Q2 (reminder, Flash Prelim. EZ GDP next week) and cost pressures “cooling sharply”. However, the survey period only runs until the 22nd of July, and as such misses out on around USD 6/bbl of additional Brent upside if we assume that day’s USD 95.63/bbl close was captured, but equally the open that session was USD 91.50/bbl which may more closely align with the responses being provided, and would equate to around USD 10/bbl of upside being missed out on since.
- A similar point can be made for the UK Flash PMIs and also the DMP. As such, the Final reads will draw more scrutiny than usual to see how respondents’ views changed once the energy extension to over USD 100/bbl was accounted for.
- Australia sells AUD 900mln 3.25% April 2029 bonds b/c 3.56, avg yield 4.6752%.
Commodities
- Geopolitics have shown no signs of abating, although a fresh escalation outside of the daily strikes is yet to occur. To briefly recap the main geopolitical points, the US and Iran continued to exchange strikes, with CENTCOM conducting a 13th night of attacks on Iranian military targets and Iran targeting neighbours. US President Trump said Iran wants to reach an agreement but is not yet ready. Further, Iran reportedly rejected a US ceasefire proposal presented by Iraq’s PM, while Tehran also refused to amend a separate 10-day ceasefire plan linked to discussions over the Strait of Hormuz. Crude has been pulling back from yesterday’s extremes despite a lack of a clear driver during the European morning. Against the backdrop of a lack of fresh escalation today, traders could be booking profits in oil heading into another uncertain weekend. Further adding to the downside could be trade war woes after the Trump administration imposed new tariffs of 10-12.5% on imports from 60 countries over claims that they had failed to prevent forced labour, with China condemning unilateral tariffs this morning.
- WTI and Brent futures are softer by over 3% after surging some 6-7% intraday yesterday, with the former toward the lower end of a USD 88.75-90.66/bbl range and the latter back under USD 100/bbl in a USD 96.51-101.19/bbl range. Dutch TTF is choppy but ultimately flat at the time of writing around the EUR 62/MWh mark after finding support at EUR 61/MWh.
- Precious metals see some reprieve from the pullback in the energy space. Spot gold rebounded from a USD 4,022/oz intraday low and currently resides towards session highs of USD 4,053/oz. Spot silver sees more momentum after hitting a low near USD 57/oz yesterday before rebounding to a current USD 58.42/oz peak today.
- Base metals are flat/mixed and fail to benefit from the pullback in energy amid pressure from tariff woes. 3M LME copper resides in a narrow USD 13,574.88- 13,683.63/t range.
- South Korea extended fuel tax cuts through to September 30th, with the government maintaining 15% gasoline and 25% diesel tax reductions.
Trade/Tariffs
- US Trade Representative Greer announced 10 to 12.5% new tariffs related to forced labour, while exempting oil, gas, fertiliser and food stuffs from the labour tariffs. Countries that implemented forced labour prohibition get 10% tariff rate, those that have not get 12.5%.
- China’s Foreign Ministry said it opposes all unilateral tariffs, saying its position on China-US economic and trade issues are clear.
- EU’s Kallas said the new US tariffs on EU goods are not really grounded, and questioned the forced labour rationale, while she stated the US tariff move is a negative surprise after the EU kept its side of the trade deal. Furthermore, she said the EU was not expecting to be included in new US tariffs and that officials will seek clarifications from Washington on the new tariffs.
- Mexico’s President Sheinbaum said Mexico and the US are making progress regarding the USMCA review, while Mexico’s Economy Minister Ebrard said that they see no change in the effective tariff that Mexico pays, following the US announcing new tariffs.
- Brazil’s government rejected the US 12.5% tariffs on Brazilian goods related to forced labour, calling the tariffs completely arbitrary and unjustified, while it will start procedures to use its reciprocity law and will take the matter before the WTO’s dispute settlement mechanism.
- Japan’s Trade Minister Akazawa said the US’s latest move on tariffs is regrettable, and confirmed that the US will not go beyond the 2025 tariff deal.
- Canadian PM Carney said everything is on the table if Canada and US fail to reach a deal on the latest US tariff threats, adds Canada has not signed a partial USMCA deal as talks remain focused on critical sectors
Central Banks
- BoJ is expected to keep rates unchanged at its meeting next week, while it is likely to maintain its inflation overshoot warning and is seen signalling easing inflation risks at the July meeting, according to sources. Additionally, the Nikkei reported something similar, stating that the majority of members currently favour a steady approach, citing a desire to monitor the impact of June’s hike amid geopolitical tensions and inflation risks and that many suggest that there is no rush to raise rates.
- ECB’s Nagel said the ECB is in a good position to closely monitor further developments.
- ECB’s Simkus said uncertainty has been evident over the past six weeks and oil over USD 100/bbl will have repercussions. The inflationary environment has increased with risks to the upside. Simkus added that there is no value in rushing but sees a higher probability of a hike than a hold.
- ECB’s Kocher said the recent developments in oil markets are concerning and said a 50bps hike was not discussed and hopefully something ECB will not have to consider.
- ECB’s Sleijpen told Econostream that the ECB could hike in September even without second-round effects as long as the broader inflation outlook warrants it. He said second-round effects are important, but will assess the entire inflation outlook. There is no evidence of second-round effects yet. Markets understand the reaction function and decision triggers. From a cyclical perspective, the economy has held up reasonably well. Neutral rate estimates are not a decisive factor in setting policy. Conditions are again more consistent with the June baseline.
- ECB Consumer Expectations Survey (Jul): Median consumer perceptions of inflation over the past 12 months decreased significantly, as did the next 12 months.
- BoE Monthly Decision Maker Panel data: Expectations for 1yr-ahead CPI inflation fell to 3.4% in the three months to July (prev. 3.7% in the three months to June); 3yr-ahead CPI inflation expectations was 2.8% in the three months to July (prev. 2.9%).
Geopolitics: Middle East
- US President Trump posted “Please let this statement serve to represent, until further notice, that from this point forth, any and all damages done to Ships, Cargo, or anything related thereto, will be paid for by Iranian Money”. However, N12’s Ravid commented that it is unclear if Trump has the legal ability to do such a thing, adding the president can freeze Iranian funds in the US, but using them to pay private shipping companies would likely require a court decision or new legislation.
- US President Trump is said to be losing patience over an Iran war with no clear end in sight, while he has grown skeptical of diplomacy and is in ‘revenge mode’ against Tehran, according to a senior administration official cited by WSJ.
- US CENTCOM said forces started another night of strikes against Iranian military targets, adding this is the 13th consecutive night of strikes aimed to hold Iran accountable and diminish threats from the IRGC to commercial shipping.
- Explosions were reported in Iran’s Taft, Shirkuh, Isfahan, Jask and Konarek. There were also reports of explosions in Khorramabad, Bandaa Abbas, Qeshm, Larak Island and Hengam.
- Iran’s army said it has launched another wave of drone attacks against US military facilities in Kuwait. Earlier, there were reports of explosions at US bases in Jordan and the Sheikh Isa airbase in Bahrain.
- Iran reportedly rejected the US ceasefire deal presented by Iraqi leader, according to the NYT.
- Iranian diplomat said Iran has not closed the door to diplomacy, and messages are still being exchanged through intermediaries, ISNA reported.
- Iran’s Foreign Minister Aragchi said seizing another nation’s assets to pay for unrelated future claims is an incendiary precedent. He also said that “perhaps before the war a compromise could have been made. But now, for reasons that I do not want to open up too much, compromise has become difficult.”
- US President Trump reportedly told Lebanese President Aoun he would seek to curb Israeli escalation in Lebanon and support expanded US assistance to the Lebanese army, Saudi newspaper reported. In other reports in IRIB, US President Trump reportedly gave Lebanese President Aoun an ultimatum during the latter’s visit to Washington, stating either coordinate and destroy Hezbollah or return to Netanyahu’s nightmare.
Geopolitics: Russia-Ukraine
- Ukrainian President Zelensky told Trump ally Laura Loomer that he may visit Washington next week and plans to meet President Trump again.
- US Senate eyes a vote on Russia sanctions package next week, according to Axios.
Geopolitics: Other
- China’s Coast Guard said it imposed control measures on several Philippine vessels operating “illegally” in the waters around Scarborough Shoal.
US Event Calendar
- 9:45 am: Jul P S&P Global US Manufacturing PMI, est. 54.4, prior 53.9
- 9:45 am: Jul P S&P Global US Services PMI, est. 51.5, prior 51.2
- 9:45 am: Jul P S&P Global US Composite PMI, est. 52.15, prior 51.9
- 10:00 am: Jun New Home Sales, est. 607k, prior 580k
DB’s Jim Reid concludes the overnight wrap
I’m coming to terms with the fact that my wife and kids are this morning leaving me for 5 days to go camping on a mums and kids only trip. How will I cope with the pain and sadness of being alone for such a long time? The answer: Golf tonight, tomorrow morning, tomorrow afternoon, Sunday morning, Sunday afternoon, and maybe Monday and Tuesday evening after work. If I can walk on Wednesday, I’ll be impressed. My wife genuinely thinks I won’t be able to cope on my own and has left a meal plan and dossier of instructions. I’m not quite sure how she thought I coped in the 36 years I lived on the planet before we met.
As we approach my lost weekend, the two big themes in financial markets all year, namely Iran and AI, have combined in a negative direction to leave a challenging 24 hours for markets and potentially threatening time spent on the beach for many in the days ahead, and remaining weeks of Summer. The sell-off certainly wasn’t helped by Brent crude surging back above $100/bbl as peace in Iran looks distant for now.
The latest is that Trump said to Axios that he was “considering a massive attack” and was “close to making a decision”. And earlier on, he posted that if the Houthis continued to make strikes, then “major military punishment will be inflicted upon Iran” as well. In turn, Tehran warned that it would retaliate, including against energy facilities in the region, if Trump followed through on his threat to target Iranian bridges and power plants. The escalatory rhetoric raised fears of a more prolonged stagflationary shock and drove some big losses across global markets, with yields hitting multi-year highs on both sides of the Atlantic. Indeed, the 10yr bund yield (+3.1bps) hit a post-2011 high yesterday of 3.20%, whilst the 30yr real yield in the US (+2.8bps) hit a post-2008 high of 2.96%.
The most obvious impact of the escalation could be seen in energy prices, with Brent crude (+7.04%) posting another big daily increase to close at $100.69/bbl, its highest level since May. This morning we’re just a couple of tenths of a percent lower and still above $100. That stands in stark contrast to where we began the month, with Brent at around $72/bbl after the interim deal was signed and there were initial indications that the Strait of Hormuz was beginning to reopen. The jump in the 6-month Brent future (+1.80% to $83.21/bbl) was more modest, but this is now up by more than $10/bbl since early July as investors price in a more lasting shock. In the one piece of slightly better energy news, European natural gas futures (-1.02%) dipped slightly from Wednesday’s high, closing at €61.90/MWh.
That jump for oil prices and fears of stagflation put serious pressure on global equities, with the S&P 500 (-1.21%) and Nasdaq (-2.15%) both sliding yesterday. Matters weren’t helped by Tesla (-14.52%) and Alphabet (-7.13%), which both saw large declines after their earnings release the previous day. So that drove a big loss for the Mag 7 (-4.78%) index, which posted its biggest daily decline since the week of the Liberation Day turmoil in 2025. The two big problems for the big tech companies are that capex is no longer being funded out of free cash flow alone (see page 15 of the WOW! pack here for more) and that cheaper open-source AI is seriously threatening the business model of the US AI-stack. See Adrian Cox’s piece here at the DBRI on the open-source versus proprietary model battle and my CoTD here from yesterday comparing it to the Betamax versus VHS battle 40-plus years ago.
The sell-off wasn’t just in the US, as Europe was hit hard by the oil shock, with the STOXX 600 down -1.18% as the CAC 40 (-1.64%), DAX (-1.56%), and FTSE MIB (-2.80%) all posted large declines.
The risk-off mood was also visible in other asset classes, with US HY credit spreads (+9bps) seeing their biggest widening since March, while the dollar index (+0.32%) had its best day in a month.
The ongoing surge in oil prices also meant that inflation expectations crept up yesterday. In fact, the 1yr Euro inflation swap rose a further +10.9bps to 2.75%, whilst the 1yr US inflation swap (+1.9bps) was up to 2.07%. So that led to ongoing speculation that the Fed might still be about to hike as soon as next week, with the futures-implied probability of that up to 34% by the close. And it was a similar story in Europe, where 47bps of further hikes are now priced from the ECB by the December meeting up +1.1bps on the day.
Staying with the ECB, in their latest policy decision yesterday they kept their deposit rate at 2.25% as widely expected, while implying that further hikes were still likely. Both the short decision statement and Lagarde’s press conference noted that the latest outlook was broadly unchanged relative to the ECB’s June baseline scenario which had been predicated on market pricing of three hikes this cycle (so two more after the June hike). Lagarde also said yesterday that the ECB’s reaction function was “very well understood” by markets, showing no desire to push back on market pricing. Our European economists now see a September hike to 2.50% as a near done deal. Risks are clearly skewed towards a further hike thereafter, but this would require persistently elevated energy prices and/or evidence of second-round effects. See their full reaction here.
With inflation fears mounting, sovereign bond yields hit fresh multi-year highs yesterday on both sides of the Atlantic. In the US, the 10yr Treasury yield (+3.8bps) rose to 4.69%, its highest since January 2025, whilst the 2yr yield (+4.9bps) rose to 4.34%. The gains were even clearer for real yields, where the 10yr real yield (+5.7bps) closed at 2.42%, its highest since October 2023, whilst the 30yr real yield (+2.8bps) was up to 2.96%, which is its highest level since autumn 2008 at the height of the GFC. Meanwhile in Europe, there were also several records, with the 10yr bund yield (+3.1bps) at a post-2011 high of 3.20%, whilst the 10yr OAT yield (+4.7bps) hit a post-2009 high of 4.01%.
In trade news, overnight the Trump administration finalized the details of the new Section 301 tariffs covering some 60 of the US’ trading partners. Largely in line with what was signaled when the investigations into alleged forced labour practices in supply chains concluded last month, most of the largest trading partners including the EU, UK, Canada and Mexico will face a tariff of 10%, while others including Japan, South Korea and Australia will face a 12.5% levy. As a reminder, these duties arrive as today sees the expiry of the temporary 10% Section 122 tariffs, which themselves were announced after the Supreme Court in February struck down tariffs introduced under the International Economic Emergency Powers Act.
In Asia the negative mood continues but US equity futures are more stable. The KOSPI (-5.62%) is again leading declines and is poised to wipe out gains made earlier this week as major chipmakers follow weakness seen among their US counterparts. Japan’s Nikkei (-2.87%) is also sharply lower, extending its losing streak into a third consecutive week. In China, the CSI 300 (-1.17%) remains on course to break a four-week run of weekly losses despite today’s decline. Hong Kong’s Hang Seng (-1.27%) is also trading lower but is still positioned to record a fourth straight week of gains. The S&P/ASX 200 (-0.93%) is also lower. S&P 500 futures are down -0.08% with the Nasdaq equivalent -0.34% lower. The tech cycle mood improved a bit after a stellar earnings report from Intel which forecast that revenue in Q3 will be $15.8-16.8bn, well above the $15.1bn average estimate. Intel’s shares rose by +4.5% in after-hours trading.
Data released earlier this morning showed that Japan’s inflation remained broadly in line with expectations in June. Core CPI rose 1.6% year-on-year, matching forecasts, while the closely watched “core-core” CPI measure eased to 1.7% from 1.8% in May, remaining below the Bank of Japan’s inflation objective and a touch below expectations. Headline CPI accelerated as expected to 1.7% year-on-year from 1.5% previously, marking its highest reading so far this year.
In Australia, private-sector activity expanded at a stronger pace in July, with the S&P Global Flash Composite PMI increasing to 52.6 from 50.4 in June, recording a second consecutive month of growth and its strongest level since the start of the year. The services PMI improved to 53.0 from 50.5, while the manufacturing PMI edged up to 51.7 from 51.5, indicating continued expansion across both sectors.
Finally, there wasn’t much data yesterday, but the US weekly initial jobless claims fell to just 187k (vs. 210k expected) in the week ending July 18, which is their lowest level since 1969. So that reassured investors about the state of the labour market moving into the summer, and kept up the hawkish pressure on Fed pricing.
To the day ahead now we’ll get the July flash PMIs from around the world, US June new home sales, July Kansas City Fed services activity, UK June retail sales, Germany August GfK consumer confidence, Canada June industrial product price index, raw materials price index. Central bank events include the ECB’s June consumer expectations survey and the BoE’s DMP survey, whilst the ECB’s Lane will also speak. Earnings include American Express, NextEra energy, Verizon Communications, HCA Healthcare, and SLB.
1b European Opening report
Brent Sept’26 -2.6%, benefitting US equity futures, INTC +4% after strong Q2 report – Newsquawk US Market Open

Friday, Jul 24, 2026 – 06:18 AM
- US and Iran continued to exchange strikes, with CENTCOM conducting a 13th night of attacks on Iranian military targets; US President Trump said Iran wants to reach an agreement but is not yet ready.
- Iran reportedly rejected a US ceasefire proposal presented by Iraq’s PM, while Tehran also refused to amend a separate 10-day ceasefire plan linked to discussions over the Strait of Hormuz.
- The Trump administration imposed new tariffs of 10-12.5% on imports from 60 countries over claims that they had failed to prevent forced labour.
- US equity futures are entirely in the green, supported by the upbeat beat mood in Europe while lower oil prices are also supporting indices (Brent -3.5%).
- DXY rangebound; Antipodeans outperform amid the risk-on tone, while EUR helped by positive flash PMIs.
- Fixed income benchmarks helped by the lower crude prices.
- Looking ahead, highlights include US Flash PMIs (Jul), Canadian PPI (Jun). Comments from ECB’s Lane. Scope Ratings update on Norway.
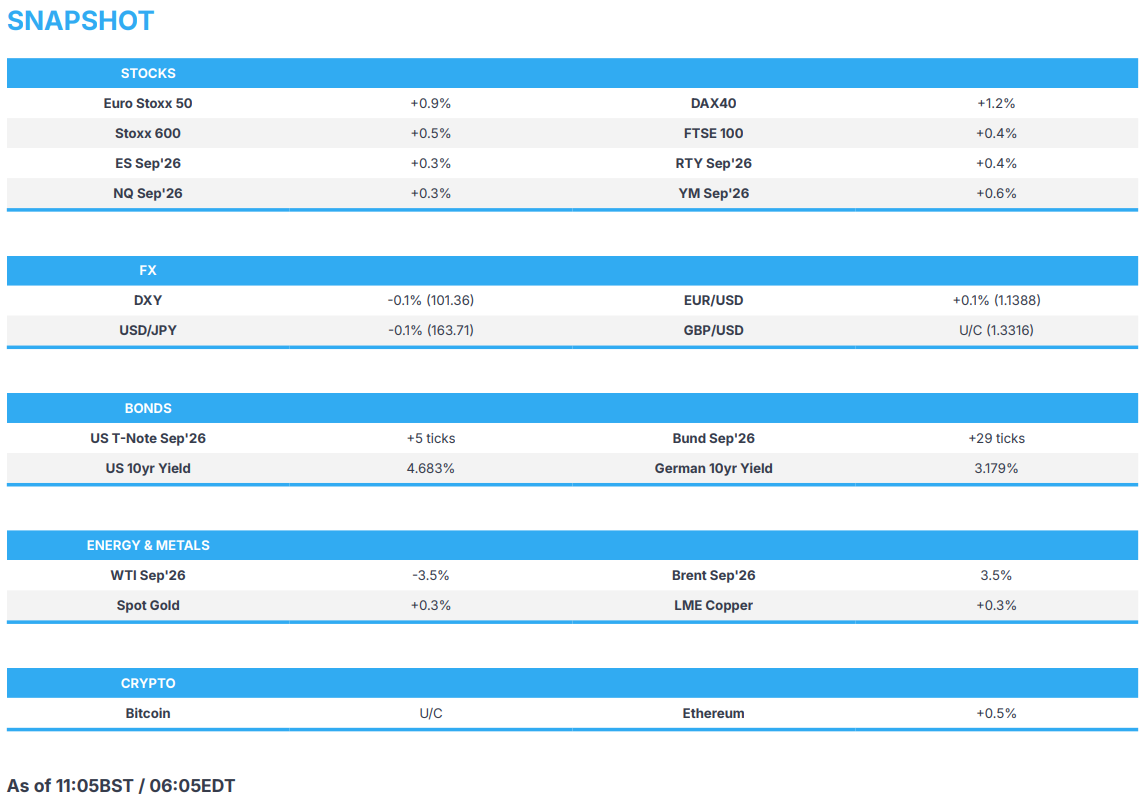
Newsquawk in 3 steps:
1. Subscribe to the free premarket movers reports
2. Listen to this report in the market open podcast (available on Apple and Spotify)
3. Trial Newsquawk’s premium real-time audio news squawk box for 7 days
EUROPEAN TRADE
EQUITIES
- European bourses start the final trading day entirely in the green, with outperformance in the IBEX 35 and DAX 40, given positive earnings from SAP and the rebound in European banks. Supporting the equity space is the lower energy prices, possibly as investors take profits heading into the weekend. On the data front, flash PMIs surprised to the upside across the EZ and the UK. The commentary broadly highlighted the cooling of cost pressures, however, while noting that inflationary pressures remain elevated. Another caveat is that the survey period was between the 9th-22nd July, which doesn’t include the recent return of Brent above USD 100/bbl.
- Sectors point to a mixed, but slightly positive, picture. Tech tops the sector pile, with Financial Services and Banks rounding out the top 3 sectors. Telecoms is the sector laggard, followed by Energy and Autos.
- Two of Germany’s biggest companies reported earnings before the market open. Starting with SAP, its Q2 revenue and cloud revenue beat estimates, with its cloud business increasing 24% Y/Y. This is driving the majority of gains, printing gains in excess of 6%. In terms of guidance, its FY adj. operating profit shifted EUR 100mln lower to 11.8-12.2bln (prev. guided 11.9-12.3bln). On the other hand, Volkswagen reported its Q2 metrics. Revenue beat estimates; however, the Co. cut its FY revenue guidance to between -3% and 0% (prev. guided 0-3%). Co. execs highlighted the increased competitiveness in China, with vehicle sales falling 31.6% in the region. The CFO also stated that current planned initiatives are not sufficient to compete in China. As such, shares have fallen by over 1.5%.
- US equity futures initially started on a softer footing but have reversed the majority of the losses. Intel surprised to the upside after-hours, after it topped Q2 expectations and issued stronger guidance underpinned by AI-driven demand for server processors.
- Click for the sessions European pre-market equity newsflow
- Click for the additional news
FX
- G10s are entirely firmer (excl. NOK) against the Buck, which has been offered throughout the morning, likely due to some profit-taking after gains in energy on Thursday. Generally a risk-on environment with high-beta Antipodeans outperforming.
- DXY weakened throughout the morning as crude succumbed to profit-taking after Brent Sept’26 gained c. 7%, and DXY saw gains of 0.3% on Thursday. Another factor potentially is the fresh US tariffs being lower than feared, also exempting oil, gas, fertiliser and foodstuffs. DXY fell from its 101.46 session high to a trough of 101.25. The 21DMA is below at 101.05 before support at 101. The US calendar is light, with the first read for July’s PMI scheduled, where EZ figures released this morning were stronger than expected.
- EZ PMIs saw modest EUR strength following the French figure, which was extended by a couple of pips after Germany; Bunds were unreactive. EUR was lacklustre overnight in the wake of the ECB, though attempted a bounce towards 1.14 following the strong PMI read, foiled just above that level.
- Much stronger than expected UK Retail Sales had little follow-through to Sterling amid World Cup/weather related demand, with the purchase of Fans and Football shirts influencing the figure. Pantheon Macro still looks for consumer spending to ease to 0.1% quarter-to-quarter across H2, with a reversal in the aforementioned components likely to weigh. Elsewhere, UK composite PMI surprisingly rose to expansionary by a decent margin, though the strong caveats of the data not encompassing the recent geopolitical escalation saw the handful of pips strength in EUR/GBP pared. GBP/USD lifted from the 1.33 mark to a session high of around 1.3350.
- Barclays’ month-end rebalancing model indicates a weak USD buying signal against most majors by month-end. The model suggests moderate bearish signals for CAD and GBP.
- US Treasury said no major US trading partner manipulated its currency to gain an unfair trade advantage in 2025, while 10 leading trading partners remain on a list for enhanced monitoring of their foreign exchange practice. The Treasury added that yen weakness has persisted despite narrowing of US-Japan interest rate differentials and excess volatility in the yen is unwanted.
FIXED INCOME
- A contained start for most benchmarks as Brent held at just over USD 100/bbl throughout APAC trade and into the European morning. Thereafter, as energy pulled back from highs taking Brent down to a USD 98/bbl handle, yields followed suit and by extension fixed lifted.
- At most, USTs to a 108-09 peak, notably shy of Thursday’s 108-15 best and while firmer by c. five ticks today, it remains near enough a full point lower WTD. Ahead, we have Flash PMIs which will help to inform the debate around the Fed tightening this year or not, though as we have seemingly seen with the EZ figures it is perhaps too early for the energy resurgence to be fully visible in the flash data.
- Bunds lifted to a 124.46 peak around the cash equity open, spurred by the mentioned energy move and as the German Cabinet reshuffle was relatively limited and as expected. Since, a kneejerk lower occurred on the French flash figures before more pronounced pressure after the German and EZ metrics. Albeit, energy continues to trim and and the c. 10 tick pullback has unwound, with Bunds back at highs and firmer by over 20 ticks.
- Moving to Gilts, the morning’s stronger than expected Retail Sales were overshadowed by the mentioned pullback in energy and as such Gilts opened on the front foot by 17 ticks and have since extended another 30 to a 86.36 peak, where it remains.
- On the morning’s data, the EZ PMIs were firmer across the board aside from France’s Manufacturing. Commentary was encouraging and pointed to a rebound after a “largely stagnant” Q2 (reminder, Flash Prelim. EZ GDP next week) and cost pressures “cooling sharply”. However, the survey period only runs until the 22nd of July, and as such misses out on around USD 6/bbl of additional Brent upside if we assume that day’s USD 95.63/bbl close was captured, but equally the open that session was USD 91.50/bbl which may more closely align with the responses being provided, and would equate to around USD 10/bbl of upside being missed out on since.
- A similar point can be made for the UK Flash PMIs and also the DMP. As such, the Final reads will draw more scrutiny than usual to see how respondents’ views changed once the energy extension to over USD 100/bbl was accounted for.
- Australia sells AUD 900mln 3.25% April 2029 bonds b/c 3.56, avg yield 4.6752%.
COMMODITIES
- Geopolitics have shown no signs of abating, although a fresh escalation outside of the daily strikes is yet to occur. To briefly recap the main geopolitical points, the US and Iran continued to exchange strikes, with CENTCOM conducting a 13th night of attacks on Iranian military targets and Iran targeting neighbours. US President Trump said Iran wants to reach an agreement but is not yet ready. Further, Iran reportedly rejected a US ceasefire proposal presented by Iraq’s PM, while Tehran also refused to amend a separate 10-day ceasefire plan linked to discussions over the Strait of Hormuz. Crude has been pulling back from yesterday’s extremes despite a lack of a clear driver during the European morning. Against the backdrop of a lack of fresh escalation today, traders could be booking profits in oil heading into another uncertain weekend. Further adding to the downside could be trade war woes after the Trump administration imposed new tariffs of 10-12.5% on imports from 60 countries over claims that they had failed to prevent forced labour, with China condemning unilateral tariffs this morning.
- WTI and Brent futures are softer by over 3% after surging some 6-7% intraday yesterday, with the former toward the lower end of a USD 88.75-90.66/bbl range and the latter back under USD 100/bbl in a USD 96.51-101.19/bbl range. Dutch TTF is choppy but ultimately flat at the time of writing around the EUR 62/MWh mark after finding support at EUR 61/MWh.
- Precious metals see some reprieve from the pullback in the energy space. Spot gold rebounded from a USD 4,022/oz intraday low and currently resides towards session highs of USD 4,053/oz. Spot silver sees more momentum after hitting a low near USD 57/oz yesterday before rebounding to a current USD 58.42/oz peak today.
- Base metals are flat/mixed and fail to benefit from the pullback in energy amid pressure from tariff woes. 3M LME copper resides in a narrow USD 13,574.88- 13,683.63/t range.
- South Korea extended fuel tax cuts through to September 30th, with the government maintaining 15% gasoline and 25% diesel tax reductions.
TRADE/TARIFFS
- US Trade Representative Greer announced 10 to 12.5% new tariffs related to forced labour, while exempting oil, gas, fertiliser and food stuffs from the labour tariffs. Countries that implemented forced labour prohibition get 10% tariff rate, those that have not get 12.5%.
- China’s Foreign Ministry said it opposes all unilateral tariffs, saying its position on China-US economic and trade issues are clear.
- EU’s Kallas said the new US tariffs on EU goods are not really grounded, and questioned the forced labour rationale, while she stated the US tariff move is a negative surprise after the EU kept its side of the trade deal. Furthermore, she said the EU was not expecting to be included in new US tariffs and that officials will seek clarifications from Washington on the new tariffs.
- Mexico’s President Sheinbaum said Mexico and the US are making progress regarding the USMCA review, while Mexico’s Economy Minister Ebrard said that they see no change in the effective tariff that Mexico pays, following the US announcing new tariffs.
- Brazil’s government rejected the US 12.5% tariffs on Brazilian goods related to forced labour, calling the tariffs completely arbitrary and unjustified, while it will start procedures to use its reciprocity law and will take the matter before the WTO’s dispute settlement mechanism.
- Japan’s Trade Minister Akazawa said the US’s latest move on tariffs is regrettable, and confirmed that the US will not go beyond the 2025 tariff deal.
- Canadian PM Carney said everything is on the table if Canada and US fail to reach a deal on the latest US tariff threats, adds Canada has not signed a partial USMCA deal as talks remain focused on critical sectors
NOTABLE EUROPEAN HEADLINES
- German Chancellor Merz said Nina Warken will be appointed chief of staff and Linnemann will be appointed health minister. Merz added that further cabinet changes in the future, but will take more time.
NOTABLE EUROPEAN DATA RECAP
- EU S&P Global Composite PMI Flash (Jul) 51.9 vs. Exp. 50.3 (Prev. 50.0).
- EU S&P Global Manufacturing PMI Flash (Jul) 52.0 vs. Exp. 51.3 (Prev. 51.4).
- EU S&P Global Services PMI Flash (Jul) 51.6 vs. Exp. 49.8 (Prev. 49.4).
- German S&P Global Composite PMI Flash (Jul) 51.2 vs. Exp. 49.8 (Prev. 49.5).
- German S&P Global Manufacturing PMI Flash (Jul) 52.2 vs. Exp. 50.1 (Prev. 50.3).
- German S&P Global Services PMI Flash (Jul) 49.6 vs. Exp. 48.8 (Prev. 48.6).
- German GfK Consumer Confidence (Aug) -29.6 vs. Exp. -28.5 (Prev. -29.2).
- French S&P Global Composite PMI Flash (Jul) 49.6 vs. Exp. 48.4 (Prev. 47.2).
- French S&P Global Manufacturing PMI Flash (Jul) 50.0 vs. Exp. 51 (Prev. 51.2).
- French S&P Global Services PMI Flash (Jul) 49.8 vs. Exp. 47.2 (Prev. 46.8).
- UK S&P Global Composite PMI Flash (Jul) 52.1 vs. Exp. 49.7 (Prev. 49.3).
- UK S&P Global Manufacturing PMI Flash (Jul) 52.8 vs. Exp. 52.1 (Prev. 52.5).
- UK S&P Global Services PMI Flash (Jul) 51.8 vs. Exp. 49.4 (Prev. 48.8).
- UK Retail Sales MoM (Jun) M/M 1.0% vs. Exp. 0.2% (Prev. 1.2%).
- UK Retail Sales ex Fuel MoM (Jun) M/M 1.1% vs. Exp. -0.4% (Prev. 1.2%).
- UK Retail Sales YoY (Jun) Y/Y 4.2% (Prev. 3.2%).
- UK Retail Sales ex Fuel YoY (Jun) Y/Y 5.4% vs. Exp. 3.2% (Prev. 4.6%).
- UK GfK Consumer Confidence (Jul) -17 vs. Exp. -21 (Prev. -23).
CENTRAL BANKS
- BoJ is expected to keep rates unchanged at its meeting next week, while it is likely to maintain its inflation overshoot warning and is seen signalling easing inflation risks at the July meeting, according to sources. Additionally, the Nikkei reported something similar, stating that the majority of members currently favour a steady approach, citing a desire to monitor the impact of June’s hike amid geopolitical tensions and inflation risks and that many suggest that there is no rush to raise rates.
- ECB’s Nagel said the ECB is in a good position to closely monitor further developments.
- ECB’s Simkus said uncertainty has been evident over the past six weeks and oil over USD 100/bbl will have repercussions. The inflationary environment has increased with risks to the upside. Simkus added that there is no value in rushing but sees a higher probability of a hike than a hold.
- ECB’s Kocher said the recent developments in oil markets are concerning and said a 50bps hike was not discussed and hopefully something ECB will not have to consider.
- ECB’s Sleijpen told Econostream that the ECB could hike in September even without second-round effects as long as the broader inflation outlook warrants it. He said second-round effects are important, but will assess the entire inflation outlook. There is no evidence of second-round effects yet. Markets understand the reaction function and decision triggers. From a cyclical perspective, the economy has held up reasonably well. Neutral rate estimates are not a decisive factor in setting policy. Conditions are again more consistent with the June baseline.
- ECB Consumer Expectations Survey (Jul): Median consumer perceptions of inflation over the past 12 months decreased significantly, as did the next 12 months.
- BoE Monthly Decision Maker Panel data: Expectations for 1yr-ahead CPI inflation fell to 3.4% in the three months to July (prev. 3.7% in the three months to June); 3yr-ahead CPI inflation expectations was 2.8% in the three months to July (prev. 2.9%).
GEOPOLITICS
MIDDLE EAST
- US President Trump posted “Please let this statement serve to represent, until further notice, that from this point forth, any and all damages done to Ships, Cargo, or anything related thereto, will be paid for by Iranian Money”. However, N12’s Ravid commented that it is unclear if Trump has the legal ability to do such a thing, adding the president can freeze Iranian funds in the US, but using them to pay private shipping companies would likely require a court decision or new legislation.
- US President Trump is said to be losing patience over an Iran war with no clear end in sight, while he has grown skeptical of diplomacy and is in ‘revenge mode’ against Tehran, according to a senior administration official cited by WSJ.
- US CENTCOM said forces started another night of strikes against Iranian military targets, adding this is the 13th consecutive night of strikes aimed to hold Iran accountable and diminish threats from the IRGC to commercial shipping.
- Explosions were reported in Iran’s Taft, Shirkuh, Isfahan, Jask and Konarek. There were also reports of explosions in Khorramabad, Bandaa Abbas, Qeshm, Larak Island and Hengam.
- Iran’s army said it has launched another wave of drone attacks against US military facilities in Kuwait. Earlier, there were reports of explosions at US bases in Jordan and the Sheikh Isa airbase in Bahrain.
- Iran reportedly rejected the US ceasefire deal presented by Iraqi leader, according to the NYT.
- Iranian diplomat said Iran has not closed the door to diplomacy, and messages are still being exchanged through intermediaries, ISNA reported.
- Iran’s Foreign Minister Aragchi said seizing another nation’s assets to pay for unrelated future claims is an incendiary precedent. He also said that “perhaps before the war a compromise could have been made. But now, for reasons that I do not want to open up too much, compromise has become difficult.”
- US President Trump reportedly told Lebanese President Aoun he would seek to curb Israeli escalation in Lebanon and support expanded US assistance to the Lebanese army, Saudi newspaper reported. In other reports in IRIB, US President Trump reportedly gave Lebanese President Aoun an ultimatum during the latter’s visit to Washington, stating either coordinate and destroy Hezbollah or return to Netanyahu’s nightmare.
RUSSIA-UKRAINE
- Ukrainian President Zelensky told Trump ally Laura Loomer that he may visit Washington next week and plans to meet President Trump again.
- US Senate eyes a vote on Russia sanctions package next week, according to Axios.
OTHER
- China’s Coast Guard said it imposed control measures on several Philippine vessels operating “illegally” in the waters around Scarborough Shoal.
CRYPTO
- Bitcoin trades in a USD 64.69k-65.76k range as the crypto consolidates from 2 days of selling.
APAC TRADE
- APAC stocks followed suit to the losses on Wall Street where the Nasdaq was heavily pressured following Alphabet and Tesla earnings, while sentiment was also weighed on by rising oil prices and yields as geopolitical escalation continues.
- ASX 200 retreated with underperformance in tech and miners leading the downside, while the improvement in Australian flash PMIs did little to spur a rebound.
- Nikkei 225 fell beneath the 65,000 level with tech stocks heavily pressured and over-represented in the list of worst performers, while inflation data did little to shift the dial and printed in line with expectations.
- KOSPI suffered the brunt of the tech selling with sidecars activated on the KOSPI and KOSDAQ.
- Hang Seng and Shanghai Comp conformed to the broad downbeat mood with notable pressure in miners and tech stocks.
NOTABLE APAC DATA RECAP
- Japanese Inflation Rate YoY (Jun) Y/Y 1.7% vs. Exp. 1.7% (Prev. 1.5%).
- Japanese Core Inflation Rate YoY (Jun) Y/Y 1.6% vs. Exp. 1.6% (Prev. 1.4%).
- Japanese Inflation Rate Ex-Food and Energy YoY (Jun) Y/Y 1.7% vs. Exp. 2% (Prev. 1.8%).
- Japanese Inflation Rate MoM (Jun) M/M 0.3% vs. Exp. 0.2% (Prev. 0.4%).
- Japanese S&P Global Composite PMI Flash (Jul) 53.10 vs. Exp. 52.8 (Prev. 52.8).
- Japanese S&P Global Manufacturing PMI Flash (Jul) 54.7 vs. Exp. 54.5 (Prev. 54.8).
- Japanese S&P Global Services PMI Flash (Jul) 51.9 vs. Exp. 53 (Prev. 52.2).
- Australian S&P Global Composite PMI Flash (Jul) 52.6 vs. Exp. 50.1 (Prev. 50.4).
- Australian S&P Global Manufacturing PMI Flash (Jul) 51.7 vs. Exp. 51.1 (Prev. 51.5).
- Australian S&P Global Services PMI Flash (Jul) 53.0 vs. Exp. 50.2 (Prev. 50.5).
1 c) Asian opening report
NORTH AND SOUTH KOREA AND JAPAN
SOUTH KOREA
JAPAN
3 CHINA/
Three Levers China Is Pulling To Weather Gulf Energy Shock; How Long Can Beijing Hold Out?
Thursday, Jul 23, 2026 – 05:20 PM
The new troubling development is that maritime chokepoint chaos spread overnight from the Strait of Hormuz to the Bab el-Mandeb Strait, where Iran-backed Houthis targeted two Saudi Arabian tankers. The attacks expose yet another maritime chokepoint and risk further physical market tightening, forcing traders to price a larger war-risk premium into Brent crude futures and pushing the benchmark above $100 a barrel Thursday morning.
Oil headed to Asia generally does not flow through both chokepoints. Persian Gulf exports pass through Hormuz and sail east, while Saudi crude loaded at Yanbu enters the Red Sea and passes south through Bab el-Mandeb.

Asia takes most of Hormuz crude, with China alone absorbing nearly two-fifths. On Saudi Arabia’s Red Sea route through Bab el-Mandeb, China recently accounted for more than half of exports.
With both chokepoints disrupted, we want to check back in with China to understand what levers Beijing is pulling to absorb the energy shock – this builds on our three previous notes:
- China’s Oil Imports Plummet To Eight-Year Low
- Visualizing China’s Role In Stabilizing Oil Markets
- China’s Refiners Slash Runs To Lowest Since 2017, As Asia Refiners Slow Purchases Of Mid-East Oil
On Wednesday, Goldman commodities strategist Hongcen Wei outlined three factors that have so far allowed Beijing to contain the economic fallout from the Gulf energy shock:
- drawing down fuel inventories,
- switching to coal and renewables,
- and concentrating production cuts in oil- and gas-intensive industries.
China’s real GDP growth slowed to an annualized 3.6% in the second quarter from 5.3% in the first, while total energy demand still rose .4% from a year earlier in April and May. Destocking of coal, oil and NatGas added 5.4 percentage points to energy-demand growth.

Fuel substitution also softened the impact. Lower oil and gas use subtracted 1.7 percentage points, while increased consumption of coal and renewables added 2.2 points. Gasoline demand sank 23%, but EV charging jumped 60%, allowing transportation activity to migrate toward electricity.

The remaining damage was concentrated in industries heavily dependent on oil and NatGas, while industries with greater flexibility shifted toward electricity and alternative fuels.
Wei provided the full rundown on how China is absorbing the energy shock:
Major Fall in Net Imports, but Total Energy Demand Growth Still Positive. Ordinarily the largest importer of energy products shipped through the Strait of Hormuz, China has drastically reduced its net imports of fossil fuels, effectively acting as a shock absorber for global energy prices through reduced demand. Net imports of crude oil cratered in China and the rest of Asia beginning in March, but recovered in the rest of Asia to 2025 levels by June while continuing to fall in China through the first half of July (Exhibit 3).
China’s net imports of oil/natural gas/coal fell 24%/7%/24% YoY in April and May reflecting YoY price jumps of 59%/49%/38% (Exhibit 4). These reductions in fossil fuel net imports were the largest source of negative total energy demand growth, representing -3.7pp/-0.3pp/-1.2pp of China’s total YoY energy demand growth of +0.4% (Exhibit 5).
Exhibit 3: China Crude Oil Net Imports Continue to Fall While the Rest of Asia Recovers to 2025 Levels

Chinese total energy consumption in April and May increased by an average of 0.4%, or 52 petajoules, year-over-year. To roughly estimate the impact of the supply shock on energy consumption, we estimate counterfactual consumption growth as the average +3.1% annual total energy demand growth rate from 2014-2023.[2] Applying this rate to China’s average total monthly consumption in April and May 2025 would imply 375 PJ counterfactual YoY energy demand growth. This would suggest roughly 323 PJ of demand destruction for April and May, or 2.7pp reduction in the potential YoY growth rate. China’s Q2 real GDP growth fell to 3.6% after 5.3% Q1 growth quarterly annualized, slightly exceeding our China team’s nudged-down June forecast of 3.5% Q2 growth but missing market expectations. Lower GDP growth reflected mostly slower government spending, but also higher energy prices and unfavorable weather conditions.
Below, we highlight three factors that helped mitigate the total demand shock.
#1 Effective Destocking of Coal, Oil and Natural Gas Filled in for Fall in Fossil Fuel Imports and Production
Importing less of its energy needs from abroad, China has turned to its domestic inventories–rather than domestic production growth–to supplement the supply of fossil fuels.
Total domestic fossil fuel production actually fell slightly YoY in April and May, with lower coal production comprising a 0.5 percentage point reduction in total energy supply growth (Exhibit 5). Domestic crude oil production was unchanged compared to April and May of last year, likely constrained by high extraction costs in China’s aging brownfields.
The bulk of the rise in total energy consumption has been driven by the effective destocking of fossil fuels.
- Thermal coal inventory levels increased by 1.6%/3.7% during April/May 2026, significantly lower than the 4.7%/5.8% MoM increase of April/May 2025. Though China’s coal inventory level rose this April and May, we consider the reduction in MoM additions compared to last year’s flows–in other words, how much less China added to its coal inventory this April/May compared to April/May 2025–as effective destocking. Defined this way, coal stock use contributed 3.0 percentage points to total YoY demand growth (Exhibit 5).
- We estimate that oil destocking also accelerated, contributing 2.2pp to total YoY demand growth (Exhibit 5). Moreover, changes in China’s visible crude oil stocks also appear directionally consistent with our implied destocking estimates of around 1mb/d in May and June, suggesting a shift from restocking in Q2 2025 to greater inventory use this year (Exhibit 6).
- Effective natural gas destocking accounted for 0.2pp of total YoY energy demand growth (Exhibit 5).

#2 Fuel Substitution to Coal and Renewables Has Limited the Demand Destruction
To avoid wider demand destruction caused by lower fossil fuel imports and production, China has increased its reliance on coal and renewables in its wider energy mix. Lower oil/natural gas use in China’s overall energy demand contributed -1.6/-0.1 percentage points to its total YoY energy demand growth in April and May, while greater reliance on coal/renewables contributed +1.4/+0.8pp (Exhibit 7).

As an example of this fuel switching in practice, we observe China substituting driving with gasoline for driving with electricity. Gasoline consumption fell 23%/23%/21% YoY in April/May/June, but EV charging growth rose to 62%/60%/57% YoY. Despite much lower gasoline consumption, traffic congestion remained relatively stable, falling only 1.2% YoY in April before growing by 0.2% and 2.1% YoY in May and June (Exhibit 8). These findings are consistent with our prior reporting on China’s uptick in domestic EV sales since the start of the Iran war (despite seasonally-adjusted total passenger car sales remaining flat) and may reflect substitution both in car purchases (more EVs bought) and especially in choosing which kind of energy to drive on.[3]

#3 Energy-Related Reductions in Output Are Concentrated in Oil- and Natural Gas-Reliant Sectors
Several industries that are highly oil- or natural gas-intensive have slowed production. Physical output of processed crude oil fell by 10.9% YoY in Q2 reflecting lower crude oil inputs (Exhibit 9).[4] Sulfuric acid, produced as a byproduct during oil and natural gas refining, saw 4.6% lower Q2 physical output YoY. Chemical fibers, produced with either oil or natural gas feedstocks like ethane or naphtha as inputs, saw 3.7% lower Q2 physical output YoY.
The production of the industrial chemical ethylene increased in Q2 by 1.2% YoY, rebounding from a 4.1% YoY fall in April to +2.1% and +5.5% YoY growth in May and June. Though conventional ethylene production involves steam cracking of oil feedstocks like ethane or naphtha, the recent rebound in ethylene output growth may reflect China’s significant acceleration in modern coal-to-chemicals pathways like Coal-to-Olefins (CTO) where coal is gasified into syngas, synthesized into methanol, and dehydrated to form ethylene. China’s use of coal in chemical production rose by 11.5% in April YoY amid the energy supply shock according to DBX Commodities, with coal-to-chemicals facilities residing atop domestic coal reserves well-positioned to facilitate the transition.
Furthermore, energy-intensive products more reliant on power than oil or natural gas feedstocks saw more resilient output growth. The production of caustic soda, a major industrial chemical, is highly electricity-intensive but does not require oil or natural gas as unique inputs. Physical output of caustic soda grew by 2.4% YoY in Q2. EV production, more reliant on power than on materials made with oil and natural gas, also increased 17.0% YoY.

The key question is how long China’s energy strategy to bridge Hormuz and Red Sea disruptions can last.
China recently had 1.3 billion to 1.4 billion barrels in crude inventories, including roughly 400 million barrels accumulated during 2025. At the current import shortfall of about 3.5 million barrels a day, that recent stock build is about four months of coverage. Of course, the substitution strategy also has its limits. Coal, renewables, and EVs can replace gas-fired power and some gasoline consumption, but they cannot entirely substitute for oil used in aviation, trucking, petrochemicals, or industrial processes.
The bigger risk comes when China stops drawing on its strategic stockpile and returns aggressively to the global crude market.
Earlier today, Helima Croft, head of global commodity strategy at RBC Capital Markets, warned in a note that “war enters a dangerous phase with the Red Sea and critical infrastructure at risk.” Read it here.
Professional Subscribers can access our latest energy-market intelligence, including analysis of Hormuz and other critical maritime chokepoints, through the new Marketdesk.ai.
4. EUROPEAN AND SCANDINAVIAN COMMENTARIES PLUS NATO
EU
EU Is Launching A Mission To Board Russian Shadow Fleet Tankers In The Indian Ocean
Friday, Jul 24, 2026 – 04:15 AM
The European Union has authorized its naval mission in the Indian Ocean (apparently there is one) to stop and board Russian shadow fleet tankers suspected of operating under false flags, the bloc announced on Wednesday.
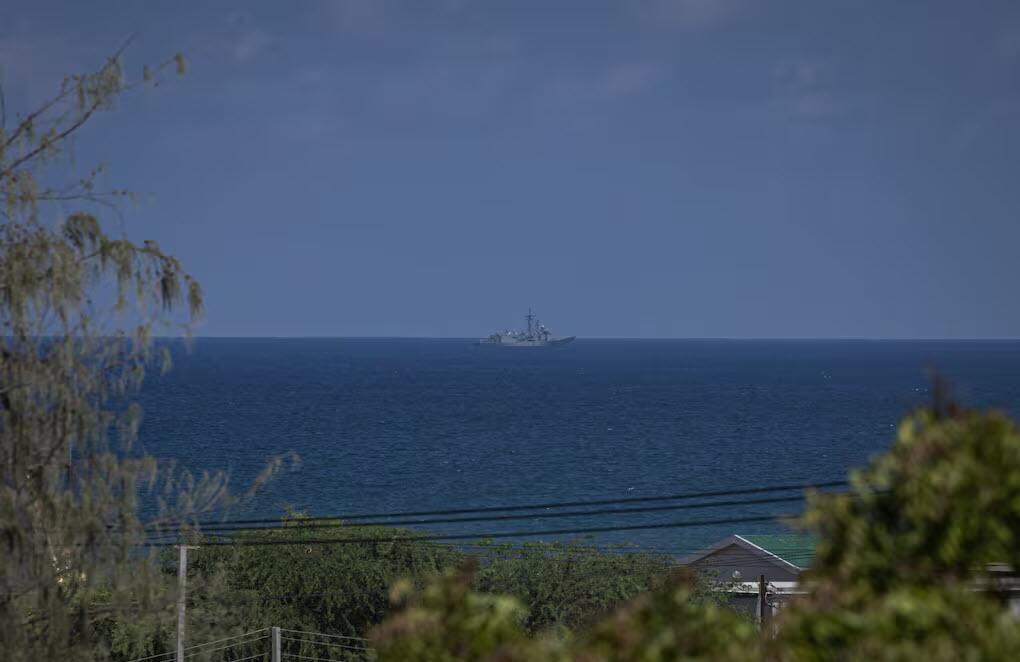
EU member states have authorized Operation Atalanta, the union’s counter-piracy naval mission off the Horn of Africa, to begin conducting flag-verification boardings of vessels suspected of belonging to Russia’s shadow fleet in the western Indian Ocean, DefenseNews reported. The decision, announced this week by EU foreign policy chief Kaja Kallas, extends to Atalanta a power already exercised by the EU’s Mediterranean mission, Operation Irini.
Kallas made the announcement alongside news that Irini forces had boarded the sanctioned oil tanker MV South Star on July 20, acting on suspicion that the vessel was sailing under a false flag. “Every illicit voyage helps sustain Russia’s war machine. We are matching our sanctions with action at sea,” Kallas said, adding that the Atalanta authorization “further tightens the net.”
The move considerably widens the EU’s geographic reach against the shadow fleet, a loosely defined network of tankers with opaque ownership structures that Moscow uses to sell oil above the Western-imposed price cap. While Irini patrols the Mediterranean, Atalanta operates across the Somali Basin, the Gulf of Aden, the Red Sea, the Gulf of Suez, the Gulf of Aqaba and waters around Oman, and was launched as the EU’s first-ever naval mission in 2008 to combat piracy.
It is separate from the EU mission ASPIDES, which is designed to protect shipping in the Red Sea from attacks by the Iran-backed Yemeni Houthi rebels. One look at the exploding price of oil shows just how much the market thinks of Europe “defending” this particular waterway.
The corridor where the mission operates is a critical transit route for tankers carrying Russian crude toward buyers in Asia. Brussels has already sanctioned more than 600 vessels suspected of belonging to the network.
Generally, ships on the high seas cannot simply be stopped and boarded by any third country. However, Article 110 of the UN Convention on the Law of the Sea permits warships to stop and inspect a vessel only where there is reasonable suspicion it is stateless or flying a flag to which it is not entitled. This falls short of a blanket authority to stop any sanctioned or Russia-linked ship, but flying false flags has been a frequent practice on Russian shadow fleet vessels.
The council decision, the operational plan and the rules of engagement that would spell out exactly how far Atalanta’s new powers extend have so far not been made public.
The approach has already produced results elsewhere. Irini’s flag checks contributed to pressure that culminated in a Cameroon purge of 39 vessels from its shipping registry after investigators uncovered fraudulent paperwork and fake registry websites used to disguise shadow fleet tankers.
Russian President Vladimir Putin has previously denounced such interceptions as “piracy,” underscoring how the expanded mandate is likely to further sharpen tensions between Brussels and Moscow over enforcement at sea.
One caveat to all this: unlike oil, Russian LNG (which Europe is absolutely desperate for) will remain exempt from EU sanctions. Which prompted Rabobank’s Michael Every earlier today to ask rhetorically “realpolitik or real weakness?“
END
EU/RUSSIA
EU Approves Biggest Russia Sanctions Yet After Holdout Greece Secured LNG Exemption
Friday, Jul 24, 2026 – 02:45 AM
What is there left to sanction and what is its effectiveness? Europe is boasting of no less that its 21st package of sanctions against Russia, approved by the EU on Thursday.
Apparently it has found plenty of entities still to sanction, as the compiled blacklisting is said to be the EU’s largest in four years, targeting primarily financial and energy sectors. The bloc also agreed to freeze the Russian oil price cap at current levels for another year, alongside issuing 218 new designations.

“At a time when Ukraine has built military momentum, our sanctions continue to weaken the economic foundations of Russia’s war effort,” EU Commission President Ursula von der Leyen said.
And Kaja Kallas, High Representative for Foreign Affairs and Security Policy and chair of the Foreign Affairs Council, announced that “With each round of sanctions, we squeeze Russia’s economy and its capacity to prolong its illegal war. Our 21st package includes the highest number of listings in four years.”
She described: “We’re hitting over a hundred banks and crypto operators, 40+ vessels in Russia’s shadow fleet, and several oil refineries in Russia and Belarus. More than 50 military-industrial entities are included, key actors involved in the production of Russia’s long-range drones. Russia will only negotiate to end its illegal war and stop killing civilians if it is pressured to do so. Sanctions add to this pressure.”
Notably the EU is targeting not just Russia’s so-called shadow fleet, but any vessel that even assists ships under sanction. According to a rundown via an EU media readout:
Concerning energy, today’s package pauses the automatic adjustment of the oil price cap mechanism until 15 July 2027. This is to ensure that Russia’s profits from oil sales remain contained, despite the exceptional market situation caused by the closure of the Strait of Hormuz. Today’s agreement foresees an interim review of the suspension to ensure that the mechanism remains necessary and proportionate. The EU is also continuing to target the shadow fleet by extending the scope of the existing rules also to cover vessels supporting the shadow fleet, by providing bunkering and other services, and listing 41 more vessels on top of the 632 already sanctioned. These measures target non-EU tankers that are part of the shadow fleet circumventing the oil price cap mechanism, that support Russia’s energy sector in other ways, or that transport military equipment for Russia or stolen Ukrainian grain. The EU is designating 8 entities and 1 individual active in the shadow fleet ecosystem, including companies operating on behalf of Russia’s oil majors and, for the first time, a crewing agency providing support to the shadow fleet.
Furthermore, the EU is targeting the oil sector, in particular refineries. It is designating 18 entities and 1 individual in the oil sector, including 3 refineries in Russia, a major Belarusian oil refinery, as well as a company created to sell Belarusian petroleum products within Russia. In addition, the package creates the possibility to prohibit transactions with listed refineries in Russia and in third countries which process or refine Russian crude oil and petroleum products. In that framework, the EU is imposing a transaction ban – entering into force in six months – on a Georgian refinery trading and processing Russian oil in Kulevi. Furthermore, the EU added five oil traders to the entities subject to transaction ban for frustrating the prohibition on purchasing Russian crude oil and petroleum products.
With the Iran war and Hormuz crisis seeing rising oil prices, Russia might not find itself so squeezed after all?
Also notable is that Russian LNG is to remain partially exempt from EU sanctions – in what some analysts are calling a sign of weakness.
After previously holding up the EU passage of the new anti-Moscow measures, Greece won an exemption permitting continued shipments of Russian LNG to non-EU buyers indefinitely.
END
EU/USA
“USA Isn’t A PiggyBank For Europe”: Trump Launches Section 301 Probe Into EU Over Big Tech Fines
Friday, Jul 24, 2026 – 02:06 PM
Summary:
- Trump Opens Section 301 Investigation On Europe Over Big Tech Fines
- Trump Slaps Forced-Labor Duties On 60 Countries
- Trump Begins Rebuild Tariff Wall After Supreme Court Ruling Earlier This Year
Trump Says US Begins Section 301 Investigation on Europe
President Trump wrote on Truth Social that the US will launch a Section 301 investigation into the European Union for “robbing American companies, in turn, the American Taxpayer.”
Trump said Brussels is using America as a “PIGGYBANK” by fining Big Tech companies billions and billions of dollars.
Trump listed the technology companies that have been fined a combined billions of dollars:
After having fined Apple, for no reason at all, 15 Billion Dollars, Meta, 3 Billion Dollars, Amazon 2.5 Billion Dollars, and many others, we have just been informed that Google, a truly advanced and amazing group, has been fined yet another 1 Billion Dollars, without explanation. This brings the Google total to over 18 Billion Dollars!
Trump continued:
This illegal and highly discriminatory practice started at these high levels during the first year of the Sleepy Joe Biden Administration, but it’s not going to continue during the Trump Administration.
He added:
The United States of America is not a “PIGGYBANK” for Europe, nor will we allow it to be!
Please let this TRUTH serve to represent that we will immediately initiate a 301 Investigation into the practice of “ROBBING” American Companies and, in turn, the American Taxpayer.
The European Union will pay a very big price for this illegal and highly unethical conduct, which I have consistently warned them about.
The penalties will be entirely reversed and, we anticipate, a substantial TARIFF to be placed on them at the earliest possible moment.
Trump’s Tariff Wall Returns With Forced-Labor Duties On 60 Countries
The Trump administration imposed Section 301 tariffs on 60 countries accused of failing to “impose and effectively enforce” bans on goods produced with forced labor, according to a new notice from the Office of the U.S. Trade Representative.
Goods from countries including Canada, Mexico, India, and the UK will face a 10% duty, while imports from the European Union and Taiwan will be taxed at least 10%. Products from Japan, South Korea, and Switzerland will face levies of at least 12.5%, with dozens of other countries subject to a flat 12.5% tariff.

Fuel, food, fertilizer, and products already covered by sector-specific tariffs, including automobiles, metals, and pharmaceuticals, will be exempt. Goods qualifying under the US-Mexico-Canada trade agreement will also be excluded.
The tariffs take effect Friday at 12:01 a.m. New York time, marking the biggest move yet to restore President Trump’s protectionist tariff wall since his earlier levies were struck down by the Supreme Court. After that setback, the president instituted a 10% global import tax, which expires Friday. The timing of the new levies ensures there will be no gap between the two.

“President Trump recognizes that decades of moral suasion have not eradicated forced labor from global supply chains. The United States has had a forced labor import ban for nearly a century, and rigorously enforces it; it’s well past time for our trading partners to do the same,” Trade Ambassador Jamieson Greer wrote in a statement.
Greer said, “Today’s action will begin to correct what is both a human rights abuse and a distortive trade practice to improve the welfare of workers everywhere. I am encouraged by the trading partners who have moved quickly to adopt forced labor import prohibitions, and look forward to ensuring their effective enforcement.”
Bloomberg noted that the new Section 301 levies are expected to lift the average effective U.S. tariff rate by just 0.1 percentage point to roughly 10.7%. That remains below the 13.5% rate in place before the Supreme Court’s February ruling.

Ernst & Young trade expert Blake Harden was quoted by Bloomberg as saying that the Trump administration is not yet done with tariffs or with disrupting the status quo.
“There’s still a lot of uncertainty hanging out there. We still have the opportunity for a lot of tariffs this year,” Harden said. “Prior to this week there was sort of just a bit of a lull and maybe it felt like there was more certainty than there is. There’s this thing I keep telling folks: There’s a lot to come still as we get into this year.”
Here’s a first take from Goldman Sachs chief economist Jan Hatzius, who said the new levies should have little effect on the overall US effective tariff rate:
BOTTOM LINE: The White House released the final version of the Sec. 301 tariffs it will use to replace the current 10% Sec. 122 global tariff, which expires July 24. The details of the release suggest there should be little change to the overall US effective tariff rate. Some individual trading partners will see their ETRs move higher or lower, but generally not by much more than 1pp in either direction.
1. The White House announced a new set of tariffs to replace the current 10% global tariff under Sec. 122 of the Trade Act of 1974, which expires July 24. Following a Sec. 301 investigation into forced labor, the US Trade Representative (USTR) has released a final list of tariffs covering trading partners accounting for 95% of US imports. There would be four levels of tariffs: a 10% cap (inclusive of the preexisting MFN tariff), a 10% add-on tariff, a 12.5% cap, and a 12.5% add-on tarif
2. While the prior version of these tariffs, released in June, would have raised the US effective tariff rate (ETR) slightly (+0.25pp), the final version just released should leave the ETR essentially unchanged (-0.1pp) because of four revisions USTR made: (1) the tariff rate for several large trading partners was changed to a cap (including the MFN rate) of 10% (EU and Taiwan) or 12.5% (Japan, Korea, and Switzerland) rather than a tariff on top of the MFN rate; (2) several trading partners including Argentina, Bangladesh, Cambodia, India, Malaysia, and the UK will face a 10% rate, rather than the 12.5% proposed in the earlier version (Taiwan moves from 12.5% add-on to a 10% maximum, like the EU); (3) product exclusions for specific trading partners in recent trade deals are now reflected, and (4) some new products were added to the exclusion list for all trading partners. In general, most of the trading partners getting the lower 10% rate in the final version have a recent trade deal with the US.
3. The change in each trading partner’s tariff rate compared with the expiring Sec. 122 policy would be modest, with only a few instances of changes greater than 1pp. The EU (-0.9pp), Indonesia (-0.9pp), and Korea (-0.7pp) would see the largest declines in their US ETR as a result of the shift from Sec. 122 to the new Sec. 301 rates, while Turkey (+1.5pp), China (+1.4pp), the Philippines (+0.8pp), Vietnam (+0.8pp), Singapore (+0.6pp) and Thailand (+0.6pp) would see the largest increases.
4. The USTR did not announce any new actions related to the other Sec. 301 investigation into 16 trading partners on manufacturing overcapacity, which was started around the same time as the just-concluded investigation. While this could still come in the next few weeks, we still believe that whatever tariffs come out of that second investigation won’t take effect until after the midterm election, and we continue to expect a roughly unchanged US ETR through the end of 2026.
Meanwhile, the US Customs and Border Protection has issued refunds to importers after the Supreme Court invalidated Trump’s previous tariff regime.
5. RUSSIAN AND MIDDLE EASTERN AFFAIRS//
THURSDAY NIGHT//ISRAEL/IRAN/USA
US begins 13th night of strikes on Iran as reports of explosions across Strait of Hormuz surge
Explosions were reported in the islands of Qeshm, Larak, and Hengam, as well as the Iranian cities of Ahvaz and Bandar Abbas.

An aerial view of the island of Qeshm, separated from the Iranian mainland by the Clarence Strait, December 10, 2023.(photo credit: REUTERS/STRINGER/FILE PHOTO)ByARIELLA ROITMANJULY 24, 2026 01:45Updated: JULY 24, 2026 03:36
US forces began another round of strikes against Iran, US Central Command (CENTCOM) announced in a post on X/Twitter on Thursday night, marking the 13th night of attacks against the country.
The strikes are “aimed to hold Iran accountable and diminish threats from the Islamic Revolutionary Guard Corps to commercial shipping,” the post said.
Iranian air defenses were activated in the capital city of Tehran on Friday morning, to counter “hostile threat,” semi-official Nour News reported.
As CENTCOM announced the beginning of another night of strikes, reports came from Iran of explosions near Mesen, a village located on the southern coast of Qeshm in the Strait of Hormuz, and south of the Larak and Hengam Islands, close to the Strait of Hormuz.
IRGC-affiliated Tasnim News Agency had said the explosions were caused by American missiles.
Iranian media also reported explosions in Ahvaz, a city in southern Iran, and in an area west of Bandar Abbas, a port city occupying a strategic position in the Strait of Hormuz.
Also on Friday, Iranian state media outlet Islamic Republic of Iran Broadcasting (IRIB) said in a post on X/Twitter that an American Tomahawk missile had been intercepted and destroyed over the central Iranian city of Kahnuj. CENTCOM has not responded to the claims.
Earlier this month, explosions were reported near Qeshm, an island in close proximity to major shipping routes, following US strikes meant to degrade Iran’s “ability to attack civilian mariners and commercial ships freely transiting the Strait of Hormuz,” according to a US Central Command (CENTCOM) statement.
This is a developing story.
END
FRIDAY/USA IRAN
Trump Losing Patience, In ‘Revenge Mode’ After 13th Consecutive Night Of US Strikes On Iran
Friday, Jul 24, 2026 – 08:40 AM
The latest little peace overture by Washington widely reported Thursday night was apparently a big nothingburger, as on Friday the Iraqi prime minister’s office has denied a New York Times report claiming that Iran rejected a US ceasefire proposal delivered to Tehran by Iraqi Prime Minister Ali al-Zaidi.
The fresh statement from the prime minister’s office said what was published in the Times was “entirely unfounded” and had “no relation to reality.” The statement underscored the temporary nature of the proposal and that it was the “only offer on the table” and still left the question of control over the Strait of Hormuz unresolved – and so Tehran was uninterested.
It’s also the reality that Tehran wants to see Trump sweat and impose economic and political costs particularly ahead of the midterms in November, where Congressional Republicans must face voters over failing to rein in Trump’s Iran war. The Iranians continue to openly voice this, for example in the following from the parliament speaker:
Meanwhile, in what is becoming a brutal, nightly routine, US Central Command (CENTCOM) has wrapped up its 13th consecutive wave of airstrikes against Iran. The Pentagon said it targeted military command centers, drone storage facilities, communication networks, and coastal surveillance sites.
Iranian state media reported overnight into Friday heavy explosions rocking major hubs across the country, including Khorramabad, Jask, Ahvaz, Bandar Abbas, and the strategic outpost of Qeshm Island. Iranian media further said a US missile strike left four dead and five injured in the key industrial and transportation hub of Ahvaz.
As the bombs fall, Tehran is still signaling that military pressure won’t force a cheap surrender – with Iranian Foreign Minister Abbas Araghchi lashing out at the US escalation, warning that “mindless aggression” will only see Trump pay a “heavier price” for a deal to end the war.
Iranian retaliation on US-linked sites in the Gulf have continued at the same steady pace, with on Friday Bahrain’s military having intercepted “several treacherous Iranian air attacks” – according to the general command of the Bahrain Defense Force.
The Bahraini military further denounced Iran’s “systematic hostile approach” and “criminal attacks targeting civilians”. The statement emphasized, “The general command emphasises that the deliberate use of missiles and drones to target civilians and private property constitutes a flagrant violation of international humanitarian law.”
Throughout the morning the Iranian military’s targets also included locations in Jordan, Kuwait, and northern Iraq. Sky News is reporting that “Explosions were also heard near a base hosting the US in Iraq, near the Erbil International Airport.”
Fox feeding its Boomer audience some Freedom Viagra with a helping of war crimes on the side:
But Fox News also reports the results of its latest poll which finds 56% oppose the ongoing American military action against Iran, including 40% who “strongly” oppose. “Disapproval of President Donald Trump’s handling of Iran hit a record high in July,” Fox writes.
“A majority of voters oppose U.S. military action, and nearly two thirds think the conflict will last at least a year,” the report says.
This as The Wall Street Journal does an entire investigative report which should be laughably obvious to any careful observer to what’s been going on and the deepening quagmire the US is getting itself into:
As the war in Iran enters its fifth month, Trump is increasingly frustrated that a conflict he once thought would be over in a matter of weeks has dragged on with no end in sight, administration officials and others close to the president said.
Some of Trump’s advisers now worry that the war—which has resulted in higher prices, falling approval ratings and the deaths of more than a dozen U.S. servicemembers—is consuming his presidency and damaging Republicans’ already dim prospects in the coming midterm elections.
Alarmingly, the WSJ noted that Trump seems in “revenge mode” against Tehran, and apparently sees no other options than to try and keep bombing his way out of it. Of course, this script has been written many times – not only during the “Global War on Terror” and this millennium’s “forever wars” – but going all the way back to the Vietnam war.
NBC: The four service members being flown from the Middle East to Dover Air Force Base were 28-year-old Angel S. Rampersad of New York, 30-year-old Michael Emmanuel Swinton of North Carolina, 25-year-old Tyler James Feehan of Hawaii and 19-year-old Isabella Gonzales of Texas.

The war is said to be taking a heavy “toll” on Trump and his top officials. According to more of what’s also been glaringly obvious for anyone who has had a shred of independent thought:
The war is splitting the conservative coalition over which Trump once had an iron grip, worrying some Republicans close to the White House. Longtime Trump allies such as Fox News host Laura Ingraham have used their platforms to express concerns about how the war might affect Republicans in November’s midterm elections. On Monday, she said the “clock is ticking” to the midterms.
“Netanyahu has led us into a horrible conflict filled with lies,” Steve Bannon, a longtime Trump adviser, said. “People can see with their own eyes what’s going on.”
While this part about Netanyahu is true, it is ultimately President Trump who made the decision, after for years prior – and especially on the campaign trail – articulately spelling out that attacking Iran and starting new Mideast wars would be one of most idiotic foreign policy moves a president could make.
Trump on Thursday said he would take funds from Iran to pay for damage inflicted on US bases and assets throughout the war. Iran responded in the following…
Perhaps the utter folly of Operation Epic Fury has finally begun to dawn on the president. WSJ also observed that “Last month, the president was so excited at the prospect of signing the memorandum of understanding with Tehran to reopen the Strait of Hormuz that he was dismissive of Republican allies who said the Iranians would never stick to the agreement, according to a senior administration official. He wanted it to be over, Trump told them.”
END
FRIDAY AFTERNOON .IRAN/USA/ISRAEL
Betting On TACO? Oil Slides Despite Unraveling ‘Diplomacy’ In Iran; Trump Warns China & Russia
Friday, Jul 24, 2026 – 12:45 PM
Summary
- Diplomacy signals emerge: Pakistan is reportedly exploring renewed US-Iran talks, while Trump is set to meet Netanyahu next week amid the escalating conflict.
- War continues with 13th straight night of bombing: The US carried out a 13th straight night of strikes on Iran as Tehran launched fresh attacks on US-linked targets in Bahrain, Jordan, Kuwait, and Iraq.
- Oil eases: Crude prices fell by week’s end despite continued fighting, as scant reports of possible diplomatic efforts outweighed ongoing regional attacks.
- Trump warns Russia, China: Trump cautioned China and Russia against supplying arms or targeting help to Iran.
- Political pressure grows at home: A new Fox News poll found most Americans oppose the Iran war, while reports say Trump is increasingly frustrated as the conflict drags on.
* * *
Oil Eases by Week’s End on Signs of ‘Diplomacy Lite’
Somewhat surprisingly, oil prices are pushing lower by week’s close, especially after a succession of perhaps ‘diplomacy-lite’ headlines; however, the reality still remains is that the bombing campaign is escalating… and typically the region witnesses the biggest bombs away on a weekend, with markets closed:
- Pakistan exploring path toward resuming US-Iran talks: Reuters
- Pakistan’s push to resume talks follows pressure from China: Reuters
- Houthis say they don’t seek to close key Bab al-Mandeb Strait (only for Saudi shipping, they say)
- Trump to meet Netanyahu at the White House on Tuesday amid Iran escalation

Trump on China, Russia Assistance to Iran
President Trump took to Truth Social to warn China and Russia against giving or selling arms to Iran, saying: “If they did, it would be very bad for them”. However he also sought to clarify: “In my opinion, (they are) not participating.”
Doing so was “certainly not in their best interests” – the president added. The president addressed a Reuters report that alleged Iranian strikes on CIA targets in the Gulf earlier in the war is being investigated, on concerns that Russia or China may have helped with such targeting.
Xi “told me he would not,” Trump wrote. Was there a pinky promise?…

Iraqi Prime Minister Denies NYT Report on Ceasefire Offer
The latest little peace overture by Washington widely reported Thursday night was apparently a big nothingburger, as on Friday the Iraqi prime minister’s office has denied a New York Times report claiming that Iran rejected a US ceasefire proposal delivered to Tehran by Iraqi Prime Minister Ali al-Zaidi.
The fresh statement from the prime minister’s office said what was published in the Times was “entirely unfounded” and had “no relation to reality.” The statement underscored the temporary nature of the proposal and that it was the “only offer on the table” and still left the question of control over the Strait of Hormuz unresolved – and so Tehran was uninterested.
It’s also the reality that Tehran wants to see Trump sweat and impose economic and political costs particularly ahead of the midterms in November, where Congressional Republicans must face voters over failing to rein in Trump’s Iran war. The Iranians continue to openly voice this, for example in the following from the parliament speaker:
13th Straight Night of US Bombing
Meanwhile, in what is becoming a brutal, nightly routine, US Central Command (CENTCOM) has wrapped up its 13th consecutive wave of airstrikes against Iran. The Pentagon said it targeted military command centers, drone storage facilities, communication networks, and coastal surveillance sites.
Iranian state media reported overnight into Friday heavy explosions rocking major hubs across the country, including Khorramabad, Jask, Ahvaz, Bandar Abbas, and the strategic outpost of Qeshm Island. Iranian media further said a US missile strike left four dead and five injured in the key industrial and transportation hub of Ahvaz.
As the bombs fall, Tehran is still signaling that military pressure won’t force a cheap surrender – with Iranian Foreign Minister Abbas Araghchi lashing out at the US escalation, warning that “mindless aggression” will only see Trump pay a “heavier price” for a deal to end the war.
END
IRAN
it is about time to knock out their entire electrical grid
US Bombing Campaign Effectiveness In Doubt As Iranians Rebuild At Rapid Pace
Friday, Jul 24, 2026 – 03:20 PM
Neocon war hawks thought that Iran’s defense capabilities could be obliterated through shock and awe style heavy bombing raids, such as during the opening days and weeks of Operation Epic Fury, but just like pretty much every other assumption about how things would go in the little Iran “excursion” – they are once again proven wrong.
Several fresh reports from both American and Israeli sources say that Iran is rebuilding damaged and destroyed facilities at much faster-than-expected pace. This is despite the well over 20,000 US-Israeli strikes carried out at the height of the war.
Analyzing the latest satellite imagery assessing the damage, The Wall Street Journal writes that the Islamic Republic has “quickly rebuilt infrastructure damaged during the U.S. and Israeli bombing campaign over recent months, from missile bases nestled deep inside mountains to bridges, ports and production facilities, according to Israeli and Western officials and a review of satellite imagery.”

The publication says that this is a significant factor in explaining how the Iranians have managed to maintain their grip on the Strait of Hormuz and thus serious economic and political leverage.
Everything from roads to bridges to tunnel entrances have also be restored at surprising speeds, which also suggests the US bombings have had a rallying effect among civic workers and the broader population in support of the nation and the government.
WSJ offers but one example as follows: “Near Kangavar, in western Iran, satellite imagery from Planet Labs in March showed two tunnel entrances and an access road damaged by airstrikes aimed at blocking access to an Iranian missile base. Within weeks, imagery from Airbus revealed a neatly paved road leading to freshly excavated entrances.”
Israeli media too has listed out the following further examples:
Kangavar Missile Base: Attacked in early March; satellite images show an access road was destroyed, but a newly paved road was built weeks later to bypass the damage.
Bandar Anzali Port: Despite Israel claiming significant damage in March to the IRGC-linked port, command center, and shipyard – early July images show active reconstruction underway.
Tehran Missile Plant: Recent imagery documents active rebuilding efforts at a missile production facility near the capital.
This is causing US and Israeli officials to revisit strategy concerning potential future major bombing campaigns over Iran.
It was in April that the US and Israel began ramping up attacks on bridges and rail lines to cripple Iran’s national transport network. Israel especially adopted attacks against key civilian infrastructure as a battle tactic, in hopes that eventually there would be a groundswell of anti-Tehran anger domestically, leading to government overthrow. Of course, regime change has never happened, and is proving an illusive Neocon fantasy.
President Trump himself had also at the time repeatedly threatening to bomb bridges, power plants, and other infrastructure to send Iran “back to the Stone Age.”
Iranian officials say multiple damaged rail lines and bridges have been restored in record time – sometimes within 40 to 96 hours – using domestic engineering teams. The ceasefire which was declared on April 8, but which is now defunct, was used as a time of rapid rebuilding – something which even US officials have acknowledged.
END
TBN ISRAEL
WEST BANK
IDF kills terrorist who fatally shot one Israeli, wounded four others in West Bank
The murdered Israeli was identified as 32-year-old Benayahu Melet, a member of Gilad Farm’s emergency response squad, who was attempting to assist assailed hikers.

Magen David Adom paramedics evacuate a wounded Israeli on a military helicopter following a Palestinian shooting attack near Gilad Farm, northern West Bank, July 24, 2026.(photo credit: MAGEN DAVID ADOM)What happened near Gilad Farm?›Where is Gilad Farm located?›Who is investigating the shooting reports?›When did the shooting reports emerge?›

ByJAMES GENNJULY 24, 2026 08:34Updated: JULY 24, 2026 13:39
At least one Israeli was killed, two others were seriously wounded, and at least two others were lightly wounded in a shooting near Gilad Farm, a settlement located southwest of Nablus in the northern West Bank, on Friday morning.
A number of Israelis were hiking in the area when they were attacked by Palestinians who encountered them, the IDF confirmed.

The murdered Israeli was identified as 32-year-old Benayahu Melet, a member of Gilad Farm’s emergency response squad who was killed after attempting to aid hikers under assault by Palestinians.
He leaves behind a wife and two daughters, aged 13 and 12, respectively.
The IDF conducted a manhunt for the terrorist, locating and killing him after the shooting incident.

The head of Gilad Farm’s emergency response squad responded to the incident, along with other squad members. At approximately 8:20 a.m., reports were received of a gunshot wound after Palestinians stole the weapon of the emergency response squad chief and fired at the Israelis, Walla learned.
The IDF seized and returned the stolen weapon after killing the terrorist.

“The hike left Mount Bracha in the early morning when a group of approximately 60 hikers, including two guards armed with rifles, and several others with pistols, set off,” a member of the group told Walla.
“On the way, we stopped at a spring close to Sela Ridge. At around 7:05 a.m., the first incident occured when several Arabs from the village began trying to get us to leave by throwing rocks and attacking us with clubs,” they said.
“One of the hikers was injured in the face. We retreated and began walking towards Gilad Farm,” the group member added.
“At 8:05 a.m., the second clash occurred. Dozens of Arabs from the village began throwing stones at us. Arabs began surrounding the group from three sides, and at this point, two of the armed Israelis opened fire in self-defense,” they said.
“The Arabs continued to advance and surround the group, which was trying to descend the mountain. At this point, the number of Arabs in the area had already reached hundreds,” they continued.
“A few minutes later, a military jeep arrived at the scene. Two minutes later, two members of Gilad Farm’s emergency response squad arrived. They tried to repel the Arab crowd by firing a few shots in the air, but to no avail,” the witness said.
“Unarmed civilians also tried to help defend the group, but soldiers pushed them back. During the rush, one of the Arabs, a sheikh from the village, grabbed the gun of one of the emergency response squad members and fired,” they stated.
Magen David Adom paramedics responded to the scene to treat the wounded. “We treated a 25-year-old man who suffered a gunshot wound to his upper body, but remained conscious,” a paramedic said.
“We provided him with medical treatment and evacuated him to be transported to a military helicopter in order to be evacuated to the hospital. He was in a stable condition,” the paramedic noted.
“Later, I assisted an IDF medical team, and together we provided medical treatment to a critically wounded, unconscious man, who suffered gunshot wounds to his body. After prolonged resuscitation efforts, we were forced to declare him dead,” the paramedic said.
Two of the wounded were evacuated to Sourasky Medical Center’s Ichilov Hospital, Tel Aviv, a hospital spokesperson confirmed.
One of the two is in critical condition, while the other suffered serious wounds, the spokesperson noted. United Hatzalah noted that the man in critical condition is approximately 30 years old, while the one with serious wounds is approximately 25 years old.
Two other Israelis were treated at the scene with minor wounds, United Hatzalah added
Netanyahu, Katz, Zamir hold meeting to discuss response to recurring terror threat in West Bank
Prime Minister Benjamin Netanyahu, Defense Minister Israel Katz, and IDF Chief of Staff Lt.-Gen. Eyal Zamir held a discussion on ways to respond to the attack, the Prime Minister’s Office confirmed on Friday.

“We will act strongly against terrorists and their proxies, and we will not allow terrorism in Judea and Samaria to raise its head,” Netanyahu said.
This incident follows two stabbing attacks on Thursday, thereby marking the third terror attack in the West Bank within a 24-hour period.
As such, Zamir held a situational assessment with IDF Central Command Chief Maj.-Gen. Avi Bluth and Operations Directorate Chief Maj.-Gen. Itzik Cohen.
Zamir ordered the mobilization of IDF reinforcements to help secure the area and prevent copycat terror attacks, the military confirmed.
This includes a company from the Nahal Brigade’s Reconnaissance Battalion, two companies from the General Staff’s Infantry Regiment, and two companies from the IDF’s Commando Training School, The Jerusalem Post learned.
Two other battalions have been added to the regional patrols over the past two weeks, and a Commando company was also added last weekend, the Post learned.
According to military officials, the attacks came after a tense period marked by a high volume of security warnings. At the same time, a series of fires that burned large swaths of land intensified friction between Israelis and Palestinians in the West Bank, particularly around the farming outposts. The IDF is now concerned that additional attacks targeting Israeli soldiers and civilians could follow.
At the same time, footage published on Friday showed a large group of settlers, many of them masked, running toward the village of Jit. The incident occurred only hours after the attack at Gilad Farm in the West Bank.
Additionally, Walla has learned that a broad operational campaign is expected to begin across all regional brigades in the coming hours. The activity will focus on arresting wanted suspects and individuals sought for questioning, as well as conducting operations in known friction points. The main effort will center on the city of Nablus and the wider Samaria region.
According to security officials, Thursday’s attack, in which Itamar Cohen, who is considered a prominent figure in the area, was seriously wounded, could trigger acts of nationalist crime against Palestinians. The IDF, Border Police, and Israel Police are preparing for that possibility as well.
At least one person was injured in a rock-throwing incident on Friday near Gilad Farm following reports of hundreds of settlers marching throughout the West Bank’s Areas A and B.
Herzog, Ben-Gvir, Smotrich, other Israeli leaders react to terror attack
“We must stand united and resolute, and must not allow terror to prevail,” President Isaac Herzog said.
“The heart breaks upon hearing the news of Melet’s death,” he added.
“The cities and villages of the murderers in Judea and Samaria are to be judged like Beit Hanun in the Gaza Strip,” National Security Minister Itamar Ben-Gvir said.
“I am on my way to meet Netanyahu for a meeting where I will demand that the IDF be ordered to use air power and D9 bulldozers to erase the homes of terrorists and their supporters, and to exact from the terrorists the price they deserve,” he added.
“For every Jew who is murdered, the enemy must absorb the loss of lands and homes. This is the language spokes in the Middle East, and the time has come to speak it in Judea and Samaria, just as we did in the Gaza Strip,” he stated.
Finance Minister and Religious Zionist Party leader Bezalel Smotrich also responded.
“A tough morning. I send my heartfelt condolences to the family of the murdered, pray for the recovery of the wounded in the attack, and embrace the residents and hikers,” he said.
“We will not normalize the erosion of deterrence and the brazenness of our enemies in recent weeks against the pioneers of settlement and the farms. I demand that the IDF act with an iron fist against the village of the murderers and its surroundings and restore governance and deterrence,” he added.
“The people of the farms and the heroic settlement pioneers are the defensive wall of the State of Israel. We will continue to strengthen and honor them for their steadfast stand for our existence in the Land of Israel against Arab terrorism,” he stated.
“Palestinian terrorism will not achieve its goal; we will continue to deepen our hold on our land – the land of Israel,” Foreign Minister Gideon Sa’ar said.
“The incident is still ongoing. There are still people in danger. Terror will not break us. The response must be offensive: We must relentlessly pursue the terrorists and strike terrorism with full force. At the same time, we must continue to build, develop, and strengthen the communities in Samaria. Anyone who tries to harm us should know that they will be met with a stronger and larger Samaria,” Samaria Regional Council Head Yossi Dagan said.
“I demand that the government launch a large-scale military operation against the Palestinian Authority and Hamas, who are trying to ignite a wave of terrorism here. We’ve seen it over the past week. We expect the government and the military leadership to carry out a major operation, a real military campaign, in Samaria, here near Gilad Farm, to make it clear that Israel has changed the rules of the game and will not tolerate a wave of terrorism,” Dagan added.
“Attack after attack. Our hearts are with our brothers at Gilad Farm on this difficult morning,” former prime minister Naftali Bennett said.
“Sending heartfelt condolences to the family of the murdered, and praying for the recovery of the wounded. The entire people of Israel stand with the IDF and the security forces in their war against the murderers and their senders. The terror must be eradicated with an iron fist,” Bennett added.
“Combating terrorism requires a systematic security policy, enforcement, and harsh strikes against anyone who attempts to harm Israeli citizens,” former IDF chief Gadi Eisenkot said.
“I trust in the security forces in their pursuit of the terrorist and wish strength to the residents of the area at this difficult time,” he continued, adding that he shares in the grief of the murdered Israeli’s family and wishes for a speedy recovery to the wounded.
“The shocking attack this morning, which joins yesterday’s attack and the wave of fires and repeated arsons, illustrates that these are not isolated incidents but planned and ongoing terrorism,” Mateh Binyamin Regional Council Head Israel Ganz said.
“The area is literally burning,” he stated.
“The wave of arsons, attempted attacks and the ongoing incitement by the Palestinian Authority are part of a single campaign aimed at harming the settlement and the citizens of Israel,” he added.
“Judea and Samaria is not a secondary arena. It is a central front of the State of Israel, and the policy here must change accordingly, by launching a broad operation against the centers of terror, exacting a heavy price from anyone involved in terrorism or incitement, and stopping treating these attacks as routine,” Ganz said.
“We pray for the full recovery of the wounded and wish strength to the security forces, IDF, and pioneering farmers who stand on the front lines and protect Israeli citizens with their bodies every day,” he stated.
Far Right MK blames IDF for failing to stop terror attack
Otzma Yehudit MK Limor Son Har-Melech blamed the IDF for allowing the incident to happen.
“The weakness” of IDF Central Command Chief Maj.-Gen. Avi Bluth, and Judea and Samaria Division Chief Brig.-Gen. Kobi Heller with regard to defending West Bank residents “has cost us in precious blood,” she wrote on X.
“The message to soldiers has gotten through, and in recent events, many of them are afraid to respond with determination,” she added.
“While Bluth and Heller are waging a stubborn battle against pioneering Jews [settlers], deploying IDF soldiers despite all our warnings, the Arab enemy is lifting its head and intensifying the terror. Another October 7 is at the door. You have been warned,” she stated.
“A group of Jewish hikers, who set out every Friday to hike in Judea and Samaria, has become a target of terror today,” Yisrael Beytenu leader and former defense minister Avigdor Liberman said.
“This is a loss of control. A normal country does not accept a reality in which its citizens go out to hike in their own land, and terrorists open fire on them,” he added.
“Against terror, there is no room for hesitation, stammering, or tolerance. Terror understands only strength, determination, and an iron fist!” he stated, sending condolences to the family of the murdered Israeli and wishing a speedy recovery to the wounded.
Several Palestinians killed, wounded at scene, Ramallah’s Health Ministry claims
At least four Palestinians were killed by the IDF and four others wounded at the scene, including three in critical condition, the Palestinian Health Ministry claimed. The IDF has not commented on this at the time of writing.
Essam Saifi, a local leader in the Palestinian Fatah party from the area, told Reuters in a phone call that about 25 to 30 Jewish settlers initially attacked the area and tried to break into two houses there. The residents came out to confront them, and the settlers opened fire, Saifi said.
Half an hour later, Saifi said, the Israelis returned and attacked the western part of the town, striking a minor with a weapon. This caused chaos, and then the Israeli military arrived and started shooting, along with the settlers, Saifi told Reuters.
Amir Bohbot, Efrat Forsher, and Reuters contributed to this report.
END
RUSSIA VS UKRAINE
Yet Another Wildberries Facility – Russia’s Amazon – Goes Up In Flames After Ukraine Drone Strike
Friday, Jul 24, 2026 – 09:40 AM
Another large warehouse and logistics hub for major online Russian retailer Wildberries has been targeted and struck by Ukrainian drones.
This is the third time in a week the company widely considered to be the ‘Russian Amazon’ has seen its warehouses go up in flames. At least eight of its shipping facilities have been attacked overall this month. Wildberries co-founder Tatyana Kim confirmed the fresh attack on company facilities Friday morning:
Kim, Russia’s wealthiest woman, said Wildberries facilities in St. Petersburg and the surrounding Leningrad region, as well as in annexed Crimea, were hit overnight. Fires broke out at several locations, though Kim said “parts” of the warehouses were saved.
While Kim said none of the company’s employees were injured, Leningrad region Governor Alexander Drozdenko wrote in a post on Telegram earlier in the morning that three people were hurt during the attack in his region.

Operations at these facilities have been halted, while all personnel a the impacted warehouse in Crimea have been evacuated.
The St. Petersburg attack resulted in especially dramatic scenes of a huge smoke plume stretching high into the atmosphere, and even visible from space, NASA satellite imagery showed.
It was just last week that the company’s warehouses in central Russia were struck, which killed eight people. In the face of the Kremlin calling the attacks acts of terrorism and war crimes, Ukrainian President Volodymyr Zelensky has claimed that the hubs were “involved in providing the Russian army with drone components, navigation equipment and other gear.”
The Wildberries facilities have been increasingly targeted amid broader nightly drone waves out of Ukraine, with a separate Friday attack in the Kirov region killing at least six people.

NBC News has noted, “Wildberries, whose banking arm had sanctions imposed on it by the European Union this week over its financial contribution to the Russian budget, plays a central role in Russia’s consumer economy.”
“Its targeting by Ukraine appears to be part of Kyiv’s attempts to ensure ordinary Russians feel the impact of the war which has raged on Ukrainian territory for more than four years,” the report adds.
The company says it is working around the clock to restore service to areas impacted by the warehouse attacks.
Stunning footage of Wildberries hub fully on fire from earlier this week in Krasnodar:
Reuters has reviewed that “Together with smaller rivals, Wildberries and Ozon sell goods and services worth the equivalent of 8.5% of Russia’s gross domestic product. They provide jobs for 4 million people, or more than 5% of the country’s workforce.”
6/.GLOBAL ISSUES, COVID ISSUES, VACCINE INJURIES/HEALTH ISSUES
GLOBAL ISSUES
SENATOR RON JOHNSON…
“It’s Getting Worse”: HSBC Warns Commodities Face Squeeze As Chokepoint Chaos Spreads
Friday, Jul 24, 2026 – 09:20 AM
The key takeaway heading into the weekend is that maritime chokepoint chaos has spread from the Strait of Hormuz to the Bab el-Mandeb Strait, while fighting across the Black Sea has intensified between Russia and Ukraine. The widening disruptions have prompted several institutional desks this week to warn that a potential squeeze on physical commodity markets could send prices from energy to agricultural goods higher.
“The Middle East conflict has escalated, putting a substantial squeeze back into commodity markets,” Paul Bloxham, HSBC’s chief economist for Australia, New Zealand and global commodities, wrote in a note on Friday morning.
Bloxham continued, “Traffic through Hormuz has almost stalled again, and the disruption has spread to the Bab el-Mandeb Strait, the key access point for the Red Sea, for Saudi oil going to Asia and Europe-Asia trade through the Suez Canal.”
Bloxham warned that with Brent trading above $100 a barrel and strategic petroleum reserves being rapidly depleted worldwide, energy markets face a mounting risk of a “super-squeeze.”

His message was blunt: “It’s not over yet,” adding, “Hormuz, Mandeb, oil at 100 … it’s getting worse. “
Here’s more:
The Brent oil price has risen sharply, to over USD100/b recently; European and Asian gas prices are more than 40% m-o-m; refined product prices, like jet fuel and diesel are surging; urea prices are up 13%; and wheat prices are at a three year high – all on supply constraint concerns. With inventory rundown having been a key adjustment factor preventing much bigger prices spikes earlier in the conflict, and stocks now much lower, concerns about ‘tank bottom’ levels and non-linearities are expected to come back into focus. It’s a ‘super-squeeze’. And it’s not over yet.
Bloxham also highlighted the market mechanics that prevented Brent from spiking even higher a few months back, including US strategic reserve releases and China’s reduction of oil imports and SPR.
But he warned that these buffers are finite and can suppress the price shock for only so long:
As we have actively written about over the past few months, a key reason that commodity prices – particularly oil – did not spike higher earlier has been active reduction of inventories, particularly with the US release of strategic reserves and in China, where oil imports have been drawn down (see ‘Better, but the Hormuz disruption is not over yet’, 25 June 2026; and ‘Hormuz is reshaping commodity markets’, 25 May 2026).
However, the challenge is that inventory reduction can only provide an offset for so long.
At some point, concerns about stocks falling to critical levels may show up in non-linearities in markets (see Hormuz still closed: Beware Strait non-linearities, 28 April 2026). However, even with a deep-dive looks at measured stocks and supply pathways, it is hard to be definitive about when reserves will reach these critical levels. Commodity markets are highly adaptable, and when the demand is there, flexible markets often find a way to deliver. Aggregate price benchmarks also only go so far. In the face of acute supply shocks, commodity markets tend to fragment, with many different prices for the same products in different locations and for different delivery times (see More fragmentation as Hormuz blockage continues, 13 April 2026).
That said, the longer the disruption is in place – and the recent escalation suggests it is, indeed, going on for longer – the more likely it becomes that commodity prices will spike higher, in non-linear ways, as stocks are depleted.
A growing list of institutional commodity desks, including Goldman Sachs, RBC Capital Markets and JPMorgan, has warned that the expanding maritime chokepoint crisis is entering a more dangerous phase.
Helima Croft, RBC’s head of global commodity strategy, cautioned that the “war enters a dangerous phase with the Red Sea and critical infrastructure at risk.“
These desks have raised their near-term Brent forecasts as the disruption spreads. Goldman commodities strategist Daan Struyven warned that Brent could exceed $120 a barrel in the fourth quarter if the Hormuz crisis persists.

Related:
With the US national average for regular gasoline now above $4 a gallon, the energy shock has crossed a politically sensitive level (again), which could increase pressure on the Trump administration to pursue a diplomatic off-ramp.
MARK CRISPIN MILLER
DR PAUL ALEXANDER…
Mortgage rates in US Treasury market says now headed to 7% and above! Shock signal ‘The Treasury market is flashing a warning sign for home buyers. Are 7% mortgage rates next? The 30-year fixed-rate
mortgage edged up to its highest level of 2026; US economic outlook is bleak as COL is elevated and Foreclosures are on the rise nationwide, data shows, with Florida leading the charge!
POTUS Trump best take a long hard look at this economic landscape for between the failed Iran clusterfuck war, the covered up Epstein pedophilia that touches even his Trump orbit, the failed DHS ICE shootings, the struggling economy, crime et al., there are serious issues coupled to the failed OWS lockdowns that hamper him and he owns and the deadly Malone Bourla Bancel Pfizer Moderna RFK Jr. Sahin Moncef BioNTech Weissman et al. mRNA vaccine…


Alexa
RABOBANK/MICHAEL EVERY/OR OR PICTON/GIFFIN OR RABOBANK EXECUTIVE/COMMENTARY ON WORLDLY AFFAIRS
7. OIL AND NATURAL GAS//ENERGY COMMENTARIES
Seven Pipeline Projects That Could Break Iran’s Grip On Hormuz Chokepoint
Thursday, Jul 23, 2026 – 07:40 PM
Brent crude futures topped $100 a barrel (Read RBC note) as disruption at the Strait of Hormuz spread to Bab el-Mandeb in the southern Red Sea. Combined with intensifying Black Sea fighting between Russia and Ukraine, the widening chokepoint crisis has put the energy complex and broader global commodities market on edge.
“The curve on Brent and WTI is getting again very steep backwardated compared to when the diplomatic route to solve the Middle East conflict was on the table and seemed to be making progress,” UBS analyst Claudio Martucci wrote in a note.

The reemergence of chokepoint chaos in the Strait of Hormuz, now spreading to Bab el-Mandeb, has provided Gulf states with a critical reminder of the risks associated with maritime export routes. This disruption is accelerating efforts to bypass vulnerable chokepoints and spurring a major infrastructure boom.
At least seven major pipeline projects are under construction, being planned or under discussion, according to the Associated Press.

Saudi Arabia’s East-West pipeline already provides the region’s most important alternative, carrying crude from Abqaiq to Yanbu on the Red Sea.
The UAE has also increased oil shipments to Fujairah on the Gulf of Oman, bypassing Hormuz. Together, the Fujairah route and Saudi Arabia’s East-West pipeline had between 3.5 million and 5.5 million barrels a day of spare capacity before the war, according to the EIA. Both pipelines are now operating near capacity.
Even Dubai’s state-owned ports and logistics giant, DP World, is planning to bypass the critical waterway with a new container port on the UAE’s east coast in Fujairah.
The UAE has plans to expand Fujairah’s export capacity, and more recently, the US is backing talks to revive an oil pipeline from Iraq to Syria’s Mediterranean coast. This would create yet another export route that would entirely bypass the Hormuz chokepoint and, in turn, erode Tehran’s leverage over shipping traffic.
Our coverage on the Gulf energy rewiring:
- Gulf States Considering Network Of New Pipelines To Bypass Strait Of Hormuz
- Great Rewiring: US Supports Iraq-Syria Oil Pipeline To Erode Tehran’s Hormuz Leverage
- Dubai’s New East Coast Port Signals The Beginning Of End For Iran’s Hormuz Leverage
What’s key to understand here is that seven projects by U.S.-aligned Gulf states are set to rewire energy flows in the Gulf region, which will only erode Tehran’s leverage over Hormuz.
END
India’s Fuel Exports Set To Soar In July As Refining Margins Jump
Friday, Jul 24, 2026 – 06:30 AM
By Charles Kennedy of OilPrice.com,
India is on track to export the highest volume of refined petroleum products in months as refining margins have jumped with the re-escalation of the Middle East conflict.

India is estimated to ship as many as 1.55 million barrels per day (bpd) of light and middle distillates in July, per data by commodity analysts Kpler cited by Reuters columnist Clyde Russell.
The July volumes would be nearly double the fuel export volumes of just 866,000 bpd in May, when the Strait of Hormuz crisis hit crude supplies to India and the rest of Asia. In May, India saw its lowest fuel exports in four years.
The tightening fuel markets in Asia and the rest of the world added to a renewed rally in refining margins after the U.S.-Iran ceasefire collapsed two weeks ago. This has encouraged Indian refiners to ramp up refined petroleum exports.
The expected volumes in July would be the second-highest level in Kpler’s data series dating back to 2017.
Earlier this month, Kpler estimated that India’s refined petroleum exports would hit in July the highest level since September 2025 as refiners race to capture soaring margins amid tight Asian fuel markets.
India’s high export levels in July could ease some of the pressure on the Asian fuel market, but not all of it, as crude supplies from the Middle East are once again at high risk of delay.
Asian refiners that had bet on a flood of crude supply from the Middle East in August are now faced with potential delays in deliveries amid the re-escalation of hostilities, which could thwart their plans to ramp up crude processing rates in the coming weeks.
Refiners in the U.S. and Europe are operating at near capacity, but those in Asia may not see the expected increase in throughput now that the July and August loadings and delivery schedules have been upended by the re-escalation of the Middle East conflict.
END
Oil Tanker Makes Red Sea U-Turn After Houthi Threats, Reroutes Around Africa In Costly Transit
Friday, Jul 24, 2026 – 01:40 PM
ING’s Singapore-based head of commodities, Warren Patterson, was asked during a recent webinar what it would take for Brent crude to exceed $120 a barrel. His answer was “not much,” warning that prices could soar well into triple-digit territory if the Strait of Hormuz remains blocked through August and threats to Red Sea shipping intensify.
Patterson’s warning about disruptions at the Strait of Hormuz and the Bab el-Mandeb Strait echoes concerns voiced across commodity desks this week: the longer these critical chokepoints remain impaired, the greater the upside risk to Brent, WTI, and fuel prices at the pump.
Strait of Hormuz Crossings

Bab el-Mandeb Crossings

The latest signs of trouble in the southern Red Sea come from a Reuters report stating that the Danish-flagged tanker Torm Innovation was rerouted from Yanbu, Saudi Arabia, through the Suez Canal and around the Cape of Good Hope as an alternative to the Bab el-Mandeb Strait after two Saudi tankers were hit with projectiles by the Iran-backed Houthis earlier this week.
“Given the security situation in the southern part of the Red Sea, the vessel is sailing via the Suez Canal and around the Cape to Asia. This reflects our cautious approach to crew safety, which remains our highest priority,” a Torm spokesperson told the outlet.
Rerouting around the Cape of Good Hope instead of transiting Bab el-Mandeb adds weeks of sailing time and sharply increases freight, fuel and insurance costs.
Longer voyages also tie up vessels for extended periods, effectively reducing available tanker capacity and tightening energy markets. The result will be higher tanker rates.
The rerouted tanker is carrying a 500,000-barrel cargo of Saudi naphtha from Yanbu to Japan.
One question we have is whether this marks the beginning of a tanker exodus from the southern Red Sea, or whether surging gasoline and diesel prices at US pumps force the Trump administration to pursue a diplomatic off-ramp with Tehran to break the tit-for-tat strike cycle and restore order on critical maritime chokepoints to mitigate an energy shock
8. EMERGING MARKETS//AUSTRALIA NEW ZEALAND ISSUES
U.S./GOLD AND SILVER PRICING/ASIAN CLOSING MARKETS AND EUROPEAN BOURSE OPENING AND CLOSING/ INTEREST RATE SETTINGS FRIDAY MORNING 6;30AM//OPENING AND CLOSING
OPENING LEVELS OF CURRENCIES// AND CLOSING ASIAN STOCK MARKET AND OPENING EUROPEAN STOCKS:6 AM EST
EURO VS USA DOLLAR: 1.1379 UP 0.0003
USA/ YEN 163.793 UP 0.750 NOW TARGETS INTEREST RATE AT 1.75% AS IT WILL BUY UNLIMITED BONDS TO GETS TO THAT LEVEL…//YEN STILL FALLS//END OF YEN CARRY TRADE BEGINS AGAIN DEC 2024/Bank of Japan raises rates by .25% TO 1.75 ..TAKAICHI NEW PM AS YIELDS RISE//JAPAN DEEPLY IN TROUBLE WITH RISING RATES AND A FALLING YEN!! BANK OF JAPAN WILL NO LONGER DO QE. URGES PENSION AND INSUANCE FUNDS TO BUY JAPANESE BONDS
GBP/USA 1.3320 UP 0.0011 OR 11 BASIS PTS
USA/CAN DOLLAR: 1.4087 UP 0.0002 //CDN DOLLAR DOWN 2 BASIS PTS//
Last night Shanghai COMPOSITE CLOSED DOWN 62.58 PTS OR 1.61%
Hang Seng CLOSED DOWN 247.58PTS OR 0.98%
AUSTRALIA CLOSED DOWN 0.04%
// EUROPEAN BOURSE: ALL GREEN
Trading from Europe and ASIA
I) EUROPEAN BOURSES: ALL GREEN
2/ CHINESE BOURSES / :Hang SENG CLOSED DOWN 247.58PTS OR 0.98%
/SHANGHAI CLOSED DOWN 62.58 PTS OR 1.61%
AUSTRALIA BOURSE CLOSED DOWN 0.04%
(Nikkei (Japan) CLOSED DOWN 1811.45PTS OR 2.73%
INDIA’S SENSEX IN THE RED
Gold very early morning trading: $4056.75
silver:$58.33
USA DOLLAR VS TRY (TURKISH LIRA): 47.35 UP 13 BASIS PTS AND NOW WE SEE THEIR STUPIDITY OF SELLING SOME OF THEIR GOLD AND ALL OF THEIR USA DOLLAR RESERVES. THE COUNTRY IS IN BIG FINANCIAL TROUBLE
USA DOLLAR VS RUSSIAN ROUBLE: 77.91 ROUBLE// UP 0 ROUBLE AND 38 BASIS PTS. WOULD YOU BELIEVE THAT THE RUSSIAN ROUBLE AND THE ISRAEL SHEKEL ARE THE STRONGEST CURRENCIES BESIDES THE DOLLAR .
UK 10 YR BOND YIELD: 5.0563 DOWN 5 BASIS PTS
UK 30 YR BOND YIELD: 5.7451 DOWN 4 BASIS PTS
CDN 10 YR BOND YIELD: 3.629 DOWN 2BASIS PTS
CDN 5 YR BOND YIELD; 3.254 DOWN 2BASIS PTS
USA dollar index early FRDAY MORNING: 101.24 DOWN 5 BASIS POINTS FROM THURSDAY’s CLOSE
FRIDAY MORNING NUMBERS ENDS
And now your closing FRIDAY NUMBERS 10.00 AM
Portuguese 10 year bond yield: 3.546% DOWN 1 in basis point(s) yield
JAPANESE BOND 10 yr YIELD: +2.823% UP 9 FULL POINTS BASIS POINTS /JAPAN losing control of its yield curve/
JAPAN 30 YR: 3.987 UP 10 BASIS PTS//
SPANISH 10 YR BOND YIELD: 3.648 DOWN 4 in basis points yield
ITALY 10 YR BOND: 4,023 DOWN 5 points in basis points yield ./
GERMAN 10 YR BOND YIELD: 3.1819 DOWN 1 BASIS PTS
IMPORTANT CURRENCY CLOSES : MID DAY FRIDAY
Closing currency crosses for day /USA DOLLAR INDEX/USA 10 YR BOND YIELD/10:00 AM
Euro/USA 1.1369 DOWN 0.0007 OR 7 basis points
USA/Japan: 163.86 UP 0.740 OR YEN IS DOWN 75BASIS PTS// HIGHLY INFLATIONARY TO JAPAN
Great Britain 10 YR RATE 5.0594 DOWN 2 BASIS POINTS //
GREAT BRITAIN 30 YR BOND; 5.745 DOWN 2 BASIS POINTS.
Canadian dollar DOWN 19 BASIS pts to 1.4104
xxxxxxxxxxxxxxxxxxxxxxxxxxxxxxxxxxxxxxxxxxxxxxxxxxxxxxxxxxxxxxxxxxxxxxxxxxxxxxxx
The USA/Yuan CNY 6.77221ON SHORE ..UP
THE USA/YUAN OFFSHORE// CNH DOWN TO 6.7741
TURKISH LIRA: 47.35 PLUS 13 EXTREMELY DANGEROUS LEVEL/DEATH WATCH/HYPERINFLATION TO BEGIN.//
Your closing 10 yr US bond yield UP 2 in basis points from THURSDAY at 4.683% //trading well ABOVE the resistance level of 2.27-2.32%)
USA 30 yr bond yield 5.163 UP 2basis points /10:00 AM
USA 2 YR BOND YIELD: 4.342 UP 3 BASIS PTS.
GOLD AT 10;00 AM 4050.00
SILVER AT 10;00: 57.95
Your 11:00 AM bourses for Europe and the Dow along with the USA dollar index closing and interest rates THURSDAY
DAY CLOSING TIME 10:00 AM///
London: CLOSED UP 143/12 PTS OR 1.35%
GERMAN DAX: CLOSED UP 164.65 PTS OR 0.66%
FRANCE: UP 82.43 OR 0.99 PTS
Spain IBEX CLOSED UP 204.20 PTS OR 1.05 %
Italian MIB: CLOSED UP 499.04 PTS OR 0.95%
WTI Oil price 90.54 10.00 EST/
Brent Oil: 97.74 10:00 EST
USA /RUSSIAN ROUBLE /// AT: 77.62 ROUBLE UP 0 AND 67 / 100
CDN 10 YEAR RATE: 3.620 DOWN 2 BASIS PTS.
CDN 5 YEAR RATE: 3.244 DOWN 2BASIS PTS
CLOSING NUMBERS: 4 PM//
Euro vs USA 1.1369 DOWN 0.0007 OR 7 BASIS POINTS//
British Pound: 1.3324 UP 0.0019 OR 19 basis pts/
BRITISH 10 YR GILT BOND YIELD: 5.0408 UP 1 FULL BASIS PTS//
BRITISH 30 YR BOND YIELD: 5.746 DOWN 1 IN BASIS PTS.
JAPAN 10 YR YIELD: 2.804 UP 6 FULL BASIS PTS (DANGEROUS TO THEIR ECONOMY
JAPANESE 30 YR BOND: 3.971 UP 13 PTS AND STILL VERY DANGEROUS TO THEIR ECONOMY
USA dollar vs Japanese Yen: 163.940 UP 0.740 OR YEN DOWN 75 BASIS PTS//GETTING FURTHER AWAY FROM 160.00/ EXTREMELY DANGEROUS
USA dollar vs Canadian dollar: 1.4098 UP 0.0013 PTS// CDN DOLLAR DOWN 13 BASIS PTS
West Texas intermediate oil: 89.58
Brent OIL: 96.81
USA 10 yr bond yield DOWN 3 BASIS pts to 4.676
USA 30 yr bond yield: UP 1 PTS to 5.160%
USA 2 YR BOND 4.3333 UP 2 PTS
CDN 10 YR RATE 3.6021UDOWN 4 BASIS PTS
CDN 5 YEAR RATE: 3.221 DOWN 5BASIS PTS
USA dollar index: 101.31 UP 2 BASIS POINTS
USA DOLLAR VS TURKISH LIRA: 47.34 UP 13 BASIS PTS GETTING QUITE CLOSE TO BLOWING UP/IDIOTS SOLD GOLD
USA DOLLAR VS RUSSIA//// ROUBLE: 76.93UP 1 AND 40/100 roubles //
GOLD $4054.20 3:30 PM)
SILVER: 58.35 3;30 PM)
DOW JONES INDUSTRIAL AVERAGE: UP 235.60 POINTS OR 0.46%
NASDAQ 100 DOWN 326.47PTS OR 1.15%
VOLATILITY INDEX 18.85 UP 0.80 PTS OR 0.15%
GLD: $ 371.90UP 0.38 PTS OR 0.10%
SLV/ 52.59 PTS UP 0.53 OR 1.02%
TORONTO STOCK INDEX// TSX INDEX: CLOSED UP 145.88 PTS OR 0.44%
end
TRADING today ZEROHEDGE 4 PM: HEADLINE NEWS/TRADING
Tehran, Tech, & Tariffs Trigger Market Turmoil As Hyperscaler Credit Trashed
by T
WRAP UP;
Stocks mixed on tech weakness after earnings while oil slides ahead of weekend – Newsquawk US Market Wrap
Friday, Jul 24, 2026 – 04:05 PM
- SNAPSHOT: Equities mixed, Treasuries up, Crude down, Dollar flat, Gold up
- REAR VIEW: Trump hasn’t made a decision on major strikes on Iran, could make a deal or could hit them harder; Trump writes Xi and Putin said to him not to sell weapons to Iran; Pakistan reportedly exploring a path to resume US-Iran talks; Trump said to be losing patience over an Iran war with no clear end in sight; Iran rejects US ceasefire deal presented by Iraqi leader; Mixed US Flash S&P Global PMIs, Mfg misses, Svs beats; US announces new 10-12.5% tariffs on 60 countries; INTC earnings & guidance beat, capex raise sparks concern
- COMING UP: Data: German IFO (Jul), US Durable Goods Orders (Jun), Atlanta Fed GDP (Q2). Supply: Australia, US. Earnings: LVMH, AstraZeneca.
- WEEK IN FOCUS: Highlights include: FOMC, BoE, BoJ, US PCE, US GDP, and EZ CPI. Click here for the full report.
- WEEKLY US EARNINGS ESTIMATES: Earnings plentiful with Mag-7 names the standouts. Click here for the full report.
More Newsquawk in 2 steps:
- 1. Subscribe to the free premarket movers reports
- 2. Trial Newsquawk’s premium real-time audio news squawk box for 7 days
MARKET WRAP
Stocks were mixed on Friday with the Nasdaq 100 underperforming. Weakness in technology stocks continued following earnings, while the S&P 500 was broadly flat. Intel (INTC) reversed its initial post-earnings gains as elevated CapEx weighed on the stock and broader semiconductor space. However, underlying breadth was considerably more constructive, with the Russell 2000 and Dow gaining, while the equal-weight S&P outperformed.
Crude prices pared some of the sharp gains seen throughout the week, with Brent falling sub USD 97.00/bbl after reaching USD 102/bbl on Thursday. The weakness appeared to reflect some position squaring ahead of the weekend rather than a meaningful improvement in the geopolitical backdrop. There were several reports of note but in late trade Trump stated he has not yet made up his mind on whether or not to conduct massive strikes on Iran, noting he always prefers to settle things diplomatically. He also noted that the US and Iran are talking, and he sees them as the most serious they have ever been.
Treasuries rose across the curve as the sharp pullback in crude helped unwind some of the pronounced selling seen earlier in the week. The belly outperformed, while moves were more modest at the long end.
Economic data were encouraging but had little lasting impact. The S&P Global Flash Composite PMI beat, driven by stronger services activity, although manufacturing unexpectedly eased. The report suggested GDP is growing at around a 2.0% annualised pace, but also warned of intensifying supply-chain delays and renewed price pressures.
In FX, moves were relatively contained, with the Dollar Index little changed. Antipodeans outperformed despite the mixed equity performance, with NZD leading the gains and AUD also firmer, while CAD lagged as crude prices tumbled. The Yen was broadly unchanged following Nikkei reports suggesting the BoJ is set to hold rates next week, despite some policymakers calling for further tightening following June’s hike. Gold rose modestly despite the relatively steady Dollar, likely finding some support from lower Treasury yields.
Attention now turns to developments in the Middle East over the weekend before focus shifts to next week’s FOMC decision and Chair Warsh’s press conference. A hold remains the base case, although markets continue to price some risk of a hike following the recent surge in energy prices. The BoJ and June US PCE inflation report will also be key events next week.
US
S&P GLOBAL FLASH PMIs: The US Composite PMI rose to 53.6 in July (exp. 52.3, prev. 51.9), an eight-month high, as a sharp improvement in services offset softer manufacturing activity. The Services PMI increased to 53.6 (exp. 51.0, prev. 51.2), also an eight-month high, while the Manufacturing PMI edged down to 53.8 (exp. 54.5, prev. 53.9), with manufacturing output growth slowing to a four-month low. S&P Global said the survey is consistent with annualised GDP growth of around 2.0%, compared with the 1.2% pace signalled for Q2, while employment increased for the first time in three months. However, inflationary signals were concerning, with input cost inflation reaching a 14-month high and selling price inflation accelerating to its strongest since August 2022, while supplier delivery times deteriorated by the most since August 2022 amid disruption around the Strait of Hormuz. S&P Global cautioned that recent developments in the Middle East could exacerbate supply-chain and price pressures and increase downside risks to the near-term economic outlook, suggesting July’s improvement may not mark the start of a sustained acceleration in growth.
NEW HOME SALES: US new home sales rose 1.6% in June to 628k, above the expected 609k. Supply was 9.3 months at the current sales rate, vs. May’s 9.4 months worth. The median sales price of new houses sold was USD 398,300, -3.3% M/M. Oxford Economics note that new home sales were a touch stronger than they expected, and past months were revised higher, but the broader picture is still mostly one of stability rather than improvement. The hit to households’ real incomes and a renewed rise in mortgage rates will keep housing market activity soft.
FIXED INCOME
T-NOTE FUTURES (U6) SETTLED 7+ TICKS HIGHER AT 108-10+
T-notes gained across the curve, unwinding some of the week’s weakness as oil prices retreated ahead of the weekend. At settlement, 2-year -1.8bps at 4.333%, 3-year -2.5bps at 4.367%, 5-year -2.7bps at 4.429%, 7-year -2.3bps at 4.550%, 10-year -1.8bps at 4.681%, 20-year -1.1bps at 5.190%, 30-year -0.1bps at 5.164%.
THE DAY: Treasury yields fell across the curve on Friday as oil prices retreated from recent peaks, with Brent falling back below USD 100/bbl. The pullback appeared to reflect some position squaring ahead of the weekend rather than any meaningful improvement in the geopolitical backdrop.
Reports around Thursday’s close suggested the Iraqi President was travelling to Tehran with a US proposal, although Iran ultimately rejected it. The US also completed its 13th consecutive night of strikes against Iran, while the WSJ reported that President Trump is losing patience amid the lack of a clear path towards ending the conflict. Trump also held a Cabinet meeting on Friday to discuss whether to intensify the military campaign against Iran. On the more constructive side, reports suggested China is pushing Pakistan to explore a path towards renewed US-Iran talks. Overall, significant headline risk remains over the weekend, with attention on whether diplomatic efforts gain traction or the US moves towards further escalation.
Elsewhere, US economic data were encouraging. The S&P Global Flash Composite PMI rose to 53.6 from 51.9 (exp. 52.3), driven by the Services PMI rising to 53.6 from 51.2 (exp. 51.0). However, Manufacturing PMI eased to 53.8 from 53.9, below expectations for a rise to 54.5. S&P Global said the survey data are consistent with GDP growing at an annualised pace of around 2.0%, compared with the 1.2% pace signalled for Q2. The report also highlighted an intensification of supply-chain delays and renewed price pressures, although the data had little lasting impact on Treasuries.
Focus remains firmly on geopolitics, although attention will shift towards next week’s FOMC decision. A hold remains the base case, but markets continue to price some risk of a rate hike following the recent surge in energy prices and associated increase in inflation concerns.
SUPPLY
Notes
- US to sell USD 69bln 2-year notes and USD 70bln 5-year notes on July 27; to sell USD 44bln 7-year notes on July 28; to sell USD 30bln 2yr FRN on July 29th; all to settle on July 31st..
Bills
- US to sell USD 92bln 13-week bills and USD 79bln 26-week bills on July 27; to sell USD 95bln 6-week bills on July 28; all to settle on July 30
- US sold 4-wk bills at high-rate 3.730%, B/C 2.79x; sold 8-wk bills at high-rate 3.795%, B/C 2.31x
STIRS / OPERATIONS
- Fed Pricing: 36.5bps (prev. Dec 38bps)
- EFFR at 3.63% (prev. 3.63%), volumes at USD 104bln (prev. USD 102bln) on July 23rd
- SOFR at 3.64% (prev. 3.62%), volumes at USD 2.971tln (prev. USD 3.026tln) on July 23rd
- NY Fed RRP op demand at 0.68bln (prev. 0.90bln) across 2 counterparties (prev. 6) on July 24th
CRUDE
WTI (U6) SETTLED USD 2.88 LOWER AT 89.31/BBL; BRENT (U6) SETTLED 3.91 LOWER AT 96.78/BBL
The crude complex saw losses on Friday, but appeared to be an unwinding of the weeks gains heading into the weekend, instead of any US/Iran de-escalation. Despite saying that, benchmarks did encounter a bout of pressure, and get sent to lows, on two updates: 1) Pakistan reportedly looking to resume US-Iran talks, in a push by China 2) Trump noting Xi and Putin have said they would not sell weapons to Iran. Despite that, the overall rhetoric remains aggressive and no indication of a peace agreement, as the NYT recentrly reported that Trump was meeting on Friday with top advisers and senior members of his cabinet to decide whether to intensify the military assault against Iran. Into the weekend, some geopolitical risk has been taken off the table as participants await updates on the situation, and how the state of play will be different upon the reopening.
EQUITIES
CLOSES: SPX +0.06% at 7,413, NDX -1.15% at 28,128, DJI +0.45% at 51,947, RUT -0.28% at 2,932.
SECTORS: Real Estate +2.39%, Materials +1.46%, Consumer Staples +0.94%, Financials +0.86%, Health +0.63%, Communication Services +0.43%, Industrials +0.35%, Energy +0.26%, Utilities +0.18%, Consumer Discretionary +0.15%, Technology -0.90%.
EUROPEAN CLOSES: Euro Stoxx 50 +1.23% at 6,287, Dax 40 +1.33% at 25,092, FTSE 100 +0.94% at 10,739, CAC 40 +0.88% at 8,372, FTSE MIB +0.95% at 51,802, IBEX 35 +1.65% at 19,586, PSI -0.40% at 9,215, SMI +0.92% at 14,346, AEX +0.31% at 1,090
STOCK SPECIFICS
- Intel (INTC): Topped earnings expectations with strong guidance; saw fastest revenue growth in years.
- American Express (AXP): Revenue and FY profit guidance missed.
- Oracle (ORCL): Received a USD 3.31bln 5-year US Navy software contract; could be raised to USD 7bln.
- SLB (SLB): Earnings beat.
- Verizon Communications (VZ): Adjusted EPS and postpaid phone net additions beat; revenue missed.
- Charter Communications (CHTR): Bigger-than-expected Q2 broadband customer decline.
- SAP (SAP): Strong earnings and cloud growth.
- Edwards Lifesciences (EW): Adjusted EPS and revenue topped expectations.
- Tenet Healthcare (THC): Earnings beat; raised guidance.
- Qualcomm (QCOM) said to inform customers that prices will go up by double-digit percentage; can no longer absorb increasing costs, according to reports.
- Alphabet’s (GOOGL) Waymo reportedly exploring options to exit its Uber (UBER) partnership, with the relationship between the two tech groups souring amid an intense lobbying battle over the future of robotaxis, reports FT.
FX
The dollar was pressured on a couple of geopolitical updates that sent oil prices and US yields lower. Energy was already pressured, perhaps on profit-taking or on TACO anticipations, before extending on 1) Pakistan reportedly looking to resume US-Iran talks, in a push by China, and 2) Trump noting Xi and Putin have said they would not sell weapons to Iran. That said, further USD downside may be limited until more concrete efforts occur, with the Reuters report on Pakistan adding that sources cautioned that the obstacles to any talks with the US remain high. Meanwhile, Trump held a cabinet meeting today to discuss whether to conduct a massive strike on Iran.
US data saw mixed Flash S&P Global PMIs for July. Manufacturing unexpectedly fell to 53.8 (exp. 54.5) from 53.9 while Services came in above forecasts at 53.6 (exp 51.0, prev. 51.2), leaving the composite higher at 53.6 from 51.9; little reaction was seen.
Barclays’ month-end rebalancing model indicated weak USD buying against most majors by month-end. The model suggested moderate bearish signals for CAD and GBP.
Antipodes were the top beneficiaries from the lower oil and higher gold price environment, with NZD paring some of its recent underperformance. Meanwhile, JPY was little changed as reports continue to lean on the BoJ keeping rates unchanged in July; in line inflation for June sparked a muted reaction in USD/JPY.
EUR was slightly firmer on the USD weakness. In the background, some support came via PMIs in the region. France, Germany, and the EZ all topped the composite gauge; however, the EZ survey period doesn’t include the recent escalation that has seen Brent return above USD 100/bbl in recent sessions.
USA DATA RELEASES
US PMIs Mixed But Still Signal Accelerating Economic Growth In Q3
Friday, Jul 24, 2026 – 09:53 AM
With ‘hard data’ trending weaker, today’s preliminary July PMIs offer the first glimpse at whether the reignition of the Iran War is weighing on ‘soft’ survey sentiment in the US economy.
The data was mixed (as always) with Manufacturing disappointing while Services accelerated more than expected:
- Flash US Manufacturing PMI: 53.8 (June: 53.9). 4-month low.
- Flash US Services PMI Business Activity Index: 53.6 (June: 51.2). 8-month high.

“US businesses reported a good start to the third quarter,” said Chris Williamson, Chief Business Economist at S&P Global Market Intelligence, adding that “the ‘flash’ PMI survey data broadly consistent with GDP growing at an annualized 2.0% against a 1.2% pace signalled for the second quarter.”

The month saw an encouraging return to hiring by companies, with employment rising for the first time in three months.
“However, some of this improvement may prove shortlived as July saw hospitality spend boosted by the FIFA World Cup and USA 250 anniversary activities,” warned Williamson.
It was also worrying – though not unexpected – to see manufacturing growth weaken as some of the stock building seen in prior months showed signs of fading.
Instead, July saw a concerning intensification of supply chain delays and accompanying renewed upturn in price pressures, constraining growth and subduing demand.

But Williamson concludes on a more worrisome note, saying that “events over recent days in the Middle East will have only further exacerbated these supply chain and price worries” raising downside risks to the near-term outlook for the economy, “hinting that July’s upturn may not be the start of an improving trend.”
END
US New Home Sales Rise For First Time In 3 Months As Prices Near 5-Year Lows
Friday, Jul 24, 2026 – 10:13 AM
With Case-Shiller reporting existing home price declines in half of America’s largest cities, and despite a weaker homebuilder confidence print, New Home Sales were expected to rebound from April and May’s ugly declines… and they did, but only very modestly.
New home sales rose 1.6% MoM (+4.8% MoM exp) marking the first rise in three months, but May’s 7.3% MoM decline was revised up to a mere 4.3% MoM decline.
However, this bounce was not enough to get annual sales positive (still down 5.6% YoY)…

Overall, new home sales have really gone nowhere for four years (but on the bright side, they are not as bad as existing- and pending-home-sales)…

It seems lower mortgage rates (admittedly having risen for the last month) did nothing to help move new home sales, and now they are on the rise again…

Median new home prices dropped for the second month in a row, back near their lowest levels since 2021…

Unfortunately, the decline in price is more than offset by the recent reacceleration in mortgage rates, leaving Trump’s affordability push dead in the water.
USA ECONOMIC REPORTS
Authorities Arrest Fugitive Behind Alleged $547 Million Medicare Fraud
Thursday, Jul 23, 2026 – 08:05 PM
Authored by Naveen Athrappully via The Epoch Times,
A man on the FBI’s Most Wanted Fraudsters list, accused of a scheme to defraud Medicare of $547 million, was arrested by authorities on Monday.

The foreign national, Khalid Satary, 54, owned and operated multiple diagnostic testing laboratories in the United States between 2016 and 2019 that billed Medicare for “expensive and medically unnecessary genetic tests,” the Department of Justice (DOJ) said in a July 21 statement.
Satary is accused of conspiring with several patient recruiters and telemarketing services to generate unnecessary cancer genetic test samples that were reimbursed by Medicare at the rate of $10,000 to $20,000 per sample.
To run the operation, Satary allegedly paid millions of dollars in bribes and illegal kickbacks to patient recruiters and doctors.
The defendant was initially indicted in 2019. However, Satary was later released on bond, with the condition that he doesn’t work in the healthcare sector. While on bond, Satary allegedly conspired with labs in Texas to continue submitting fraudulent genetic testing claims to Medicare.
A federal arrest warrant was issued against him in December 2022. However, Satary failed to appear for a court hearing and was believed to have escaped the United States. On July 20 this year, the defendant was arrested in the Middle East with a fake Mexican passport using a fake name. He was then transferred to U.S. authorities.
The Most Wanted Fraudsters list was announced by FBI Director Kash Patel last month. The White House Task Force to Eliminate Fraud partnered with the FBI to compile the list, according to a June 19 X post from Vice President JD Vance, the task force’s chairman.
The task force was established through a March 16 executive order signed by President Donald Trump, which said criminals and other individuals were exploiting various benefit programs intended to provide American citizens with a safety net.
Trump ordered the task force to “coordinate and accelerate a comprehensive national strategy to stop fraud, waste, and abuse within Federal benefit programs.”
One of those on the list, Said Abdullahi Ereg, surrendered to law enforcement on June 10, according to the FBI and federal prosecutors. Ereg is accused of laundering millions of dollars from a program that aimed to feed needy children during the COVID-19 pandemic.
Another individual on the list, Herbert Leon Kimble, accused of $1.2 billion Medicare fraud, was arrested on June 11 in the Philippines.
In its latest statement, the DOJ said that Satary has been charged with various fraud-related crimes, conspiracy to commit money laundering, and paying bribes and illegal healthcare kickbacks. He faces a multi-decade prison term if convicted.
“The arrest of Khalid Ahmed Satary and return to the U.S. is the third Most Wanted Fraudster capture from this FBI and our partners in just five weeks—continuing the historic run of success for this new initiative,” Patel said in the statement.
“This is another subject who exploited a program dedicated to helping our most vulnerable and instead stole for himself. Satary has been on the run since 2022, but we got him thanks to great work and coordination from the interagency and our overseas partners.”
The Epoch Times was unable to reach Satary’s legal representative.
According to the FBI’s website, Satary is one among nine individuals currently mentioned on the Most Wanted Fraudsters list.
One of the individuals is a naturalized U.S. citizen of Somali origin wanted for allegedly being part of a fraud scheme that exploited the federal Child Nutrition Program during the COVID-19 pandemic.
Another individual, a female from Jamaica, is linked to a scheme that fraudulently obtained more than $32 million from COVID-19 relief funds.
A third person, a U.S. citizen, is wanted for alleged involvement in a mail fraud scheme in Georgia. The man allegedly defrauded at least $10 million from his victims.
Meanwhile, on June 23, the DOJ announced that a coordinated enforcement action involving a whole-of-government approach led to the arrests of 455 individuals for their alleged role in healthcare fraud and opioid abuse schemes.
The schemes, which involved more than $6.5 billion in false claims, posed “significant patient harm,” including death. Among the arrested were two Estonians connected to a $10.6 billion fraud scheme.
END
Trump’s Tariff Wall Returns With Forced-Labor Duties On 60 Countries
Friday, Jul 24, 2026 – 07:20 AM
The Trump administration imposed Section 301 tariffs on 60 countries accused of failing to “impose and effectively enforce” bans on goods produced with forced labor, according to a new notice from the Office of the U.S. Trade Representative.
Goods from countries including Canada, Mexico, India, and the UK will face a 10% duty, while imports from the European Union and Taiwan will be taxed at least 10%. Products from Japan, South Korea, and Switzerland will face levies of at least 12.5%, with dozens of other countries subject to a flat 12.5% tariff.
Fuel, food, fertilizer, and products already covered by sector-specific tariffs, including automobiles, metals, and pharmaceuticals, will be exempt. Goods qualifying under the US-Mexico-Canada trade agreement will also be excluded.
The tariffs take effect Friday at 12:01 a.m. New York time, marking the biggest move yet to restore President Trump’s protectionist tariff wall since his earlier levies were struck down by the Supreme Court. After that setback, the president instituted a 10% global import tax, which expires Friday. The timing of the new levies ensures there will be no gap between the two.
“President Trump recognizes that decades of moral suasion have not eradicated forced labor from global supply chains. The United States has had a forced labor import ban for nearly a century, and rigorously enforces it; it’s well past time for our trading partners to do the same,” Trade Ambassador Jamieson Greer wrote in a statement.
Greer said, “Today’s action will begin to correct what is both a human rights abuse and a distortive trade practice to improve the welfare of workers everywhere. I am encouraged by the trading partners who have moved quickly to adopt forced labor import prohibitions, and look forward to ensuring their effective enforcement.”
Bloomberg noted that the new Section 301 levies are expected to lift the average effective U.S. tariff rate by just 0.1 percentage point to roughly 10.7%. That remains below the 13.5% rate in place before the Supreme Court’s February ruling.
Ernst & Young trade expert Blake Harden was quoted by Bloomberg as saying that the Trump administration is not yet done with tariffs or with disrupting the status quo.
“There’s still a lot of uncertainty hanging out there. We still have the opportunity for a lot of tariffs this year,” Harden said. “Prior to this week there was sort of just a bit of a lull and maybe it felt like there was more certainty than there is. There’s this thing I keep telling folks: There’s a lot to come still as we get into this year.”
Here’s a first take from Goldman Sachs chief economist Jan Hatzius, who said the new levies should have little effect on the overall US effective tariff rate:
BOTTOM LINE: The White House released the final version of the Sec. 301 tariffs it will use to replace the current 10% Sec. 122 global tariff, which expires July 24. The details of the release suggest there should be little change to the overall US effective tariff rate. Some individual trading partners will see their ETRs move higher or lower, but generally not by much more than 1pp in either direction.
1. The White House announced a new set of tariffs to replace the current 10% global tariff under Sec. 122 of the Trade Act of 1974, which expires July 24. Following a Sec. 301 investigation into forced labor, the US Trade Representative (USTR) has released a final list of tariffs covering trading partners accounting for 95% of US imports. There would be four levels of tariffs: a 10% cap (inclusive of the preexisting MFN tariff), a 10% add-on tariff, a 12.5% cap, and a 12.5% add-on tarif
2. While the prior version of these tariffs, released in June, would have raised the US effective tariff rate (ETR) slightly (+0.25pp), the final version just released should leave the ETR essentially unchanged (-0.1pp) because of four revisions USTR made: (1) the tariff rate for several large trading partners was changed to a cap (including the MFN rate) of 10% (EU and Taiwan) or 12.5% (Japan, Korea, and Switzerland) rather than a tariff on top of the MFN rate; (2) several trading partners including Argentina, Bangladesh, Cambodia, India, Malaysia, and the UK will face a 10% rate, rather than the 12.5% proposed in the earlier version (Taiwan moves from 12.5% add-on to a 10% maximum, like the EU); (3) product exclusions for specific trading partners in recent trade deals are now reflected, and (4) some new products were added to the exclusion list for all trading partners. In general, most of the trading partners getting the lower 10% rate in the final version have a recent trade deal with the US.
3. The change in each trading partner’s tariff rate compared with the expiring Sec. 122 policy would be modest, with only a few instances of changes greater than 1pp. The EU (-0.9pp), Indonesia (-0.9pp), and Korea (-0.7pp) would see the largest declines in their US ETR as a result of the shift from Sec. 122 to the new Sec. 301 rates, while Turkey (+1.5pp), China (+1.4pp), the Philippines (+0.8pp), Vietnam (+0.8pp), Singapore (+0.6pp) and Thailand (+0.6pp) would see the largest increases.
4. The USTR did not announce any new actions related to the other Sec. 301 investigation into 16 trading partners on manufacturing overcapacity, which was started around the same time as the just-concluded investigation. While this could still come in the next few weeks, we still believe that whatever tariffs come out of that second investigation won’t take effect until after the midterm election, and we continue to expect a roughly unchanged US ETR through the end of 2026.
Meanwhile, the US Customs and Border Protection has issued refunds to importers after the Supreme Court invalidated Trump’s previous tariff regime.
ROBERT H..
 | |||
This is a warning sign!!!!!
The bond market is officially flashing red, and the warning sirens are growing louder by the day. The United States 10 Year Treasury yield has just surged above 4.7% for the first time since January 2025.
This is not just a minor technical fluctuation; it is a massive structural warning sign. The market is aggressively repricing the cost of capital, and it is doing so in the face of a deteriorating macroeconomic backdrop.
KING NEWS
| The King Report June 25, 2018 Issue 5784 | Independent View of the News |
| Trump threatens more attacks on Iran after hoodies join war – BBG 9:14 ET Axios: Trump “close” to decision on “massive attack” on Iran President Trump told Axios on Thursday that he is seriously considering restarting major combat operations in Iran — including strikes that would be bigger than the ones carried out during “Operation Epic Fury.”… https://www.axios.com/2026/07/23/trump-axios-iran-interview @realDonaldTrump: A year ago the United States of America attacked, very powerfully, the Houthis, for their interference with commerce and trade, by shooting at ships. Since that time, and during our conflict with Iran, they have acted very responsibly. Unfortunately, now they are starting up again, shooting at two Saudi Arabian ships last night. Please let this TRUTH serve to represent that if they do this again, the U.S. will hold Iran responsible, in that the Houthis are a Surrogate and/or Proxy of Iran, and major military punishment will be inflicted upon Iran and, of course, the Houthis, themselves, who I am very disappointed with in that they have, until now, acted very professionally and smart... 8:16 AM ET Alphabet Falls as $205 billion Spending Plan fuels AI cost – BBG 944 ET Tesla was -13 5% at 10:34 ET. Google was -7.3% at 10:26 ET. The DJIA opened -660.90, -1.3%. The SOX Index opened -1.4%. But equity jockeys must always buy something and hold something. So, they bought semiconductors. The SOX Index was +28.866 at 10:40 ET. IBM was -3.19% at 9:31 ET but rallied to a modest gain by 10:17 ET on short covering. USUs were -25/32 at 9:13 ET. The 2-year note hit 4.367%. The 10-year hit 4.711%. The 30-year hit 5.185%. September Gasoline hit +2.46% at 10:19 ET; and September WTI Oil hit +6.9% at 11:20 ET. September Brent Oil hit 101.20, +7.5% at 11:20 ET. ESUs traded moderately lower early on Wednesday night due to disappointment with Google, Tesla, and IBM after-hour trading. A rally commenced near 19:28 ET that took ESUs to the daily high of 7549.50 (+9.25) at 21:00 ET. ESUs then did an elongated 5-wave decline to a daily low of 7411.75 (-128.50) at the 11:30 ET European close. The post-European close counter move took ESUs to 7457.50 at 12:39 ET. ESUs then dribbled lower in very lame action and hit 7420.00 at 15:47 ET. The illegal but routine late manipulation forced ESUs to 7456.00 at 16:03 ET. Equity jockeys are loath to sell stocks due to years of conditioning. However, saner angels won’t buy, let alone chase stocks because they see the Winds of War in the Middle East, the storm in energy commodities, and Mr. Bond’s anger. And let’s not forget about new sheriff, Ken Warsh. @RapidResponse47: Trump: “We’re doing very well against the Islamic Republic of Iran—we’re doing extremely well. They would like to do something, but I say they’re not ready yet. They need more of the same… they’ve got some evil intentions. We cannot let them have a nuclear weapon.” https://x.com/RapidResponse47/status/2080364605994316214 Positive aspects of previous session The illegal but encourage late ESU manipulation greatly truncated equity losses. Negative aspects of previous session The 2-year note yield hit 4.366%. USUS were -25/32 at 9:13 ET. The NY Fang+ Index tumbled. The DJIA declined smartly. Gasoline, oil, and diesel fuel rallied sharply. The SOX Index fell smartly after early buying. Ambiguous aspects of previous session How long can equity jockeys insouciantly dismiss negative fundamentals, notably higher yields? Precious metals fell sharply – but it was due to higher rates. First Hour/Last Hour NYSE Action [S&P 500 Index]: 1st Hour: Up; Last Hour: Up Pivot Point for S&P 500 Index [above/below indicates daily trend to day traders]: 7411.47 Previous session (S&P 500 Index) High/Low: 7450.12 (9:42 ET); 7376.00 (11:31 ET) Thirty Years Later, FBI Record Exposes a Missing Piece of the TWA Flight 800 Investigation Two days after TWA Flight 800 exploded off Long Island in July 1996, killing all 230 people aboard, FBI headquarters had received faxes from Cairo claiming credit. That detail appears near the bottom of a July 19, 1996, communication from the FBI’s New York Field Office. Marked “Immediate,” it was sent to the FBI director, every field office, and every legal attaché while agents were still pursuing several possible explanations for the disaster… https://redstate.com/ben-smith/2026/07/23/thirty-years-later-fbi-record-exposes-a-missing-piece-of-the-twa-flight-800-investigation-n2204661 CNN: America was in a high state of alert when TWA 800 crashed. A series of terrorism-related events in the years, months and weeks before the flight went down, and even one incident just days afterward, led many to suspect terrorism was to blame… https://www.cnn.com/2014/07/14/us/twa-flight-800-five-things Numerous eyewitnesses, including ex-military types, claimed they saw an object with a tracer strike TWA Flight 800. However, the Clinton Administration covered up the terrorist attack because Slick Willy & Friends did NOT want to get involved or dirty ahead of the 1996 Election. TWA 800—It’s What They Don’t Say That Tells the Tale The Memoirs of the Culpable Give the Game Away Given the gravity of the situation in the run-up to the 1996 presidential election, and the fact that TWA 800 was voted number one news story of that year, one would have expected Clinton and his advisors to feature this saga in their respective memoirs. Yet save for the self-serving Richard Clarke, they did not, not at all. So suffocating was the shroud of silence that cloaked the TWA 800 investigation that the individuals most deeply involved all but refused to talk about it… The 56 certified NTSB witnesses who claimed to see an object ascend from the horizon all traced its provenance to the Atlantic Ocean, south of Long Island. The Sound is north of Long Island… the radar data showed an unknown object approaching TWA 800 just before it blew up. It was the radar data, not the eyewitness reports, that prompted Clarke’s (Clinton NSC official) meeting.. Clarke attributed the “17,000 feet” reference to the FAA, but the FAA knew the plane climbed no higher than 13,800 feet. It was the CIA that would imagine the noseless aircraft climbing to 17,000 feet after an inexplicable fuel tank explosion… https://jackcashill.substack.com/p/twa-800its-what-they-dont-say-that After the close, Intel reported Q2 EPS of .42, .22 exp; Revenue of $16.13B, $14.43B exp; Negative $8.42B Q2 Cash Flow, $-1.05B exp; sees Q Sales of $15.8B-$16.8B, $15.06B exp; Q3 Adj EPS .38, .27 exp; INTC soared 13.46% in after-hour trading. Fed Balance Sheet: +$4.35B on T-Bills +$5.18B; Reserves: -$80.572B 2-Year Note vs. Fed Funds Target Rate, quarterly 2-Year Note vs. Fed Funds Target Rate, monthly To break virulent inflation, Volcker in 1980 and Powell in 2203 put Fed Funds above the 2-Year Note yield. Except for these two anomalies, the ‘go along to facilitate Congress and Wall Street’ Fed has FOLLOWED the 2-Year Note yield. Will Warsh follow or lead the 2-Year Note yield? Pundits and ‘experts’ are pleading with the Fed to NOT hike its Fed Funds Rate because ‘it will hurt the economy.’ The rates that impact the economy, mortgage, lending, and financing rates are already moving higher. The Fed Funds rate mostly impacts levered firms, i.e. Wall St and big banks, which live and die with ‘cost to carry.’ PS – The 30-year mortgage is now 6.85%; it was 6.10% on March 4 per BBG. @realDonaldTrump: Please let this statement serve to represent, until further notice, that from this point forth, any and all damages done to Ships, Cargo, or anything related thereto, will be paid for by Iranian Money that the United States has in its possession, and controls. These damages may be very substantial but, nevertheless, this is the fair and equitable thing to do,,, 6:04 PM July 23, 2026 Trump admin announces between 10% and 12.5% tariffs on 60 countries over forced labor imports Senior administration officials said Thursday that countries that have begun implementing a forced labor prohibition or law on their books will be hit with 10% duties, while those that haven’t will receive an import tax of 12.5% — with the levies taking effect at 12:01 a.m. on July 24… https://nypost.com/2026/07/23/us-news/trump-admin-announces-10-to-12-5-tariffs-on-60-nations-over-forced-labor-imports/ Iran rejected a cease-fire proposal from President Trump that was carried to Tehran by the Iraqi prime minister, according to Iranian and Iraqi officials – NYT (Who is it that ‘badly wants a deal?’) Donald Trump Jr.’s Investment Firm Posts Staggering Returns of 200% – NYT https://www.nytimes.com/2026/07/22/business/donald-trump-jr-1789-capital.html Today –The usual suspects will play for the Friday Rally. They are buying ESUs and NQUs on Thursday night for the expected rally even though the Iran situation is worsening. Saner angels do NOT want significant exposure over a possibly troubling weekend. So, it looks like stocks will start higher; the rest of the day is a crapshoot. But beware of late liquidation ‘down to sleeping levels’ for the week. For the first time since April 7, the &P 500 Index closed substantially (63.49) below its 50-day moving average of 7471.79. On June 26, the S&P closed at 7354.02 with a 50-DMA of 7363.43. The ‘Game’ today for bulls will be to force the S&P 500 Index back above its 50-DMA. ESUs are +3.50; NQUs are +26.25; USUs are +1/32; WTI Oil is -0.40; Gasoline is -2.25 at 20:18 ET. ESUs and NQUs sank from much higher levels because Intel fell from 113.70 to 101.25 at 18:32 ET. Expected Economic Data: July S&P Global US Mfg. PMI 54.4, Services PMI 51.5, Composite PMI 51.8; June New Home Sales 606k S&P 500 Index (7408.30 close) – BBG trading model Trender and MACD for key time frames Monthly: Trender and MACD are positive – a close below 6248.85 triggers a sell signal Weekly: Trender and MACD are positive – a close below 6930.55 triggers a sell signal Daily: Trender and MACD are negative – a close above 7548.58 triggers a buy signal Hourly: Trender and MACD are negative – a close above 7437.06 triggers a buy signal S&P Index 50-day MA: 7472; 100-day MA: 7173; 150-day MA: 7082; 200-day MA: 7002 DJIA 50-day MA: 51,404;100-day MA: 49,647; 150-day MA: 49,463; 200-day MA: 48,874 (Green is positive slope; Red is negative slope) @OANN: A Secret Service agent assigned to Vice President JD Vance’s security detail has reportedly been placed on leave amid an investigation into an alleged leak of information about the vice president’s location and travel schedule… Secret Service says threat environment is highest ‘we’ve ever seen’ – There have been about 10,000 cases involving threats to government officials… 40% increase in such cases over the same period last year… https://www.cnbc.com/2026/07/22/secret-service-threat-trump-white-house-drones.html Until the left and Dems suffer the violence and threats that the right and Republicans have experienced, nothing of consequence will be done. | |
SWAMP STORIES FOR YOU TONIGHT
Waste Of The Day: Education Fraud Sweeps Nation
Thursday, Jul 23, 2026 – 09:45 PM
Authored by Jeremy Portnoy via RealClearInvestigations,
Topline: Since 2019, school districts across 24 states and Puerto Rico have lost $225 million to fraud confirmed by the U.S. Department of Education inspector general’s semiannual report to Congress. No more than $67 million has been recovered.
Key facts: Open the Books and the State Financial Officers Foundation documented 74 instances of confirmed school fraud, averaging over $3 million each. There are far more that have gone unprosecuted or undetected.
Florida and Illinois schools each had the most instances of fraud with 11.
Indiana lost the most money – $44 million – due to inflated attendance numbers that increased state funding to two schools. The schools’ founder then allegedly sent the money to companies he owned. The schools closed in 2019, and four alleged conspirators were charged in 2024.

At Broward County Public Schools in Florida, information officer Anthony Hunter allegedly used district funds to buy $17 million worth of school supplies from a friend’s business, ignoring the competitive bidding process. In return, the friend hired Hunter and his son to work a security job and sold Hunter a house for $150,000 below market value, state prosecutors claim
Chicago Public Schools received $1 million of federal grants meant for Native American students, using an application that included more than 1,000 students of South Asian descent. The district was unable to verify how many students were actually in the program, and agreed to repay the money.
Fraud arguably hits small school districts the hardest because they have fewer budgetary resources to begin with. When Janis Bucknor, former head of Community Preparatory Academy in California, admitted to stealing $3 million from the school over five years, it amounted to one-third of all the school’s state and federal funding.
Bucknor spent $220,600 of the money on Disney vacations and also funded her internet shopping and private school tuition for her kids. She was sentenced to three years of home detention and ordered to repay the money.
Summary: The government loses hundreds of billions of dollars to fraud annually, but redirecting money away from children’s education is especially egregious.
The #WasteOfTheDay is brought to you by the forensic auditors at OpenTheBooks.com
END
Historic Buffalo Church Torches Twice In Four Days Following Sale To Islamic Group
Friday, Jul 24, 2026 – 10:20 AM
Authored by Steve Watson via Modernity News,
A 140-year-old Catholic church in Buffalo has been deliberately set on fire for the second time in four days, the third blaze to hit the site this year. Investigators confirmed arson.
The property was sold years earlier by the Diocese of Buffalo to a company affiliated with the Downtown Islamic Center, which planned to turn the historic complex into a mosque.
Christian heritage keeps vanishing while officials scramble over “securing” the site they already allowed to fall into the wrong hands.
The former St. Ann’s Church and Shrine at 651 Broadway, built in 1886, suffered a fire around 5:45pm on Tuesday, July 21. Buffalo Fire Department crews contained it. Officials ruled the cause arson. It came just four days after a three-alarm blaze on Friday, July 17, that began in the rear of the structure.
In January, a four-alarm fire had already gutted the adjacent former school building, causing an estimated $600,000 in damage.
The central fact is straightforward. In November 2022 the Diocese of Buffalo sold the entire complex – church, school, and convent – for $250,000 to Buffalo Crescent Holdings, Inc. The buyer is affiliated with the Downtown Islamic Center.
The stated plan was to convert the property into a downtown Islamic center. The building had stood vacant and deteriorating for years after parish activities ended in 2013. Investigations continue. At this time, no public link to the owners has been reported.
Local officials are now expressing frustration at the predictable result. Buffalo Common Council Member and Majority Leader Leah Halton-Pope said she had spoken with the administration that same afternoon about securing the site.
“I literally just had a conversation this afternoon with a member of the administration asking what are we going to do about it and stressing that something has to be done over there to secure it, and then said it’s probably going to be set on fire again, but I just didn’t think it would happen today,” she stated.
She called the repeated fires “disheartening” for nearby homeowners already dealing with smoke and instability. “I know it’s been said that it was arson, which is to be expected.”
Bernice Radle, executive director at Preservation Buffalo Niagara, was blunt: “The St. Ann’s property owners are unresponsive and refuse to secure the building. Preservation Buffalo Niagara calls on the City of Buffalo to pull out all the stops to wrestle this landmark church from its negligent absentee owner. Enough is enough!”
Mayor Sean Ryan’s office said the administration is “actively exploring legal options to compel the owner to fulfill the responsibility to properly maintain and secure the building.”
The Department of Permits and Inspections will continue visits. Earlier this year, after the school fire, the mayor had already stated that taxpayers would not cover demolition costs estimated at $2 million. The owners have indicated they lack funds for upkeep while still aiming to develop the property as a community center for Buffalo’s Bengali community.
This fits a sustained pattern of historic Christian churches burning across the West, often with causes left vague, suspects uncaught, and preservation efforts blocked.
In New York City itself, the 1863 South Bushwick Reformed Church in Brooklyn was gutted by confirmed arson in June. The FDNY ruled it intentional, and a person of interest was seen fleeing.
Pastor James E. Steward II said the loss struck generations: “It was more than just a building. It’s lives and generations of lives that have been touched.”

NYC Historic Church TORCHED in Confirmed Arson — City REJECTS Save Plan As Demolition Ordered
FDNY rules South Bushwick landmark intentionally set
The congregation put forward a restoration plan based on an independent engineer’s assessment. The New York City Department of Buildings rejected it. Demolition was ordered.
Just months earlier, a 138-year-old church in Astoria, Queens, suffered a five-alarm blaze whose cause was listed as “unknown.” Rebuild proposals were rejected. The structure was demolished within weeks.

The same template appears across the border and overseas. In Canada, arsons against churches more than doubled after 2021. A Macdonald-Laurier Institute report found fewer than 4 percent of cases resulted in charges. Over 100 churches have been burned or vandalized since then, including the 1893 church in Saint-Romain, Quebec, confirmed as arson in April. Officials treat most as isolated or unresolved.

Yet Another HISTORIC CHURCH TORCHED In Canada
Arson wave targets christian heritage
n France, nearly 50 fires or arson attempts struck churches and Christian sites in a single recent year – a sharp rise. A Christian religious building disappears every two weeks through fire, collapse, or deliberate damage.
In June a 17th-century chapel in Brittany lost most of its roof. The same day a historic cloister attached to a cathedral in Condom suffered heavy damage to its roofing and archives.

Yet MORE Churches Torched; Sustained Attack On Christianity Gathers Pace
Two French heritage sites ravaged as Christian landmarks face relentless targeting and
Earlier the Église Saint-Cyriaque in Montenach was gutted. Authorities routinely cite vegetation, wind, or accident. The cumulative effect is the steady erasure of Christian landmarks.

Yet Another Historic Church GUTTED By Raging FIRE
Officials blame ‘brush fire’ amid surge in attacks
 modernity
In the United Kingdom the contrast is sharper. A historic London church, the Kings Hall Methodist Church in Southall, burned to the ground in February amid near-total government silence.
Churches face more than ten crimes every day. Figures show hundreds of attacks, including arson, over recent years.


Historic London Church BURNS To The Ground Amid SILENCE From Government
Another blaze engulfs a century-old place of worship, fueling suspicions of targeted
Yet when a security incident occurred at a Manchester mosque during Ramadan, Prime Minister Keir Starmer expressed outrage, thanked emergency services, and announced tens of millions in taxpayer funding for mosque and Muslim community security. No equivalent urgency followed the church fires.

UK PM Starmer OUTRAGED Over Mosque ‘Incident’ But Silent As Churches Burn To The Ground
Stark double standards amid escalating attacks on Christian sites across the UK
The pattern is consistent from Brooklyn to Buffalo to Quebec to Brittany to London. Historic churches burn. Causes are ruled arson or left “under investigation.” Suspects are rarely identified. Preservation plans are rejected. Demolition follows.
Selective official outrage appears only when other sites are involved. Christian heritage is treated as expendable while demographic and cultural shifts accelerate under open-border policies that prioritize new arrivals over the continuity of the civilization that built these landmarks.
The 1886 structure in Buffalo still stands, damaged but not yet leveled. Investigations continue. The owners remain unresponsive on security. Local residents live with the repeated smoke and uncertainty. Across the West the same quiet attrition continues – one historic flame at a time.
Your support is crucial in helping us defeat mass censorship. Please consider donating via Locals or check out our unique merch. Follow us on X @ModernityNews.
GREG HUNTER..


