
GOLD: $1325.20 DOWN $8.20 (COMEX TO COMEX CLOSINGS)
Silver: $16.36 UP 6 CENTS (COMEX TO COMEX CLOSINGS)
Closing access prices:
Gold $1326.50
silver: $16.39
For comex gold:
APRIL/
NUMBER OF NOTICES FILED TODAY FOR APRIL CONTRACT:0 NOTICE(S) FOR nil OZ.
TOTAL NOTICES SO FAR 595 FOR 59500 OZ (1.8506 tonnes)
THE COMEX IS OUT OF GOLD
For silver:
APRIL
0 NOTICE(S) FILED TODAY FOR
nil OZ/
Total number of notices filed so far this month: 19 for 90,000 oz
XXXXXXXXXXXXXXXXXXXXXXXXXXXXXX
Bitcoin: BID $6738/OFFER $6841: DOWN $1(morning)
Bitcoin: BID/ $6710/offer $6810: DOWN $29 (CLOSING/5 PM)
end
Let us have a look at the data for today
xxxxxxxxxxxxxxxxxxxxxxxxxxxxxxxxxxxxxxxxxxxxxxxxxxxxxxxxxxxxxxxxxxxxxxxxxx
In silver, the total open interest SURPRISINGLY AND SHOCKINGLY ROSE BY 8453 contracts from 232,682 RISING TO 241,135 DESPITE YESTERDAY’S 11 CENT FALL IN SILVER PRICING. TODAY WE SET A NEW ALL TIME RECORD FOR SILVER OPEN INTEREST AND EACH AND EVERY TIME, THE PRICE OF SILVER WHEN THE RECORD WAS SET IS LOWER. OBVIOUSLY, WE HAD ZERO COMEX LIQUIDATION. HOWEVER WE ALSO WITNESSED ZERO COMEX SHORT COVERING AND THUS THE REASON FOR THE RAID TODAY..TRYING TO SHAKE SOME OF THE SILVER LEAVES FROM THE SILVER TREE. WE WERE AGAIN NOTIFIED THAT WE HAD ANOTHER HUMONGOUS SIZED NUMBER OF COMEX LONGS TRANSFERRING THEIR CONTRACTS TO LONDON THROUGH THE EFP : 3962 EFP’S FOR MAY AND ZERO FOR ALL OTHER MONTHS AND THUS TOTAL ISSUANCE OF 3962 CONTRACTS. WITH THE TRANSFER OF 3962 CONTRACTS, WHAT THE CME IS STATING IS THAT THERE IS NO SILVER (OR GOLD) TO BE DELIVERED UPON AT THE COMEX AS THEY MUST EXPORT THEIR OBLIGATION TO LONDON. ALSO KEEP IN MIND THAT THERE CAN BE A DELAY OF 24-48 HRS IN THE ISSUING OF EFP’S. THE 3962 CONTRACTS TRANSLATES INTO 19.810 MILLION OZ ON TOP OF THE RISE IN OPEN INTEREST IN SILVER AT THE COMEX AND THE STRONG AMOUNT OF SILVER OUNCES STANDING FOR APRIL COMEX DELIVERY.
ACCUMULATION FOR EFP’S/SILVER/J.P.MORGAN’S HOUSE OF BRIBES, / STARTING FROM FIRST DAY NOTICE/FOR MONTH OF APRIL:
8994 CONTRACTS (FOR 4 TRADING DAYS TOTAL 8994 CONTRACTS) OR 44.97 MILLION OZ: AVERAGE PER DAY: 2249 CONTRACTS OR 11.243 MILLION OZ/DAY
TO GIVE YOU AN IDEA AS TO THE HUGE SUPPLY THIS MONTH IN SILVER: SO FAR THIS MONTH: 44.97 MILLION PAPER OZ HAVE MORPHED OVER TO LONDON. THIS REPRESENTS AROUND 6.42% OF ANNUAL GLOBAL PRODUCTION
ACCUMULATION IN YEAR 2018 TO DATE SILVER EFP’S: 763.46 MILLION OZ.
ACCUMULATION FOR JAN 2018: 236.879 MILLION OZ
ACCUMULATION FOR FEB 2018: 244.95 MILLION OZ
ACCUMULATION FOR MARCH 2018: 236.67 MILLION OZ
RESULT: WE HAD A GIGANTIC (ATMOSPHERIC) SIZED GAIN IN COMEX OI SILVER COMEX OF 8453 DESPITE THE 11 CENT FALL IN SILVER PRICE. WE ALSO HAD ANOTHER STRONG SIZED EFP ISSUANCE OF 3962 CONTRACTS WHICH EXITED OUT OF THE SILVER COMEX AND TRANSFERRED THEIR OI TO LONDON AS FORWARDS. SPECULATORS CONTINUED THEIR INTEREST IN ATTACKING THE SILVER COMEX FOR PHYSICAL SILVER . FROM THE CME DATA 3962 EFP’S FOR THE MONTH OF MAY WERE ISSUED FOR A DELIVERABLE FORWARD CONTRACT OVER IN LONDON WITH A FIAT BONUS. WE GAINED A HUMONGOUS 12,415 OI CONTRACTS ON THE TWO EXCHANGES: i.e. 3962 open interest contracts headed for London (EFP’s) TOGETHER WITH AN INCREASE OF 8453 OI COMEX CONTRACTS. AND ALL OF THIS HAPPENED WITH THE FALL IN PRICE OF SILVER OF 11 CENTS AND A CLOSING PRICE OF $16.30 WITH RESPECT TO WEDNESDAY’S TRADING. YET WE STILL HAVE A GOOD AMOUNT OF SILVER STANDING AT THE COMEX FOR DELIVERY IN THIS NON ACTIVE APRIL DELIVERY MONTH.
In ounces AT THE COMEX, the OI is still represented by just OVER 1 BILLION oz i.e. 1.206 BILLION TO BE EXACT or 172% of annual global silver production (ex Russia & ex China).
FOR THE NEW FRONT APRIL MONTH/ THEY FILED: 0 NOTICE(S) FOR NIL OZ OF SILVER
IN SILVER, WE HAVE NOW SET THE NEW RECORD OF OPEN INTEREST AT 241,135 AND AGAIN THIS HAS BEEN SET WITH A STILL LOWER PRICE. THE PREVIOUS RECORD WAS 234,000 CONTRACTS WITH A SILVER PRICE CLOSING OF $17.89.
ON THE DEMAND SIDE WE HAVE THE FOLLOWING:
- HUGE AMOUNTS OF SILVER STANDING FOR DELIVERY (MARCH 27 MILLION OZ AND APRIL 1.8 MILLION OZ)
- HUGE OPEN INTEREST IN SILVER 241,135 CONTRACTS (OR 1.207 BILLION OZ/
- HUGE ANNUAL EFP’S ISSUANCE EQUAL TO 2.9 BILLION OZ OR 400% OF SILVER ANNUAL PRODUCTION
AND YET WE HAVE A CONTINUAL LOWER PRICE OF SILVER DESPITE THE ABOVE HUGE DEMAND. TO ME THE ONLY ANSWER IS THAT WE HAVE SOVEREIGN (CHINA) WHO IS ENDEAVOURING TO GOBBLE UP ALL AVAILABLE PHYSICAL SILVER NO MATTER WHERE, EXACTLY WHAT J.P.MORGAN IS DOING. AND IT IS MY BELIEF THAT J.P.MORGAN IS HOLDING ITS SILVER FOR ITS BENEFICIAL OWNER..THE USA GOVERNMENT WHO IN TURN IS HOLDING THAT SILVER FOR CHINA.(FOR A SILVER LOAN REPAYMENT)
In gold, the open interest ROSE BY A CONSIDERABLE SIZED 6569 CONTRACTS UP TO 499,710 ACCOMPANYING THE SMALL SIZED RISE IN PRICE/YESTERDAY’S TRADING ( GAIN OF $2.90). AS WE ENTER THE ACTIVE DELIVERY MONTH OF APRIL. THE CME RELEASED THE DATA FOR EFP ISSUANCE AND IT TOTALED A RATHER LARGE SIZED 12,098 CONTRACTS : JUNE SAW THE ISSUANCE OF 12,098 CONTRACTS AND ALL OTHER MONTHS ZERO. The new OI for the gold complex rests at 499,710. ALSO REMEMBER THAT THERE WILL BE A DELAY IN THE ISSUANCE OF EFP’S. THE BANKERS REMOVE LONG POSITIONS OF COMEX GOLD IMMEDIATELY. THEN THEY ORCHESTRATE THEIR PRIVATE EFP DEAL WITH THE LONGS AND THAT COULD TAKE AN ADDITIONAL 48 HRS SO WE GENERALLY DO NOT GET A MATCH WITH RESPECT TO DEPARTING COMEX LONGS AND NEW EFP LONG TRANSFERS. DEMAND FOR GOLD INTENSIFIES GREATLY AS WE CONTINUE TO WITNESS A HUGE NUMBER OF EFP TRANSFERS TOGETHER WITH THE MASSIVE INCREASE IN GOLD COMEX OI TOGETHER WITH THE TOTAL AMOUNT OF GOLD OUNCES STANDING FOR FEBRUARY COMEX. EVEN THOUGH THE BANKERS ISSUED THESE MONSTROUS EFPS, THE OBLIGATION STILL RESTS WITH THE BANKERS TO SUPPLY METAL BUT IT TRANSFERS THE RISK TO A LONDON BANKER OBLIGATION AND NOT A NEW YORK COMEX OBLIGATION. LONGS RECEIVE A FIAT BONUS TOGETHER WITH A LONG LONDON FORWARD. THUS, BY THESE ACTIONS, THE BANKERS AT THE COMEX HAVE JUST STATED THAT THEY HAVE NO APPRECIABLE METAL!! THIS IS A MASSIVE FRAUD: THEY CANNOT SUPPLY ANY METAL TO OUR COMEX LONGS BUT THEY ARE QUITE WILLING TO SUPPLY MASSIVE NON BACKED GOLD (AND SILVER) PAPER KNOWING THAT THEY HAVE NO METAL TO SATISFY OUR LONGS. LONDON IS NOW SEVERELY BACKWARD IN BOTH GOLD AND SILVER AND WE ARE WITNESSING DELAYS IN ACTUAL DELIVERIES. IN ESSENCE WE HAVE A HUMONGOUS OI GAIN IN CONTRACTS ON THE TWO EXCHANGES: 6569 OI CONTRACTS INCREASED AT THE COMEX AND A STRONG SIZED 12,098 EFP OI CONTRACTS WHICH NAVIGATED OVER TO LONDON.THUS TOTAL OI GAIN: 18,667 CONTRACTS OR 1,866,700 OZ =58.06 TONNES
YESTERDAY, WE HAD 691 EFP’S ISSUED.
ACCUMULATION OF EFP’S GOLD AT J.P. MORGAN’S HOUSE OF BRIBES: (EXCHANGE FOR PHYSICAL) FOR THE MONTH OF APRIL : 39,730 CONTRACTS OR 3,973,000 OZ OR 123.57 TONNES (4 TRADING DAYS AND THUS AVERAGING: 9933 EFP CONTRACTS PER TRADING DAY OR 993,300 OZ/ TRADING DAY)
TO GIVE YOU AN IDEA AS TO THE HUGE SIZE OF THESE EFP TRANSFERS : SO FAR THIS MONTH IN 4 TRADING DAYS IN TONNES: 125.57 TONNES
TOTAL ANNUAL GOLD PRODUCTION, 2017, THROUGHOUT THE WORLD EX CHINA EX RUSSIA: 2555 TONNES
THUS EFP TRANSFERS REPRESENTS 125.57/2550 x 100% TONNES = 4.92% OF GLOBAL ANNUAL PRODUCTION SO FAR IN MARCH ALONE.*** THE ACCUMULATION OF EFP CONTRACTS IS RISING PER MONTH.
ACCUMULATION OF GOLD EFP’S YEAR 2018 TO DATE: 2168.07 TONNES
ACCUMULATION OF GOLD EFP’S FOR JANUARY 2018: 653.22 TONNES
ACCUMULATION OF GOLD EFP’S FOR FEBRUARY 2018: 649.45 TONNES
ACCUMULATION OF GOLD EFP’S FOR MARCH 2018: 741.89 TONNES
WHAT IS ALARMING TO ME, ACCORDING TO OUR LONDON EXPERT ANDREW MAGUIRE IS THAT THESE EFP’S ARE BEING TRANSFERRED TO WHAT ARE CALLED SERIAL FORWARD CONTRACT OBLIGATIONS AND THESE CONTRACTS ARE LESS THAN 14 DAYS. ANYTHING GREATER THAN 14 DAYS, THESE MUST BE RECORDED AND SENT TO THE COMPTROLLER, GREAT BRITAIN TO MONITOR RISK TO THE BANKING SYSTEM. IF THIS IS INDEED TRUE, THEN THIS IS A MASSIVE CONSPIRACY TO DEFRAUD AS WE NOW WITNESS A MONSTROUS TOTAL EFP’S ISSUANCE AS IT HEADS INTO THE STRATOSPHERE.
Result: A HUGE SIZED INCREASE IN OI AT THE COMEX DESPITE THE SMALL SIZED GAIN IN PRICE IN GOLD TRADING YESTERDAY ($2.90 GAIN). WE HAD A VERY LARGE SIZED NUMBER OF COMEX LONG TRANSFERRING TO LONDON THROUGH THE EFP ROUTE: 12098 CONTRACTS AS THESE HAVE ALREADY BEEN NEGOTIATED AND CONFIRMED. THERE OBVIOUSLY DOES NOT SEEM TO BE MUCH PHYSICAL GOLD AT THE COMEX AND YET WE ALSO OBSERVED A HUGE DELIVERY MONTH FOR THE MONTH OF DECEMBER. I GUESS IT EXPLAINS THE HUGE ISSUANCE OF EFP’S…THERE IS HARDLY ANY GOLD PRESENT AT THE GOLD COMEX FOR DELIVERY PURPOSES. IF YOU TAKE INTO ACCOUNT THE 12098 EFP CONTRACTS ISSUED, WE HAD A HUMONGOUS NET GAIN IN OPEN INTEREST OF 18,667 contracts ON THE TWO EXCHANGES:
12098 CONTRACTS MOVE TO LONDON AND 6569 CONTRACTS INCREASED AT THE COMEX. (in tonnes, the GAIN in total oi equates to 58.06 TONNES).
we had: 0 notice(s) filed upon for NIL oz of gold.
xxxxxxxxxxxxxxxxxxxxxxxxxxxxxxxxxxxxxxxxxxxxxxxxxxxxxxxxxxx
With respect to our two criminal funds, the GLD and the SLV:
GLD
WITH GOLD DOWN $8.20 : WE HAD TWO ENTRIES IN GOLD TONNAGE AT THE GLD: 1)A WITHDRAWAL OF .29 TONNES TO PAY FOR FEES. AND 2) A DEPOSIT OF 2.06 TONNES
Inventory rests tonight: 854.09 tonnes.
SLV/
WITH SILVER UP 6 CENTS TODAY: NO CHANGES/
/INVENTORY RESTS AT 318.877 MILLION OZ/
end
First, here is an outline of what will be discussed tonight:
1. Today, we had the open interest in silver ROSE BY AN ATMOSPHERIC 8453 CONTRACTS from 232,682 UP TO 241,135 (AND A NEW COMEX RECORD SET TODAY/APRIL 5/2017. THE PREVIOUS RECORD WAS 234,787 SET ON APRIL 21.2017 ALMOST ONE YEAR AGO. THE PRICE OF SILVER ON THAT DAY: $17.89). THIS ALL OCCURRED SURPRISINGLY WITH THE FALL IN PRICE OF SILVER (11 CENTS// YESTERDAY’S TRADING). OUR BANKERS USED THEIR EMERGENCY PROCEDURE TO ISSUE ANOTHER 3962 EFP CONTRACTS FOR MAY (WE DO NOT GET A LOOK AT THESE CONTRACTS AS IT IS PRIVATE BUT THE CFTC DOES AUDIT THEM) AND 0 EFP’S FOR ALL OTHER MONTHS. EFP’S GIVE OUR COMEX LONGS A FIAT BONUS PLUS A DELIVERABLE PRODUCT OVER IN LONDON. WE HAD AGAIN ZERO COMEX SILVER COMEX LIQUIDATION. IF WE TAKE THE OI GAIN AT THE COMEX OF 8453 CONTRACTS TO THE 3962 OI TRANSFERRED TO LONDON THROUGH EFP’S, WE OBTAIN AN ATMOSPHERIC GAIN OF 12,415 OPEN INTEREST CONTRACTS. WE STILL HAVE A GOOD AMOUNT OF SILVER OUNCES THAT ARE STANDING FOR METAL IN APRIL (SEE BELOW). THE NET GAIN TODAY IN OZ ON THE TWO EXCHANGES: 62.075 MILLION OZ!!!
RESULT: A HUMONGOUS SIZED INCREASE IN SILVER OI AT THE COMEX DESPITE THE FALL IN SILVER PRICING / YESTERDAY (11 CENTS) . BUT WE ALSO HAD ANOTHER VERY GOOD SIZED 3962 EFP’S ISSUED TRANSFERRING COMEX LONGS OVER TO LONDON. TOGETHER WITH THE STRONG SIZED AMOUNT OF SILVER OUNCES STANDING FOR MARCH, DEMAND FOR PHYSICAL SILVER INTENSIFIES AS WE WITNESS SEVERE BACKWARDATION IN SILVER IN LONDON.
(report Harvey)
.
2.a) The Shanghai and London gold fix report
(Harvey)
2 b) Gold/silver trading overnight Europe, Goldcore
(Mark O’Byrne/zerohedge
and in NY: Bloomberg
3. ASIAN AFFAIRS
i)THURSDAY MORNING/WEDNESDAY NIGHT: Shanghai closed HOLIDAY /Hang Sang CLOSED HOLIDAY / The Nikkei closed UP 325.87 POINTS OR 1.53%/Australia’s all ordinaires CLOSED UP .41% /Chinese yuan (ONSHORE) closed UP at 6.3033/Oil DOWN to 63.22 dollars per barrel for WTI and 68.00 for Brent. Stocks in Europe OPENED DEEPLY IN THE GREEN . ONSHORE YUAN CLOSED UP AT 6.3033 AGAINST THE DOLLAR. OFFSHORE YUAN CLOSED UP ON THE DOLLAR AT 6.2938 /ONSHORE YUAN TRADING WEAKER AGAINST OFFSHORE YUAN/ONSHORE YUAN TRADING STRONGER AGAINST USA DOLLAR/OFFSHORE YUAN TRADING MUCH STRONGER AGAINST THE DOLLAR . CHINA ON HOLIDAY TODAY/CHINA RETALIATES WITH TARIFFS/LOOKS LIKE A FULL TRADE WAR IS BEGINNING/
SOUTH KOREA/NORTH KOREA
i)North Korea/South Korea
b) REPORT ON JAPAN
ii)The Central Bank of Japan now owns 77% of all ETF’s in Japan on top of just about all of Japanese Government debt.
This is an accident waiting to happen
(courtesy zerohedge)
3 c CHINA
i)Two things to be cognizant of:
- China is already declaring victory in their trade war with the uSA as they correctly state that China has targeted key industries such as autos, chemicals and of course soybeans
- China has hinted that they may wish to lower the value of the USA dollars and that means dumping their huge amount of treasuries.
( zerohedge)
ii)The way China and the uSA are going at each other, there is no way that there is going to be a settlement between them. Trump is now building an army of nations in its war against China
( zerohedge)
4. EUROPEAN AFFAIRS
i)France is a bit of a turmoil with rotating rail strikes. Macron is trying to change the hugely debt ridden public transportation rail operations Citizens of France are worried that he might privatize the rail..and that has set of the protests.
( Mac Slavo/SHFTPlan.com)
ii)The following commentary should make you think that the poisoning of Skripal and his daughter was not of Russian origins:
(courtesy Rob Slane/Blogmire.com)
5. RUSSIAN AND MIDDLE EASTERN AFFAIRS
Russia is still denied request to join the OPCW investigation into the Skripal poisoning. Very strange.
( zerohedge)
6 .GLOBAL ISSUES
( Bill Blain/Mint Partners)
7. OIL ISSUES
Bahrain discovers a massive 80 billion barrels of oil
( zerohedge)
8. EMERGING MARKET
9. PHYSICAL MARKETS
i)A thorough presentation of how the gold market is manipulated by central banks and the BIS
( Chris Powell/GATA)
ii)So far this year, China has recorded SGE withdrawals which equal Chinese citizen demand of 534 tonnes (1/4 of the year) It seems that we will again have over 2000 tonnes of gold demanded. When you add India which has over 1000 tonnes of gold demanded, the total of just these two nations equates to over 3000 tonnes when only 2550 tonnes of gold is produced ex China ex Russia. This is why central banks are banging their heads against the wall as they are having difficulty in finding physical metal.
( Lawrie Williams)
10. USA stories which will influence the price of gold/silver
ii)USA news/data
Donald is not going to be happy as the monthly trade deficit widened to $57.6, the largest monthly deficit since the financial crisis. It seems that every country had a surplus when compared to the USA
(courtesy zerohedge)
iii)This is interesting: In March the jobs cuts amounted to 60,357 with health care leading the way. This was a 71% increase from February
(zerohedge/Challenger/Grey/Christmas)
iv)As always, David Stockman tells the truth on the USA economy and where we are headed
( David Stockman/Contra Corner)
Trading Volumes on the COMEX
PRELIMINARY COMEX VOLUME FOR TODAY:360,630 contracts
CONFIRMED COMEX VOL. FOR YESTERDAY: 297,094 contracts
comex gold volumes are RISING AGAIN
Here is a summary of the latest gold trading volumes at the Comex per year
certainly the introduction of EFP’s has certainly had an effect:
Meanwhile, gold-trading volumes on the COMEX have never been higher:

xxxxxxxxxxxxxxxxxxxxxxxxxxxxxxxxxxxxxxxxxxxxxxxxxxxxxxxxxxxxxxxxxxxx
And now for the wild silver comex results.
Total silver OI ROSE BY AN ATMOSPHERIC 8453 CONTRACTS FROM 232,682 UP TO 241,135 AND A NEW RECORD OI FOR SILVER, DESPITE OUR 11 CENT FALL IN SILVER PRICING/ YESTERDAY). ALSO,WE WERE ALSO INFORMED THAT WE HAD A FAIR 3962 EMERGENCY EFP’S FOR MAY ISSUED BY OUR BANKERS AND ZERO FOR ALL OTHER MONTHS TO COMEX LONGS WHO RECEIVED A FIAT BONUS PLUS A DELIVERABLE PRODUCT OVER IN LONDON: THE TOTAL EFP’S ISSUED: 3962. THE SILVER BOYS HAVE STARTED TO MIGRATE TO LONDON FROM THE START OF DELIVERY MONTH AND CONTINUING RIGHT THROUGH UNTIL FIRST DAY NOTICE JUST LIKE WE ARE WITNESSING TODAY. USUALLY WE NOTED THAT CONTRACTION IN OI OCCURRED ONLY DURING THE LAST WEEK OF AN UPCOMING ACTIVE DELIVERY MONTH AS WE HAVE JUST SEEN IN GOLD TODAY. THIS PROCESS HAS JUST BEGUN IN EARNEST IN SILVER STARTING IN SEPTEMBER 2017. HOWEVER, IN GOLD, WE HAVE BEEN WITNESSING THIS FOR THE PAST 2 YEARS. NICK LAIRD WAS KIND ENOUGH TO SUPPLY US THE TOTAL FOR 2017 GOLD EFP’S AND IT WAS 6600 TONNES FOR THE ENTIRE YEAR. WE SURPRISINGLY AND SHOCKINGLY HAD ZERO LONG COMEX SILVER LIQUIDATION AND SHORT COVERING BUT THAT WAS QUICKLY REMEDIED WITH TODAY’S RAID. WE ALSO HAVE A HUMONGOUS SIZED GAIN IN TOTAL SILVER OI FROM OUR TWO EXCHANGES. WE ARE ALSO WITNESSING A STRONG AMOUNT OF SILVER OUNCES STANDING FOR COMEX METAL IN THIS NON ACTIVE OF APRIL AS WELL AS THE CONTINUAL MIGRATION OF EFPS OVER TO LONDON. ON A PERCENTAGE BASIS THERE ARE MORE EFP’S ISSUED FOR GOLD THAN SILVER. ON A NET BASIS WE GAINED 12,415 SILVER OPEN INTEREST CONTRACTS AS WE OBTAINED A 8453 CONTRACT GAIN AT THE COMEX COMBINING WITH THE ADDITION OF 3962 OI CONTRACTS NAVIGATING OVER TO LONDON.
NET GAIN ON THE TWO EXCHANGES:12,415 CONTRACTS
AMOUNT STANDING FOR SILVER AT THE COMEX
We are now in the non active delivery month of April and here the front month LOST 5 contracts LOWERING TO 337 contracts. We had 0 notices filed upon (CME correction last Thursday night) so in essence we lost 5 contracts or 25,000 additional ounces of silver will NOT stand for delivery in this non active delivery month of April.(AND THESE GUYS MORPHED INTO LONDON BASED FORWARDS)
The next big active delivery month for silver will be May and here the OI GAINED 3377 contracts UP to 152,557. June saw another gain of 33 contracts to stand at 33. The next big delivery month for silver is July and here the OI rose by 4377 contracts up to 52,271.
We had 0 notice(s) filed for NIL OZ for the APRIL 2018 contract for silver
INITIAL standings for APRIL/GOLD
APRIL 5/2018.
| Gold | Ounces |
| Withdrawals from Dealers Inventory in oz | nil oz |
| Withdrawals from Customer Inventory in oz |
nil oz
|
| Deposits to the Dealer Inventory in oz | NIL oz |
| Deposits to the Customer Inventory, in oz | nil OZ |
| No of oz served (contracts) today |
0 notice(s)
NIL OZ
|
| No of oz to be served (notices) |
1707 contracts
(170700 oz)
|
| Total monthly oz gold served (contracts) so far this month |
595 notices
59500 OZ
1.8506 TONNES
|
| Total accumulative withdrawals of gold from the Dealers inventory this month | NIL oz |
| Total accumulative withdrawal of gold from the Customer inventory this month | xxx oz |
For APRIL:
Today, 0 notice(s) were issued from JPMorgan dealer account and 0 notices were issued from their client or customer account. The total of all issuance by all participants equates to 0 contract(s) of which 14 notices were stopped (received) by j.P. Morgan dealer and 0 notice(s) was (were) stopped/ Received) by j.P.Morgan customer account.
xxxxxxxxxxxxxxxxxxxxxxxxxxxxxxxxxxxxxxxxxxxxxxxxxxxxxxxxxxxxxxxxxxxxxxxxxx
To calculate the INITIAL total number of gold ounces standing for the APRIL. contract month, we take the total number of notices filed so far for the month (595) x 100 oz or 59500 oz, to which we add the difference between the open interest for the front month of APRIL. (1707 contracts) minus the number of notices served upon today (8 x 100 oz per contract) equals 230,200 oz, the number of ounces standing in this active month of APRIL (7.160 tonnes)
Thus the INITIAL standings for gold for the APRIL contract month:
No of notices served (595 x 100 oz or ounces + {(1707)OI for the front month minus the number of notices served upon today (8 x 100 oz )which equals 230,200 oz standing in this active delivery month of APRIL . THERE IS 12.003 TONNES OF REGISTERED GOLD AVAILABLE FOR DELIVERY SO FAR.
WE LOST 286 COMEX OI CONTRACTS OR 28,600 OZ OF GOLD WILL NOT STAND BUT THESE GUYS MORPHED INTO LONDON BASED FORWARDS.
IN THE LAST 18 MONTHS 72 NET TONNES HAS LEFT THE COMEX.
end
And now for silver
AND NOW THE APRIL DELIVERY MONTH
APRIL INITIAL standings/SILVER
| Silver | Ounces |
| Withdrawals from Dealers Inventory | nil oz |
| Withdrawals from Customer Inventory |
18,378.47
oz
Delaware
Brinks
|
| Deposits to the Dealer Inventory |
nil
oz
|
| Deposits to the Customer Inventory |
606,231.900 oz
JPMorgan
|
| No of oz served today (contracts) |
0
CONTRACT(S
NIL OZ)
|
| No of oz to be served (notices) |
337 contracts
(1,685,000 oz)
|
| Total monthly oz silver served (contracts) | 19 contracts
(95,000 oz) |
| Total accumulative withdrawal of silver from the Dealers inventory this month | NIL oz |
| Total accumulative withdrawal of silver from the Customer inventory this month |
we had 0 inventory movement at the dealer side of things
total dealer deposits: nil oz
we had 1 deposits into the customer account
i) Into JPMorgan: 606,231.900 oz
*** JPMorgan for most of 2017 and in 2018 has adding to its inventory almost every single day.
JPMorgan now has 140 million oz of total silver inventory or 53.4% of all official comex silver. (140 million/263 million)
JPMorgan deposited into its warehouses (official) today.
total deposits today: 606,231.900 oz
we had 2 withdrawals from the customer account;
i) Out of Delaware: 15,343.770 oz
ii) Out of Brinks: 3037.700 oz
total withdrawals; 18,378.47 oz
we had 0 adjustment
total dealer silver: 58.8561 million
total dealer + customer silver: 263.332 million oz
The total number of notices filed today for the APRIL. contract month is represented by 0 contract(s) FOR NIL oz. To calculate the number of silver ounces that will stand for delivery in APRIL., we take the total number of notices filed for the month so far at 19 x 5,000 oz = 95,000 oz to which we add the difference between the open interest for the front month of April. (337) and the number of notices served upon today (0 x 5000 oz) equals the number of ounces standing.
.
Thus the INITIAL standings for silver for the APRIL contract month: 19(notices served so far)x 5000 oz + OI for front month of April(337) -number of notices served upon today (0)x 5000 oz equals 1,780,000 oz of silver standing for the April contract month
WE LOST 5 SILVER CONTRACTS OR 25,000 ADDITIONAL OUNCES WILL NOT STAND IN THIS NON ACTIVE DELIVERY MONTH OF APRIL AND THESE GUYS MORPHED INTO LONDON BASED FORWARDS.
xxxxxxxxxxxxxxxxxxxxxxxxxxxxxxxxxxxxxxxxxxxxxxxxxxxxxxxxxxx
ESTIMATED VOLUME FOR TODAY: 115,765 CONTRACTS
CONFIRMED VOLUME FOR YESTERDAY: 106058 CONTRACTS
YESTERDAY’S CONFIRMED VOLUME OF 106,058 CONTRACTS EQUATES TO 530 MILLION OZ OR 75.7% OF ANNUAL GLOBAL PRODUCTION OF SILVER
COMMODITY LAW SUGGESTS THAT OPEN INTEREST SHOULD NOT BE MORE THAN 3% OF ANNUAL GLOBAL PRODUCTION. THE CROOKS ARE SUPPLYING MASSIVE PAPER TRYING TO KEEP SILVER IN CHECK.
The record level of silver open interest is 234,787 contracts set on April 21./2017 with the price at that day at $18.42
The previous record was 224,540 contracts with the price at that time of $20.44
end
NPV for Sprott
1. Sprott silver fund (PSLV): NAV FALLS TO -2.52% (APRIL 4/2018)
2. Sprott gold fund (PHYS): premium to NAV RISES TO -0.62% to NAV (APRIL 4/2018 )
Note: Sprott silver trust back into NEGATIVE territory at -2.52%-/Sprott physical gold trust is back into NEGATIVE/ territory at -0.62%/Central fund of Canada’s is still in jail but being rescued by Sprott.
Sprott WINS hostile 3.1 billion bid to take over Central Fund of Canada
(courtesy Sprott/GATA)
3.SPROTT CEF.A FUND (FORMERLY CENTRAL FUND OF CANADA): NAV FALLS TO -2.58%: NAV 13.65/TRADING 13.29//DISCOUNT 2.58
END
And now the Gold inventory at the GLD/
APRIL 5/WITH GOLD DOWN $8.20 WE HAD TWO ENTRIES: 1) TINY WITHDRAWAL OF .28 TONNES TO PAY FOR FEES AND 2) A DEPOSIT OF 2.06 TONNES//INVENTORY RESTS AT 854.09 TONNES
April 4/WITH GOLD UP $2.90 WE HAD NO CHANGES IN GOLD INVENTORY AT THE GLD/INVENTORY RESTS AT 852.31 TONNES
APRIL 3./WITH GOLD DOWN $9.30 WE HAD NO CHANGES IN GOLD INVENTORY AT THE GLD/INVENTORY RESTS AT 852.31 TONNES
APRIL 2/WITH GOLD UP $19.50, WE HAD A BIG CHANGES IN GOLD INVENTORY AT THE GLD A DEPOSIT OF 6.19 TONNES/INVENTORY RESTS AT 852.31 TONNES
MARCH 29/WITH GOLD DOWN $3.20 AND OPTIONS EXPIRY FINISHED, WE HAD NO CHANGE IN GOLD INVENTORY AT THE GLD/INVENTORY RESTS A 846.12 TONNES
March 28/WITH GOLD DOWN $16.70, ANOTHER RAID ORCHESTRATED, AGAIN NO SURPRISES AS WE WITNESS ANOTHER 1.18 TONNES OF GOLD REMOVED/INVENTORY RESTS AT 846.12 TONNES
MARCH 27/WITH GOLD DOWN $11.70 AND A RAID INITIATED, IT WAS NO SURPRISE TO SEE THAT A MASSIVE WITHDRAWAL OF 3.24 TONNES WAS USED IN THE ABOVE RAID/INVENTORY RESTS AT 847.30 TONNES
MARCH 26./WITH GOLD UP $4.60/NO CHANGE IN GOLD INVENTORY AT THE GLD/INVENTORY RESTS AT 850.54 TONNES
MARCH 23/WITH GOLD UP $23.30/NO CHANGE IN GOLD INVENTORY AT THE GLD/INVENTORY RESTS AT 850.54 TONNES
MARCH 22.WITH GOLD UP $5.90, NO CHANGES IN GOLD INVENTORY AT THE GLD/INVENTORY RESTS AT 850.54 TONNES/
MARCH 21/WITH GOLD UP $9.65 NO CHANGES IN GOLD INVENTORY AT THE GLD/INVENTORY RESTS AT 850.54 TONNES
March 20/WITH GOLD DOWN $5.75, A SURPRISING HUMONGOUS DEPOSIT OF 10.32 TONNES OF GOLD INTO THE GLD/INVENTORY RESTS AT 850.64 TONNES/
SO FAR, FOR THE MONTH OF MARCH, THE GLD HAS ADDED 19.61 TONNES WITH A NET LOSS OF $17.45
March 19/WITH GOLD UP $5.25: ANOTHER HUGE DEPOSIT OF GOLD TO THE TUNE OF 2.07 TONNES/GOLD INVENTORY RESTS TONIGHT AT 840.22 TONNES
MARCH 16/WITH GOLD DOWN $5.65/OUR CROOKS DEPOSITED ANOTHER 4.42 TONNES INTO GLD INVENTORY/INVENTORY RESTS AT 838.15 TONNES
FOR THE WEEK: GOLD LOST $11.80, BUT GOLD INVENTORY ADVANCED:4.42 TONNES
MARCH 15/WITH GOLD DOWN $7.85, NO CHANGES IN GOLD INVENTORY AT THE GLD/INVENTORY RESTS AT 833.73 TONNES
MARCH 14/WITH GOLD DOWN $1.55/NO CHANGES IN GOLD INVENTORY AT THE GLD/INVENTORY RESTS AT 833.73 TONNES
MARCH 13/WITH GOLD UP $6.25/NO CHANGES IN GOLD INVENTORY AT THE GLD/INVENTORY RESTS AT 833.73 TONNES
MARCH 12/WITH GOLD DOWN $3.00/NO CHANGES IN GOLD INVENTORY AT THE GLD/INVENTORY RESTS AT 833.73 TONNES
MARCH 9/WITH GOLD UP $2.25/NO CHANGES IN GOLD INVENTORY AT THE GLD/INVENTORY RESTS AT 833.73 TONNES
March 8/NO CHANGES IN GOLD INVENTORY AT THE GLD/INVENTORY RESTS AT 833.73 TONNES
GOLD DOWN 5.45 TODAY.
MARCH 7/WITH GOLD DOWN 8.00/A SLIGHT CHANGE IN GOLD INVENTORY AT THE GLD/A WITHDRAWAL OF .25 TONNES TO PAY FOR FEES//INVENTORY RESTS AT 833.73 TONNES
MARCH 6/WITH GOLD UP $15.60/NO CHANGE IN GOLD INVENTORY AT THE GLD/INVENTORY RESTS AT 833.98 TONNES
March 5/WITH GOLD DOWN $4.10/NO CHANGE IN GOLD INVENTORY AT THE GLD/INVENTORY RESTS AT 833.98 TONNES
MARCH 2/WITH GOLD UP $18.70/NO CHANGE IN GOLD INVENTORY AT THE GLD/INVENTORY RESTS AT 833.98 TONNES
March 1/WITH GOLD DOWN ANOTHER $12.30/A HUGE CHANGE IN GOLD INVENTORY/ A DEPOSIT OF 2.96 TONNES/INVENTORY RESTS AT 833.98 TONNES
xxxxxxxxxxxxxxxxxxxxxxxxxxxxxxxxxx
APRIL 5/2018/ Inventory rests tonight at 854.09 tonnes
*IN LAST 356 TRADING DAYS: 86.95 NET TONNES HAVE BEEN REMOVED FROM THE GLD
*LAST 306 TRADING DAYS: A NET 69.35 TONNES HAVE NOW BEEN ADDED INTO GLD INVENTORY.
end
Now the SLV Inventory/
APRIL 5/WITH SILVER UP 6 CENTS/NO CHANGES IN INVENTORY AT THE SLV/INVENTORY RESTS AT 318.877 MILLION OZ/
April 4/WITH SILVER DOWN 11 CENTS/A SMALL CHANGE IN SILVER INVENTORY AT THE SLV/ A WITHRAWAL OF 135,000 OZ AND THIS IS PROBABLY TO PAY FOR FEES/INVENTORY RESTS AT 318.877 MILLION OZ/
APRIL 3./WITH SILVER DOWN 16 CENTS/NO CHANGE IN SILVER INVENTORY AT THE SLV/INVENTORY RESTS AT 319.012 MILLION OZ/
APRIL 2/WITH SILVER UP 34 CENTS/NO CHANGES IN SILVER INVENTORY AT THE SLV/INVENTORY RESTS AT 319.012 MILLION OZ/
MARCH 29/WITH SILVER UP 6 CENTS, THE CROOKS DECIDED THAT THEY HAD BETTER ADD SOME 943,000 PAPER OZ TO THEIR INVENTORY/INVENTORY RESTS AT 319.012 MILLION OZ
March 28/WITH SILVER DOWN 27 CENTS/AGAIN NO CHANGE IN SILVER INVENTORY AT THE SLV/INVENTORY RESTS AT 318.069 MILLION OZ
MARCH 27/WITH SILVER DOWN 14 CENTS/NO CHANGE IN SILVER INVENTORY AT THE SLV/INVENTORY RESTS AT 318.069 MILLION OZ/
WITH SILVER UP 11 CENTS/NO CHANGE IN SILVER INVENTORY AT THE SLV/INVENTORY RESTS AT 318.069 MILLION OZ/
MARCH 23/WITH SILVER UP 19 CENTS, A HAD A BIG WITHDRAWAL OF 1.602 MILLION OZ.INVENTORY RESTS AT 318.069 MILLION OZ/
MARCH 22/WITH SILVER DOWN ONE CENT, NO CHANGE IN SLV INVENTORY/INVENTORY RESTS AT 319.671 MILLION OZ/
March 21/WITH SILVER UP 21 CENTS/NO CHANGE IN SLV INVENTORY/INVENTORY RESTS AT 319.671 MILLION OZ/
March 20/WITH SILVER DOWN 13 CENTS/NO CHANGE IN SLV INVENTORY/INVENTORY RESTS AT 319.671 MILLION OZ/
March 19/WITH SILVER UP 5 CENTS, THE SLV ADDS A SMALL 659,000 OZ TO ITS INVENTORY/INVENTORY RESTS AT 319.671 MILLION OZ/
MARCH 16/WITH SILVER DOWN 15 CENTS/NO CHANGES IN SILVER INVENTORY AT THE SLV/INVENTORY RESTS AT 319.012 MILLION OZ.
FOR THE WEEK; SILVER IS DOWN 42 CENTS YET ADDS 943,000 OZ OF SILVER INTO THE SLV/
MARCH 15/WITH SILVER DOWN 11 CENTS/NO CHANGES IN SILVER INVENTORY AT THE SLV/INVENTORY RESTS AT 319.012 MILLION OZ/
MARCH 14/WITH SILVER DOWN 8 CENTS/NO CHANGES IN SILVER INVENTORY AT THE SLV/INVENTORY RESTS AT 319.012 MILLION OZ/
MARCH 13/WITH SILVER UP 10 CENTS/NO CHANGES IN SILVER INVENTORY AT THE SLV/INVENTORY RESTS AT 319.012 MILLION OZ/
MARCH 12/WITH SILVER DOWN 8 CENTS/A BIG CHANGES IN SILVER INVENTORY AT THE SLV/ A DEPOSIT OF 943,000 OZ/INVENTORY RESTS AT 319.012 MILLION OZ/
MARCH 9/WITH SILVER UP 21 CENTS, NO CHANGES IN SILVER INVENTORY AT THE SLV/INVENTORY RESTS AT 318.069 MILLION OZ/
March 8/WITH SILVER DOWN 1 CENT TODAY: NO CHANGE IN SILVER INVENTORY AT THE SLV/INVENTORY RESTS AT 318.069 MILLION OZ/
MARCH 7/WITH SILVER DOWN 27 CENTS/NO CHANGE IN SILVER INVENTORY AT THE SLV/INVENTORY RESTS AT 318.069 MILLION OZ/
MARCH 6/WITH SILVER UP 38 CENTS/NO CHANGE IN SILVER INVENTORY AT THE SLV/INVENTORY RESTS AT 318.069 MILLION OZ/
March 5/WITH SILVER DOWN 11 CENTS/NO CHANGE IN SILVER INVENTORY AT THE SLV/INVENTORY RESTS AT 318.069 MILLION OZ/
MARCH 2/WITH SILVER UP 23 CENTS: A HUGE 1.479 MILLION OZ WAS ADDED TO SILVER’S INVENTORY/INVENTORY RESTS AT 318.069 MILLION OZ/
March 1/WITH SILVER DOWN 11 CENTS TODAY/NO CHANGE IN SILVER INVENTORY AT THE SLV/INVENTORY RESTS AT 316.590 MILLION OZ./
HAD ANOTHER HUGE ADDITION OF 1.315 MILLION OZ/INVENTORY RESTS AT 316.590 MILLION OZ/
APRIL 5/2018: NO CHANGES IN SILVER INVENTORY:
Inventory 318.877 million oz
end
6 Month MM GOFO 2.04/ and libor 6 month duration 2.46
Indicative gold forward offer rate for a 6 month duration/calculation:
G0FO+ 2.04%
libor 2.46 FOR 6 MONTHS/
GOLD LENDING RATE: .42%
XXXXXXXX
12 Month MM GOFO
+ 2.48%
LIBOR FOR 12 MONTH DURATION: 2.68
GOFO = LIBOR – GOLD LENDING RATE
GOLD LENDING RATE = +.20
end
Major gold/silver trading /commentaries for THURSDAY
GOLDCORE/BLOG/MARK O’BYRNE.
GOLD/SILVER
Silver Bullion: Should We Be Worried About Silver?
Silver Bullion: Should We Be Worried About Silver?
– Bloomberg’s Mike McGlone silver “set to test the $18 an ounce resistance level”
– LBMA report: volume of silver ounces transferred in February fell by 24%
– Standard Chartered: gold-silver ratio and supply/demand fundamentals favour silver
– Gold/silver ratio at near two-year high on silver’s underperformance
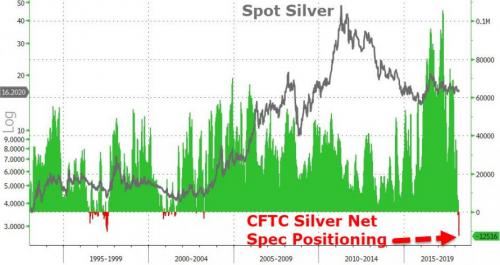
– Silver COT reports remain more bullish than at any time in history
– Silver expected to outperform gold as macro and industrial factors begin to drive price
The silver price has perhaps disappointed many investors of late. Two key institutional metrics released in the last fortnight may have made things worse, however not all is at it seems.
The latest silver COT reports have shown that Managed Money positions are net bearish, the most recent is for the seventh week in a row. Meanwhile an LBMA report this week shows that the volume of silver transferred in February fell by 24%.
Whilst both of these suggest that the silver price might continue to resist further climbs, the contrarian perspective suggests otherwise. Analysis of past COT reports, previous gold/silver ratios and a close look at macro fundamentals should give investors (and those considering buying silver) reassurance that the silver price could be set to make some key moves.
COT report
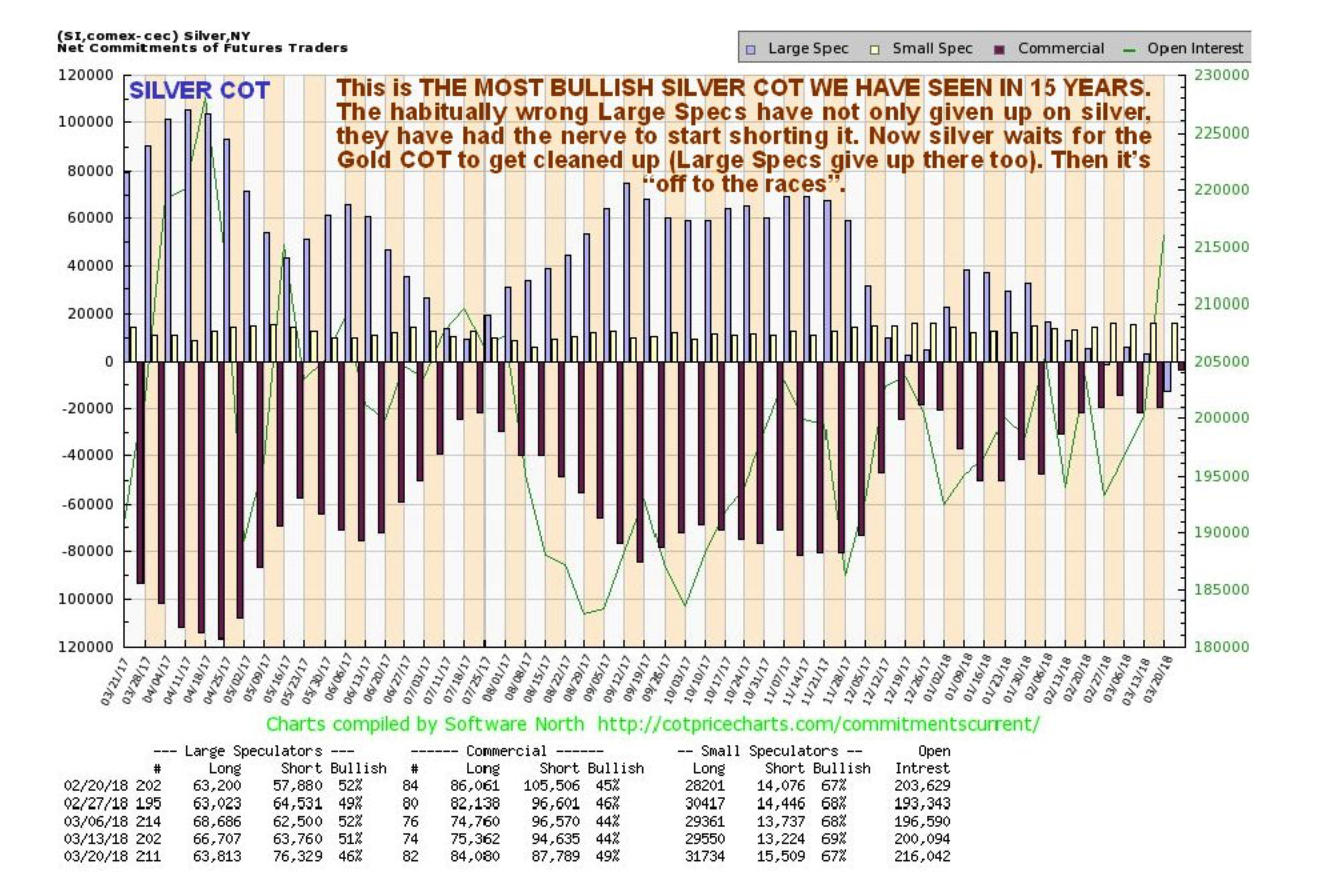
Last week’s COT data showed Managed Money positions hold are net bearish for the 7th week in a row. This is the longest net negative stretch in over three years (since late 2014).
The March 20 COT report ‘showed an all-time record high Large Speculator NET short position and an all-time record low Commercial NET short position with the Small Specs as the only category still showing a small NET long position.’
As we explained last week, COT data shows that ‘we are close to bottoming and suggests that both gold and silver should make gains in the coming weeks and months. The data showed that the hedge funds and “Managed Money traders,” the “dumb money” speculators now have record short positions in silver.’
At the same time, the large commercials and including large bullion banks such as JP Morgan, the “smart money” and the “inside money” have reduced their shorts dramatically and are now long.
The COT report shows ‘Managed money’ silver specs have their largest short position in at least 28 years and maybe ever. From a contrarian perspective this is very bullish.
Listen on SoundCloud , Blubrry & iTunes. Watch on YouTube below

Usually we would expect gold and silver to behave similarly when it comes to the futures market as generally the same factors affect both metals. Whilst recent silver COT reports showing large speculators giving up on and even shorting silver is (from a contrarian perspective) extremely bullish, there is a paradox with the gold COTs which are arguably bearish. Many analysts believe this is a positive sign that the silver price is set to climb, but not before falling.
In recent weeks we have commented on the divergence occurring between both gold and silver.
‘What does this mean? One possible explanation is that silver has gotten too cheap relative to gold and needs to be revalued. That could happen in several ways, with both metals rising but silver rising more, or both falling but silver falling less. Or with gold dropping while silver rises, as improbable as that seems.’
In order for the silver price to climb it likely requires a retreat in the gold price before recovering alongside it. In short, the current silver indicators show a short-term weakness followed by a strong rebound.
Bloomberg Intelligence’s Mike McGlone wrote in a recent report “Silver’s 52-week range is the most compressed in 15 years and appears unsustainable…Silver’s extreme compression projects a revisit of 2016’s high. Sustaining below the December low would indicate failure.”
Why should we expect a recovery in the silver price? “Because of the gold price” is clearly not a reasonable enough answer. Standard Chartered said in a recent report that they expect fortunes to turn for silver this year as the weaker dollar and rising inflation expectations will see investors seek out safe havens alongside gold. Many of the factors driving gold will begin to affect silver as well. Additionally silver is both a monetary and industrial metal which means it listens to two tunes when performing.
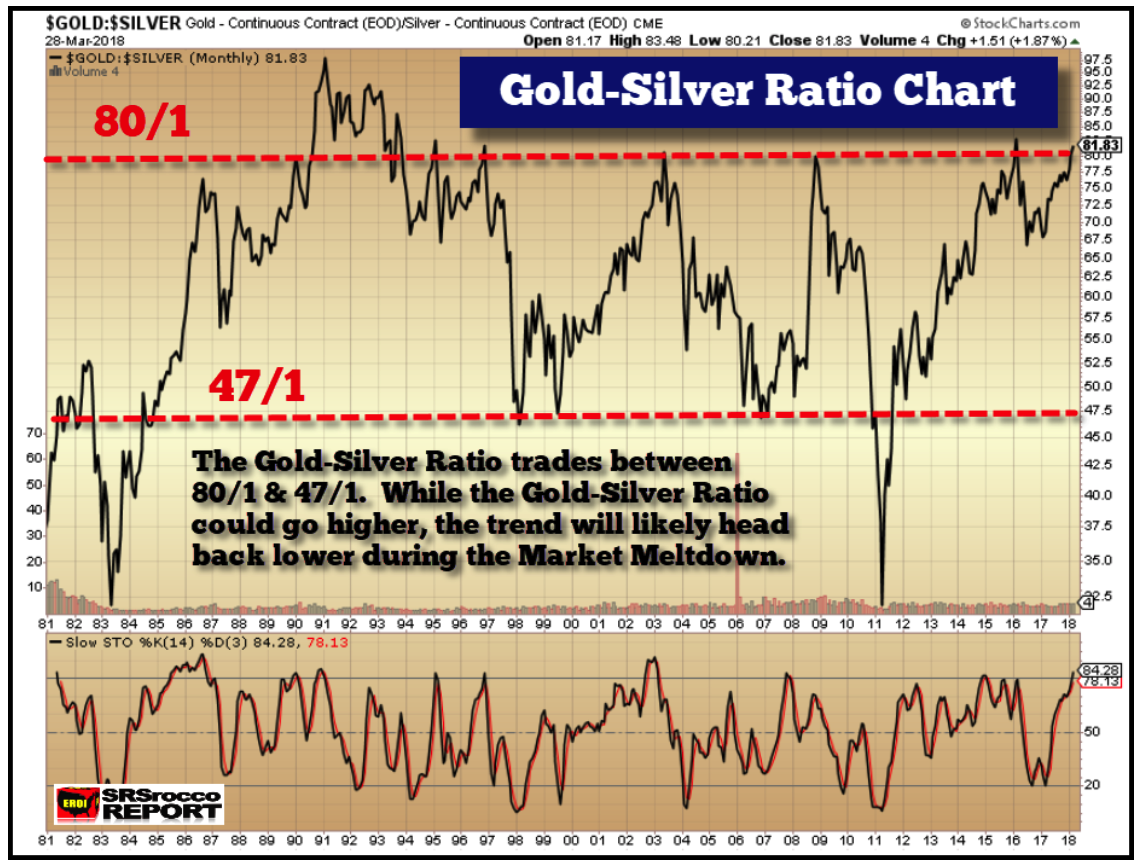
Gold/silver ratio
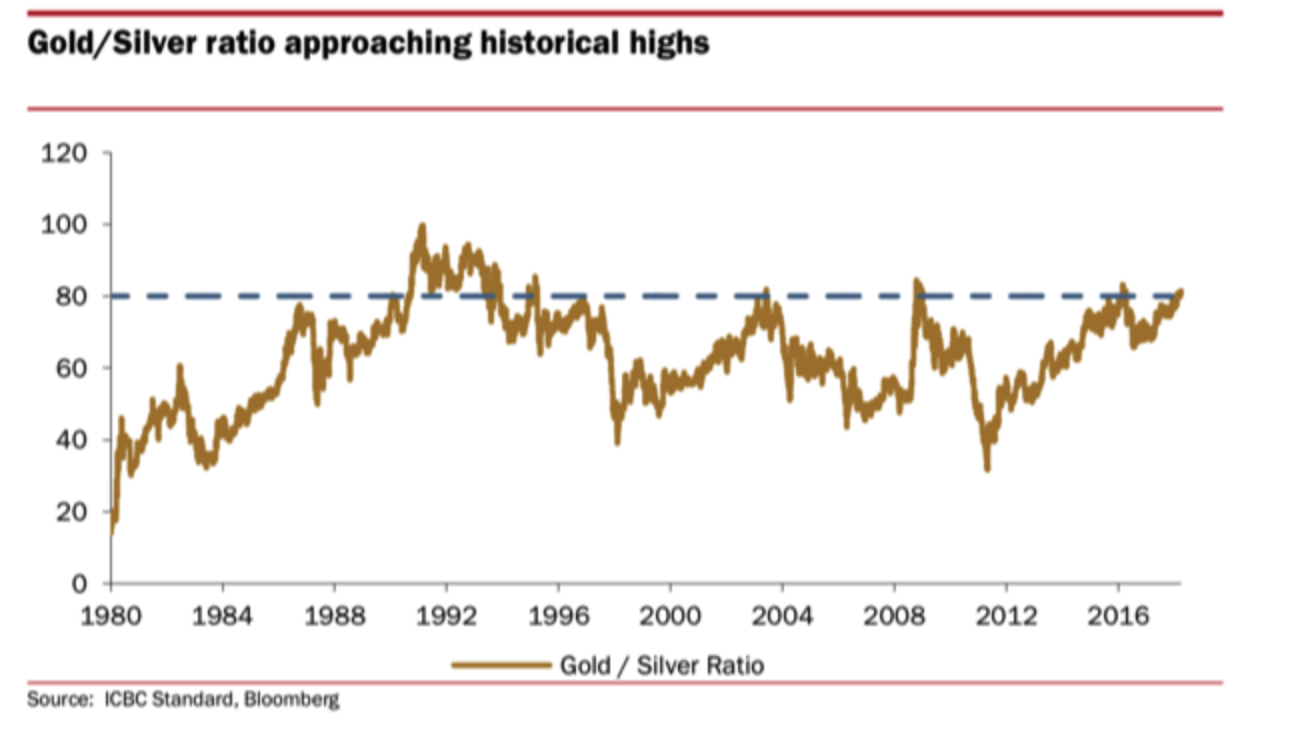
This week the gold/silver price ratio has so far remained above 81. This is gold at its most expensive in relation to silver, since the early 1990s. Since the start of the millennium the ratio has been trading in a range of 80 and 47. Silver is extremely undervalued in both the short and long-term.
ICBC’s Marcus Garvey said in a report last week, “Inevitably, given the historical precedent, [the ratio level] has raised the question of whether bullion investors are being presented with a contrarian opportunity to position for a reversal…In the very short-term, we think the answer is yes.”
As in any market and with any asset the ratio could yet head higher, but how much higher must be considered in respect of the key fundamentals. For example, the current breakeven price for the primary silver mining industry is about $15-$16. The current price point is not sustainable.
The gold/silver ratio has never remained at 80 (or above) for very long before decreasing. This suggests that the window of opportunity to stock up on silver is small. According to silver seek there have been three occasions sine 1995 where the ratio registered at or above 80. The average of those days is 47. We have just exceeded the historical average in this latest range.
John Rubino recently explained how investors can use this unusual occurrence to their advantage:
‘gold has recently been rising relative to silver (or silver has been falling relative to gold) with the gold/silver ratio now close to 80, meaning that it takes 80 ounces of silver to buy one ounce of gold. It’s been there two other times in the past decade and both times gold subsequently rose while silver rose a lot more.
Based on this (admittedly short) bit of recent history, an interesting trade might be to short gold and go long silver on the assumption that silver bullion will outperform gold bullion going forward. Or just stack more silver than usual for a while.
With the world’s mines producing only about 10 times as much silver as gold while silver stockpiles are dwarfed by those of gold because so much silver is used and then lost in industrial applications, this might be a trade that works for years rather than months.
Silver: the hardworking metal
Silver’s role as an industrial metal has always been impressive but no more so than since this fourth industrial revolution. It’s importance in both communication and sustainable technologies is worth noting, especially given both industries are set to expand.
In the last five years more than half of all the silver sold worldwide has been bought by industry. Less than 10% of gold is bought by the same sector.
Import figures demonstrate growing demand for silver: China’s silver imports are up 36% year-on-year so far in 2018, while India’s silver imports are up 63%. This is in large part thanks to industrial demand where mobile phone and solar cell use are mopping up supply.
“To go green, to do all the things we want to do as the human race gets off oil and gas, we need a ton of silver,” Keith Neumeyer, CEO of First Majestic Silver Corp

Silver has enormous potential in the field of technology. It is the most electrically conductive known material other than gold. Unsurprisingly gold is far too expensive to use in the majority of areas where silver makes for a viable alternative. As we find more solutions to solve energy and technology issues we will inevitably require more and more silver. Right now there is no obvious substitute for it.
Wider macro factors will drive silver
As John Rubino wrote recently, we should be careful not to look at recent institutional date in a vacuum as there are other factors that will support stronger silver prices:
‘Silver is a whole different story, with speculators going aggressively net short, something very seldom seen, and commercials almost in balance, which is also unusual. Looked at in a vacuum, this is hyper-bullish…between trade wars, massive ongoing government deficits and spiking stock market volatility, the reasons for owning safe haven assets like gold and silver are both multiplying and gaining urgency.’
The latest COT report should not be seen as a bearish sign. This is a strong indicator to accumulate silver before it breaks through this current resistance level and begins to catch up with gold. Gold has outperformed silver in the last year or so most likely thanks to safe-haven demand.
Gold is considered to be a safe play in times such as these, hence silver isn’t keeping pace with it. This is also not helped by the fact that the market perceives silver to be exposed to economic weakness. But this won’t be forever. Inflation will begin to show itself in a less covert manner. As it does so more of the public will realize silver’s second role as a store of value and inflation hedge.
Final note from Mark O’Byrne:
Silver remains very undervalued in the short term and on a long term historical basis. It is also undervalued against gold as seen in the gold silver ratio at over 80:1.
Gold is beginning to receive some interest again from a small minority of retail investors but silver remains the preserve of relatively few contrarian investors. The media and financial press rarely, if ever, covers silver and almost never in a positive manner despite its strong fundamentals.
Yet silver is quite likely in the early stages of a new bull market that will rival or surpass that of the 1970s and thus merits an allocation in investment and pension portfolios.
Listen on SoundCloud , Blubrry & iTunes. Watch on YouTube below
Related reading
Silver bullion will likely outperform gold bullion going forward
Silver Futures Report and JP Morgan Record Silver Bullion Holding Is Extremely Bullish
Silver’s Positive Fundamentals Due To Strong Demand In Key Growth Industries
News and Commentary
Gold futures pop higher as fresh China tariffs escalate trade-war fear (MarketWatch.com)
Gold hits 1-week high as dollar dips, U.S.-China trade tensions escalate (Reuters.com)
China’s Counterpunch to Trump’s Tariffs Sparks Global Selloff (Bloomberg.com)
Growth in U.S. Service Industries Cools for a Second Month (Bloomberg.com)
U.S. factory orders increase broadly in February (Reuters.com)

Gold Is Heading to $1,400 If Trade War Breaks Out, According to Sprott (Bloomberg.com)
No Exit in Sight for the World Record Holder in Negative Rates (Bloomberg.com)
Three Mini-Bubbles Burst. Is One Of The Big Ones Next? (DollarCollapse.com)
Matt King: This Is The Real Reason Behind The Blow Out In Libor-OIS (ZeroHedge.com)
Goldman Sachs: 20 Years Left of Mineable Gold (ProActiveInvestors.co.uk)
Gold Prices (LBMA AM)
04 Apr: USD 1,343.15, GBP 955.52 & EUR 1,092.79 per ounce
03 Apr: USD 1,336.60, GBP 949.65 & EUR 1,085.99 per ounce
29 Mar: USD 1,323.90, GBP 941.69 & EUR 1,075.80 per ounce
28 Mar: USD 1,341.05, GBP 946.24 & EUR 1,082.23 per ounce
27 Mar: USD 1,350.65, GBP 954.64 & EUR 1,087.41 per ounce
26 Mar: USD 1,348.40, GBP 949.27 & EUR 1,086.95 per ounce
23 Mar: USD 1,342.35, GBP 952.80 & EUR 1,088.65 per ounce
Silver Prices (LBMA)
04 Apr: USD 16.46, GBP 11.72 & EUR 13.40 per ounce
03 Apr: USD 16.52, GBP 11.78 & EUR 13.44 per ounce
29 Mar: USD 16.28, GBP 11.58 & EUR 13.21 per ounce
28 Mar: USD 16.46, GBP 11.63 & EUR 13.28 per ounce
27 Mar: USD 16.64, GBP 11.79 & EUR 13.41 per ounce
26 Mar: USD 16.61, GBP 11.67 & EUR 13.39 per ounce
23 Mar: USD 16.53, GBP 11.70 & EUR 13.39 per ounce
Recent Market Updates
– Martin Luther King Jr. Anniversary: Reminds Us Of Costs Of War To Society and Financial System
– Gold Outperforms Stocks In Q1, 2018
– Brexit, Stagflation Pressures UK High Street
– Gold Is Money While Currencies Today Are “IOU Nothings”
– “Stars Are Slowly Aligning For Gold” – Frisby
– Uncle Sam Issuing $300 Billion In New Debt This Week Alone
– Eurozone Faces Many Threats Including Trade Wars and “Eurozone Time-Bomb” In Italy
– Silver Futures Report and JP Morgan Record Silver Bullion Holding Is Extremely Bullish
– London House Prices Falling Sharply – UK’s Much Needed Wake-Up Call
– Global Trade War Fears See Precious Metals Gain And Stocks Fall
– Gold +1.8%, Silver +2.5% As Fed Increases Rates And Trade War Looms
– Credit Concerns In U.S. Growing As LIBOR OIS Surges to 2009 High
– Four Charts: Debt, Defaults and Bankruptcies To See Higher Gold
Andrew Maguire’s Kinesis money which is a “bitcoin” but backed 100% by allocated gold and silver is set to go.
it think it would be a great idea to look at this!
please read at: https://kinesis.money/#/
(Andrew Maguire)
|
2:57 PM (1 hour ago) | ||
|
|||
Harvey
Here It is my friend! https://kinesis.money/#/ Please let everyone know.
Let catch up on Monday if you have time. We have billions in the hopper ready to be allocated on the 1st day of trading. The paper market days are over.
Warm regards
Andy
END
A thorough presentation of how the gold market is manipulated by central banks and the BIS
(courtesy Chris Powell/GATA)
Chris Powell: Gold market manipulation update, April 2018
Submitted by cpowell on Wed, 2018-04-04 15:23. Section: Documentation
Gold Market Manipulation Update
Remarks by Chris Powell
Secretary/Treasurer, Gold Anti-Trust Action Committee Inc.
Mining Investment Asia Conference
Marina Bay Sands, Singapore
Wednesday, March 28, 2018
Mines and Money Asia Conference
Hong Kong Exhibition and Convention Centre
Wednesday, April 4, 2018
The slides for this presentation are posted here:
http://gata.org/files/GoldMarketManipulationUpdateApril2018Slides_0.pdf
Slide 1 — Title
Since we were here last year some big changes have occurred in the international gold price suppression policy. These changes indicate growing tightness in the gold market — indicate that governments and central banks are having to work harder to keep the price down.
First, the Bank for International Settlements, the association of major central banks, has jumped back into the gold market
GATA consultant Robert Lambourne, who seems to be the only analyst outside government who studies the gold market interventions of the BIS, notes that footnotes in the BIS’ monthly reports show that the bank’s gold, gold swap, and gold derivative positions exploded from zero in March 2016 to 438 tonnes in March 2017 to 525 tonnes last month:
http://www.gata.org/node/18090
http://www.gata.org/node/18022
Slide 2 — BIS / Notes to the financial statements
This page is taken from the BIS annual report issued in June, covering the year ending March 31, 2017. It acknowledges 438 tonnes of gold swaps.
Slide 3 — BIS / Statement of account
This page, from the BIS’ October 2017 statement of account, shows that the BIS’ gold loans rose substantially since March last year.
What exactly is the BIS doing in the gold market and for whom?
In November I brought Lambourne’s analysis to the attention of the BIS press office and asked if his analysis was correct and if the bank could explain exactly what it was doing in the gold market and for whom. The BIS press office replied:
http://www.gata.org/node/17793
“We do not comment on specific accounts and holdings of central banks or of the BIS. Please see our latest annual report for details on gold. Further information can be gleaned from central banks directly.”
But the BIS’ annual reports provide no more substantial information about its activity in the gold market than its monthly reports do. As for obtaining information about gold market activity from BIS member central banks, they are no more forthcoming.
A few years ago GATA sued the Federal Reserve in U.S. District Court in Washington for access to its gold market records. We received very little access, since the court ruled that nearly all the Fed’s gold records are exempt from disclosure. Indeed, the most notable information we got by suing the Fed was the possibly inadvertent admission in writing by a member of the Fed’s Board of Governors, Kevin M. Warsh, that the Fed has gold swap arrangements with foreign banks and will never disclose them.
http://www.gata.org/files/GATAFedResponse-09-17-2009.pdf
Slide 4 — Warsh photo and letter
If the swapping and leasing of gold by central banks is ordinary and innocent activity, why won’t central banks disclose and explain it?
The answer to that question was given by the secret March 1999 report of the staff of the International Monetary Fund, which acknowledged that central banks conceal their gold swaps and leases to facilitate their secret interventions in the gold and currency markets:
http://www.gata.org/node/12016
http://www.gata.org/files/IMFGoldDataMemo–3-10-1999.pdf
Slide 5 — Secret IMF report
* * *
The second biggest development in the gold price suppression scheme since we last gathered here involves the New York Commodities Exchange –
Slide 6 — NYMEX/COMEX building
— where, GATA consultant Harvey Organ reports, thousands of gold futures contracts that have been called for delivery have been moved off the exchange in private transactions called “exchange for physicals,” or EFPs.
One implication of this development is that there isn’t enough gold in Comex warehouses to cover futures deliveries sought in New York and that deliveries have to be moved to London, where transactions are more easily concealed by mechanisms controlled by the London Bullion Market Association, or where long contract holders seeking delivery can be paid privately to postpone delivery.
There may be other explanations for this development, but it is recent and signifies that something big has changed about the gold market in the last year.
* * *
Perhaps not so coincidentally, as gold researcher Ronan Manly of Bullion Star in Singapore disclosed the other day, on April 1 the London Bullion Market Association —
Slide 7 — LBMA building
— will begin delaying its daily gold and silver auction price reports. Recently the auction price reports have been issued 30 minutes after the conclusion of the auctions. As of April 1 the auction price reports will be delayed 14 hours. The LBMA has provided no explanation for this delay, but of course the longer the reports are delayed, the more opportunity there will be to adjust or tamper with them.
Further, Manly discloses, the LBMA has postponed for another year its plan to start reporting individual trades of gold and silver. If something nefarious is going on with those “exchange for physicals” by which Comex futures contracts appear to be transferred to London, the LBMA’s reporting of individual trades might reveal it. Now there will be no reporting by the LBMA of individual gold and silver trades in London for at least another year:
http://www.gata.org/node/18094
* * *
In January this year U.S. authorities charged three foreign banks and eight individuals in “spoofing” of the gold and silver futures markets:
http://www.gata.org/node/18004
https://www.reuters.com/article/us-usa-cftc-arrests/european-banks-pay-4…
Slide 8 — Reuters story on spoofing
* * *
Also in January this year GATA disclosed the discounts that are being given by CME Group futures exchanges to governments and central banks for secretly trading gold and silver futures contracts. It is not widely understood that governments and central banks are secretly trading all futures contracts on U.S. exchanges, for mainstream financial news organizations refuse to report secret interventions in markets by governments:
http://www.gata.org/node/17976
http://www.gata.org/files/CMEGroupCBIP-Q&A-December2017.pdf
Slide 9 — CME Group explainer
* * *
But maybe all you really need to know about gold price suppression could have been surmised from a story on the front page of The Wall Street Journal on August 10 last year:
http://www.gata.org/node/17562
Slide 10 — Wall Street Journal front page
In that story the newspaper quoted four experts on the gold market, all of them associates of the Gold Anti-Trust Action Committee and all of them introduced to the newspaper’s reporter by me.
Slide 11 — Close-up of Wall Street Journal story
Those four experts — gold researcher Ronan Manly, Sprott Asset Management’s John Embry, GoldMoney founder James Turk, and futures market analyst James McShirley — accused the Federal Reserve of being involved with the suppression of the gold price through the surreptitious lending and swapping of central bank gold reserves.
The Wall Street Journal story was a triumph for GATA, even though the Journal declined to mention GATA by name. (The reporter told GATA Chairman Bill Murphy that the newspaper just ran out of space.)
But the story would have been a much greater triumph for us — indeed, it would have been a triumph for free markets — if the newspaper had not decided, in reporting these complaints about surreptitious government intervention in the gold market, to violate the first rule of journalism. That’s the rule about getting and reporting both sides of a story.
The Journal reported: “Some gold bugs — investors bullish on the yellow metal — think the Fed secretly lends it out to suppress prices, partly to protect the dollar’s value. In theory the Fed can feed gold into the market through swaps with other countries.”
So where were the Journal’s questions about this for the Fed and the U.S. Treasury Department? Are the Fed and the Treasury Department involved in keeping the gold price down through surreptitious interventions, or are they not involved?
But the Journal never asked such questions, even though for a year and a half, as I provided the Journal’s reporter with the documents of these interventions, I repeatedly pressed her to put the questions to the Fed and Treasury. I even provided the Journal’s reporter with a video showing New York Federal Reserve Bank President William Dudley refusing to answer a question about gold swaps during his appearance at the Virginia Military Institute on March 31, 2016.
Slide 12 — Still photo from Dudley video
Can we play that video now?
The Dudley video can be viewed here:
https://drive.google.com/file/d/1_igBCLUsgNUx4o-O3LC764QIsaWKBAU6/view
Note the inconsistency in Dudley’s response. First he talks at length about the German Bundesbank’s transactions to repatriate its gold from the New York Fed. Then, asked if the Fed is involved with gold swaps, Dudley says he can’t comment on “individual customer kind of transactions.” But he had just discussed an individual customer’s transactions with the Fed at great length — Germany’s — and the second question, about gold swaps, was not about individual customer transactions at all but simply whether the Fed was in the gold swap business.
Ordinarily news organizations are most interested in questions that high government officials refuse to answer. But mainstream financial news reporters are not interested in questions about secret government interventions in the gold market and secret interventions in markets generally. No, such questions are too sensitive, apparently considered threats to national security.
The best that mainstream financial news organizations can do is just to acknowledge the questions sometimes. Mainstream financial news organizations can never pursue the answers, no matter how easy it would be to do so.
Unfortunately most gold market analysts themselves will not pursue these questions either — at least not yet. GATA will continue working on them.
Will the gold industry itself ever pursue these questions? Will the gold industry ever stand up for itself?
If not, why should anyone invest in an industry that doesn’t care about the suppression of the price of its product?
Slide 13 — Contact and thanks
The documents I have cited today are all posted at GATA’s internet site, GATA.org, most of them in the “documentation” section:
http://www.gata.org/taxonomy/term/21
If you have any trouble locating them or have any questions about GATA’s work, I’ll be glad to hear from you at CPowell@GATA.org.
Thanks for your kind attention.
end
So far this year, China has recorded SGE withdrawals which equal Chinese citizen demand of 534 tonnes (1/4 of the year)
It seems that we will again have over 2000 tonnes of gold demanded. When you add India which has over 1000 tonnes of gold demanded, the total of just these two nations equates to over 3000 tonnes when only 2550 tonnes of gold is produced ex China ex Russia. This is why central banks are banging their heads against the wall as they are having difficulty in finding physical metal.
(courtesy Lawrie Williams)
LAWRIE WILLIAMS: China’s SGE gold withdrawals higher in Q1
China’s Shanghai Gold Exchange has just published its gold withdrawal data for March and so far this year the figure is a little higher than last year, when the full year total was a little over 2,030 tonnes, and 5% up on 2016 Q1 withdrawals when the annual total was just over 1,970 tonnes. Some analysts equate SGE gold withdrawals to total Chinese gold demand, while others may disagree, but the fact remains that the withdrawal figures on an annual basis are far closer to the sum of known Chinese gold imports, plus China’s own gold output, plus a figure for scrap conversion, than other estimates of Chinese gold demand, which tend to be somewhat limited as to what demand categories are included by the analysts in their calculations.
Table: SGE Monthly Gold Withdrawals (Tonnes)
| Month | 2018 | 2017 | 2016 | % change 2017-2018 | % change 2016- 2018 |
| January | 223.58 | 184.41 | 225.08 | +21.2% | -0.7% |
| February* | 118.42 | 148.24 | 107.60 | -20.1% | +10.7% |
| March | 192.61 | 192.25 | 183.24 | +0.2% | +5.1% |
| April | 165.78 | 171.40 | |||
| May | 138.08 | 147.28 | |||
| June | 155.51 | 138.51 | |||
| July | 144.71 | 117.58 | |||
| August | 161.41 | 144.44 | |||
| September | 214.24 | 170.90 | |||
| October | 151.54 | 153.25 | |||
| November | 189.10 | 214.72 | |||
| December | 185.21 | 196.37 | |||
| Year to date | 534.61 | 524.90 | 515.92 | + 1.8% | +3.6% |
| Full Year | 2,030.48 | 1,970.37 |
Source: Shanghai Gold Exchange. Lawrieongold.com
It is encouraging in terms of global gold demand patterns that Q1 SGE gold withdrawals are up on those of the past two years and taking the whole of Q1 that irons out the anomalies surrounding the Chinese New Year holiday period given its variable dates year to year. What will need watching now, given the apparent sharp fall in gold output from the Chinese domestic mines whether this shortfall, estimated by Metals Focus at around 35 tonnes, will be made up in additional SGE withdrawals, or indeed in gold imports, to satisfy what many observers see as strengthening Chinese gold demand this year.
Thus so far this year Chinese gold demand, as represented by SGE withdrawals is holding up well compared with the past two years – indeed is a little higher, but still well down on the record 2015 figure when Q1 withdrawals totalled 625 tonnes and the full year total a massive 2,596 tonnes.
05 Apr 2018
Your early THURSDAY morning currency, Asian stock market results, important USA/Asian currency crosses, gold/silver pricing overnight along with the price of oil Major stories overnight/9 AM EST
i) Chinese yuan vs USA dollar/CLOSED UP 6.3033 /shanghai bourse CLOSED / HANG SANG CLOSED
2. Nikkei closed UP 325.87 POINTS OR 1.53%/ /USA: YEN RISES TO 107.08/
3. Europe stocks OPENED DEEPLY IN THE GREEN /USA dollar index RISES TO 90.25/Euro FALLS TO 1.2263
3b Japan 10 year bond yield: RISES TO . +.046/ !!!!(Japan buying 100% of bond issuance)/Japanese yen vs usa cross now at 107.08/ THIS IS TROUBLESOME AS BANK OF JAPAN IS RUNNING OUT OF BONDS TO BUY./JAPAN 10 YR YIELD FINALLY IN THE POSITIVE/BANK OF JAPAN LOSING CONTROL OF THEIR YIELD CURVE AS THEY PURCHASE ALL BONDS TO GET TO ZERO RATE!!
3c Nikkei now JUST BELOW 17,000
3d USA/Yen rate now well below the important 120 barrier this morning
3e WTI:: 63.22 and Brent: 68.00
3f Gold DOWN/Yen DOWN
3g Japan is to buy the equivalent of 108 billion uSA dollars worth of bond per month or $1.3 trillion. Japan’s GDP equals 5 trillion usa./“HELICOPTER MONEY” OFF THE TABLE FOR NOW /REVERSE OPERATION TWIST ON THE BONDS: PURCHASE OF LONG BONDS AND SELLING THE SHORT END
Japan to buy 100% of all new Japanese debt and by 2018 they will have 25% of all Japanese debt. Fifty percent of Japanese budget financed with debt.
3h Oil UP for WTI and UP FOR Brent this morning
3i European bond buying continues to push yields lower on all fronts in the EMU. German 10yr bund RISES TO +.521%/Italian 10 yr bond yield UP to 1.748% /SPAIN 10 YR BOND YIELD UP TO 1.172%
3j Greek 10 year bond yield FALLS TO : 3.978?????????????????
3k Gold at $1328.75 silver at:16.29 7 am est) SILVER NEXT RESISTANCE LEVEL AT $18.50
3l USA vs Russian rouble; (Russian rouble DOWN 15/100 in roubles/dollar) 57.58
3m oil into the 63 dollar handle for WTI and 68 handle for Brent/
3n Higher foreign deposits out of China sees huge risk of outflows and a currency depreciation. This can spell financial disaster for the rest of the world/
JAPAN ON JAN 29.2016 INITIATES NIRP. THIS MORNING THEY SIGNAL THEY MAY END NIRP. TODAY THE USA/YEN TRADES TO 107.08 DESTROYING JAPANESE CITIZENS WITH HIGHER FOOD INFLATION
30 SNB (Swiss National Bank) still intervening again in the markets driving down the SF. It is not working: USA/SF this morning 0.9618 as the Swiss Franc is still rising against most currencies. Euro vs SF is 1.1794 well above the floor set by the Swiss Finance Minister. Thomas Jordan, chief of the Swiss National Bank continues to purchase euros trying to lower value of the Swiss Franc.
3p BRITAIN VOTES AFFIRMATIVE BREXIT/LOWER PARLIAMENT APPROVES BREXIT COMMENCEMENT/ARTICLE 50 COMMENCES MARCH 29/2017
3r the 10 Year German bund now POSITIVE territory with the 10 year RISING to +0.521%
The bank withdrawals were causing massive hardship to the Greek bank. the Greek referendum voted overwhelming “NO”. Next step for Greece will be the recapitalization of the banks and that will be difficult.
4. USA 10 year treasury bond at 2.8192% early this morning (THIS IS DEADLY TO ALL MARKETS). Thirty year rate at 3.0568% /
5. Details Ransquawk, Bloomberg, Deutsche bank/Jim Reid.
(courtesy Jim Reid/Bloomberg/Deutsche bank/zero hedge)
S&P Futures Rise, Global Stocks Rebound As Trade War Fears Ease
Stocks across the globe rose in a continuation of yesterday’s euphoric rally that sent the Dow Jones nearly 1000 points higher from its session lows, as the moderation of trade war rhetoric – despite the tit-for-tat tariff announcements by China and the US – lifted risk sentiment across the board. As a result, whereas yesterday’s market snapshot was a sea of red, this morning it’s green as far as the eye can see.

US TSY yields rose back over 2.80% (just shy of 2.82% as of this moment) as the dollar and commodities strengthened, while safe-haven assets including the yen and gold slipped.
In a dramatic, if low-volume, reversal, which according to many strategists was largely one widespread short squeeze, all major indices recovered from Wednesday’s initial sharp losses after US and China’s tit-for-tat tariff announcements, however fears later apparently were soothed as representatives from China and the U.S. left the door open for a negotiated solution to trade disputes. The improvement in sentiment was helped by comments from White House economic adviser Kudlow who stated that the US measures were a form of trade negotiations and that Trump’s tariffs on China are all proposals, while he added that backchannel talks with China were occurring. Furthermore, the White House noted there will be a couple of months before China tariffs are implemented with the review period ongoing, and some analysts also viewed the impact from proposed tariffs to be
manageable. It is still unclear how – or why – either Trump or Xi will show weakness and concede in the ongoing negotiations.
“I think that the substance of trade restrictions and their real impact will be far less than the headlines,” said Jeffery Becker, CEO of Jennison Associates who summarized the prevailing mood quite well. “U.S. and Chinese cross-border trade has grown significantly over the last decade and economic inter-dependence runs very deep, deeper than the actual trade numbers.”
At the same time, some argue that the global economy is currently running so well that it could even cope with the impact of the proposed tariffs, which cover a fraction of world trade. “We’ve had a few months now where markets have really been going sideways and progressively lower, but at the same time has data really rolled over? The answer is no,” Geoffrey Yu, head of the UK investment office at UBS Wealth Management, said. “The underlying economy is actually chugging along which will increase the scope for upside surprises on the corporate front, on the economic front and at some point markets will have to catch up to that.”
Meanwhile, Federal Reserve officials also chimed in and said it’s premature to fully assess the impact of the trade dispute, which is adding uncertainty to an otherwise bright economic outlook. A board member, Lael Brainard, said trade policy is “certainly something that I take into account, in thinking about risks.”
In any case, S&P futures also advanced after the S&P 500 Index on Wednesday erased a loss to close up 1.2% and were another 0.4% higher this morning, as the VIX slides back under 20.

Despite yesterday’s thundering reversal which from a loss of -2% ended up being a gain of over 1%, the biggest such intraday move since 2011, volatility is clearly back, and as the following Bloomberg chart shows, Wednesday was the 26th move of 1% or more this year, already triple the 2017 total.

One of the culprits of the recent tech wreck, Facebook, erased earlier losses in pre-market trading and was on pace to extend Wednesday’s gains as traders appeared unfazed by company disclosure that data on most of its 2 billion users could have been accessed improperly. According to Bloomberg, “investors are cautiously returning to technology shares after a selloff last month gave momentum to a global equity correction.”
Most of Asia’s major markets rose, even though China, Hong Kong and Taiwan were closed for holidays. Australia’s ASX 200 (+0.5%) and Nikkei 225 (+1.5%) were higher with strength in Australia’s largest weighted financials sector leading the local index, and the Japanese benchmark was among the outperformers as exporters cheered a weaker JPY. Elsewhere, KOSPI (+1.2%) also advanced and Straits Times Index (+2.0%) saw its largest intraday gain in over a year alongside the rising tide across stocks.
Having closed for the day before yesterday’s US short squeeze really kicked in, European stocks have advanced for the first time this week, following global peers higher, amid optimism that the U.S. and China will step back from a full-blown trade war, and boosted by a weaker euro propping up exporters. The Stoxx 600 climbs 1.6% with nearly 90% of its components in the green as mining, tech and autos lead gains.

Among regional benchmarks, Germany’s exporter-heavy DAX Index climbed the most aided by a slump in the Euro. Financials are higher as banks benefit from the US 10y yield rising back above 2.80%. In terms of stock specifics, Telecom Italia (+3.0%) is higher on sources reporting Italian state lender CDP is to purchase a 5% stake in the company. Sophos Group soars 18% after the company said it anticipates full-year reported billings growth toward the top end of the previously guided growth range. Lagging behind, Just Eat (-3.3%) is failing to deliver on the back of a downgrade by JP Morgan.
In global macro, the dollar strengthened while safe-haven assets including the yen slipped. The USDJPY briefly rose above 107 while the USDTRY hit record highs due to concerns of further rate cuts and reports of Deputy PM resigning. BRL is likely to be in focus as Lula appeal is rejected, Brazil ETF rallies in Asian trading. Elsewhere, Australia’s dollar led declines against the greenback after the country’s money-market rate fell for the first time in almost two months.
In fixed income the core has been pressured by general positive tone as curves steepen; Spanish bonds underperform after a poor 30y auction with large tail; France unusually sells toward bottom end of indicative auction range which also weighs.
Ooil prices extended their post-DoE gains (May ’18 crude WTI futures hovering around USD 63.50/bbl) amid the easing of trade war fears. Gold has lost support from safe-haven flows with prices pulling back from one-week highs as the risk tone returns to the market. Copper traded sideways during Asia hours with its largest consumer China shut for the rest of the week due to holidays, while improved market sentiment lifted London copper, which has recouped the losses seen in the previous session. Elsewhere, Shanghai aluminium stocks tumbled for the first time in nine months. Copper futures well supported, spot gold grinds lower.
Market Snapshot
- S&P 500 futures up 0.4% to 2,656.25
- STOXX Europe 600 up 1.5% to 372.66
- MSCI Asia Pacific up 0.6% to 171.90
- MSCI Asia Pacific ex Japan up 0.6% to 560.40
- Nikkei up 1.5% to 21,645.42
- Topix up 1.1% to 1,724.61
- Hang Seng Index down 2.2% to 29,518.69
- Shanghai Composite down 0.2% to 3,131.11
- Sensex up 1.5% to 33,506.31
- Australia S&P/ASX 200 up 0.5% to 5,788.81
- Kospi up 1.2% to 2,437.52
- German 10Y yield rose 1.7 bps to 0.517%
- Euro down 0.1% to $1.2262
- Italian 10Y yield fell 5.2 bps to 1.488%
- Spanish 10Y yield rose 1.6 bps to 1.182%
- Brent futures unchanged at $68.02/bbl
- Gold spot down 0.5% to $1,326.35
- U.S. Dollar Index up 0.1% to 90.24
Top Overnight News
- The U.S. and China indicated they’re willing to negotiate on escalating frictions, helping to ease fears among investors that a tit-for-tat trade dispute could derail the strongest global expansion in years
- White House economic adviser Larry Kudlow stressed U.S. tariffs announced on Chinese goods are still only proposals that might never take effect as the Trump administration sought to tamp down fears of a trade war
- U.S. President Donald Trump said a trade war with China was “lost many years ago” by his predecessors, sounding a defiant tone amid tumult in financial markets a day after his administration slapped tariffs on 1,333 Chinese products
- Barclays Plc’s debt ratings were cut to one level above junk by Moody’s Investors Service, after the U.K. bank separated its investment banking activities from retail operations to comply with new rules
- The most accurate pound forecasters are keeping calm and see the currency climbing more than 8 percent this year
- The U.K. Financial Conduct Authority wants asset managers to disclose more information about how they measure their performance, ramping up pressure on active funds to justify their charges
- Brazil’s Supreme Court has rejected former President Luiz Inacio Lula da Silva’s plea to remain at liberty while appealing a 12-year prison sentence for corruption, paving the way for the imprisonment of the front-runner in October’s elections
- Yellen spoke at a private event 2 months after leaving the Fed; she said she considered inflation to be in check and unlikely to spike, so rates would stay relatively low, according to people familiar
- Nikkei: Kim Jong Un had shown intent to return to 6-party talks on denuclearization when he met with China’s President Xi according to people familiar
- Eurozone Mar. Services PMIs: Spain 56.2 vs 56.1 est; Italy 52.6 vs 53.9 est; France 56.9 vs 56.8 est; Germany 53.9 vs 54.2 est; Markit note salary pressures within Spanish, Italian and German reports
- U.K. Mar. Services PMI: 51.7 vs 54.0 est; bad weather in March a key factor holding back number
Asian stocks traded mostly higher as the region sustained the momentum from Wall St where all major indices recovered from the initial losses seen after US and China’s tit-for-tat tariff announcements, with fears later soothed as the US hinted at a willingness for negotiations. The improvement in sentiment was helped by comments from White House economic adviser Kudlow who stated that the US measures were a form of trade negotiations and that Trump’s tariffs on China are all proposals, while he added that back-channel talks with China were occurring. Furthermore, the White House noted there will be a couple of months before China tariffs are implemented with the review period ongoing, and some analysts also viewed the impact from proposed tariffs to be manageable. As such, ASX 200 (+0.5%) and Nikkei 225 (+1.5%) were higher with strength in Australia’s largest weighted financials sector leading the local index, and the Japanese benchmark was among the outperformers as exporters cheered a weaker JPY. Elsewhere, KOSPI (+1.2%) also advanced and Straits Times Index (+2.0%) saw its largest intraday gain in over a year alongside the rising tide across stocks, while mainland China, Hong Kong and Taiwan remained shut for holidays. Finally, 10yr JGBs were subdued following losses in T-notes and with safe-havens shunned amid the heightened risk appetite, while an enhanced-liquidity auction in the super-long end also kept participants side-lined during early trade and after results showed weaker demand
Top Asian News
- Second-Biggest Pakistan Bank Targets ‘Enormous’ Youth Market
- Japan Seeks Jump in Green Bond Issuance With State Backing
- Singer Stake Looms Over Hyundai’s Plan for Smooth Succession
- Japan’s Foreign Stock Investors Come Back After 11-Week Hiatus
European bourses opened higher with 88% of the Stoxx 600 in the green as it sustained the momentum and risk appetite from Wall St. and Asia. The improvement in sentiment was aided by comments from White House economic adviser Kudlow stating that the US measures were a form of trade negotiations and that Trump’s tariffs on China are all proposals, while he added that backchannel talks with China were occurring. All sectors sit firmly in the green with material and technology names top-performers. Financials are also higher as banks benefit from the US 10y yield rising back above 2.80%. In terms of stock specifics, Telecom Italia (+3.0%) is higher on sources reporting Italian state lender CDP is to purchase a 5% stake in the company. Lagging behind, Just Eat (-3.3%) is failing to deliver on the back of a downgrade by JP Morgan.
Top European News
- Steinhoff Bows to Pressure Over Bonus Payments After Outrage
- Danske Executive Behind Baltic Unit Quits Amid Laundering Probe
- Cassa Depositi May Buy Up to 5% of Telecom Italia: Il Sole
- U.K. Economy Battered by the ‘Beast From the East’ Snowstorm
Commodities:
- DXY: The Index looks a bit more comfortable back above the psychological 90.000 level and with the Greenback firmer vs all G10 peers, bar the Loonie that continues to glean encouragement from broadly constructive NAFTA developments (negotiations said to be progressing well, albeit with some major issues yet to be resolved, and on track for an agreement in principle by mid-April). A truce or rather a time out for talks between the US and China on proposed import tariffs has calmed trade war fears, underpinning the Dollar and risk sentiment in general to the detriment of traditional safe-havens. However, the DXY really needs to reclaim 90.500 and above to maintain momentum vs highs around 90.335 thus far.
- CAD: Bucking the broader trend due to the aforementioned positive NAFTA impulses and back near recent peaks vs the Usd within 1.2780-45 parameters ahead of Canadian (and US) trade data.
- CHF: Also a bit of an outlier among majors with firmer than forecast Swiss CPI data supporting the Franc between 0.9600-30 and 1.1790-1.1805 vs the Usd and Eur respectively, but the Chf still not really trading like a safe-haven amidst market talk of SNB intervention.
- GBP: Another mover on independent factors, or to be precise in the run up to a much weaker than expected UK services PMI, with Cable drifting back from yet another test of 1.4100 resistance/multiple tops to around 1.4035 and Eur/Gbp nudging towards 0.8740.
- EUR: Losing more ground from recent 1.2300+ peaks vs the Usd and seriously probing stops around 1.2250 ahead of more layered bids in the 1.2240-20 area and decent tech support at the upper end of that range.
- JPY: Also extending losses vs the Usd and the headline pair probing a bit higher above 107.00, but not quite challenging offers said to be sitting at 107.20 and 107.30, which could expose stops above the 107.33 level (55 DMA).
In commodities, oil prices extended their post-DoE gains (May ’18 crude WTI futures hovering around USD 63.50/bbl) amid the easing of trade war fears after US officials said they are open to negotiations with China over tariffs. Gold has lost support from safe-haven flows with prices pulling back from one-week highs as the risk tone returns to the market. Copper traded sideways during Asia hours with its largest consumer China shut for the rest of the week due to holidays, while improved market sentiment lifted London copper, which has recouped the losses seen in the previous session. Elsewhere, Shanghai aluminium stocks tumbled for the first time in nine months. Qatar oil energy minister says OPEC and non-OPEC should continue cooperation over oil market.
Looking at the day ahead, in the US, data due include weekly initial jobless claims and the February trade balance reading.
US Event Calendar
- 7:30am: Challenger Job Cuts YoY, prior -4.3%
- 8:30am: Initial Jobless Claims, est. 225,000, prior 215,000; Continuing Claims, est. 1.84m, prior 1.87m
- 8:30am: Trade Balance, est. $56.8b deficit, prior $56.6b deficit
- 9:45am: Bloomberg Consumer Comfort, prior 56.8
DB’s Jim Reid concludes the overnight wrap
I’m glad this is not a podcast this morning as I was shouting and screaming so much at the football last night that I think I’ve lost my voice. For those with no interest in football Liverpool beat Man City 3-0 in the Champions League QF 1st leg. Bulldozed them in the first half, hung on for dear life in the second. Man City are 18 points clear in the Premier League so a great win but only half way in the tie.
Staying in Europe as someone that once lost his dog for two hours at a motorway petrol station in France I had some sympathy yesterday for the well-publicised German who left his two daughters behind at a petrol station en route to the Alps. For those who didn’t see the story he travelled around 100 miles before police (who phoned 48 times) could get hold of him to tell him of his mistake. Apparently they went to the bathroom while he was getting petrol and he hadn’t realised they were gone when he jumped back in. To make matters worse the girls didn’t have their father’s number and when they tried their home their mother was still asleep and not picking up. So worst Dad of the year might not be coming my way after all.
We’re at an important point in the phoney trade war that’s currently playing out between the US and China. As the European session opened China retaliated to the prior day US move by proposing 25% tariffs on around $50bn of US imports (therefore an equal reaction in $ terms). The levies are reciprocal but won’t come in immediately, but only after the US tariffs officially come into force and depends on the outcome of bilateral negotiations, so still time for things to de-escalate but it was a rapid response.
As our Chinese economist Zhiwei Zhang put it yesterday “The US announcement of tariff against China is well expected, but the Chinese reaction is stronger and faster than we expected. The macro impact on China’s growth is negligible at this stage, but another step further by either side would likely trigger retaliation with visible macro impact”.
Zhiwei thinks there is room for the two sides to negotiate though. His baseline is for the lists on both sides to be shortened. The tension will likely continue with tough talk from both sides, but he does not see further escalation beyond the lists announced yesterday. Zhiwei believes China is still willing to make compromise and open the service sector in exchange for a resolution of the trade tension. It remains in the best interest for both sides to eventually negotiate, though timing wise it may go beyond 2018. See his note here for more details about his views and what China have announced. Elsewhere, our US economists have also outlined the key products as proposed by the USTR and time line for negotiations in their note yesterday.
For us, the dilemma for markets is that equities are now ‘cheap’ relative to current economic activity (see yesterday’s equities vs PMI analysis) and therefore if you think the trade war fears are overblown and the economy stabilises then this is a good short term buying opportunity. However if the war escalates then sentiment will undoubtedly worsen further. Indeed it feels that equities are unlikely to settle at these levels. They’re more likely to rebound sharply with easing tensions or slump more with any further escalations. The status quo and low vol is the least likely outcome.
Markets did a full turnaround yesterday as the early slump (S&P 500 opened -1.56%) after China’s swift retaliation was reversed with the S&P 500 closing +1.16%. The Dow saw a 786 point intra-day range and the VIX traded as high as 24.51 before finishing -4.9% lower at 20.06. The recovery seemed to be due to a belief that negotiation could still be the end game. Indeed US Commerce Secretary Wilbur Ross appeared on CNBC earlier in the session and said the US isn’t entering “World War III” and left the door open for a negotiated solution by suggesting that “even shooting wars end with negotiations”. Further, Trump’s top economic advisor Larry Kudlow added “…there’s already back channel talks going on…this is a negotiation, using all the tools”. President Trump also played down the prospect of trade war and tweeted “we are not in a trade war with China…” On the other side, China’s ambassador to the US Cui Tiankai noted “negotiations would still be our preference…but if others does things in the wrong direction, we’ll have to respond”.
This morning in Asia, markets have followed US markets higher with the Nikkei (+1.88%), Kospi (+1.55%) and ASX 200 (+0.69%) all up while the Hang Seng and Chinese bourses are closed today for holidays. Elsewhere, Reuters reported that the US could announce sanctions on Russian business elites this week under a law targeting Moscow for interfering in the 2016 US election.
Now recapping other markets performance from yesterday. Within the S&P, only the energy sector was down (-0.14%) while gains were led by the consumer, health care and tech sectors. Boeing pared back losses of -5.73% to close -1.02% as the Chinese tariffs on aircrafts seemed to target a generation of 737 jets that are nearing the end of their production run. In Europe, the Stoxx 600 (-0.47%) and DAX (-0.37%) fell modestly while the FTSE edged up 0.05%.
Government bonds were relatively unaffected with yields on 10y Bunds (-0.1bp) and OATs (-0.8bp) down slightly after the softer than expected Euro area CPI print. Elsewhere, yields on UST 10y and Gilts rose 2.8bp and 0.8bp respectively while Italian BTPs outperformed (-5.2bp) as negotiations get underway to form a new government. In FX, key currencies were little changed with the US dollar index down -0.06% while the Euro and Sterling gained 0.07% and 0.16% respectively. In commodities, WTI oil fell -0.22% while Gold was marginally higher (+0.03%). Other base metals also weakened (Copper -0.06%; Zinc -0.74%; Aluminium -0.32%) while soybeans fell 2.19% post the proposed tariffs from China.
Now turning to the latest Fed speak. The Fed’s Bullard reiterated his dovish views and noted “current monetary policy settings are close to neutral….it’s not necessary…to raise the policy rates further” On trade, he noted the US/China trade frictions “….increases the uncertainty around the (economic) forecasts” and that “more uncertainty is likely keeping longer rates lower. I could see that feeding back and keeping short rate lower than they would otherwise be”. Elsewhere, the Fed’s Brainard noted trade policy is “a material uncertainty” to the outlook and “…it’s certainly something that I take into account, in thinking about risks”.
Following on, the Dallas Fed researchers published a note yesterday indicating the impact from metal tariffs could reduce US GDP by 0.25ppt over the long run, but the “consequences accompanying retaliation and a potential trade war could prove far more potent” with their scenario analysis suggesting US GDP could be -3.5ppt lower if the EU / China and US imposed prohibitively high tariffs on each other across every industry. Elsewhere on NAFTA talks, unnamed sources told Bloomberg that the Trump administration may softened its demand for higher North American content in cars produced by introducing a tiered system on parts, although Canada’s ambassador to the US noted “there’s still lots of issues…we’re going to work hard to try and narrow down the gaps and get to…an agreement”.
Before we take a look at today’s calendar, we wrap up with other data releases from yesterday. In the US, the March ADP employment change was above expectations at 241k (vs. 210k) and broadly similar to readings over the past three months. The March ISM non-manufacturing index was marginally below (58.8 vs. 59 expected) while the February factory orders was also weaker than expected at 1.2% mom (vs. 1.7%). Elsewhere, the final reading of the February core capital goods orders was unrevised at 1.4% mom while core durable goods orders was revised -0.2ppt to 1% mom. Also the final reading for the March services PMI was 54 (vs. 54.2 expected) while the composite PMI was revised down by -0.1 to 54.2.
The Euro area’s March core CPI was below market at 1% yoy (vs. 1.1% expected) and steady for the third consecutive month. Elsewhere, the Euro area’s February unemployment rate was in line at 8.5% and marked a fresh 10 year low, while Italy was 10.9% (vs. 11% expected). In the UK, the BRC shop price index fell 1.0% yoy in March, which was the weakest result in 13-months.
Looking at the day ahead, non-manufacturing PMIs should again dominate the morning session with final March revisions due for the core and non-core countries. Also due are February factory orders data in Germany, and February PPI for the Euro area. In the US, data due include weekly initial jobless claims and the February trade balance reading. Off to find some Lozenges.
3. ASIAN AFFAIRS
i)THURSDAY MORNING/WEDNESDAY NIGHT: Shanghai closed HOLIDAY /Hang Sang CLOSED HOLIDAY / The Nikkei closed UP 325.87 POINTS OR 1.53%/Australia’s all ordinaires CLOSED UP .41% /Chinese yuan (ONSHORE) closed UP at 6.3033/Oil DOWN to 63.22 dollars per barrel for WTI and 68.00 for Brent. Stocks in Europe OPENED DEEPLY IN THE GREEN . ONSHORE YUAN CLOSED UP AT 6.3033 AGAINST THE DOLLAR. OFFSHORE YUAN CLOSED UP ON THE DOLLAR AT 6.2938 /ONSHORE YUAN TRADING WEAKER AGAINST OFFSHORE YUAN/ONSHORE YUAN TRADING STRONGER AGAINST USA DOLLAR/OFFSHORE YUAN TRADING MUCH STRONGER AGAINST THE DOLLAR . CHINA ON HOLIDAY TODAY/CHINA RETALIATES WITH TARIFFS/LOOKS LIKE A FULL TRADE WAR IS BEGINNING/
3 a NORTH KOREA/USA
North Korea/South Korea
3 b JAPAN AFFAIRS
The Central Bank of Japan now owns 77% of all ETF’s in Japan on top of just about all of Japanese Government debt.
This is an accident waiting to happen
(courtesy zerohedge)
The BOJ Goes On A Record ETF Buying Spree To Prevent A Market Rout
Over the weekend we showed something troubling: in the week ended March 23, the ECB stepped up its purchases of corporate bonds under the Corporate Sector Purchase Programme, just as EUR-denominated Investment grade spreads blew out.

And, as Goldman calculated, after averaging €1.4 billion in weekly corporate bond purchases YTD, that week the ECB purchased €2.2 billion – 55% above their 2018 average and nearly double the €1.26BN in purchases from the prior week – in an effort to calm the market just as yields blew out.

In other words, just as the manipulated, CB-backstopped markets were sliding, and suddenly threatened to careen into a momentum-ignited selling panic, it was up to the ECB to provide the support to avoid an all out liquidation, undoing years of central bank intervention in a matter of hours. And that’s precisely what the ECB did.
As it turns out, the ECB wasn’t alone in intervening in the “market” to prevent a rout.
According to Bloomberg calculations, in the turbulent month of March which saw the Nikkei tumble as the USDJPY slumped to a multi-year low amid global equity volatility and the return of the Moritomo scandal, the Bank of Japan spent a record 833 billion yen ($7.8 billion) it had printed out of thin air to buy ETFs tracking the country’s shares, the largest amount ever according to data back to 2010.

As Bloomberg points out, not even the record BOJ intervention was enough to avoid a drop: the central bank stepped in as the Japanese market slumped and its benchmark Topix index inked its first back-to-back monthly declines since the start of 2016.
Worse, Kuroda’s bank hedge fund is now ahead of its scheduled goal to spend 6 trillion yen a year on ETFs purchases prompting some to ask what happens when central banks do indeed step away: “If the market keeps on falling, there will be the problem of what they do next,” said Kazuyuki Terao, CIO for Japan’s arm of Allianz Global Investors.
And while the market may or may not keep falling, the BOJ is faced with another problem: as of this morning the central bank owns 77% of all Japanese ETFs, up from 75% just a few months back. At this rate it will become the sole owners of not only all JGBs but also all Japanese ETFs.

And to think there was a time – not long ago – when naive market participants assumed that central banks don’t actively participate in markets to directly prop up assets, both stocks and bonds.
Now? It’s seen as perfectly ordinary that institutions that create money out of thin air and can buy with complete disregard for price or cost, step in to support risk assets at their leisure. We would have added “in the market”, but at this point it is anything but.
end
c) REPORT ON CHINA
Two things to be cognizant of:
- China is already declaring victory in their trade war with the uSA as they correctly state that China has targeted key industries such as autos, chemicals and of course soybeans
- China has hinted that they may wish to lower the value of the USA dollars and that means dumping their huge amount of treasuries.
(courtesy zerohedge)
China Declares Trade War Victory: Gloats At US “Suffering” After “Crushing Counterattack”
Barely a day after China dropped the hammer on US stock markets by unveiling retaliatory tariffs on $50 billion in US imports that – unlike US measures that mostly targeted obscure industrial products – actually struck at key industries like soybean farmers, automobiles and airplanes, the Communist Party crowed about what it already sees as its “victory” in the nascent trade war in an editorial published by the Global Times, China’s state-owned, English-language tabloid and extremely hawkish party mouthpiece.
In the editorial, China swatted away US claims – repeated most recently by Larry Kudlow during this morning’s interview with Fox Business’s Maria Bartiromo – that China has somehow victimized the US via its trade agreements while gloating about the leadership’s decision to strike at a “massive weak spot” for the US economy.
While the tit-for-tat tariffs could hurt both economies, the damage to China’s economy caused by the US’s Section 301 tariffs will “pale in comparison to the damage done to the US economy via China’s retaliations.”
And just to illustrate that point, literally, a Chinese cartoonist showed that another way Beijing will hurt the US is by a “stockmarket squeeze.”

Furthermore, in standing up to America’s “bullying tactics”, China warns that the pleasure the US had derived from its sanctions in the past “will now cause them suffering as their financial and political gains diminish to zero.”
This is Beijing’s clear show of retaliation toward the proposed tariff list on Chinese products from the US. Beijing showed an impressive response time for its retaliation efforts, taking less than 12 hours to announce its trade countermeasures. Chinese officials agree that its country’s countermeasures match those imposed by the US and that they showcase China’s determination to win this trade war.
It is worth noting that China strikes the US side by targeting its most valuable imports, such as soybeans, automobiles and chemical products. These aspects were targeted because they represent key pillars in the US imports and can create a massive weak spot for the US economy if their profitability is at risk.
Although China will sustain financial losses thanks to the US’ Section 301 investigation tariffs,they will pale in comparison to the damage done to the US economy via China’s retaliations.
China’s counter tariffs are a spectacular way of standing up to America’s bullying tactics, not only for itself, but for other countries threatened by the US’s new trade policies.
And with China digging in for a long, protracted trade conflict, one from which it will never surrender, if it is indeed Kudlow’s – and the Administration’s – hope that China will concede to US trade demands, then there will be much disappointment all around.
Underscoring China’s preparation for a “scorched earth”, and tit-for-tat escalating war, the Chinese government has told its citizens it is prepared to go toe-to-toe in its fight with Washington. In fact, more and more Chinese citizens think that an “epic trade war” is inevitable, which would knock some common sense into the US government so that it will change its way of dealing with China.
Hawkish politicians in Washington have obviously overestimated the capability and endurance of the US economy in a trade war, since they believe they can do whatever they like. China has shown a great deal of restraint for now, but if the US persists in this trade war, China is ready to fight to the end.
Washington will eventually see what they have lost, thanks to their actions, and it will only serve to embarrass the US. This trade war will serve as a good example to the US that it cannot use intimidating trade tariffs as a form of diplomacy.
Before China announced its recent retaliatory tariffs on US products, Washington enjoyed crushing and threatening other countries on trade sanctions. Now, as China deploys its counterattack, the pleasure that the US achieved from those tariffs will now cause them suffering as their financial and political gains diminish to zero.
If a trade war does happen, China has contingency plans to help its economy avoid a slump.
And, in a dramatic break with precedent, China warned it could even take steps to weaken the US dollar, something that, if history is any guide, should be a concern to the Treasury market as it would suggest that China may be thinking of liquidating its Treasurys .
Many believe that the Trump administration’s $50 billion tariff on Chinese products is meant to pressure China to submit to the US demands. If that is the case, the US will undoubtedly lose. This is because the Chinese government has rallied its citizens and is prepared to go toe-to-toe in its fight with Washington. In fact, more and more Chinese citizens think that an “epic trade war’ is inevitable, and could knock some common sense into the US government, so that it will change its way of dealing with China.
If the trade war happens, China will show that it has just as many reserve plans as the US, if not more. Chinese experts suggest that China could even take actions to weaken the strength of its currency. Since China is the world’s largest trading economy and the largest buyer of commodities like oil products, China could use its influence to push its own currency, RMB, in global markets to reduce the dominance of the US dollar. That would be a heavy blow to Washington.
If this trade war comes to pass, it will be an evenly matched total war between China and the US economies, and not some small scuffle. It would be delusional for the US to think it will be victorious at the end of this trade war. China comes up with the conclusion in confidence, and will not shy away from letting Washington know in this situation.
And while taking overt steps to weaken a currency would violate a G-20 communique agreeing to avoid currency wars through competitive devaluations, we doubt that would stop Beijing should Trump push it too far.
Meanwhile, a greater – and more likely – risk than a Treasury dump by Beijing is another devaluation: after all the Yuan is already back to where it was in the days just before the Yuan’s 2016 deval. Fears about an impending yuan devaluation akin to the drop that unleashed turbulence across global markets back in August 2015 have historically had a negative impact. Traders will remember 2016, when markets got off to one of their worst early performances in decades as continued daily, if less acute, Yuan devaluations hurt stocks.
While this warning appears to have been largely overlooked by markets, it’s definitely something to keep in mind.
END
The way China and the uSA are going at each other, there is no way that there is going to be a settlement between them. Trump is now building an army of nations in its war against China
(courtesy zerohedge)
Trump Is Building An Army Of Nations In Trade War Against China
Having realized (perhaps) that taking China one on one will be difficult, not to mention lead to major stock market losses, Trump has decided to spread the pain, and is quietly building an army coalition of nations to join the US in the trade war against China. The first stop: Latin America.
Trump is due to make his first visit to the region next week to attend the Summit of the Americas in Lima, Peru, a trip which comes as his administration is waging a trade battle with China on one front and and pushing to overhaul NAFTA on the other. While there, Trump will make the case case that the US – and not China – should be the trade “partner of choice” for Latin America, a senior administration official said on Thursday told Reuters.
“President Trump has been very clear … in terms of his economic policies that the Chinese economic aggression in the region has not been productive for the hemisphere and that the United States should remain the partner of choice for them,” the official told reporters on a conference call.
Trump will deliver an address to the summit where he will talk about “shared values” in the hemisphere and the need to reduce drug trafficking, the official said. Substantive discussions on NAFTA are not expected at the summit, the official said.
Ironically, the trip also comes as Trump has been raging against migration from the region, having recently successfully halted a “migrant caravan” from Guatemala headed for the US in hopes of obtaining asylum. It was unclear how much emphasis Trump would place on stopping illegal immigration from the region into the United States – one of his main promises in his presidential run for office, and a very sensitive topic for those present. Surely, some form of quid-pro-quo will be unveiled, as in Latin America may side with the US against China but only if Trump agree to accept a given number of migrants.
* * *
Separately, earlier on Thursday Larry Kudlow confirmed that Trump is indeed building an army ahead of the big showdown with China. According to Bloomberg, Kudlow wants to rally “pro-market allies to push back against China’s unfair trade practices,” a senior White House adviser said.
“The damage of our economy comes from China’s restrictive practices. Blame China. They’ve been doing this for decades. Don’t blame Trump,” Larry Kudlow, head of the White House’s National Economic Council, told reporters in Washington.
In threatening to punish China for its abuse of intellectual property, Trump is “doing what everyone in the world has said we should do,” said Kudlow, adding that the administration will have more to say about its efforts to recruit other major economies to support the U.S. position.
“I call it a trade coalition of the willing. I think everybody in the world knows that China has not played by the rules for many years,” he said.
As reported earlier, for a second straight day Kudlow sought to reassure investors about Trump’s plan to impose tariffs on $50 billion worth of Chinese products. Kudlow emphasized that the tariffs haven’t been enacted, and the administration will consult with a range of parties, including U.S. lawmakers, the agriculture industry and the Chinese government itself. Overnight, China said Tuesday it prefers to negotiate a solution, but isn’t afraid to retaliate if the U.S. duties take effect. “It’s nothing around the corner. There’s going to be big discussion about it,” Kudlow said.
Perhaps, but according to the Chinese press, China has already won the “Trade Wars“, which suggests that the only retreat possible is if Trump admits defeat, which knowing the president appears very unlikely, which in turn makes it very likely that the ongoing euphoric burst which has sent the Dow Jones 1000 points higher in the past 2 days will not last long.

4. EUROPEAN AFFAIRS
France is a bit of a turmoil with rotating rail strikes. Macron is trying to change the hugely debt ridden public transportation rail operations Citizens of France are worried that he might privatize the rail..and that has set of the protests.
(courtesy Mac Slavo/SHFTPlan.com)
French Rail Staff Stage Protests Against Tyrannical President Emmanuel Macron
Authored by Mac Slavo via SHTFlan.com,
French rail workers have launched three months of rolling train strikes.
The strikes are on schedule to become the largest and most chaotic industrial action against Emmanuel Macron’s drive to overhaul state transport and liberalize the economy.

The media is calling the protests “Black Tuesday,” while simultaneously attempting to deflect from the left-of-left dictator in charge, Emmanuel Macron.
The opening day of train strikes was expected to cause disruption for France’s 4.5 million rail passengers after around 33% of all train staff and more than 75% of drivers walked out.

The rail sector is traditionally one of France’s riskiest political issues. It’s quickly become a battleground on which Macron is refusing to budge in order to prove that he can face down strikes and continue with a liberalizing overhaul of other sectors.
The government argues that France’s heavily in debt state railway company, the SNCF, has to be made more efficient before local and national passenger services open up to competition in coming years under EU rules.
The government intends to cut rail workers’ special employment rights so that new hires would not have jobs for life or special retirement provisions. But there are also plans to change the SNCF structure, turning it into a publicly listed company. -The Guardian
Leftists worry that should the government own 100% of shares in the rail company that it would lead to complete privatization. The Socialist politician Julien Dray warned of a veiled plan for “rampant privatization.” (Oh no! Not the free market handling transportation! It’s like Armageddon!) Of course, the French government denies that they want privatization, which is probably true. Governments don’t like the free marketas it’s incredibly difficult to control and manipulate. They’d more likely than not total control of all services.
The standoff has become a public relations battle that has hit at the heart of Macron’s liberalization program.
“We need to rid this country of its strike culture,” Gabriel Attal, a spokesman for Macron’s party, La République En Marche, said on Monday.
end
The following commentary should make you think that the poisoning of Skripal and his daughter was not of Russian origins:
(courtesy Rob Slane/Blogmire.com)
The Three Most Important Aspects Of The Skripal Case… And Where They Might Be Pointing
Authored by Rob Slane via TheBlogMire.com,
I have now asked a total of 50 questions around the Skripal case, which you can find here and here. Having gone back through these questions, as far as I can see only three have been answered by the release of public information or events that have transpired. These are:
- Are they (Sergei and Yulia Skripal) still alive?
- If so, what is their current condition and what symptoms are they displaying?
- Can the government confirm that its scientists at Porton Down have established that the substance that poisoned the Skripals and D.S. Bailey was actually produced or manufactured in Russia?
On the first two points we are now told that Yulia Skripal’s condition has significantly improved to the point where she is said to be recovering well and talking. However, although this provides something of an answer to these questions, it also raises a number of others. Is she finally being allowed consular access? Is she being allowed to speak to her fiancé, her grandmother, or her cousin by telephone? Most importantly, how does her recovery comport with the claim that she was poisoned with a “military-grade nerve agent” with a toxicity around 5-8 times that of VX nerve agent?
On the other point, we do now have a definitive answer from none other than the Chief Executive of the Defence Science and Technology Laboratory (DSTL) at Porton Down, Gary Aitkenhead: No, Porton Down was not able to identify the substance as being produced or manufactured in Russia.
It is important that reasonable questions continue to be raised, as they not only help clarify the actual issues, but the answers — or lack thereof — are also a good barometer as to how the official narrative stacks up. As a keen observer of the case — especially since it took place just a few hundred yards from my home in Salisbury — I have to say that the official narrative of the British Government has not stood up to even the most cursory scrutiny from the outset. In fact, there are three crucial issues that serve to raise suspicions about it, and to my mind these issues are the most important aspects of the case so far:
- The absurd speed at which the British Government reacted to the incident
- The British Government’s ignoring of legal frameworks and protocols
- The large number of discrepancies between events and the official narrative
Let’s just look at these in turn.
1. The absurd speed at which the British Government reacted to the incident
I remain astonished at the manner and the speed with which the British Government reacted to this incident. There was the speed with which the Foreign Secretary, Boris Johnson, first pointed the finger of culpability, less than 48 hours after the incident, and before any investigation or analysis of the substance had taken place. There was the speed with which Porton Down was apparently able to analyse and identify the substance, even though it is set to take the Organisation for the Prohibition of Chemical Weapons (OPCW) at least three weeks to carry out a similar identification. There was the speed with which the British Government officially accused the Russian Government of being behind the incident, and the 36-hour ultimatum given to it to prove its innocence without being given any of the evidence that apparently showed its culpability. There was the speed with which the British Government, armed with evidence that looked like it was put together by a rather dull 14-year-old on work experience, managed to convince a number of other countries to expel diplomats, including 60 from the United States.
Why, if it was so sure of its claims, did the British Government feel the need to act so hastily and recklessly, rather than await the results of the investigation?
2. The British Government’s ignoring of legal frameworks and protocols
Not only has the British Government acted with lightning speed, it has also ridden roughshod over a number of international legal agreements and protocols.
Firstly, there is the involvement of the OPCW. What ought to have happened is the British Government should have invited the OPCW in as part of the investigation immediately upon suspicion of the use of a nerve agent. However, according to the British Government’s own timeline, it wasn’t until March 14th– the day that Mrs May formally announced the culpability of the Russian State to Parliament – that she actually wrote to the OPCW to involve them in the case. This is, I understand, contrary to the obligations Britain has as a member of the OPCW, and signatory to the Chemical Weapons Convention (CWC).
In addition, the British Government has refused to provide evidence to the Russian Government. Again, my understanding is that this is contrary to the protocols set out in the CWC.
The British Government has also refused to grant the Russian Embassy in London consular access to two Russian nationals, Sergei and Yulia Skripal, which it is legally obliged to do under Articles 36 and 37 of the 1963 Vienna Convention and Article 35 (1) of the 1965 Consular Convention.
Why, if it was so sure of its claims, did the British Government feel the need to ignore international agreements to which it is a signatory, and instead act in this opaque and frankly suspicious manner?
3. The number of oddities and discrepancies in the official narrative
The speed of apportioning blame and the ignoring of international legal agreements might not have looked nearly as suspicious had the narrative presented by the British Government and the facts on the ground been in harmony with one another. But they have not been.
Instead, many of the actual events that have transpired over the weeks since the incident was first reported simply do not fit the overarching explanation given.
Below are five of the most important:
1. As mentioned above, the Chief Executive of Porton Down, Gary Aitkenhead has confirmed that the laboratory was unable to identify the origin of the substance used to poison the Skripals. This is in direct contradiction to the claims made by the Foreign Secretary, Boris Johnson, who said the following on the Andrew Marr Show on 18th March:
“Obviously to the best of our knowledge this is a Russian-made nerve agent that falls within the category Novichok made only by Russia, and just to get back to the point about the international reaction which is so fascinating…”
If it’s made only by Russia, as Mr Johnson claimed, then it must have originated in Russia. Right? Yet Mr Aitkenhead says they were unable to identify where it was made.
Then in an interview with Deutsche Welle two days after his above comments, Mr Johnson was categorical about the source of the nerve agent as being Russian. Here’s the exchange:
Interviewer: You argue that the source of this nerve agent, Novichok, is Russia. How did you manage to find it out so quickly? Does Britain possess samples of it?
Johnson: “Let me be clear with you … When I look at the evidence, I mean the people from Porton Down, the laboratory …”
Interviewer: “So they have the samples …
Johnson: “They do. And they were absolutely categorical and I asked the guy myself, I said, ‘Are you sure?’ And he said there’s no doubt.”
Who “the guy” is, perhaps we’ll never know. The cleaner perhaps? I suppose a politician of Mr Johnson’s calibre will happily try to weasel his way out of the implications of what he said. But to us lesser mortals, it does rather look like he was deliberately misleading, doesn’t it
2. Much of the investigation initially concentrated on where the Skripals were poisoned. Amongst the suggestions made were the bench on which they collapsed, the Zizzi restaurant where they had eaten, Ms Skripal’s luggage or Mr Skripal’s car. Then, some 24 days after the incident, it was announced that a high concentration of the “military-grade nerve agent” had been found on the front door, and that this was the likely place of poisoning. Yet it is known that after leaving the house, Mr Skripal and his daughter drove into the City Centre, went to the Mill pub, and then to the restaurant where they ate a meal together. In other words, according to the door theory, the two of them were poisoned by a military grade nerve agent, which then took over three hours to have any effect. Odd, wouldn’t you say?
3. Furthermore, it has been stated that the two of them became ill at the same time on the bench in the Maltings. Therefore, if they were poisoned at the front door, this would mean that not only did the two of them feel little or no effects for the three hours or so that followed, but it would also mean that a large 66-year-old man and an averagely built 33-year-old woman, of different height, weight and metabolism, somehow succumbed to the effects of poisoning at exactly the same time, some three hours or so later. Again, is that not very odd?
4. The claim that they were poisoned by a military grade nerve agent, of a type said to be 5-8 times the toxicity of VX nerve agent, is itself surely open to question. Both Mr Skripal and his daughter not only survived, but Yulia Skripal is now said to be sitting up and talking just weeks later. Perhaps it is possible to survive a miniscule dose of such a nerve agent. The problem with this is that according to many earlier claims, there were significant traces of the substance in various parts of the City of Salisbury, which indicates that it cannot have been a very miniscule amount that they came into contact with at the door. Which means that we are being asked to believe that they were poisoned by “more than a miniscule amount” of this deadly poison, but both somehow survived, despite neither receiving an antidote (a fact now confirmed by Gary Aitkenhead). Does that not seem improbable?
5. The official explanation – that this was planned and authorised at the highest level within the Russian Government – would lead one to believe that the action was carried out by top level agents of the FSB. Yet the mode of attack – nerve agent apparently smeared or sprayed on the door – has to be one of the least effective methods that could be used to assassinate anyone. For a start, it rains a lot in Salisbury, and it did indeed rain on the day of the poisoning. If the substance was left at the front door (assuming it was the outside), the attacker(s) could have had no guarantee that it would not be washed off before Mr Skripal touched it. Nor could they have had any guarantee that he, as opposed to his daughter or perhaps a delivery person etc, would come into contact with it. And of course there is the fact that Mr Skripal is still alive. Does any of this seem consistent with the narrative of a professional, Kremlin-authorised hit-job.
Conclusion
Where does this leave us?
The official narrative would have us believe that the Russian Government authorised the killing of a has-been (former?) MI6 spy, who it had freed in 2010 and who presumably posed no threat to it, just a week before the Russian election and weeks before the World Cup, using a nerve agent with an exclusively Russian signature, in a way (on the door) that could not guarantee the intended target would touch it. This would be difficult enough to swallow by itself, but the British Government’s rush to judgement, disregard for law, and the many discrepancies in the actual events themselves make this scenario absurdly implausible.
Another possibility – that the British Government or intelligence services were behind the incident – has been given great credibility by the British Government itself, in its absurdly quick reaction to the incident and its blatant ignoring of legal protocols. These actions were bound to fuel suspicions about the possibility of its own involvement, and I have to say that such suspicions are absolutely legitimate precisely because of the way it has behaved. However, it must be said that the oddities and discrepancies in the case don’t lend themselves very well to the idea of a carefully planned false flag. If British intelligence had planned a hit job on Mr Skripal using a military-grade nerve agent “of a type developed by Russia”, in order to then pin the blame on the Russian Government, I doubt very much that Mr Skripal and his daughter would still be alive, or that the explanation for where the poison was administered would be changing on a daily basis, or that the British Government’s evidence to other countries would have been as risible as it was (unless of course our intelligence agencies are as incompetent as such a scenario would require them to be, that is).
My hunch – and it is just that – is that Mr Skripal himself was perhaps still working for British intelligence, and may have been in possession of a nerve agent. Somehow, this involvement went wrong, and he ended up accidently poisoning himself and his daughter on the bench in The Maltings. The Government then scrambled to concoct a story in order to cover up the real story of a Russian working for MI6 and handling nerve agents, and so quickly decided to point the finger at that most convenient scapegoat, the Russian Government.
The reason that I’m attracted to this possibility is that it explains all three aspects I have described above, and which I think are the most important aspects of the case. The rush to judgement — which looked like panic-mode to me — could have been an attempt to divert attention away from the investigation looking at the possibility of Mr Skripal having military grade nerve agent in his possession. The ignoring of international legal protocols, at least for a time, could have been done to ensure that the case was not probed by any outside body, which may well have exposed discrepancies. And it could also explain many of the oddities mentioned above, such as traces of nerve agent apparently being found in various places in Salisbury, since these could have come about because Mr Skripal was in possession of some sort of nerve agent when he left his house that day.
As I say, this is just a hunch and purely speculative. I am probably wrong. But unless the British Government is able to produce far better evidence than it has so far produced, to back up the claims it has made, I shall consider it a more credible possibility than the one they have sold to the British public.
5. RUSSIAN AND MIDDLE EASTERN AFFAIRS
Russia/UK
Russia is still denied request to join the OPCW investigation into the Skripal poisoning. Very strange.
(courtesy zerohedge)
Russia Denied Request To Join OPCW Investigation Into Skripal Poisoning
Russia has been denied the right to participate in an international chemical watchdog’s investigation into the Salisbury nerve agent attack on former (?) Russian double agent Sergei Skripal and his daughter Yulia Skripal.

Fifteen countries voted against Russia’s bid, while six voted for it and 17 abstained.
“Unfortunately, we haven’t been able to have two-thirds of the votes in support of that decision. A qualified majority was needed,” Russian ambassador Alexander Shulgin told reporters, adding “Russia as well as other states that are members of the Executive Committee have been pushed aside from this investigation.”
UK’s Foreign Secretary Boris Johnson brushed aside Russia’s request, calling it a “ludicrous proposal” designed to “undermine” the Organization for the Prohibition of Chemical Weapons (OPCW) investigation.
“Russia has had one goal in mind since the attempted murders on UK soil through the use of a military-grade chemical weapon – to obscure the truth and confuse the public,” Johnson said. “The international community has yet again seen through these tactics and robustly defeated Russia’s attempts today to derail the proper international process.”

Johnson also said that “none of us have forgotten” about the “barbaric” chemical weapons attack in Syria a year ago.
“After the OPCW-UN investigation found that the Syrian regime was responsible, Russia blocked that body from doing any more work,” he said.
Russia wants to discuss a letter sent by UK Prime Minister Theresa May to the UN Security Council which says it’s “highly likely” that Moscow was behind last month’s nerve agent attack.
Meanwhile, as we reported yesterday, the chief scientist from the UK’s Porton Down military laboratory facility, Gary Aitkenhead, told Sky News that they had been unable to prove that the novichok nerve agent used to poison Sergei and Yulia Skripal came from Russia.

Sky News
✔@SkyNews
#Salisbury attack: Scientists have not been able to prove that Russia made the nerve agent used in the spy poisoning. Porton Down lab’s chief exec reveals the details in this interview
“We were able to identify it as novichok, to identify that it was military-grade nerve agent,” Aitkenhead said. “We have not identified the precise source, but we have provided the scientific info to government who have then used a number of other sources to piece together the conclusions you have come to.”
**PAGING COLIN POWELL. IS THERE A MR. POWELL IN THE BUILDING?**

The Porton Down chief scientist said that establishing the Novichok’s origin required “other inputs,” some of which are intelligence based and which only the government has access to.
Aitkenhead added: “It is our job to provide the scientific evidence of what this particular nerve agent is, we identified that it is from this particular family and that it is a military grade, but it is not our job to say where it was manufactured.”
So whose job is it to determine where the Novichok was manufactured?
That said, it was also noted that the nerve agent involved required “extremely sophisticated methods to create, something only in the capabilities of a state actor,” and that there is no known antidote to Novichok – nor was any administered to either of the Skripals.
Aitkenhead would not say whether the Porton Down facility had manufactured or maintained stocks of Novichok – long rumored to be the case.
“There is no way anything like that could have come from us or left the four walls of our facility,” said the chief.
Boris Johnson has come under fire since the Porton Down chief’s statement, as Johnson lied, saying in an interview two weeks ago that Porton Down officials told him there was “no doubt” that the nerge agent came from Russia.
The Foreign Office told Sky News that Johnson “misspoke,” which is apparently UK officialspeak for “he totally lied, but nobody will hold him accountable for it.”
Perhaps Johnson “misspoke” in his rush to locate a hairbrush?

6 .GLOBAL ISSUES
Bill Blain on yesterday’s action on New York’s stock market..basically a giant short squeeze, on low volume
(courtesy Bill Blain/Mint Partners)
Bahrain discovers a massive 80 billion barrels of oil
(courtesy zerohedge)
Bahrain Discovers Largest Oil Field With 80 Billion Barrels In Reserves
Bahrain officials have revealed that the tiny gulf kingdom has discovered some 80 billion barrels of shale (otherwise known as tight) oil – the kingdom’s largest oil and gas find ever. The field also discovered 14 trillion cubic feet of natural gas beneath an existing field.
Oil Minister Sheikh Mohammed bin Khalifa Al Khalifa said the kingdom has not yet determined how much of the oil can be easily extracted, according to the Associated Press.

The oil fields were discovered in the offshore Khalij al-Bahrain Basin, which covers some 770 square miles in the shallow waters off Bahrain’s west coast.
The underwater shale would dwarf the country’s existing reserves.
According to figures from the US Energy Administration, Bahrain currently pumps about 45,000 barrels a day from its Bahrain Field. It also shares income from a deposit with Saudi Arabia that produces about 300,000 barrels a day.
“Initial analysis demonstrates the find is at substantial levels, capable of supporting the long-term extraction of tight oil and deep gas,” the Sheikh said.
He added during the news conference, which was held in Manama on Wednesday, that Bahrain’s National Oil and Gas Authority hoped to lure foreign oil and gas firms to develop the field where the reserves were found, per the BBC.

Bahrain has been pumping oil since 1932 and was among the first Arab Gulf states to extract oil.
According to the Guardian, industry consultants DeGolyer and MacNaughton (Demac) have worked with Bahrain to evaluate the newfound reserves.
“Demac evaluated the reservoir and test data, evaluated volumetric and recovery potential, and provided reports documenting both prospective and contingent resources. This is a project which breaks new ground for the industry,” a spokesperson said.
The country has not historically been a major oil producer – but the new field, which officials said could come online within five years, has the potential to dramatically change that. According to the initial estimates, the oil deposits are roughly the size of Russia’s oil deposits.
It could also help bolster the sagging Bahrainian economy, which has suffered from low oil prices and unrest among the majority Shia population. The country, like most of its neighbors, is run by a Sunni monarchy, and low oil prices have forced it to cut back on popular government handouts, leading to a some unrest.
8. EMERGING MARKET
end
Your early morning currency/gold and silver pricing/Asian and European bourse movements/ and interest rate settings THURSDAY morning 7:00 am
Euro/USA 1.2263 DOWN .0029/ REACTING TO MERKEL’S FAILED COALITION/ SPAIN VS CATALONIA/REACTING TO +GERMAN ELECTION WHERE ALT RIGHT PARTY ENTERS THE BUNDESTAG/ huge Deutsche bank problems + USA election:/TRUMP HEALTH CARE DEFEAT//ITALIAN REFERENDUM DEFEAT/AND NOW ECB TAPERING BOND PURCHASES/JAPAN TAPERING BOND PURCHASES /USA FALLING INTEREST RATES AGAIN/HOUSTON FLOODING/EUROPE BOURSES ALL DEEPLY IN THE GREEN
USA/JAPAN YEN 107.08 UP 0.279 (Abe’s new negative interest rate (NIRP), a total DISASTER/SIGNALS U TURN WITH INCREASED NEGATIVITY IN NIRP/JAPAN OUT OF WEAPONS TO FIGHT ECONOMIC DISASTER/DEADLY UNWINDING OF YEN CARRY TRADE
GBP/USA 1.4044 DOWN .0053 (Brexit March 29/ 2017/ARTICLE 50 SIGNED/BREXIT FEES WILL BE CAPPED
USA/CAN 1.2772 UP .0019 (CANADA WORRIED ABOUT TRADE WITH THE USA WITH TRUMP ELECTION/ITALIAN EXIT AND GREXIT FROM EU/(TRUMP INITIATES LUMBER TARIFFS ON CANADA/CANADA HAS A HUGE HOUSEHOLD DEBT/GDP PROBLEM)
Early THIS THURSDAY morning in Europe, the Euro FELL by 29 basis points, trading now ABOVE the important 1.08 level RISING to 1.2280; / Last night Shanghai composite CLOSED HOLIDAY / Hang Sang CLOSED HOLIDAY /AUSTRALIA CLOSED UP .41% / EUROPEAN BOURSES OPENED DEEPLY IN THE RED
The NIKKEI: this THURSDAY morning CLOSED UP 325.87 POINTS OR 2.19%
Trading from Europe and Asia
1/EUROPE OPENED DEEPLY IN THE GREEN
2/ CHINESE BOURSES / : Hang Sang CLOSED HOLIDAY / SHANGHAI CLOSED HOLIDAY /
Australia BOURSE CLOSED UP .41%
Nikkei (Japan) CLOSED UP 325.87 POINTS OR 1.53%
INDIA’S SENSEX IN THE GREEN
Gold very early morning trading: 1328,55
silver:$16.27
Early THURSDAY morning USA 10 year bond yield: 2.8192% !!! UP 2 IN POINTS from WEDNESDAY night in basis points and it is trading WELL ABOVE resistance at 2.27-2.32%. (POLICY FED ERROR)/
The 30 yr bond yield 3.0568 UP 3 IN BASIS POINTS from WEDNESDAY night. (POLICY FED ERROR)/
USA dollar index early WEDNESDAY morning: 90.25 UP 11 CENT(S) from WEDNESDAY’s close.
This ends early morning numbers THURSDAY MORNING
xxxxxxxxxxxxxxxxxxxxxxxxxxxxxxxxxxxxxxxxxxxxxxxxxxxxxxxxxxxxxxxxxxxxxxxxxxxxxxxxxxxxxxxxxxxxxxxxxxxxxxxxxxxxxxx
And now your closing THURSDAY NUMBERS \1: 00 PM
Portuguese 10 year bond yield: 1.672% UP 5 in basis point(s) yield from WEDNESDAY/
JAPANESE BOND YIELD: +.0.046% UP 1 & 3/10 in basis points yield from WEDNESDAY/JAPAN losing control of its yield curve/
SPANISH 10 YR BOND YIELD: 1.234% UP 7 IN basis point yield from WEDNESDAY/
ITALIAN 10 YR BOND YIELD: 1.794 UP 5 POINTS in basis point yield from WEDNESDAY/
the Italian 10 yr bond yield is trading 56 points HIGHER than Spain.
GERMAN 10 YR BOND YIELD:RISES TO +.524% IN BASIS POINTS ON THE DAY
END
xxxxxxxxxxxxxxxxxxxxxxxxxxxxxxxxxxxxxxxxxxxxxxxxxxxxxxxxxxxxxxxxxxxxxxxxxxxxxxxxxxxxxxxxxxxxxxxxxxxxxxxxxxxxxxxxxxxxxxxxxxxxxxxxxxxxx
IMPORTANT CURRENCY CLOSES FOR THURSDAY
Closing currency crosses for THURSDAY night/USA DOLLAR INDEX/USA 10 YR BOND YIELD/1:00 PM
Euro/USA 1.2228 DOWN .0059 (Euro DOWN 59 Basis points/ represents to DRAGHI A COMPLETE POLICY FAILURE/
USA/Japan: 107.47 UP 0.689 Yen DOWN 69 basis points/
Great Britain/USA 1.3989 DOWN .0098( POUND DOWN 98 BASIS POINTS)
USA/Canada 1.2778 DOWN .0025 Canadian dollar UP 25 Basis points AS OIL ROSE TO $63.80
xxxxxxxxxxxxxxxxxxxxxxxxxxxxxxxxxxxxxxxxxxxxxxxxxxxxxxxxxxxxxxxxxxxxxxxxxxxxxxxx
This afternoon, the Euro was DOWN 59 to trade at 1.2228
The Yen ROSE to 107.47 for a LOSS of 69 Basis points as NIRP is STILL a big failure for the Japanese central bank/HELICOPTER MONEY IS NOW DELAYED/BANK OF JAPAN NOW WORRIED AS AS THEY ARE RUNNING OUT OF BONDS TO BUY AS BOND YIELDS RISE
The POUND FELL BY 98 basis points, trading at 1.3989/
The Canadian dollar ROSE by 25 basis points to 1.2778/ WITH WTI OIL RISING TO : $63.80
The USA/Yuan closed AT 6.3033
the 10 yr Japanese bond yield closed at +.046% UP 1 & 3/10 IN BASIS POINTS / yield/
Your closing 10 yr USA bond yield UP 5 IN basis points from WEDNESDAY at 2.8302% //trading well ABOVE the resistance level of 2.27-2.32%) very problematic USA 30 yr bond yield: 3.0714 UP 6 in basis points on the day /
THE RISE IN BOTH THE 10 YR AND THE 30 YR ARE VERY PROBLEMATIC FOR VALUATIONS
Your closing USA dollar index,90.33 UP 38 CENT(S) ON THE DAY/1.00 PM/
Your closing bourses for Europe and the Dow along with the USA dollar index closing and interest rates for THURSDAY: 1:00 PM EST
London: CLOSED UP 165.49 POINTS OR 2.35%
German Dax :CLOSED UP 347.29 POINTS OR 2.90%
Paris Cac CLOSED UP 134.87 POINTS OR 2.62%
Spain IBEX CLOSED UP 227.60 POINTS OR 2.39%
Italian MIB: CLOSED UP 526.72 POINTS OR 2.35%
The Dow closed UP 240.92 POINTS OR 0.99%
NASDAQ WAS UP 34.44 Points OR 0.49% 4.00 PM EST
WTI Oil price; 63.80 4:00 pm;
Brent Oil: 68.71 4:00 EST
USA /RUSSIAN ROUBLE CROSS: 57.56 UP 27/100 ROUBLES/DOLLAR (ROUBLE LOWER BY 27 BASIS PTS)
TODAY THE GERMAN YIELD FALLS TO +.524% FOR THE 10 YR BOND 1.00 PM EST EST
END
This ends the stock indices, oil price, currency crosses and interest rate closes for today 4:30 PM
Closing Price for Oil, 4:30 pm/and 10 year USA interest rate:
WTI CRUDE OIL PRICE 4:30 PM:$63.65
BRENT: $68.39
USA 10 YR BOND YIELD: 2.8320% THIS RAPID DECENT IN YIELD IS ALSO VERY DANGEROUS/RECESSION COMING
USA 30 YR BOND YIELD: 3.072%/
EURO/USA DOLLAR CROSS: 1.2238 DOWN .0050 (DOWN 50 BASIS POINTS)
USA/JAPANESE YEN:107.39 UP 0.614/ YEN DOWN 62 BASIS POINTS/ very dangerous as yen carry traders are getting killed/yen continues to rise despite the NYSE rising. however gold is now breaking away from yen influence.
USA DOLLAR INDEX: 90.44 down 30 cent(s)/dangerous as the lower the dollar the higher the inflation.
The British pound at 5 pm: Great Britain Pound/USA: 1.4002: DOWN 0.0086 (FROM LAST NIGHT DOWN 86 POINTS)
Canadian dollar: 1.2754 UP 2 BASIS pts
German 10 yr bond yield at 5 pm: +0.524%
VOLATILITY INDEX: 18.87 CLOSED DOWN 1.19
LIBOR 3 MONTH DURATION: 2.324% ..LIBOR HAS INCREASED FOR 40 CONSECUTIVE DAYS.
And now your more important USA stories which will influence the price of gold/silver
TRADING IN GRAPH FORM FOR THE DAY
Dow Soars 1,000 Points From Wednesday Open
While it was even lower in yesterday’s premarket, the Dow Jones opened at 23,521 yesterday morning. Since then, despite the most aggressive trade war overtures between the US and China in history which nobody has explained just why or how will be “negotiated” away when neither Trump nor Xi will be willing to concede one iota, the Dow has moved in a straight line, and moments ago was up 300 points on the day, and with yesterday’s gains, is now over 1000 points in just over 24 hours.

end
USA news/data
Donald is not going to be happy as the monthly trade deficit widened to $57.6, the largest monthly deficit since the financial crisis. It seems that every country had a surplus when compared to the USA
(courtesy zerohedge)
US Reports Biggest Trade Deficit Since The Financial Crisis
With so much attention focused on trade data in recent weeks, Trump will hardly be happy to learn that not only did the US trade deficit grow by 1.6% in February from $56.7BN to $57.6BN, missing expectations of a $56.8BN print, but was the highest monthly trade deficit going back ten years, just as the financial crisis was warming up back in 2008.
According to the Census Bureau, the deficit increased to $57.6 billion, as imports increased more than exports. Broken down by components, the goods deficit increased $0.3 billion in February to $77.0 billion. The services surplus decreased $0.6 billion in February to $19.4 billion.
The good news is that exports of goods and services increased $3.5 billion, or 1.7% , in February to $204.4 billion. Exports of goods increased $3.0 billion and exports of services increased $0.5 billion.
- The increase in exports of goods mostly reflected increases in industrial supplies and materials ($2.0 billion), in automotive vehicles, parts, and engines ($0.9 billion), and in capital goods ($0.7 billion). A decrease in consumer goods ($0.8 billion) partly offset the increases.
- The increase in exports of services mostly reflected increases in transport ($0.2), in travel (for all purposes including education) ($0.1 billion), and in charges for the use of intellectual property ($0.1 billion).
The bad news is that imports of goods and services increased slightly more in absolute dollar terms, by $4.4 billion, or also 1.7% of total, in February to $262.0 billion. Imports of goods increased $3.3 billion and imports of services increased $1.1 billion.
- The increase in imports of goods mostly reflected increases in capital goods ($1.8 billion), in industrial supplies and materials ($0.8 billion), and in foods, feeds, & beverages ($0.8 billion).
- The increase in imports of services mostly reflected an increase in charges for the use of intellectual property ($1.0 billion), which included payments for the rights to broadcast the 2018 Winter Olympic Games
Broken down by trading partner, the February figures show surpluses, in billions of dollars, with South and Central America ($3.4), Hong Kong ($3.1), Brazil ($0.9), United Kingdom ($0.6), and Singapore ($0.5).
Meanwhile, the countries that should be worried they are about to fall in Trump’s trade war sights and resulted in a US trade deficit, included China ($34.7), European Union ($15.3), Germany ($6.7), Mexico ($6.6), Japan ($6.0), Italy ($2.8), OPEC ($2.3), India ($1.9), Taiwan ($1.5), France ($1.4), South Korea ($1.1), Saudi Arabia ($0.4), and Canada ($0.4).
More importantly, it’s not just China: the deficit with Mexico increased $1.0 billion to $6.6 billion in February, while the deficit with Germany increased $0.4 billion to $6.7 billion in February. Meanwhile, the deficit with Canada decreased $1.2 billion to $0.4 billion in February.
Finally, if you want to get Trump really mad, tell him that when stripping away petroleum products – which recently saw record US exports thanks to shale – the US trade deficit has never been greater.

end
This is interesting: In March the jobs cuts amounted to 60,357 with health care leading the way. This was a 71% increase from February
(courtesy zerohedge/Challenger/Grey/Christmas)
2018 March Job Cut Report: 60,357 Cuts With Retail, Health Care Leading
Job cuts announced by U.S.-based employers surged in March to 60,357, a 71 percent increase from the 35,369 cuts announced in February. Last month’s total is the highest monthly total since April 2016, when 64,141 job cuts were announced, according to a report released Thursday by global outplacement and executive coaching firm Challenger, Gray & Christmas, Inc.
“We’ve experienced 22 months of relatively low planned layoff activity. With the current economic conditions, companies are in a position to grow and invest. We’ve seen companies invest back into their workforces in the last couple of months,” said John Challenger, Chief Executive Officer of Challenger, Gray & Christmas, Inc.
“However, last month’s plans may indicate that growth could be slowing down, especially as the market continues to tighten,” he added.
March’s total is 39 percent higher than the 43,310 announced job cuts during the same month last year.
Through the first quarter of this year, employers have announced 140,379 cuts, 11 percent more than the 126,201 job cut announcements in the first quarter of 2017 and 44 percent higher than the 97,292 cuts announced in the final quarter of last year. First quarter job cut plans are the highest since Q1 2016, when 180,920 cuts were announced.
“In 2016, cuts in retail and oil drove announcements in the first quarter. This year, we are likewise seeing cuts in retail, as that industry continues to pivot to meet consumer demand,” said Challenger.
Retail leads all sectors in job cuts in 2018, with 56,526. So far this year, Challenger has tracked 1,730 announced retail store closures. That is in addition to the 9,241 store closures that were announced in 2017.
Health Care/Products companies announced the second highest number of job cuts in 2018, with 12,491, while the Consumer Products sector announced 11,778. The Services sector announced 10,564 job cuts this year.
“The growth and job creation we’ve seen over the last few months may be coming to an end. As wages grow and the labor market tightens, companies are going to switch to a no-risk strategy and potentially begin contracting,” said Challenger.
In fact, the number of hiring announcements fell in March; companies announced plans to hire 14,525 last month, bringing the year-to-date total to 196,340. This is 32 percent lower than the 289,272 announced hiring plans in the first quarter of 2017.
-END-
As always, David Stockman tells the truth on the USA economy and where we are headed
(courtesy David Stockman/Contra Corner)
It’s The Trump Slump – But David Stockman Says “Don’t Blame The Donald!”
Authored by David Stockman via Contra Corner blog,
The are few snarkier defenders of the current rotten financial status quo than Ben White of Politico’s Money Morning. So it’s not surprising that he is out this week with the latest Trumb-o-phobe meme from Swamp Dweller’s Central.
To wit, the renewed stock market swoon is purportedly all the Donald’s fault owing to his unhinged tweet storms, protectionist trade initiatives and attacks on the casino’s sacred cow of the moment, Amazon:
WELCOME TO THE TRUMP SLUMP – President Donald Trump is killing his own stock market rally. The president’s tweet storm attacking Amazon and his protectionist trade actions against China and other nations helped crush the stock market on Monday with the Dow falling over 700 points in late afternoon trade before closing down 458, or close to 2 percent.
The tech-heavy Nasdaq fell even further, led by a five percent drop in Amazon after the president ripped the company over its delivery deals with the United States Postal Service. The Dow, Nasdaq and S&P are all now down for the year. The Dow has plunged 11 percent since its all-time high of 26,616 on Jan. 26, entering official correction territory.
Traders, money managers and economists on Monday laid much of the blame for recent declines on Trump, who spent most of 2017 bragging on a near daily basis about the massive run-up in stock prices that followed his election and the passage of sweeping corporate tax cuts.
The above is just unadulterated rubbish, of course. It’s a tribute to the mindless anti-Trump bias that dominates the Imperial City press and the context-free Recency Bias that passes for financial analysis.
On at least this matter, the Donald is definitely not guilty because he hasn’t been around nearly long enough to take the blame or the praise for anything related to the economy. The phony stock market boom has been gestating for three decades owing to central bank monetary madness; the up-leg since election day reflects nothing more than the final phase of an horribly metastasized financial bubble that has now reached its sell-by date.

In fact, our clueless medicine show impresario has confused the last gasp of the robo-machines and dip-buyers for an endorsement of his cockamamie brew of protectionism, nationalism, populism and unhinged Keynesian borrow and spend. So rather than puncturing the bubble he accurately identified during the campaign, he’ll soon be dripping with implosion splatter from comb-over to toe.
Likewise, the market’s post-election rip has nothing to do with a putative Trump economic boom because there hasn’t been one. A 2.0% or lower real GDP growth rate is now virtually baked into the cake for Q1 based on the economic releases to date. That would amount to a $75 billion gain over the Q4 annualized level of real GDP.
Accordingly, the first five quarters of the Trump Economy will have generated an average real GDP gain of $102 billion per quarter. Then again, during the previous three years (2014-2016) the quarterly growth rate was $99 billion per quarter.
We’d call that a distinction without a difference. Indeed, the notion that there has been some-kind of Trump fostered economic acceleration is, well, Fake News.
In fact, what we have is a plodding business expansion that is freighted down by debt and financial engineering—both gifts of a rogue central bank that has been inflicting harm on the main street economy for decades.
As we have frequently demonstrated, the C-suites of corporate America have been strip-mining their cash flows and balance sheets in order to goose near-term share prices and stock option packages, thereby drastically short-changing investments in long term productivity and growth. Since the turn of the century, in fact, upwards of $20 trillion has been shunted into unproductive M&A deals, stock buybacks and leveraged recaps of every dimension.
Not surprisingly, this massive diversion of cash and capital into Wall Street has left main street high and dry. What counts for growth and productivity, of course, is net investment after inflation and replenishment of capital consumed in current year depreciation and amortization.
As the chart makes clear, there hasn’t been much of it. Real net investment in 2016 was still 28% below its level in the year 2000. And relative to real GDP, the story is even more dismal: The average net investment level in 1999-2001 computed to 3.8% of GDP, whereas during the most recent three years it averaged only 2.5% of GDP.

Given this dismal long-term trend in real net investment, it is not surprising that real final sales growth since the pre-crisis peak in 2007 has slipped to just 1.3% per annum, or only one-third of its historic 3.3% trend. So even if the Donald had an honest money/pro-growth agenda, which he most definitely does not, it would be nearly impossible to quickly extricate the US economy from the low growth rut shown in the chart below.
And that get’s us to the real cause of the so-called Trump Slump. What’s happening is that the Keynesian doctors at the Fed have been taking the boys and girls in the casino off their meds, and the latter are now beginning to feel wobbly.
While the Donald’s tweets and policy lurches have been the proximate triggers for the recent plunges, the real cause is the reluctant recognition in the casino that all the Fed’s epic money pumping has failed to ignite any real economic acceleration, and that an epochal tightening shift in monetary policy is now actually happening—both here and abroad.
Indeed, we think the punk number that will be added to the bar chart below when the initial Q1 results are posted by the Commerce Department in three weeks will be the straw that breaks the camel’s back.
After that, the business expansion will be bumping up against its 1990s tech era expansion record of 119 months—–even as the headwinds of steadily rising bond yields, faltering growth in Europe and Asia and a sharp slowdown of the post-coronation economy in China gather intensity.

The truth is, the Donald has done absolutely nothing to help the US economy since January 20, 2017, but has piled on immense harm by stumbling into the most irresponsible fiscal policy in modern history.
Yet with the Federal deficit now heading toward $1.2 trillion or 6% of GDP in the year ahead, there is no way to avoid a conflagration in the bond pits. The resulting “yield shock”, in turn, will finally puncture the Great Bubble that has been inflating since Greenspan panicked at the time of the October 1987 stock market meltdown and launched the present era of monetary central planning.
Still, when one arm of the US government is borrowing at a $1.2 trillion rate at the tippy-top of the business cycle, while the central banking arm is dumping bonds at an annual rate (i.e. $600 billion) which exceeds the level outstanding as recently as 2003, you are talking about a fiscal/monetary collision like never before.
Needless to say, there is not a chance that the debt-bloated US economy can weather that conflagration unscathed. Indeed, it can be well and truly said that the entire nine year so-called recovery has been wasted. If nothing else it was at least a chance to modestly deleverage the US economy—-so that monetary normalization could occur with a minimal amount of breakage and disruption on main street.
To the contrary, there has been no deleveraging at all. Compared to the modern 100 year norm (from 1870 to 1970) of a 1.5X debt-to-national income ratio, the national leverage ratio now stands at 3.47X and that’s virtually no change from the 3.58X level that triggered the financial crash in 2008.
Stated differently, had the US stayed on the straight and narrow, and had it not launched into a rolling national LBO over the last 35 years, the total public and private debt outstanding would now be $30 trillion, not the $68 trillion shown below from the Fed’s flow-of-funds report for Q4 2017.
The irony, therefore, is that the main street economy is failing because it is lugging around $38 trillion of extra debt—yet its supposed to be rescued by the very King of Debt.
We’ll take the unders on that one, but also note that the Donald inherited an economy that was leveraged at 3.49X national income in December 2016. That’s not even a smidgeon of difference from where we are now.
So don’t blame the Donald for the impending day of reckoning. He inherited the current debt-bloated monetary deformation.
And like all the Presidents before him—- since Ronald Reagan got bamboozled by Wall Street into abandoning his desire to return to a Bretton Woods style hard money standard—-he has no clue about how to avoid the financial crack-up which lies around the corner.
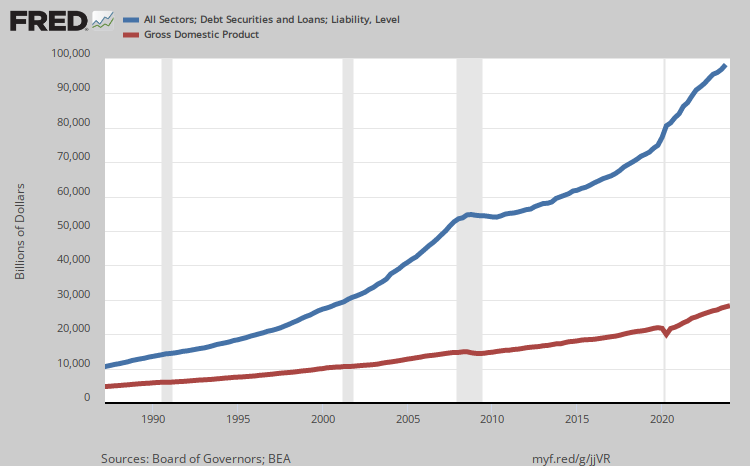
During our appearance on the Cavuto Show today on Fox Business we expanded on these very same points.
Trump Rages Over “Phony” WaPo Headline, Accuses Amazon’s “Chief Lobbyist” Of “Typically Bad Reporting”
By now traders are probably inured to President Trump heaping invective on Amazon in what have become near-daily tweets (though ears likely perked up when Larry Kudlow said “some action” against the company might be appropriate).
And in his latest tirade, Trump again bashes Amazon’s “chief lobbyist” the Washington Post for writing a headline he didn’t like.
“The Fake News Washington Post, Amazon’s “chief lobbyist,” has another (of many) phony headlines, “Trump Defiant As China Adds Trade Penalties.” WRONG! Should read, “Trump Defiant as U.S. Adds Trade Penalties, Will End Barriers And Massive I.P. Theft.” Typically bad reporting!
Donald J. Trump
✔@realDonaldTrump
The Fake News Washington Post, Amazon’s “chief lobbyist,” has another (of many) phony headlines, “Trump Defiant As China Adds Trade Penalties.” WRONG! Should read, “Trump Defiant as U.S. Adds Trade Penalties, Will End Barriers And Massive I.P. Theft.” Typically bad reporting!
Of course, his interpretation overlooks China’s unveiling of tariffs on roughly $50 billion of US imports, including – crucially – soybeans, a revelation that upset markets and could have long-standing implications.
One reporter reminds us what happened the last time we let Trump write headlines.
David Mack
✔@davidmackau
the sub editor has logged on https://twitter.com/realdonaldtrump/status/981881669593559040 …
David Mack
✔@davidmackau
here’s what happened the last time we let trump write headlines pic.twitter.com/F3qi8xgIBg

HARVEY


The Khazarian Rothschild mafia will never allow actual people to thrive with actual money. All the charts and most everything are so irrelevant because everything is a lie. Laws are for those actual people. Everything financial is controlled by the lords of fiat.
Basically, too many people are above all laws; everything that matters is a lie.
LikeLiked by 2 people
Harvey:
You state that the comex is out of gold and silver! I find it hard to believe that this is actually true. Is there another explanation for these transfers?
Since you allow comments, it might be nice if you answered those that comment. Please consider there are but 4 or 5 comments per night.
LikeLiked by 2 people
Harvey doesn’t answer any comments here (he may not even be looking @ them, I’ve no idea). He used to answer comments years ago on his earlier Google hosted blog that EVIL Google one day just decided to hammer without any notice. That was years ago before the current tech company scandals are coming out.
In any event, will take another opportunity to repeat:
Larry THE BOZO SHITHEAD Kudlow is a Cocaine addict!
LikeLiked by 1 person
The bullion banks control the futures markets. There is too much silver already above ground. Save your silver coins and bars for your grandchildren – they may live to see a rise in prices.
LikeLike