
GOLD: $1346.40 DOWN $ 4.25 (COMEX TO COMEX CLOSINGS)
Silver: $17.25 UP 3 CENTS (COMEX TO COMEX CLOSINGS)
Closing access prices:
Gold $1345.75
silver: $17.26
For comex gold:
APRIL/
NUMBER OF NOTICES FILED TODAY FOR APRIL CONTRACT:0 NOTICE(S) FOR nil OZ.
TOTAL NOTICES SO FAR 665 FOR 66500 OZ (2.068 tonnes)
THE COMEX IS OUT OF GOLD
For silver:
APRIL
81 NOTICE(S) FILED TODAY FOR
405,000 OZ/
Total number of notices filed so far this month: 460 for 2,300,000 oz
XXXXXXXXXXXXXXXXXXXXXXXXXXXXXX
Bitcoin: BID $8039/OFFER $8139: up $32(morning)
Bitcoin: BID/ $8199/offer 8299: UP $80 (CLOSING/5 PM)
end
First Shanghai gold fix comes at 10 pm est
The second Shanghai gold fix: 2:15 pm
First Shanghai gold fix gold: 10 pm est: 1355.45
NY price at the same time: 1349.20
PREMIUM TO NY SPOT: $6.25
Second gold fix early this morning: 1354.11
USA gold at the exact same time: 1351.30
PREMIUM TO NY SPOT: $2.81
AGAIN, SHANGHAI REJECTS NEW YORK PRICING.
WE WILL NOT PROVIDE LONDON FIXES AS THEY ARE NOT ACCURATE AS TO WHAT IS GOING ON AT THE SAME TIME FRAME.
Let us have a look at the data for today
xxxxxxxxxxxxxxxxxxxxxxxxxxxxxxxxxxxxxxxxxxxxxxxxxxxxxxxxxxxxxxxxxxxxxxxxxx
In silver, the total OPEN INTEREST ROSE BY A STRONG 7362 CONTRACTS FROM 214,297 RISING TO 221,659 ACCOMPANYING YESTERDAY’S GOOD 44 CENT GAIN IN SILVER PRICING. AFTER A STRING OF 6 CONSECUTIVE DAYS OF DROPS IN OPEN INTEREST, WE NOW HAVE TWO CONSECUTIVE OI GAINS. . WE WERE AGAIN NOTIFIED THAT WE HAD AN ATMOSPHERIC SIZED NUMBER OF COMEX LONGS TRANSFERRING THEIR CONTRACTS TO LONDON THROUGH THE EFP : 9532 EFP’S FOR MAY , 100 CONTRACTS FOR JUNE, 170 EFP’S FOR JULY AND ZERO FOR ALL OTHER MONTHS AND THEREFORE TOTAL SKY BOUND ISSUANCE OF 9802 CONTRACTS AND IT IS THE HIGHEST EVER ISSUED AS FAR AS I HAVE BEEN RECORDING THESE ENTRIES!!!. WITH THE TRANSFER OF 9802 CONTRACTS, WHAT THE CME IS STATING IS THAT THERE IS NO SILVER (OR GOLD) TO BE DELIVERED UPON AT THE COMEX AS THEY MUST EXPORT THEIR OBLIGATION TO LONDON. ALSO KEEP IN MIND THAT THERE CAN BE A DELAY OF 24-48 HRS IN THE ISSUING OF EFP’S. THE 9802 EFP CONTRACTS TRANSLATES INTO 49.01 MILLION OZ ACCOMPANYING 1.THE RISE IN SILVER PRICE AT THE COMEX AND 2. THE STRONG AMOUNT OF SILVER OUNCES STANDING FOR APRIL COMEX DELIVERY.
ACCUMULATION FOR EFP’S/SILVER/J.P.MORGAN’S HOUSE OF BRIBES, / STARTING FROM FIRST DAY NOTICE/FOR MONTH OF APRIL:
48,623 CONTRACTS (FOR 14 TRADING DAYS TOTAL 48,623 CONTRACTS) OR 243.115 MILLION OZ: AVERAGE PER DAY: 3,473 CONTRACTS OR 17.3653 MILLION OZ/DAY
TO GIVE YOU AN IDEA AS TO THE HUGE SUPPLY THIS MONTH IN SILVER: SO FAR THIS MONTH: 243.115 MILLION PAPER OZ HAVE MORPHED OVER TO LONDON. THIS REPRESENTS AROUND 34.73% OF ANNUAL GLOBAL PRODUCTION (EX CHINA EX RUSSIA)
ACCUMULATION IN YEAR 2018 TO DATE SILVER EFP’S: 961.245 MILLION OZ.
ACCUMULATION FOR JAN 2018: 236.879 MILLION OZ
ACCUMULATION FOR FEB 2018: 244.95 MILLION OZ
ACCUMULATION FOR MARCH 2018: 236.67 MILLION OZ
RESULT: WE HAD A HUGE SIZED GAIN IN COMEX OI SILVER COMEX OF 7362 WITH THE 44 CENT GAIN IN SILVER PRICE. THE CME NOTIFIED US THAT WE HAD AN ATMOSPHERIC AND RECORD SIZED EFP ISSUANCE OF 9802 CONTRACTS WHICH EXITED OUT OF THE SILVER COMEX AND TRANSFERRED THEIR OI TO LONDON AS FORWARDS. SPECULATORS CONTINUED THEIR INTEREST IN ATTACKING THE SILVER COMEX FOR PHYSICAL SILVER (SEE COMEX DATA) . FROM THE CME DATA 9532 EFP’S WERE ISSUED FOR THE MONTH OF MAY, 100 EFP’S FOR JUNE AND 170 EFP CONTRACTS FOR JULY, FOR A DELIVERABLE FORWARD CONTRACT OVER IN LONDON WITH A FIAT BONUS. WE GAINED A WHOPPING 17,513 OI CONTRACTS ON THE TWO EXCHANGES: i.e. 9802 open interest contracts headed for London (EFP’s) TOGETHER WITH AN INCREASE OF 7362 OI COMEX CONTRACTS. AND ALL OF THIS HAPPENED WITH THE STRONG RISE IN PRICE OF SILVER OF 44 CENTS AND A CLOSING PRICE OF $17.22 WITH RESPECT TO YESTERDAY’S TRADING. YET WE STILL HAVE A STRONG AMOUNT OF SILVER STANDING AT THE COMEX FOR DELIVERY IN THIS NON ACTIVE APRIL DELIVERY MONTH. THE BANKERS USED ALL OF THEIR PAPER MUSCLE AND THE KITCHEN SINK TO PREVENT SILVER FROM FLYING INTO THE 18 DOLLAR COLUMN.
In ounces AT THE COMEX, the OI is still represented by WELL OVER 1 BILLION oz i.e. 1.108 BILLION TO BE EXACT or 158% of annual global silver production (ex Russia & ex China).
FOR THE NEW FRONT APRIL MONTH/ THEY FILED: 81 NOTICE(S) FOR 405,000 OZ OF SILVER
IN SILVER, WE HAVE NOW SET THE NEW RECORD OF OPEN INTEREST AT 243,411 AND AGAIN THIS HAS BEEN SET WITH A LOW PRICE OF $16.51 ON APRIL 9.2018.
ON THE DEMAND SIDE WE HAVE THE FOLLOWING:
- HUGE AMOUNTS OF SILVER STANDING FOR DELIVERY (MARCH 27 MILLION OZ AND APRIL 1.8 MILLION OZ)
- HUGE RECORD OPEN INTEREST IN SILVER 243,411 CONTRACTS (OR 1.217 BILLION OZ/ SET APRIL 9/2018
- HUGE ANNUAL EFP’S ISSUANCE EQUAL TO 2.9 BILLION OZ OR 400% OF SILVER ANNUAL PRODUCTION
AND YET WE HAVE A CONTINUAL LOW PRICE OF SILVER DESPITE THE ABOVE HUGE DEMAND. TO ME THE ONLY ANSWER IS THAT WE HAVE SOVEREIGN (CHINA) WHO IS ENDEAVOURING TO GOBBLE UP ALL AVAILABLE PHYSICAL SILVER NO MATTER WHERE, EXACTLY WHAT J.P.MORGAN IS DOING. AND IT IS MY BELIEF THAT J.P.MORGAN IS HOLDING ITS SILVER FOR ITS BENEFICIAL OWNER..THE USA GOVERNMENT WHO IN TURN IS HOLDING THAT SILVER FOR CHINA.(FOR A SILVER LOAN REPAYMENT). IT ALSO LOOKS LIKE BANKER CAPITULATION IN SILVER AS THEY STRUGGLE TO REMOVE SOME OF THEIR HUGE OBLIGATIONS.
In gold, the open interest ROSE BY AN STRONG SIZED 7692 CONTRACTS UP TO 517,921 WITH THE RISE IN PRICE/YESTERDAY’S TRADING ( RISE OF $3.65). WE ARE NOW IN THE ACTIVE DELIVERY MONTH OF APRIL. THE CME RELEASED THE DATA FOR EFP ISSUANCE AND IT TOTALED A STRONG SIZED 11075 CONTRACTS : JUNE SAW THE ISSUANCE OF 11075 CONTRACTS , MAY SAW THE ISSUANCE OF 0 CONTRACTS AND ALL OTHER MONTHS ZERO. The new OI for the gold complex rests at 517,921. ALSO REMEMBER THAT THERE WILL BE A DELAY IN THE ISSUANCE OF EFP’S. THE BANKERS REMOVE LONG POSITIONS OF COMEX GOLD IMMEDIATELY. THEN THEY ORCHESTRATE THEIR PRIVATE EFP DEAL WITH THE LONGS AND THAT COULD TAKE AN ADDITIONAL 48 HRS SO WE GENERALLY DO NOT GET A MATCH WITH RESPECT TO DEPARTING COMEX LONGS AND NEW EFP LONG TRANSFERS. DEMAND FOR GOLD INTENSIFIES GREATLY AS WE CONTINUE TO WITNESS A HUGE NUMBER OF EFP TRANSFERS TOGETHER WITH THE MASSIVE INCREASE IN GOLD COMEX OI TOGETHER WITH THE TOTAL AMOUNT OF GOLD OUNCES STANDING FOR FEBRUARY COMEX. EVEN THOUGH THE BANKERS ISSUED THESE MONSTROUS EFPS, THE OBLIGATION STILL RESTS WITH THE BANKERS TO SUPPLY METAL BUT IT TRANSFERS THE RISK TO A LONDON BANKER OBLIGATION AND NOT A NEW YORK COMEX OBLIGATION. LONGS RECEIVE A FIAT BONUS TOGETHER WITH A LONG LONDON FORWARD. THUS, BY THESE ACTIONS, THE BANKERS AT THE COMEX HAVE JUST STATED THAT THEY HAVE NO APPRECIABLE METAL!! THIS IS A MASSIVE FRAUD: THEY CANNOT SUPPLY ANY METAL TO OUR COMEX LONGS BUT THEY ARE QUITE WILLING TO SUPPLY MASSIVE NON BACKED GOLD (AND SILVER) PAPER KNOWING THAT THEY HAVE NO METAL TO SATISFY OUR LONGS. LONDON IS NOW SEVERELY BACKWARD IN BOTH GOLD AND SILVER AND WE ARE WITNESSING DELAYS IN ACTUAL DELIVERIES.
IN ESSENCE WE HAVE A HUMONGOUS SIZED OI GAIN IN CONTRACTS ON THE TWO EXCHANGES: 7692 OI CONTRACTS INCREASED AT THE COMEX AND AN STRONG SIZED 11,075 EFP OI CONTRACTS WHICH NAVIGATED OVER TO LONDON.THUS TOTAL OI GAIN: 18,767 CONTRACTS OR 1,876,700 OZ = 58.37 TONNES.
YESTERDAY, WE HAD 7535 EFP’S ISSUED.
ACCUMULATION OF EFP’S GOLD AT J.P. MORGAN’S HOUSE OF BRIBES: (EXCHANGE FOR PHYSICAL) FOR THE MONTH OF APRIL : 149,355 CONTRACTS OR 14,935,500 OZ OR 464.55 TONNES (14 TRADING DAYS AND THUS AVERAGING: 10,668 EFP CONTRACTS PER TRADING DAY OR 1,066,800 OZ/ TRADING DAY)
TO GIVE YOU AN IDEA AS TO THE HUGE SIZE OF THESE EFP TRANSFERS : SO FAR THIS MONTH IN 14 TRADING DAYS IN TONNES: 464.55 TONNES
TOTAL ANNUAL GOLD PRODUCTION, 2017, THROUGHOUT THE WORLD EX CHINA EX RUSSIA: 2555 TONNES
THUS EFP TRANSFERS REPRESENTS 464.55/2550 x 100% TONNES = 18.21% OF GLOBAL ANNUAL PRODUCTION SO FAR IN MARCH ALONE.*** THE ACCUMULATION OF EFP CONTRACTS IS RISING PER MONTH.
ACCUMULATION OF GOLD EFP’S YEAR 2018 TO DATE: 2,509.04 TONNES
ACCUMULATION OF GOLD EFP’S FOR JANUARY 2018: 653.22 TONNES
ACCUMULATION OF GOLD EFP’S FOR FEBRUARY 2018: 649.45 TONNES
ACCUMULATION OF GOLD EFP’S FOR MARCH 2018: 741.89 TONNES
WHAT IS ALARMING TO ME, ACCORDING TO OUR LONDON EXPERT ANDREW MAGUIRE IS THAT THESE EFP’S ARE BEING TRANSFERRED TO WHAT ARE CALLED SERIAL FORWARD CONTRACT OBLIGATIONS AND THESE CONTRACTS ARE LESS THAN 14 DAYS. ANYTHING GREATER THAN 14 DAYS, THESE MUST BE RECORDED AND SENT TO THE COMPTROLLER, GREAT BRITAIN TO MONITOR RISK TO THE BANKING SYSTEM. IF THIS IS INDEED TRUE, THEN THIS IS A MASSIVE CONSPIRACY TO DEFRAUD AS WE NOW WITNESS A MONSTROUS TOTAL EFP’S ISSUANCE AS IT HEADS INTO THE STRATOSPHERE.
Result: A STRONG SIZED INCREASE IN OI AT THE COMEX OF 7692 ACCOMPANYING THE RISE IN PRICE // GOLD TRADING YESTERDAY ($3.65 RISE). WE ALSO HAD A STRONG SIZED NUMBER OF COMEX LONG TRANSFERRING TO LONDON THROUGH THE EFP ROUTE: 11075 CONTRACTS AS THESE HAVE ALREADY BEEN NEGOTIATED AND CONFIRMED. THERE OBVIOUSLY DOES NOT SEEM TO BE MUCH PHYSICAL GOLD AT THE COMEX. I GUESS IT EXPLAINS THE HUGE ISSUANCE OF EFP’S…THERE IS HARDLY ANY GOLD PRESENT AT THE GOLD COMEX FOR DELIVERY PURPOSES. IF YOU TAKE INTO ACCOUNT THE 11,075 EFP CONTRACTS ISSUED, WE HAD A HUMONGOUS SIZED NET GAIN OF 18,767 CONTRACTS IN TOTAL OPEN INTEREST ON THE TWO EXCHANGES:
11075 CONTRACTS MOVE TO LONDON AND 7692 CONTRACTS INCREASED AT THE COMEX. (in tonnes, the GAIN in total oi equates to 58.37 TONNES).
we had: 0 notice(s) filed upon for NIL oz of gold at the comex.
xxxxxxxxxxxxxxxxxxxxxxxxxxxxxxxxxxxxxxxxxxxxxxxxxxxxxxxxxxx
With respect to our two criminal funds, the GLD and the SLV:
GLD
WITH GOLD DOWN $4.25 : WE HAD NO CHANGES IN GOLD INVENTORY AT THE GLD/
Inventory rests tonight: 865.89 tonnes.
SLV/
WITH SILVER UP 3 CENTS TODAY: A HUGE CHANGE/ A WITHDRAWAL OF 2.355 MILLION OZ/
/INVENTORY RESTS AT 317.841 MILLION OZ/
end
First, here is an outline of what will be discussed tonight:
1. Today, we had the open interest in SILVER ROSE BY A HUGE 7362 CONTRACTS from 214,297 UP TO 221,659 (AND CLOSER TO THE NEW COMEX RECORD SET /APRIL 9/2017 AT 243,411). THE PREVIOUS RECORD OTHER THAN WAS ESTABLISHED AT: 234,787, SET ON APRIL 21.2017 ALMOST ONE YEAR AGO. THE PRICE OF SILVER ON THAT DAY: $17.89. AFTER 6 CONSECUTIVE DAYS OF LOSSES. WE HAVE HAD TWO CONSECUTIVE DAYS OF COMEX SILVER GAINS. NOT ONLY THAT BUT OUR BANKERS ALSO USED THEIR EMERGENCY PROCEDURE TO ISSUE AN ATMOSPHERIC 9532 EFP CONTRACTS FOR MAY (WE DO NOT GET A LOOK AT THESE CONTRACTS AS IT IS PRIVATE BUT THE CFTC DOES AUDIT THEM), 100 EFP ISSUANCE FOR JUNE AND 170 EFP’S FOR JULY AND ALL OTHER MONTHS ZERO. TOTAL EFP ISSUANCE: 9802 CONTRACTS. EFP’S GIVE OUR COMEX LONGS A FIAT BONUS PLUS A DELIVERABLE PRODUCT OVER IN LONDON. IF WE TAKE THE OI GAIN AT THE COMEX OF 7711 CONTRACTS TO THE 9802 OI TRANSFERRED TO LONDON THROUGH EFP’S, WE OBTAIN A HUGE GAIN OF 17,164 OPEN INTEREST CONTRACTS. THUS IN OUNCES, THE GAIN ON THE TWO EXCHANGES: 85.820 MILLION OZ!!! AND THIS OCCURRED WITH A RISE IN PRICE OF 44 CENTS. THE BANKERS ARE CAPITULATING AS THEY DESPERATELY TRY AND PARE THEIR GIGANTIC OPEN INTEREST SHORT ON BOTH EXCHANGES. YESTERDAY THEY THREW ALL OF THEIR PAPER MUSCLE (WHICH IS INFINITE) PLUS THE KITCHEN SINK TRYING TO CONTAIN SILVER
RESULT: A STRONG SIZED INCREASE IN SILVER OI AT THE COMEX WITH THE RISE IN SILVER PRICING / YESTERDAY (44 CENTS/) . BUT WE ALSO HAD ANOTHER HUMONGOUS SIZED 9802 EFP’S ISSUED TRANSFERRING COMEX LONGS OVER TO LONDON. TOGETHER WITH THE STRONG SIZED AMOUNT OF SILVER OUNCES STANDING FOR APRIL, DEMAND FOR PHYSICAL SILVER INTENSIFIES AS WE WITNESS SEVERE BACKWARDATION IN SILVER IN LONDON.
(report Harvey)
.
2.a) The Shanghai and London gold fix report
(Harvey)
2 b) Gold/silver trading overnight Europe, Goldcore
(Mark O’Byrne/zerohedge
and in NY: Bloomberg
3. ASIAN AFFAIRS
i)THURSDAY MORNING/WEDNESDAY NIGHT: Shanghai closed UP 25.98 POINTS OR 0.84% /Hang Sang CLOSED UP 424.19 POINTS OR 1.40% / The Nikkei closed UP 32.98 POINTS OR 0.15%/Australia’s all ordinaires CLOSED UP .34% /Chinese yuan (ONSHORE) closed UP at 6.2766/Oil UP to 69.08 dollars per barrel for WTI and 74.33 for Brent. Stocks in Europe OPENED MIXED. ONSHORE YUAN CLOSED UP AT 6.2766 AGAINST THE DOLLAR. OFFSHORE YUAN CLOSED UP ON THE DOLLAR AT 6.2701 /ONSHORE YUAN TRADING WEAKER AGAINST OFFSHORE YUAN/ONSHORE YUAN TRADING STRONGER AGAINST USA DOLLAR/OFFSHORE YUAN TRADING A LITTLE STRONGER AGAINST THE DOLLAR /CHINA RETALIATES WITH TARIFFS/ TRUMP RESPONDS TO NEW TARIFFS AND IT NOW LOOKS LIKE A FULL TRADE WAR IS BEGINNING/
SOUTH KOREA/NORTH KOREA
i)North Korea/South Korea
b) REPORT ON JAPAN
3 c CHINA
4. EUROPEAN AFFAIRS
i)We have been reporting on numbers from Germany and they all seem to be flashing the yellow sign that a recession is coming to this behemoth export nation
( Mish Shedlock/Mishtalk)
ii)Bill Blain talks about his fears on the markets this morning
( Bill Blain/Mint Partners)
iii)Now I fully understand what is going on with the Swiss franc. It has been falling pretty badly against the Euro. Jordan actually likes that. What we have here is another casualty with respect to the Russian sanctions as Russian investments in Switzerland may have exposure so they are getting out of Dodge…thus the fall in the Swiss Franc
5. RUSSIAN AND MIDDLE EASTERN AFFAIRS
6 .GLOBAL ISSUES
7. OIL ISSUES
8. EMERGING MARKET
9. PHYSICAL MARKETS
i)the IMF sounds the alarm bell on excessive debt issuance
( Chris Giles/London’s Financial times)
ii)With huge dollar shortages it was a no brainer for Iran to switch to euros for official reporting currency. It is not going to help them
( Reuters/GATA)
iii)With famed geologist Keith Barron roaming the mountains of Ecuador, he reports that the government there has a new, realistic and practical approach to companies wishing to exploit the countries mineral riches
( Keith Barron/news.vice.com/GATA)
iv)This is a difficult one! There is no question that in silver the crooks goaded the speculators in a considerable short position. The reason that the bankers were doing this is that they feared that silver was in dramatic short supply in London. Bars are arriving only with 2018 year stamped on them as the physical supply is rapidly disappearing. Maybe your reason for a short squeeze as the commercials will desperately try and extricate themselves from this mess
( John Rubino/DollarCollapse)
thus the reason for aluminium rising on the markets..very inflationary
( zero hedge)
vi)why we reached peak silver/trouble at a few silver mines
( Lawrie Williams)
10. USA stories which will influence the price of gold/silver
i)Today’s morning trading:
This is not good: with the Dow and Nasdaq tumbling, treasury yield undergo the unexpected: yields are rising because of inflation/stagflation fears
( zerohedge)
ii)Today’s morning data:
Soft data Philly Fed states that prices paid hits a 7 yr high and that signals inflation but no growth or in other words staglation
( zerohedge)
iii)The Amazon effect: Bezos reports over 100 million paid prime members
( zerohedge)
iv)Trump is hopeful that he will leave the meeting with Kim Jong Un happy. But if the meeting is not fruitful then more sanctions on North Korea. Trump will win on this one!! North Korea is hopelessly bankrupt.
v)SWAMP STORIES
a)Oh this is getting good: Comey calls McCabe a liar and the rhetoric between the two intensifies. Sit back and enjoy the popcorn
( zerohedge)
c)My goodness!! that did not last long. The Dept of Justice caves and will hand over the 7 memos and now we will get to see why Rosenstein needed a special prosecutor who became Mueller( zerohedge
d)Rosenstein tells Trump that he is not a target of Mueller’s probe. I highly doubt that…Rosenstein is lying
( zerohedge)
e)TRUMP EYEING GIULIANI TO JOIN IS LEGAL TEAM
( zerohedge)
f)The Inspector General Horowitz refers McCabe for 4 counts of criminal charges of lying to the FBI, to the Inspector general and to the Dept of Justice
Trading Volumes on the COMEX
PRELIMINARY COMEX VOLUME FOR TODAY:321,666 contracts
CONFIRMED COMEX VOL. FOR YESTERDAY: 322,031 contracts
comex gold volumes are RISING AGAIN
Here is a summary of the latest gold trading volumes at the Comex per year
certainly the introduction of EFP’s has certainly had an effect:
Meanwhile, gold-trading volumes on the COMEX have never been higher:

xxxxxxxxxxxxxxxxxxxxxxxxxxxxxxxxxxxxxxxxxxxxxxxxxxxxxxxxxxxxxxxxxxxx
And now for the wild silver comex results.
Total silver OI ROSE BY 7362 CONTRACTS FROM 214,000 UP TO 222,008 (AND CLOSER TO THE NEW RECORD OI FOR SILVER SET APRIL 9.2018/ 243,411 CONTRACTS) WITH THE 44 CENT RISE IN SILVER PRICING. WE ALSO WERE ALSO INFORMED THAT WE HAD A HUMONGOUS 9532 EMERGENCY EFP’S FOR MAY ISSUED BY OUR BANKERS, 100 EFP’S ISSUED FOR JUNE, AND 114 EFP CONTRACTS ISSUED FOR JULY AND ZERO FOR ALL OTHER MONTHS TO COMEX LONGS WHO RECEIVED A FIAT BONUS PLUS A DELIVERABLE PRODUCT OVER IN LONDON. THE TOTAL EFP’S ISSUED: 9802. ON A NET BASIS WE GAINED 17,164 SILVER OPEN INTEREST CONTRACTS AS WE OBTAINED A 7362 CONTRACT GAIN AT THE COMEX COMBINING WITH THE ADDITION OF 9802 OI CONTRACTS NAVIGATING OVER TO LONDON.
NET GAIN ON THE TWO EXCHANGES: 17,164 CONTRACTS
AMOUNT STANDING FOR SILVER AT THE COMEX
We are now in the non active delivery month of April and here the front month GAINED 7 contracts RISING TO 103 contracts. We had 0 notices filed upon so in essence we GAINED 7 contracts or 35,000 additional ounces of silver will stand for delivery in this non active delivery month of April AS SOMEBODY NEEDED SOME SILVER TODAY.
The next big active delivery month for silver will be May and here the OI GAINED 3465 contracts UP to 99,458. June saw a GAIN of 231 contract to stand at 327. The next big delivery month for silver is July and here the OI ROSE by 3177 contracts UP to 84,192.
We had 81 notice(s) filed for 405,000 OZ for the APRIL 2018 contract for silver
INITIAL standings for APRIL/GOLD
APRIL 19/2018.
| Gold | Ounces |
| Withdrawals from Dealers Inventory in oz | nil oz |
| Withdrawals from Customer Inventory in oz |
803.75 OZ
Manfra
(25 kilobars)
|
| Deposits to the Dealer Inventory in oz | NIL oz |
| Deposits to the Customer Inventory, in oz | nil OZ |
| No of oz served (contracts) today |
0 notice(s)
NIL OZ
|
| No of oz to be served (notices) |
914 contracts
(91,400 oz)
|
| Total monthly oz gold served (contracts) so far this month |
665 notices
66,500 OZ
2.068 TONNES
|
| Total accumulative withdrawals of gold from the Dealers inventory this month | NIL oz |
| Total accumulative withdrawal of gold from the Customer inventory this month | xxx oz |
For APRIL:
Today, 0 notice(s) were issued from JPMorgan dealer account and 0 notices were issued from their client or customer account. The total of all issuance by all participants equates to02 contract(s) of which 0 notices were stopped (received) by j.P. Morgan dealer and 0 notice(s) was (were) stopped/ Received) by j.P.Morgan customer account.
xxxxxxxxxxxxxxxxxxxxxxxxxxxxxxxxxxxxxxxxxxxxxxxxxxxxxxxxxxxxxxxxxxxxxxxxxx
To calculate the INITIAL total number of gold ounces standing for the APRIL. contract month, we take the total number of notices filed so far for the month (665) x 100 oz or 66500 oz, to which we add the difference between the open interest for the front month of APRIL. (914 contracts) minus the number of notices served upon today (0 x 100 oz per contract) equals 157,900 oz, the number of ounces standing in this active month of APRIL (4.911 tonnes)
Thus the INITIAL standings for gold for the APRIL contract month:
No of notices served (665 x 100 oz or ounces + {(914)OI for the front month minus the number of notices served upon today (2 x 100 oz )which equals 157,900 oz standing in this active delivery month of APRIL . THERE IS 12.003 TONNES OF REGISTERED GOLD AVAILABLE FOR DELIVERY SO FAR.
WE LOST 24 COMEX OI CONTRACTS OR 2400 OZ OF GOLD WILL NOT STAND BUT THESE GUYS MORPHED INTO LONDON BASED FORWARDS.
IN THE LAST 18 MONTHS 72 NET TONNES HAS LEFT THE COMEX.
end
And now for silver
AND NOW THE APRIL DELIVERY MONTH
APRIL INITIAL standings/SILVER
| Silver | Ounces |
| Withdrawals from Dealers Inventory | nil oz |
| Withdrawals from Customer Inventory |
1,267,370.360 oz
JPMORGAN
Scotia
|
| Deposits to the Dealer Inventory |
397,312.06
oz
BRINKS
|
| Deposits to the Customer Inventory |
9530.510 oz
SCOTIA
|
| No of oz served today (contracts) |
81
CONTRACT(S
(405,000 OZ)
|
| No of oz to be served (notices) |
22 contracts
(110,000 oz)
|
| Total monthly oz silver served (contracts) | 460 contracts
(2,300,000 oz) |
| Total accumulative withdrawal of silver from the Dealers inventory this month | NIL oz |
| Total accumulative withdrawal of silver from the Customer inventory this month |
we had 1 inventory movement at the dealer side of things
i) Into dealer Brinks; 397,312.06 oz
total dealer deposits: 397,312.06 oz
we had 1 deposits into the customer account
i) Into JPMorgan: nil oz
*** JPMorgan for most of 2017 and in 2018 has adding to its inventory almost every single day.
JPMorgan now has 140 million oz of total silver inventory or 53.4% of all official comex silver. (140 million/263 million)
JPMorgan did not deposit into its warehouses (official) today.
ii) INTO SCOTIA: 9530.510 OZ
total deposits today: 9530.510 oz
we had 1 withdrawals from the customer account;
i) out of JPMorgan; 605,120.500 oz
total withdrawals; 605,120.500 oz
accumulation in last 3 days for JPMorgan silver withdrawal:2,417,143.5 oz
why is JPMorgan withdrawing so much silver?
we had 1 adjustment
i) out of Scotia; 616.561.743 oz was adjusted out of the customer account of Scotia and this landed into the dealer account of Scotia
total dealer silver: 62.377 million
total dealer + customer silver: 261.727 million oz
The total number of notices filed today for the APRIL. contract month is represented by 81 contract(s) FOR 405,000 oz. To calculate the number of silver ounces that will stand for delivery in APRIL., we take the total number of notices filed for the month so far at 460 x 5,000 oz = 2,300,000 oz to which we add the difference between the open interest for the front month of April. (103) and the number of notices served upon today (81 x 5000 oz) equals the number of ounces standing.
.
Thus the INITIAL standings for silver for the APRIL contract month: 460(notices served so far)x 5000 oz + OI for front month of April(103) -number of notices served upon today (81)x 5000 oz equals 2,410,000 oz of silver standing for the April contract month
WE GAINED 7 SILVER CONTRACT OR 3500 ADDITIONAL OUNCES WILL STAND IN THIS NON ACTIVE DELIVERY MONTH OF APRIL
xxxxxxxxxxxxxxxxxxxxxxxxxxxxxxxxxxxxxxxxxxxxxxxxxxxxxxxxxxx
ESTIMATED VOLUME FOR TODAY: 161,759 CONTRACTS
CONFIRMED VOLUME FOR YESTERDAY: 226,854 CONTRACTS (my goodness)
YESTERDAY’S CONFIRMED VOLUME OF 226,554 CONTRACTS EQUATES TO 1,132 MILLION OZ OR 161.8% OF ANNUAL GLOBAL PRODUCTION OF SILVER (in other words: 1.132 billion oz)
COMMODITY LAW SUGGESTS THAT OPEN INTEREST SHOULD NOT BE MORE THAN 3% OF ANNUAL GLOBAL PRODUCTION. THE CROOKS ARE SUPPLYING MASSIVE PAPER TRYING TO KEEP SILVER IN CHECK.
The record level of silver open interest is 234,787 contracts set on April 21./2017 with the price at that day at $18.42
The previous record was 224,540 contracts with the price at that time of $20.44
end
NPV for Sprott
1. Sprott silver fund (PSLV): NAV FALLS TO -2.10% (APRIL 19/2018)
2. Sprott gold fund (PHYS): premium to NAV RISES TO -0.55% to NAV (APRIL 19/2018 )
Note: Sprott silver trust back into NEGATIVE territory at -2.10%-/Sprott physical gold trust is back into NEGATIVE/ territory at -0.55%/Central fund of Canada’s is still in jail but being rescued by Sprott.
Sprott WINS hostile 3.1 billion bid to take over Central Fund of Canada
(courtesy Sprott/GATA)
3.SPROTT CEF.A FUND (FORMERLY CENTRAL FUND OF CANADA): NAV FALLS TO -2.19%: NAV 14.03/TRADING 13.72//DISCOUNT 2.19.
END
And now the Gold inventory at the GLD/
APRIL 19/WITH GOLD DOWN $4.25: NO CHANGES IN GOLD INVENTORY AT THE GLD/INVENTORY RESTS AT 859.89 TONNES/
APRIL 18/WITH GOLD UP $3.65: NO CHANGES IN GOLD INVENTORY AT THE GLD/INVENTORY RESTS AT 859.89 TONNES
APRIL 17/WITH GOLD DOWN $1.00 NO CHANGES IN GOLD INVENTORY AT THE GLD/INVENTORY RESTS AT 865.89 TONNES/
April 16/WITH GOLD UP$2.80/NO CHANGES IN GOLD INVENTORY AT THE GLD/INVENTORY RESTS AT 865.89 TONNES/
April 13/WITH GOLD UP $6.15, A HUGE DEPOSIT OF 5.90 TONNES INTO THE GLD INVENTORY/INVENTORY RESTS AT 865.89 TONNES
April 12/WITH GOLD DOWN $17.40/NO CHANGES IN GOLD INVENTORY AT THE GLD/INVENTORY RESTS AT 859.99 TONNES
April 11/WITH GOLD UP $13.85/NO CHANGES IN GOLD INVENTORY AT THE GLD/INVENTORY RESTS AT 859,99 TONNES
APRIL 10/WITH GOLD UP $5.25/NO CHANGES IN GOLD INVENTORY AT THE GLD/INVENTORY RESTS AT 859.99 TONNES
APRIL 9/WITH GOLD UP$4.50/NO CHANGES IN GOLD INVENTORY AT THE GLD/INVENTORY RESTS AT 859.99 TONNES
APRIL 6/WITH GOLD UP $7.50 ,A HUGE CHANGE IN INVENTORY AT THE GLD/ A DEPOSIT OF 5.90 TONNES/INVENTORY RESTS AT 859.99 TONNES
APRIL 5/WITH GOLD DOWN $8.20 WE HAD TWO ENTRIES: 1) TINY WITHDRAWAL OF .28 TONNES TO PAY FOR FEES AND 2) A DEPOSIT OF 2.06 TONNES//INVENTORY RESTS AT 854.09 TONNES
April 4/WITH GOLD UP $2.90 WE HAD NO CHANGES IN GOLD INVENTORY AT THE GLD/INVENTORY RESTS AT 852.31 TONNES
APRIL 3./WITH GOLD DOWN $9.30 WE HAD NO CHANGES IN GOLD INVENTORY AT THE GLD/INVENTORY RESTS AT 852.31 TONNES
APRIL 2/WITH GOLD UP $19.50, WE HAD A BIG CHANGES IN GOLD INVENTORY AT THE GLD A DEPOSIT OF 6.19 TONNES/INVENTORY RESTS AT 852.31 TONNES
MARCH 29/WITH GOLD DOWN $3.20 AND OPTIONS EXPIRY FINISHED, WE HAD NO CHANGE IN GOLD INVENTORY AT THE GLD/INVENTORY RESTS A 846.12 TONNES
March 28/WITH GOLD DOWN $16.70, ANOTHER RAID ORCHESTRATED, AGAIN NO SURPRISES AS WE WITNESS ANOTHER 1.18 TONNES OF GOLD REMOVED/INVENTORY RESTS AT 846.12 TONNES
MARCH 27/WITH GOLD DOWN $11.70 AND A RAID INITIATED, IT WAS NO SURPRISE TO SEE THAT A MASSIVE WITHDRAWAL OF 3.24 TONNES WAS USED IN THE ABOVE RAID/INVENTORY RESTS AT 847.30 TONNES
MARCH 26./WITH GOLD UP $4.60/NO CHANGE IN GOLD INVENTORY AT THE GLD/INVENTORY RESTS AT 850.54 TONNES
MARCH 23/WITH GOLD UP $23.30/NO CHANGE IN GOLD INVENTORY AT THE GLD/INVENTORY RESTS AT 850.54 TONNES
MARCH 22.WITH GOLD UP $5.90, NO CHANGES IN GOLD INVENTORY AT THE GLD/INVENTORY RESTS AT 850.54 TONNES/
MARCH 21/WITH GOLD UP $9.65 NO CHANGES IN GOLD INVENTORY AT THE GLD/INVENTORY RESTS AT 850.54 TONNES
March 20/WITH GOLD DOWN $5.75, A SURPRISING HUMONGOUS DEPOSIT OF 10.32 TONNES OF GOLD INTO THE GLD/INVENTORY RESTS AT 850.64 TONNES/
SO FAR, FOR THE MONTH OF MARCH, THE GLD HAS ADDED 19.61 TONNES WITH A NET LOSS OF $17.45
March 19/WITH GOLD UP $5.25: ANOTHER HUGE DEPOSIT OF GOLD TO THE TUNE OF 2.07 TONNES/GOLD INVENTORY RESTS TONIGHT AT 840.22 TONNES
MARCH 16/WITH GOLD DOWN $5.65/OUR CROOKS DEPOSITED ANOTHER 4.42 TONNES INTO GLD INVENTORY/INVENTORY RESTS AT 838.15 TONNES
FOR THE WEEK: GOLD LOST $11.80, BUT GOLD INVENTORY ADVANCED:4.42 TONNES
MARCH 15/WITH GOLD DOWN $7.85, NO CHANGES IN GOLD INVENTORY AT THE GLD/INVENTORY RESTS AT 833.73 TONNES
MARCH 14/WITH GOLD DOWN $1.55/NO CHANGES IN GOLD INVENTORY AT THE GLD/INVENTORY RESTS AT 833.73 TONNES
MARCH 13/WITH GOLD UP $6.25/NO CHANGES IN GOLD INVENTORY AT THE GLD/INVENTORY RESTS AT 833.73 TONNES
xxxxxxxxxxxxxxxxxxxxxxxxxxxxxxxxxx
APRIL 18/2018/ Inventory rests tonight at 865.89 tonnes
*IN LAST 365 TRADING DAYS: 75.15 NET TONNES HAVE BEEN REMOVED FROM THE GLD
*LAST 315 TRADING DAYS: A NET 81.15 TONNES HAVE NOW BEEN ADDED INTO GLD INVENTORY.
end
Now the SLV Inventory/
APRIL 19/WITH SILVER UP 3 CENTS TODAY: WE HAD A BIG CHANGE IN SILVER INVENTORY AT THE SLV: A WITHDRAWAL OF 2.355 MILLION OZ/ MAKES ABSOLUTELY NO SENSE!!/INVENTORY RESTS AT 317.841 MILLION OZ
APRIL 18/WITH SILVER UP 44 CENTS TODAY: NO CHANGES IN SILVER INVENTORY AT THE SLV/INVENTORY RESTS AT 320.196 MILLION OZ
APRIL 17/WITH SILVER UP 10 CENTS TODAY/NO CHANGES IN SILVER INVENTORY AT THE SLV/INVENTORY RESTS AT 320.196 MILLION OZ
April 16/WITH SILVER UP 7 CENTS TODAY: NO CHANGES IN SILVER INVENTORY AT THE SLV/INVENTORY RESTS AT 320.196 MILLION OZ/
April 13/WITH SILVER UP 17 CENTS TODAY: NO CHANGES IN SILVER INVENTORY AT THE SLV/INVENTORY RESTS AT 320.196 MILLION OZ.
April 12/WITH SILVER DOWN 27 CENTS/NO CHANGES IN SILVER INVENTORY AT THE SLV/INVENTORY RESTS AT 320.196 MILLION OZ/
April 11/2018/WITH SILVER UP 16 CENTS: NO CHANGES IN SILVER INVENTORY AT THE SLV/INVENTORY RESTS AT 320.196 MILLION OZ/
APRIL 10/WITH GOLD UP 8 CENTS/NO CHANGES IN SILVER INVENTORY AT THE SLV/INVENTORY RESTS AT 320.196 MILLION OZ/
APRIL 9/WITH SILVER UP 12 CENTS/WE HAD NO CHANGES IN SILVER INVENTORY/INVENTORY RESTS AT 320.196 MILLION OZ/
APRIL 6/WITH SILVER UP 4 CENTS, WE HAD A HUGE DEPOSIT OF 1.319 MILLION OZ INTO THE SLV INVENTORY/INVENTORY RESTS AT 320.196 MILLION OZ
APRIL 5/WITH SILVER UP 6 CENTS/NO CHANGES IN INVENTORY AT THE SLV/INVENTORY RESTS AT 318.877 MILLION OZ/
April 4/WITH SILVER DOWN 11 CENTS/A SMALL CHANGE IN SILVER INVENTORY AT THE SLV/ A WITHRAWAL OF 135,000 OZ AND THIS IS PROBABLY TO PAY FOR FEES/INVENTORY RESTS AT 318.877 MILLION OZ/
APRIL 3./WITH SILVER DOWN 16 CENTS/NO CHANGE IN SILVER INVENTORY AT THE SLV/INVENTORY RESTS AT 319.012 MILLION OZ/
APRIL 2/WITH SILVER UP 34 CENTS/NO CHANGES IN SILVER INVENTORY AT THE SLV/INVENTORY RESTS AT 319.012 MILLION OZ/
MARCH 29/WITH SILVER UP 6 CENTS, THE CROOKS DECIDED THAT THEY HAD BETTER ADD SOME 943,000 PAPER OZ TO THEIR INVENTORY/INVENTORY RESTS AT 319.012 MILLION OZ
March 28/WITH SILVER DOWN 27 CENTS/AGAIN NO CHANGE IN SILVER INVENTORY AT THE SLV/INVENTORY RESTS AT 318.069 MILLION OZ
MARCH 27/WITH SILVER DOWN 14 CENTS/NO CHANGE IN SILVER INVENTORY AT THE SLV/INVENTORY RESTS AT 318.069 MILLION OZ/
WITH SILVER UP 11 CENTS/NO CHANGE IN SILVER INVENTORY AT THE SLV/INVENTORY RESTS AT 318.069 MILLION OZ/
MARCH 23/WITH SILVER UP 19 CENTS, A HAD A BIG WITHDRAWAL OF 1.602 MILLION OZ.INVENTORY RESTS AT 318.069 MILLION OZ/
MARCH 22/WITH SILVER DOWN ONE CENT, NO CHANGE IN SLV INVENTORY/INVENTORY RESTS AT 319.671 MILLION OZ/
March 21/WITH SILVER UP 21 CENTS/NO CHANGE IN SLV INVENTORY/INVENTORY RESTS AT 319.671 MILLION OZ/
March 20/WITH SILVER DOWN 13 CENTS/NO CHANGE IN SLV INVENTORY/INVENTORY RESTS AT 319.671 MILLION OZ/
March 19/WITH SILVER UP 5 CENTS, THE SLV ADDS A SMALL 659,000 OZ TO ITS INVENTORY/INVENTORY RESTS AT 319.671 MILLION OZ/
MARCH 16/WITH SILVER DOWN 15 CENTS/NO CHANGES IN SILVER INVENTORY AT THE SLV/INVENTORY RESTS AT 319.012 MILLION OZ.
FOR THE WEEK; SILVER IS DOWN 42 CENTS YET ADDS 943,000 OZ OF SILVER INTO THE SLV/
MARCH 15/WITH SILVER DOWN 11 CENTS/NO CHANGES IN SILVER INVENTORY AT THE SLV/INVENTORY RESTS AT 319.012 MILLION OZ/
MARCH 14/WITH SILVER DOWN 8 CENTS/NO CHANGES IN SILVER INVENTORY AT THE SLV/INVENTORY RESTS AT 319.012 MILLION OZ/
MARCH 13/WITH SILVER UP 10 CENTS/NO CHANGES IN SILVER INVENTORY AT THE SLV/INVENTORY RESTS AT 319.012 MILLION OZ/
HAD ANOTHER HUGE ADDITION OF 1.315 MILLION OZ/INVENTORY RESTS AT 316.590 MILLION OZ/
APRIL 19/2018: A BIG CHANGE IN SILVER INVENTORY: A WITHDRAWAL OF 2.355 MILLION OZ WITH SILVER ON A TEAR THESE PAST FEW DAYS????
Inventory 317.841 million oz
end
6 Month MM GOFO 2.09/ and libor 6 month duration 2.50
Indicative gold forward offer rate for a 6 month duration/calculation:
G0FO+ 2.09%
libor 2.50 FOR 6 MONTHS/
GOLD LENDING RATE: .41%
XXXXXXXX
12 Month MM GOFO
+ 2.75%
LIBOR FOR 12 MONTH DURATION: 2.51
GOFO = LIBOR – GOLD LENDING RATE
GOLD LENDING RATE = +.24
end
Major gold/silver trading /commentaries for THURSDAY
GOLDCORE/BLOG/MARK O’BYRNE.
GOLD/SILVER
Palladium Bullion Surges 17% In 9 Days On Russian Supply Concerns
Palladium bullion has surged a massive 17% in just nine trading days. From $895/oz on Friday April 6th to over $1,052/oz today (April 19th). The price surge is due to palladium being due a bounce after falling in the first quarter and now due to Russian supply concerns.
In a volatile month, precious metals and commodities have been the clear winners so far, with palladium having the greatest gains of all – up 10.7% in April (see table below).
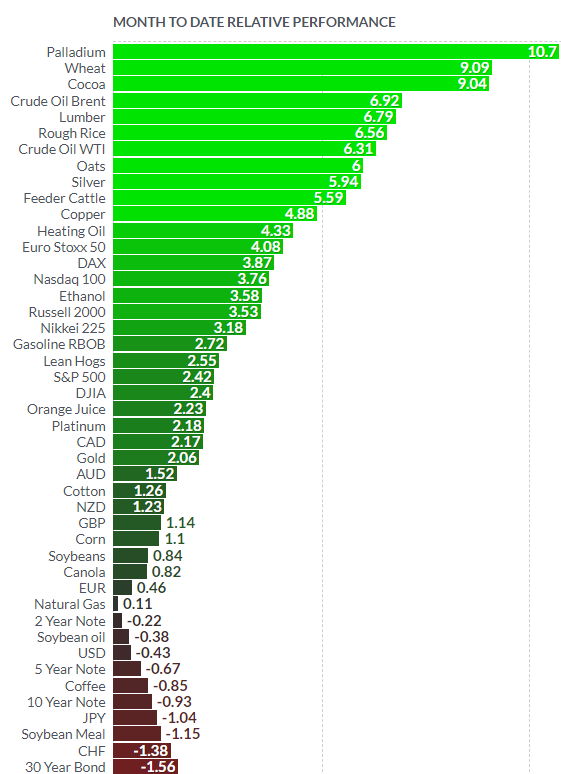
Source: Finviz
Palladium has surged on concerns about supply from Russia which is the world’s largest producer of palladium with various estimates of its contribution to total global palladium production ranging from 40% to 50%.
Russia and increasingly unstable South Africa control more than three-quarters of the world’s palladium supply, according to Johnson Matthey. Global palladium demand outstripped supply by 23 tonnes (25.4 tons) in 2017, so depleted stocks of this very rare and finite metal were already running low. Palladium is a key component in the global car industry and this will cause difficulties for international car manufacturers.
Palladium lease rates are moving higher in London which suggests a shortage of palladium. Some believe, including precious metals analyst David Jensen, that Russia saved the London palladium futures market (paper/ electronic market) in 2001 when physical palladium was in very short supply and lease rates exploded.
Given the increasing tensions of today and the trade and financial war being waged on powerful Russian individuals including Putin and on Russia itself, ‘the Bear’ is less likely to be as forgiving and accommodating today.
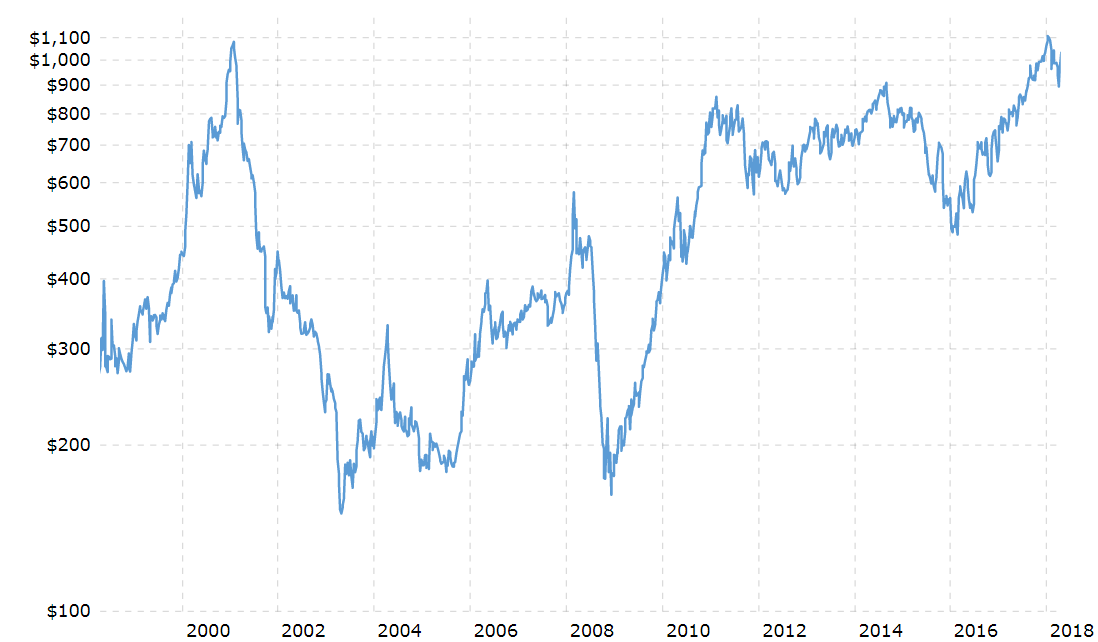
Palladium in USD 20 Years – Macrotrends.net
Were Russia to restrict the supply of palladium due to the bombing of Syria against its will or indeed due to the latest round of sanctions, palladium prices will see even greater gains.
Most of the commodities complex has surged this month due to concerns about war in the Middle East and a trade, economic and actual war between Russia and the U.S. The more aggressive latest round of U.S. sanctions from the Trump administration has jolted a broad range of Russia-related assets including natural gas, oil, base metals and indeed precious metals such as palladium.
Listen on SoundCloud , Blubrry & iTunes. Watch on YouTube below

Stocks have remained buoyant so far but the dollar and U.S. bonds have seen selling pressure. The long term fiscal outlook for Trump’s America is increasingly precarious with $1 trillion plus budget deficits being projected for the foreseeable future.
This makes the dollar vulnerable in the medium and long term and underlines the case for owning the precious metals of gold, silver, platinum and palladium. Larger allocations to gold are merited, then silver and investors should consider very small allocations to platinum and palladium.
The increasingly bullish fundamentals of the global silver bullion market were shown by usyesterday (see chart below). The fundamentals of very depressed silver are arguably even better than palladium. Palladium is not far from all time record nominal highs (see chart above) while silver at just over $17/oz languishes some 65% below its record highs of near $50/oz in April 2011.
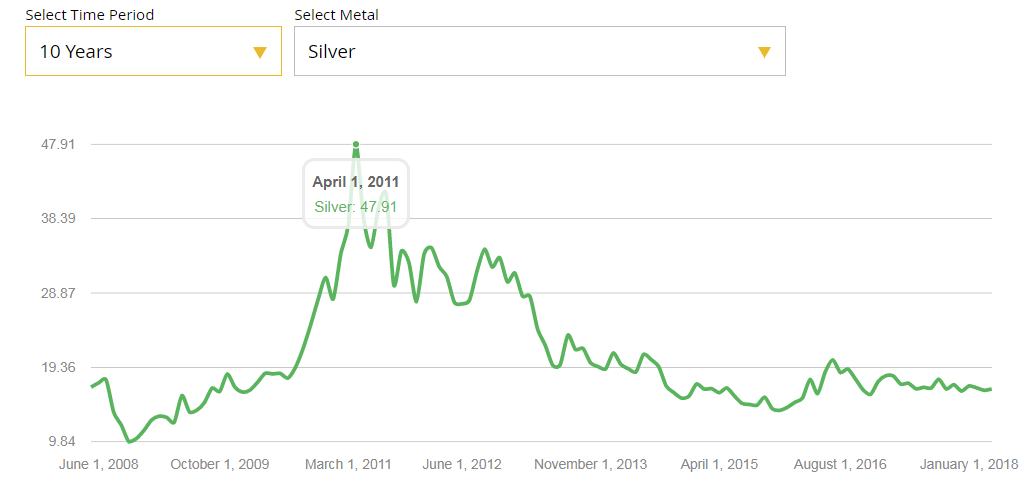
Silver is arguably the cheapest and best value asset in the ‘inflated assets’ world of today. Due to the very positive supply demand fundamentals for silver including increasing investment demand from the “prudent smart money”, expect silver to see similar sharp gains once it has a weekly close and breaks out above $18.50/oz.
Listen on SoundCloud , Blubrry & iTunes. Watch on YouTube below
News and Commentary
Gold scores its highest finish in a week (MarketWatch.com)
Gold advances on technical buying, light safe haven demand (Reuters.com)
Fed’s Beige Book finds widespread concerns about new and proposed trade tariffs (MarketWatch.com)
Stocks Rise on Earnings, Oil as Treasuries Decline (Bloomberg.com)
World Top 20 Silver producers 2017 (SharpsPixley.com)
India Is Facing a Risky Cash Crunch (Bloomberg.com)
Metals Gripped by Turmoil (Bloomberg.com)
IMF sounds alarm on excessive global borrowing (FT.com)
The Federal Reserve Has Done A Great Job Destroying The Middle Class (ZeroHedge.com)
IMF Warns “United States Stands Out” (ZeroHedge.com)
Listen on SoundCloud , Blubrry & iTunes. Watch on YouTube below
Gold Prices (LBMA AM)
18 Apr: USD 1,346.55, GBP 949.59 & EUR 1,088.95 per ounce
17 Apr: USD 1,342.95, GBP 937.24 & EUR 1,084.57 per ounce
16 Apr: USD 1,344.40, GBP 941.21 & EUR 1,087.62 per ounce
13 Apr: USD 1,340.75, GBP 938.93 & EUR 1,087.35 per ounce
12 Apr: USD 1,345.90, GBP 951.01 & EUR 1,090.99 per ounce
11 Apr: USD 1,345.20, GBP 947.96 & EUR 1,087.86 per ounce
10 Apr: USD 1,335.95, GBP 942.25 & EUR 1,083.46 per ounce
Silver Prices (LBMA)
18 Apr: USD 16.95, GBP 11.93 & EUR 13.70 per ounce
17 Apr: USD 16.63, GBP 11.60 & EUR 13.44 per ounce
16 Apr: USD 16.60, GBP 11.61 & EUR 13.42 per ounce
13 Apr: USD 16.51, GBP 11.57 & EUR 13.40 per ounce
12 Apr: USD 16.66, GBP 11.74 & EUR 13.50 per ounce
11 Apr: USD 16.57, GBP 11.67 & EUR 13.39 per ounce
10 Apr: USD 16.49, GBP 11.65 & EUR 13.38 per ounce
Recent Market Updates
– Silver Bullion Remains Good Value On Positive Supply And Demand Factors
– London House Prices See Fastest Quarterly Fall Since 2009 Crisis
– Global Debt Bubble Hits New All Time High – One Quadrillion Reasons To Buy Gold
– Oil Surges Over 8%, Gold and Silver Marginally Higher, Stocks Gain In Volatile Week
– EU and Euro Exposed To Risks Including Trade Wars and War With Russia In Middle East
– Trump Tweets Russia “Get Ready” For Missiles In Syria – Gold, Oil Rise and Stocks Fall
– Private: EU and Euro Exposed To Trade Wars, Energy Dependence, Anti-EU and Anti-Euro Movements
– Trump Making ‘Major Decisions’ on Syria, Iran and Russia Response ‘Very Quickly’
– Gold Out Performs Stocks In 2018 and This Century By Ratio Of Two To One
– Jamie Dimon Warns Of Potential ‘Market Panic’
– Silver Bullion: Should We Be Worried About Silver?
– Martin Luther King Jr. Anniversary: Reminds Us Of Costs Of War To Society and Financial System
– Gold Outperforms Stocks In Q1, 2018

Andrew Maguire’s Kinesis money which is a “bitcoin” but backed 100% by allocated gold and silver is set to go.
it think it would be a great idea to look at this!
please read at: https://kinesis.money/#/
(Andrew Maguire)
|
2:57 PM (1 hour ago) | ||
|
|||
Harvey
Here It is my friend! https://kinesis.money/#/ Please let everyone know.
Let catch up on Monday if you have time. We have billions in the hopper ready to be allocated on the 1st day of trading. The paper market days are over.
Warm regards
Andy
END
the IMF sounds the alarm bell on excessive debt issuance
(courtesy Chris Giles/London’s Financial times)
IMF sounds alarm on excessive global borrowing
Submitted by cpowell on Wed, 2018-04-18 14:07. Section: Daily Dispatches
By Chris Giles
Financial Times, London
Wednesday, April 18, 2018
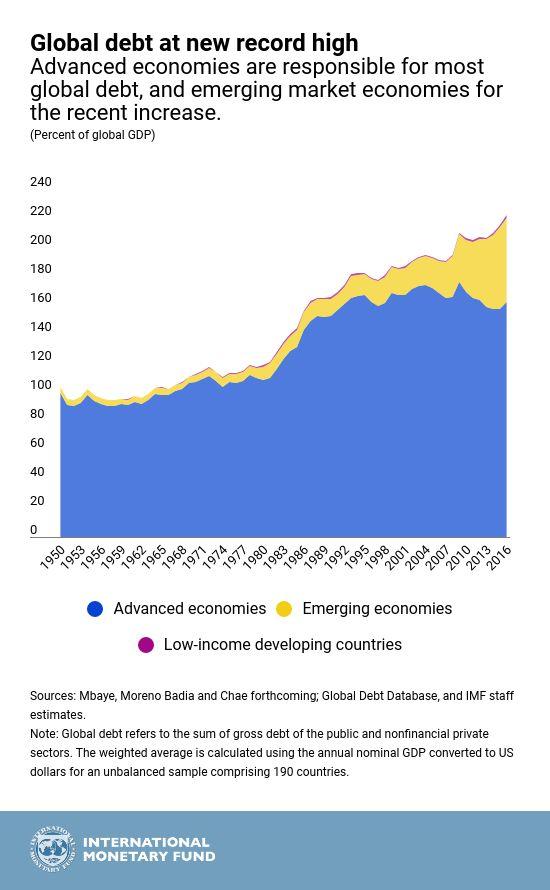
WASHINGTON — The International Monetary Fund today sounded the alarm on excessive global borrowing, warning that with a total of $164 trillion owed, the world’s public and private sectors are deeper in debt than at the height of the financial crisis a decade ago.
Global debt is now more than twice the size of the value of goods and services produced every year and at 225 percent of global gross domestic product it is now 12 percentage points higher than at its previous peak in 2009.
The fund said there was now an urgent need to reduce the burden of debt in both the private and public sectors to improve the resilience of the global economy and provide greater firefighting capability if things went wrong. …
… For the remainder of the report:
https://www.ft.com/content/d4bf2984-42d2-11e8-93cf-67ac3a6482fd
END
With huge dollar shortages it was a no brainer for Iran to switch to euros for official reporting currency. It is not going to help them
(courtesy Reuters/GATA)
Iran switches from dollar to euro as official reporting currency
Submitted by cpowell on Thu, 2018-04-19 01:08. Section: Daily Dispatches
From Reuters
Wednesday, April 18, 2018
LONDON — Iran will start reporting foreign currency amounts in euros rather than U.S. dollars, state media said today as part of the country’s effort to reduce its reliance on the U.S. currency due to political tension with Washington.
The new policy could encourage government bodies and firms linked to the state to increase their use of the euro at the expense of the dollar.
Central bank governor Valiollah Seif said last week that Supreme Leader Ayatollah Ali Khamenei had welcomed his suggestion of replacing the dollar with the euro in foreign trade, as the “dollar has no place in our transactions today.”
Tehran has been trying for years to move away from the dollar, although much of the country’s international trade is still conducted in dollars and ordinary Iranians use them for travel and savings. …
… For the remainder of the report:
https://www.reuters.com/article/us-iran-currency-euro/iran-switches-from
END
With famed geologist Keith Barron roaming the mountains of Ecuador, he reports that the government there has a new, realistic and practical approach to companies wishing to exploit the countries mineral riches
(courtesy Keith Barron/news.vice.com/GATA)
Ecuador is getting realistic and practical about exploiting its mineral wealth
Submitted by cpowell on Thu, 2018-04-19 01:38. Section: Daily Dispatches
9:42p ET Wednesday, April 18, 2018
Dear Friend of GATA and Gold:
The VICE newsmagazine on HBO television has just done a documentary about geologist and mining entrepreneur Keith Barron’s return to Ecuador as CEO of Aurania Resources, and it suggests that the country and its people have taken a new, realistic, and practical approach to exploiting their mineral riches.
An excerpt from the documentary, headlined “Meet the Real-Life Indiana Jones Hunting for Gold in the Amazon,” is posted at VICE News here:
https://news.vice.com/en_us/article/d35kmj/meet-the-real-life-indiana-jo…
CHRIS POWELL, Secretary/Treasurer
Gold Anti-Trust Action Committee Inc.
CPowell@GATA.org
end
This is a difficult one! There is no question that in silver the crooks goaded the speculators in a considerable short position. The reason that the bankers were doing this is that they feared that silver was in dramatic short supply in London. Bars are arriving only with 2018 year stamped on them as the physical supply is rapidly disappearing.
Maybe your reason for a short squeeze as the commercials will desperately try and extricate themselves from this mess
(courtesy John Rubino/DollarCollapse)
Is This The Long-Awaited Silver Short Squeeze?
Authored by John Rubino via DollarCollapse.com,
Silver’s popping this week…

Which is what people following the futures market action have been expecting for several months now. Speculators – usually wrong at big turning points and almost always at least slightly net long silver – have suddenly gone net short.

This is almost unprecedented, and implies that a short squeeze – in which speculators are forced to cover their short bets by buying silver futures, thus forcing the price sharply higher – is a real possibility.
What does this mean going forward? Based on the extremes in the paper market the incipient short squeeze has a little longer to run. The next COT report comes out on Friday and will show where the speculators were on Tuesday. We can infer from today’s action that since Tuesday they will have closed a lot of shorts, which means we’ll have to wait for the following Friday’s report to know how many.
Longer term, this is the kind of attention-getting action that puts an asset back on the radar screens of non-true-believers. As hard as it is for us gold-bugs to imagine, the vast majority of people aren’t watching precious metals and have no idea why silver matters.
They do, however, notice when the price of something jumps.

So if this short squeeze has legs and generates some headlines, it could pull in enough momentum chasing money to create a positive feedback loop in which rising prices beget more rising prices.
People will then try to figure out why this is happening, which will expose silver’s extremely positive fundamentals – tiny available supply, falling mine production, rising demand from technology and other industrial uses, and a tendency to soar in times of monetary stress – thus expanding the pool of fundamental investors.
Let gold finally break through that damn $1,360 resistance and it’s off to the races. (Here’s a free gold investing guide.)
But of course – as fans of precious metals have to readily admit – we’ve been waiting for (and sometimes predicting) stuff like this for years. So this latest flash of light might be yet another freight train heading our way. But one of these days what should happen will happen, and $100 silver will make up for a lot of angst.
end
The sanctions by Trump on Rusal is having a devastating effect on them and on the industry. Rusal cannot source badly needed alumina to manufacture aluminium products. Rusal is seeking China’s help who is also got problems with a potential tariff on Chinese aluminium
thus the reason for aluminium rising on the markets..very inflationary
(courtesy zero hedge)
Russian Aluminum Giant Seeks Rescue From US Sanctions In China
One week ago, when we first discussed the upcoming surge in commodity prices – especially aluminum and nickel – following Trump’s latest Russian sanctions, which in turn sent the stock and bond prices of Russian aluminum giant Rusal crashing amid fears the company would be unable to access capital markets now that it has become “radioactive” to western banks, we suggested that it do the next logical thing: “seek funding in China” or approach Beijing as a market that is exempt from US sanctions: after all, China itself has a ravenous demand for the product.

As it turns out, that’s precisely what the company – owned by Russian oligarch Oleg Deripaska -has done.
According to Bloomberg, officials from Rusal, the world’s second largest aluminum producer, met Chinese companies and traders this week to discuss the possibility of buying alumina and selling aluminum in China.
Still, China’s response was lukewarm: after all, Beijing itself is locked in an escalating trade war with the US and the last thing it wants is to infuriate the moustached neocons in the Trump administration by allowing Russian companies to skirt US sanctions.
Rusal’s delegation in China, which includes senior marketing and sales representatives, is discussing potential options but hasn’t reached any sort of agreement and may not do so, according to the people, who asked not to be identified because the matter is private. Chinese officials were cautious about any sort of deal because of the risk of contravening sanctions, the people said.
Furthermore, in addition to finding capital and buyers for its product, Rusal is looking for alternative sources of alumina, the raw material for aluminum, as sanctions block its normal supplies.
At the same time, the company’s asking traders whether it can boost sales of the refined metal in ingot form in China, as its usual customers are cut off. Rusal’s press office declined to comment.
And while Beijing may be able to quietly provide Rusal with funding, China may not be the “all-in” savior Rusal is seeking. As a reminder, the world’s biggest aluminum producer has already been cutting excess capacity, and has been exporting, and in some cases dumping, huge volumes of aluminum products it doesn’t need domestically and exchange warehouses are brimming with record stockpiles. What’s more, its own aluminum industry is being targeted by U.S. trade tariffs.
“It’s understandable that Rusal is looking for a solution from China as the country is the world’s biggest market of the metal,” said Wan Ling, an analyst at CRU Group in Beijing. “We’ll see major concerns from the Chinese side amid the current sensitivity in the global trade environment.”
Meanwhile, the most likely outcome is that as US sanctions persist, Russia’s aluminum output will remain in limbo, which will cripple European procurement, as the continent is Rusal’s biggest buyer…

while sending global supply chain for aluminum – which is used in everything from planes made by Boeing to Ford trucks to Campbell soup to Budweiser beer cans – in disarray.

And since Rusal supplies about 6% of the world’s aluminum or about 17% of production outside China, and operates mines, smelters and refineries from Ireland to Jamaica, the impact of recent sanctions has sent aluminum prices soaring to the highest since 2011.

Meanwhile, as the world refuses to accept Rusal’s product, the Russian aluminum giant is said to be stockpiling large quantities of aluminum at one of its plants in Siberia, according to Reuters.With the firm’s own storage space filling up with unsold aluminum, Rusal executives in Sayanogorsk, in southern Siberia, have had to rent out additional space to accommodate the surplus stock, one of the sources told Reuters.

“Aluminum sales have broken down. And now the surplus aluminum is being warehoused in production areas of the factory itself,” said someone who works on the grounds of one of Rusal’s two plants in Sayanogorsk
Several people connected to Rusal said that Oleg Deripaska, the company’s main shareholder who along with the company was included on a U.S. sanctions blacklist, visited Sayanogorsk this week for a closed-door meeting with staff.
Reuters spoke to a contractor at the Sayanogorsk plants who said the stockpiled ingots, stacked on pallets, were building up fast. He said two days’ worth of production would fill up a five-car train, but already a week had gone by with aluminum piling up.
“Can you imagine a week?” he said. “There’s a hell of a lot there, a hell of a lot. It’s being stockpiled, it’s not being shipped.”
An electrician working for Rusal said the ingots were being squeezed into all available space.
“The storage is not quite full,” said the electrician, who spoke on condition of anonymity to discuss internal company affairs. “Something is still being loaded all the same, some stuff is being shipped.”
* * *
To be sure, the Russian company will hardly give up without a fight: on Tuesday its Hong-Kong traded shares, which had lost more than 60% since the sanctions were announced last week, surged nearly 30% to HK$1.81 on speculation Trump will stop, and maybe roll back sanctions. But until that happens, Rusal is likely to target sales in alternative markets across the Middle East, Turkey and China to make up for lost exports to western markets, Morgan Stanley analysts said.
Finally there is the other wildcard: inflation. As noted above, aluminum and nickel have been driven to multi-year highs as the turmoil unleashed by U.S. sanctions spreads. On Thursday, aluminum surged to the highest level since 2011, trading at $2,668.50 a ton; Goldman forecasts prices could surge to $3,000 in the near term as the impact overwhelms the market and as no new suppliers can ramp up production to take over Rusal’s market share.
end
why we reached peak silver/trouble at a few silver mines
(courtesy Lawrie Williams)
LAWRIE WILLIAMS: World Top 20 Silver producers 2017
The latest analysis from GFMS for global silver supply and demand points to a 4% drop in new mined production last year. This was put down largely to years of Capex reductions in combination with supply disruptions, particularly in the Americas. The consultancy is looking for something of a supply recovery in the current year.
Particularly big falls were seen in Guatemala in 2017 with the suspension from July of mining at Tahoe Resources’ very large Escobal property, one of the world’s largest silver mines, due to an ongoing dispute with elements of the local population. Virtually on its own Escobal had propelled Guatemala into 11th place among the world’s silver producing nations in 2016, but the production shutdown in the latter part of 2017 dropped it back into 15th place last year and unless the dispute is soon settled and Tahoe allowed to mine again, Guatemala will disappear altogether from next year’s top 20 listing.
Other significant silver production falls were seen in the U.S. where an ongoing dispute at Hecla’s Lucky Friday mine continues and in Chile, where most silver is produced as a byproduct of copper mining, and in Australia as a result of sharply reduced output at the country’s largest silver mine, Cannington, due to lower grades and lower throughput caused by an underground fire in April. Mining rates are expected to recover in the current year following the commissioning of the new crusher and the resumption of mining activities on a high grade stoping section. Adding to the Australian losses, a substantial production decrease was also seen at the big Mount Isa silver/base metals operation, where output fell due to scheduled maintenance at its smelter.
Argentina also saw a fall in output. Production at Puna, a newly formed joint venture between SSR Mining’s Pirquitas and Golden Arrow Resources’ Chinchillas, fell by 4.2 million ounces (132 tonnes) as mining activities at the San Miguel open pit ceased in January 2017. As a result, lower grade stockpiles were processed throughout the year. However Yamana’s Cerro Moro silver/gold mine is due to come on stream about now and should add around 3.8 million ounces (117 tonnes) of silver to this year’s total.
| Table: World’s biggest silver producing nations 2016/2017 (tonnes) | |||||
| Rank | Country |
2017 output |
2016 Output |
% Change |
|
| 1 | Mexico |
6,106 |
5,795 |
+5% |
|
| 2 | Peru |
4,588 |
4,625 |
-1% |
|
| 3 | China |
3,502 |
3,571 |
-2% |
|
| 4 | Russia |
1,306 |
1,449 |
-10% |
|
| 5 | Chile |
1,260 |
1,493 |
-19% |
|
| 6 | Bolivia |
1,244 |
1,353 |
-8% |
|
| 7 | Poland |
1,229 |
1,197 |
+3% |
|
| 8 | Australia |
1,101 |
1,353 |
-19% |
|
| 9 | USA |
1,048 |
1,151 |
-9% |
|
| 10 | Argentina |
796 |
927 |
-14% |
|
| 11 | Kazakhstan |
591 |
554 |
+7% |
|
| 12 | India |
526 |
435 |
+21% |
|
| 13 | Sweden |
482 |
510 |
-5% |
|
| 14 | Canada |
395 |
404 |
-2% |
|
| 15 | Guatemala |
361 |
837 |
-57% |
|
| 16 | Indonesia |
358 |
348 |
+3% |
|
| 17 | Morocco |
339 |
317 |
+7% |
|
| 18 | Turkey |
171 |
174 |
-2% |
|
| 19 | Armenia |
156 |
149 |
+4% |
|
| 20 | Iran |
112 |
112 |
– |
|
| Rest of World |
834 |
880 |
-5% |
||
| Global Total |
26,503 |
27,638 |
-4% |
||
Source: GFMS, Lawrieongold.com
Note: Differences in % figures and global tonne totals shown due to rounding of more detailed stats.
The big output positives in 2017 were in production in Mexico. India and Kazakhstan. In the former, silver output rose by around 10.1 million ounces (311 tonnes), or 5%, led by higher production at San Julián and Peñasquito. Fresnillo’s San Julián operation, which was commissioned in Q3 2016, accounted for the majority of the growth in the country, producing a total of 10.5 million ounces (328 tonnes) and in combination these increases offset production losses elsewhere, particularly in the primary gold mining sector. San Julian commissioned its Phase 2 during the second half of the year which should result in further production growth in 2018.
India, which is a big silver consumer too for its jewellery sector, processed higher silver grades and ore volumes at Hindustan Zinc’s operations. Similarly, further gains were noted in the zinc sector in Kazakhstan, with silver production from Kazzinc’s assets higher by 28%, or 1.3 million ounces (30 tonnes). Kazakhstan continues to step up efforts to promote its domestic precious metals refining capacity, treating mine doré and scrap from several international sources, most notably from Russian mines.
There were output falls in China where the silver mining sector was also subjected to stricter environmental controls, and also a decline in byproduct output from the lead/zinc mining sector. Russia, the world’s fourth largest producer, also saw a substantial output fall extending the losses reported in the previous year.
Looking ahead to the current year, though, GFMS is anticipating something of a pick-up in mined production of silver with mining rates returning to normal and output from gold and primary silver mines in the Americas increasing. At the country level, GFMS estimates that Mexican production will post the largest gain and grow by as much as 6 million ounces (187 tonnes) led by Fresnillo. Higher grades at Cannington in Australia will also provide support to the global balance and it also expects to see some growth from the copper sector in Peru.
The big unknown remains Guatemala should the Escobal shutdown be reversed. That decision remains with the courts and the country is not seen as being particularly mining-friendly, despite the positive economic advantages that might result from a resumption of production at one of the world’s largest, and potentially most profitable, silver mines.
end
Your early THURSDAY morning currency, Asian stock market results, important USA/Asian currency crosses, gold/silver pricing overnight along with the price of oil Major stories overnight/9 AM EST
i) Chinese yuan vs USA dollar/CLOSED UP 6.2766 /shanghai bourse CLOSED UP 25.98 POINTS OR 0.83% / HANG SANG CLOSED UP 424.19 POINTS OR 1.40%
2. Nikkei closed UP 32.98 POINTS OR 0.15%/ /USA: YEN RISES TO 107.41/
3. Europe stocks OPENED MIXED /USA dollar index RISES TO 89.65/Euro FALLS TO 1.2371
3b Japan 10 year bond yield: RISES TO . +.043/ !!!!(Japan buying 100% of bond issuance)/Japanese yen vs usa cross now at 107.41/ THIS IS TROUBLESOME AS BANK OF JAPAN IS RUNNING OUT OF BONDS TO BUY./JAPAN 10 YR YIELD FINALLY IN THE POSITIVE/BANK OF JAPAN LOSING CONTROL OF THEIR YIELD CURVE AS THEY PURCHASE ALL BONDS TO GET TO ZERO RATE!!
3c Nikkei now JUST BELOW 17,000
3d USA/Yen rate now well below the important 120 barrier this morning
3e WTI:: 69.08 and Brent: 74.33
3f Gold DOWN/Yen DOWN
3g Japan is to buy the equivalent of 108 billion uSA dollars worth of bond per month or $1.3 trillion. Japan’s GDP equals 5 trillion usa./“HELICOPTER MONEY” OFF THE TABLE FOR NOW /REVERSE OPERATION TWIST ON THE BONDS: PURCHASE OF LONG BONDS AND SELLING THE SHORT END
Japan to buy 100% of all new Japanese debt and by 2018 they will have 25% of all Japanese debt. Fifty percent of Japanese budget financed with debt.
3h Oil UP for WTI and UP FOR Brent this morning
3i European bond buying continues to push yields lower on all fronts in the EMU. German 10yr bund RISES TO +.531%/Italian 10 yr bond yield UP to 1.750% /SPAIN 10 YR BOND YIELD UP TO 1.248%
3j Greek 10 year bond yield RISES TO : 4.019?????????????????
3k Gold at $1349.60 silver at:17.26 7 am est) SILVER NEXT RESISTANCE LEVEL AT $18.50
3l USA vs Russian rouble; (Russian rouble DOWN 9/100 in roubles/dollar) 60.95
3m oil into the 69 dollar handle for WTI and 74 handle for Brent/
3n Higher foreign deposits out of China sees huge risk of outflows and a currency depreciation. This can spell financial disaster for the rest of the world/
JAPAN ON JAN 29.2016 INITIATES NIRP. THIS MORNING THEY SIGNAL THEY MAY END NIRP. TODAY THE USA/YEN TRADES TO 107.41 DESTROYING JAPANESE CITIZENS WITH HIGHER FOOD INFLATION
30 SNB (Swiss National Bank) still intervening again in the markets driving down the SF. It is not working: USA/SF this morning 0.9682 as the Swiss Franc is still rising against most currencies. Euro vs SF is 1.1978 well above the floor set by the Swiss Finance Minister. Thomas Jordan, chief of the Swiss National Bank continues to purchase euros trying to lower value of the Swiss Franc.
3p BRITAIN VOTES AFFIRMATIVE BREXIT/LOWER PARLIAMENT APPROVES BREXIT COMMENCEMENT/ARTICLE 50 COMMENCES MARCH 29/2017
3r the 10 Year German bund now POSITIVE territory with the 10 year RISING to +0.531%
The bank withdrawals were causing massive hardship to the Greek bank. the Greek referendum voted overwhelming “NO”. Next step for Greece will be the recapitalization of the banks and that will be difficult.
4. USA 10 year treasury bond at 2.8913% early this morning (THIS IS DEADLY TO ALL MARKETS). Thirty year rate at 3.0852% /
5. Details Ransquawk, Bloomberg, Deutsche bank/Jim Reid.
(courtesy Jim Reid/Bloomberg/Deutsche bank/zero hedge)
Global Stock Rally Fizzles As Commodity Buying Frenzy Takes Over
After yesterday’s disappointing close for US stocks, which saw the Dow close down thanks to IBM’s 7.5% plunge and after some early upside VIX manipulation, ending a 3-day upside streak and the S&P closing just barely in the green, U.S. futures are in the red this morning, after Asian shares rose and European equities were little changed.

Having traded in a narrow range, S&P futures are near session lows, just fractionally back over 2,700.

European stocks similarly struggled for traction following two days of increases and in the wake of a mixed bag of corporate earnings, even after shares in Asia rose following gains from the prior day. The Eurostoxx remains roughly flat with FTSE as the outperforming index (+0.2% due to FX effects) and SMI (-0.07%) the underperformer amid domestic earnings. In large cap stocks news, ABB beat EBITDA expectations (+4.9%) pushing industrials to be the sector outperformer whilst Novartis (-1.9%) dragged down healthcare. Nestle (+0.3%) falling in line with expectations, Unilever (-1.9%) disappointed and Pernod Ricard (-0.9%) announcing an earnings beat.
Earlier in Asia, miners rose amid the commodity rally, with Australia’s ASX 200 (+0.3%) lifted by commodity names as miners outperformed amid strength in metals prices, which also boosted BHP shares despite a disappointing quarterly iron ore production update. The Nikkei 225 (+0.2%) was also led higher by metal stocks and in tandem with a weaker currency, while China’s benchmark index rebounded above a key level, driven by an advance in material shares. Hong Kong stocks rose for a second day, led by oil producers and financial institutions. The Shanghai Composite Index rose 0.8% to 3,117.38, rising above the 3,100 level, amid speculation the government is once again in the market.; blue-chip energy stocks in Hong Kong also cheered the higher oil prices and with sentiment also helped by another firm liquidity operation by the PBoC.
But if the overnight action in equities was muted, it was very different story in commodities where a buying frenzy has been unleashed as the U.S. sanctions against Rusal reverberated in metals markets, sending aluminum and nickel to multi-year highs on Wednesday.
Nickel jumped the most in 6.5 years on talk Nornickel – the world’s second-biggest producer of the metal – could be targeted. Aluminum prices also reached their highest since 2011, its raw material alumina touched an all-time peak, while iron ore leapt 5 percent. Such increases, if sustained, could fuel inflationary pressures and investors hedged by selling sovereign bonds.
In any case, it was set to be the strongest day for the commodity complex in eight months as Brent crude futures climbed past $74 a barrel after a near 3% jump overnight, one day after Dennis Gartman said he had gone short gold. The surge came on a Reuters report that OPEC’s new price hawk Saudi Arabia would be happy for crude to rise to $80 or even $100, a sign Riyadh will seek no changes to a supply-cutting deal even though the agreement’s original target is now within sight. “The Saudis and their colleagues in OPEC need higher oil for their fiscal positions and the Kingdom is on a bold – and costly – reform program,” Greg McKenna, chief market strategist at CFD, told Reuters.
On Thursday, metals extended their stellar gains, driving another rally in Bloomberg’s commodity index (BCOM), which is now back to levels seen in late 2015, as investors continue to fret about how Russian sanctions will impact the market.

In currency markets, the U.S. dollar remained rangebound with its index a fraction firmer at 89.669. It gained a touch on the yen to 107.46 yen, but stayed short of recent peaks at 107.78. Meanwhile, the Swiss franc has kept traders chained to their desks given its ongoing struggle to stay off the historic 1.20 handle versus the euro – which was so famously breached in early 2015 when the SNB ended its peg to the euro…

… as the USD gains traction after another set of U.K. data comes in lower than forecast. The EURCHF got as high as 1.1999 in the session in what appears to have been an algo attempt to trigger stops, before immediately sliding following a counterattack by other algos.

The USDJPY rose as the Japan-U.S. summit so far hasn’t stoked concerns of heightening trade tensions, helping to improve risk sentiment while a weak outcome at a 20-year JGB debt sale sent Japanese bonds lower. Elsewhere, the sterling dropped a third day, dragging the euro lower amid relatively low volumes in the currency market. The strength in commodity prices helped the Australian dollar easily weather unexpectedly soft jobs data, with employment rising by a meager 4,900 in March, and the AUD turned higher amid the commodity rally.
Government bonds retreated amid an upbeat global growth outlook, allowing U.S. curve flattening to take a breather. 10-year Treasury yields climbed to 2.89% after leaping on Wednesday in the wake of the Federal Reserve’s Beige Book report, which showed a solid outlook for the economy despite trade concerns. Still, optimism over expansion has been tested by the flattening yield curve, though there’s also been some respite for traders as geopolitical tensions showed signs of dissipating. European bonds played catch up, and yields in the region jumped.
In other news, overnight Fed president Quarles (Voter, Neutral) said he does not view current yield curve flattening as a signal for a recession. Separately the Fed’s Rosengren (Non-voter, Hawkish) suggests US lacks buffers for next downturn. Meanwhile, RBNZ Governor Orr says expects very benign inflation ahead, adds doggedly determined to aim for inflation at 2%.
Data include jobless claims and Philadelphia Fed Business Outlook. Bank of New York Mellon, BB&T, Blackstone, Danaher, Philip Morris, and P&G are among companies reporting earnings
Bulletin Headline Summary from RanSquawk
- Equity markets mostly flat as macro effects subside, focus turns toward earnings
- UK Retail sales falls below expectations pulling cable below the 1.42 level
- Looking ahead, highlights include US weekly jobs, Philly Fed and a slew of central bank speakers
Top Overnight News
- Abe acknowledged that the U.S. is interested in a bilateral deal but said that Japan’s position remains that the multilateral Trans-Pacific Partnership “is the best for both of the countries.” Trump said he’d rejoin TPP if offered ‘a deal I can’t refuse.’
- Russia’s central bank deviated from its standard practice and used off-market conversion of ruble revenue into foreign currency for a wealth fund to avoid adding to volatility gripping the currency, according to S&P Global Ratings
- Hong Kong rates reach 2008 high after HKMA spends $6.5b on intervention to support the local dollar since the currency hit the weak end of its trading band a week ago for the first time since 2005. The HKMA’s purchases have been orderly and outflows aren’t too big, Deputy Chief Executive Howard Lee said on Thursday
- President Donald Trump is methodically laying the groundwork for a landmark meeting with North Korean leader Kim Jong Un with the meeting increasingly likely to occur by early June
- JPMorgan is said to plan on moving “far greater” numbers of staff and traders to Paris than the 60-80 bankers previously known, AFP reports
- Australian employment rose less than forecast in March and the previous month’s gain was revised to a decline, suggesting the central bank will keep interest rates on hold
- Hong Kong rates reach 2008 high after HKMA spends $6.5b on intervention to support local dollar. HKMA said the size of the outflows isn’t too big
- To Citigroup, the chances are slim the U.S. enters a recession anytime soon. Fed officials feel the same way. Yet both camps agree that an inverted Treasuries yield curve would be an ominous sign for growth
Market Snapshot
- S&P 500 futures down 0.1% to 2,706.50
- STOXX Europe 600 down 0.03% to 381.76
- MXAP up 0.5% to 175.49
- MXAPJ up 0.9% to 574.75
- Nikkei up 0.2% to 22,191.18
- Topix up 0.03% to 1,750.18
- Hang Seng Index up 1.4% to 30,708.44
- Shanghai Composite up 0.8% to 3,117.38
- Sensex up 0.2% to 34,397.84
- Australia S&P/ASX 200 up 0.3% to 5,881.00
- Kospi up 0.3% to 2,486.10
- German 10Y yield rose 2.9 bps to 0.56%
- Euro down 0.05% to $1.2368
- Italian 10Y yield fell 4.2 bps to 1.463%
- Spanish 10Y yield rose 3.9 bps to 1.256%
- Brent futures up 0.9% to $74.13/bbl
- Gold spot up 0.2% to $1,351.80
- U.S. Dollar Index up 0.1% to 89.70
Asian stocks were higher across the board following the mostly positive lead from Wall St, where earnings remained in focus and the energy sector outperformed after crude rallied over 3% to its highest since 2014. ASX 200 (+0.3%) was lifted by commodity names as miners outperformed amid strength in metals prices, which also boosted BHP shares despite a disappointing quarterly iron ore production update. Nikkei 225 (+0.2%) was also led higher by metal stocks and in tandem with a weaker currency, while Hang Seng (+1.4%) and Shanghai Comp. (+0.8%) conformed to the commodity-led gains with the blue-chip energy stocks in Hong Kong cheering the higher oil prices and with sentiment also helped by another firm liquidity operation by the PBoC. Finally, 10yr JGBs were subdued as upside in riskier assets sapped safe-haven demand, and with price action also kept tame by mixed 20yr auction results which showed reduced demand but higher accepted prices. The PBoC injected CNY 190bln via 7-day reverse repos. US President Trump said will shrink the US trade deficit with Japan and hopefully a balance will be reached, while he later stated that they are negotiating a one-on-one trade deal with Japan. There were also comments from Japanese PM Abe that he agreed with US President Trump to begin discussions on fair, free and reciprocal trade, while he also commented that TPP is the best trade deal for both Japan and US
Top Asia News
- Hong Kong Rates Reach 2008 High After $6.5 Billion Intervention
- China Asks Qualcomm For More Remedies to Win NXP Approval
- Itochu to Pay $1.1 Billion for Majority Stake in FamilyMart
- World’s Most Unloved Stocks Pummeled Further by Rate- Hike Fears
Equities have seen the narrative subside from macro effects and move toward individual stock news as the Eurostoxx remains roughly flat (-0.05%), with FTSE as the outperforming index (+0.2% due to FX effects) and SMI (-0.07%) the underperformer amid domestic earnings. Large cap stocks news are as follows, with ABB beating EBITDA expectations (+4.9%) pushing industrials to be the sector outperformer whilst Novartis (-1.9%) have dragged down healthcare. Nestle (+0.3%) falling in line with expectations, Unilever (-1.9%) who were disappointing and Pernod Ricard (-0.9%) announcing an earnings beat. In the M&A scope, Merck (+0.5%) confirmed their decision to offload their consumer unit to P&G for around EUR 3.4bln
Top European News
- Debenhams Stock Sinks as Retailer Loses CFO and Warns on Profit
- Novartis Names Amgen’s John Tsai to Oversee Drug Development
- U.K. Retail Sales Fall More Than Forecast Amid Snow Chaos
- Spanish Mayor Offers to Help Gibraltar Insurers Get Round Brexit
In FX, the DXY remains contained in a relatively tight range around 89.500, and mostly firmer for choice, but narrowly mixed vs G10 counterparts. The commodity currencies are gleaning support from underlying price gains, while comments from China’s SAFE contending that the Dollar may decline further as other global economies catch up has also aided EMs to recoup more recent losses. GBP: Sterling’s April winning streak has hit another potential obstacle in the shape of much weaker than expected UK retail sales data, and Cable has fallen back below the 1.4200 handle as a result to re-test and marginally breach lows seen in wake of Wednesday’s CPI miss. Market contacts report sell-stops through 1.4170, but there has been limited follow-through so far with Gbp/Usd finding buyers around 1.4160 and Eur/Gbp capped just ahead of 0.8740. AUD: A marginal outperformer as broad risk appetite and extended rallies in oil/metals more than offset a disappointing Aussie jobs report overnight, but Aud/Usd is still finding the atmosphere above 0.7800 tough to reside in, with some key chart resistance levels also keeping the pair in check (200 DMA at 0.7817 and a 0.7831 Fib. EUR/JPY: Both sticking rigidly to recent ranges, with key chart levels restraining price action alongside hefty and some mega option expiries. Eur/Usd looks bid below 1.2350 and offered on treks above 1.2400, while Usd/Jpy has been supported just under 107.00 and mostly resistant around 107.50-55.
In commodities, WTI (+0.8%) and Brent (+1%) remain close to highs that were last seen in 2014 amid reports yesterday Saudi Arabia would favour crude prices to rise US 80/bbl, or even USD 100/bbl. The upside is also followed the DoE inventory report which mirrored the API release and showed drawdowns across all product components. In the metals bloc, gold is trading softer amid pressure from a slightly firmer dollar, whilst Dalian iron ore rose almost 7% overnight, and Nickel soared 9% to a three-year high amid Russian sanction by the US on major Russian aluminium producer Rusal. Nickel has now risen over 16% in the last two sessions, whilst the Shanghai Futures Exchange cut intra-day transaction fees for nickel futures contracts for May to CNY 6 from current CNY 30. OPEC and Non-OPEC committee are said to have seen stockpiles nearly cleared
Looking at the day ahead now, the most notable data due in Europe is the February current account balance reading for the Euro area and March retail sales data for the UK. In the US we’ll get the latest weekly initial jobless claims reading, March leading index and April Philly Fed business outlook print. The Fed’s Brainard, Quarles and Mester as well as the BoE’s Cunliffe and Brazier are due to speak. Worth noting also is talks between Germany’s Merkel and France’s Macron with EU reforms and trade conflicts with the US expected to be high on the agenda.
US Event Calendar
- 8:30am: Initial Jobless Claims, est. 230,000, prior 233,000; Continuing Claims, est. 1.85m, prior 1.87m
- 8:30am: Philadelphia Fed Business Outlook, est. 21, prior 22.3
- 9:45am: Bloomberg Economic Expectations, prior 56; Consumer Comfort, prior 58
- 10am: Leading Index, est. 0.3%, prior 0.6%
Central Banks
- 8am: Fed’s Brainard Speaks on Regulatory Reform
- 9:30am: Fed’s Quarles Testifies on Supervision Before Senate Panel
- 6:45pm: Fed’s Mester Speaks on Economic Outlook and Policy
DB’s Jim Reid concludes the overnight wrap
With Spring finally deciding to make a long overdue appearance here in London, it feels like the dark clouds full of trade spats, tech tantrums and geopolitics have cleared, at least temporarily for markets, leaving the last few days feeling much more 2017-esque compared to some of the volatility swings that had become all too commonplace in 2018 so far. Indeed stronger equities, tighter credit spreads, lower volatility across the board and flatter yield curves seem to have come back to the forefront.
On the former, despite stalling a bit into the close last night, equity markets generally made headway yesterday with the S&P 500 (+0.08%), Nasdaq (+0.19%) and Stoxx 600 (+0.29%) all closing up on the back of an energy-sector driven boost and a smattering of decent earnings reports including Morgan Stanley. The Dow (-0.16%) did lag a bit however following the IBM results. Still, relative to the intraday lows back on April 2nd the S&P 500 and Dow are now up over +6% while the Nasdaq is up over +7%. The Stoxx 600 is also up nearly +5% from the lows on April 4th. At the same time the VIX – which was marginally higher yesterday – is down 10pts over the same time horizon.
Meanwhile, US HY credit spreads have quietly gone about rallying 40bps in the last two and a bit weeks and are now approaching their January tights while the US 2s10s curve touched 41bps yesterday and a new post GFC tight. The 2s30s curve also temporarily broke below 60bps for the first time in nearly 11 years. As we know the flattening has been driven by the front end with 2y Treasury yields now at 2.423% and up 18bps since April 2nd while 10y yields are up 14bps in the same time. Yesterday also saw the MOVE Index (Treasury Vol) nudge down another 1.5pts to close at 48 and within 4pts of the January lows. As a reminder that index got as high as 72 back in February.
The other big story in recent days has been moves in the commodity complex. Following another 3% jump yesterday Brent Oil is back up at nearly $74bbl and the highest since November 2014. Silver (+2.45%) also jumped by the most since late January yesterday and is above $17/oz for the first time since February 1st while Nickel rallied by more than 7% yesterday alone on the back of the Russia sanctions concerns. The broad CRB commodity index is now up over 6% from the April lows and at the highest level since 2015.
This morning in Asia, markets are following the US lead with the Nikkei (+0.48%), Hang Seng (+1.35%), Shanghai Comp (+0.97%), ASX 200 (+0.41%) and Kospi (+0.24%) all up as energy sectors lead gains. Futures markets in the US and Europe are also pointing to another positive start while Oil is up another half a percent and bond markets are slightly weaker.
To be honest there wasn’t a great deal of newsflow to highlight yesterday. President Trump confirmed that CIA Director Mike Pompeo had travelled to North Korea and met with Kim Jong Un ahead of a possible summit with Trump calling it a smooth meeting. Sweden and Switzerland are being mooted as possible destinations for the meeting and early June potential timing. Overnight, Trump added that “if I don’t think it’s a meeting that’s going to be fruitful, we won’t go”, although did not elaborate on what he means by fruitful. Also, Trump is now favourite with odds of 2/1 for the Nobel Peace Prize for those interested. Elsewhere, Bloomberg reported that Russia President Putin was seeking to smooth his relationship with Trump following the recent sanctions with a story suggesting that the Kremlin had ordered to dial back on anti-US rhetoric.
Separately, the FT reported that EU trade official Cecilia Malmstrom had warned the White House that the EU would not start talks on easing commercial tensions until the US removed the threat of hitting the EU with punitive tariffs. Also in the spotlight yesterday was some softer inflation data in Europe (more on that below) and chatter from the ECB’s Villeroy. Notably, the Governing Council member said that ECB officials were broadly in agreement of supporting a tapering later this year and that timing (September or December) was not a deep existential question for officials. Also, he highlighted that the ECB views the recent data as reflecting a temporary pull-back from high levels and does not alter the inflation outlook over the medium term. So overall a fairly unified signal from the ECB despite some softer data of late.
Back to that inflation data, in the UK core CPI dipped one-tenth in March to +2.3% yoy, a miss relative to expectations for +2.5%. Headline CPI also missed (+0.1% mom vs. +0.3% expected) meaning the annual rate fell by two-tenths to +2.5% yoy. RPI (+0.1% mom vs. +0.3% expected) also missed to the downside. That said the details were a bit more encouraging given that most of the weakness was in one-off items, perhaps meaning that there is some scope for a pullback next month. Indeed Sterling initially fell as much as -0.80% versus the Greenback following the data before closing -0.59%, although weakened again after the House of Lords voted heavily against Prime Minister May’s amendment to seek a post-Brexit customs union with the EU. Meanwhile, 10y Gilt yields rallied as much as 8bps to touch an intraday low of 1.357% (and the lowest in 2 weeks) before paring much of that to close at 1.413% and -2.1bps on the day. Market expectations for a BoE hike next month also didn’t appear to change much and continue to hover north of 80%.
For Europe, core CPI printed at +1.0% yoy and in line with the flash estimate however headline CPI was revised down one-tenth to +1.3% yoy – albeit in line with what country level data had suggested so it wasn’t a great surprise. Moves for European bond markets were also short lived with 10y Bunds touching an intraday low of 0.494% before ending the day +2.4bps higher at 0.527%. It was a similar story for OATs (+1.9bps to 0.744%) although BTPs did rally -4.3bps to close at 1.708% and a new 2018 low in yield. That coincided with a notable political development in Italy as President Mattarella asked Senate Speaker Casellati to explore whether there is a majority likely to support a potential government between a centre-right alliance and the Five Star Movement. Casellati has supposedly been given until Friday to report back. So worth seeing how things progress.
Across the pond, while there wasn’t much in the way of economic data it was another fairly busy day for Fedspeakers. In the early afternoon we heard from the Dallas Fed’s Kaplan who confirmed that his base case for the remainder of the year is two more rate hikes by the Fed. He did also highlight that he thinks “the path of rate increases is probably going to be flatter than people are accustomed to and one of the reasons is this moderating out-year growth”. On that he mentioned that energy has gone from a growth headwind to tailwind. It’s worth highlighting a report that our US economists put out on Tuesday (see link here) where they look at how much oil prices have to go up to offset the positive effect from tax cuts.
In the evening we also heard from the Fed’s Bullard, Quarles and Dudley. A wellknown dove, Mr Bullard said “we should stay flat with the policy rates, at least over the policy horizon”, in part as he is “getting concerned over the flattening yield curve”. He added that if cash rates go higher while longer rates don’t cooperate, “we could have an inverted yield curve within six months”. Further, he noted that “I do want to flag the yield curve issue because it’s time to have that debate right now”. On the same subject, Mr Quarles said he is “not viewing the current flattening of the yield curve as a particular signal of recession”. Finally, the soon to be retiring Mr Dudley reiterated a gradual path of rate hikes remains appropriate, but added that “even though unemployment is low, inflation remains below 2% target. As long as that is true, the case for tightening policy more aggressively does not seem compelling”. That said, he also conceded that over time, rates “will need to become slightly restrictive in the years ahead”.
Following on, the latest Fed Beige book noted that the “outlook remained positive, but contacts in various sectors…expressed concern about the newly imposed and/or proposed tariffs”. The text also suggested more of the same on growth, with all 12 districts noting “modest to moderate” economic growth, while price increases nationally were described as “moderate” and overall wage growth remained “only modest”.
Looking at the day ahead now, the most notable data due in Europe is the February current account balance reading for the Euro area and March retail sales data for the UK. In the US we’ll get the latest weekly initial jobless claims reading, March leading index and April Philly Fed business outlook print. The Fed’s Brainard, Quarles and Mester as well as the BoE’s Cunliffe and Brazier are due to speak. Worth noting also is talks between Germany’s Merkel and France’s Macron with EU reforms and trade conflicts with the US expected to be high on the agenda.
3. ASIAN AFFAIRS
i)THURSDAY MORNING/WEDNESDAY NIGHT: Shanghai closed UP 25.98 POINTS OR 0.84% /Hang Sang CLOSED UP 424.19 POINTS OR 1.40% / The Nikkei closed UP 32.98 POINTS OR 0.15%/Australia’s all ordinaires CLOSED UP .34% /Chinese yuan (ONSHORE) closed UP at 6.2766/Oil UP to 69.08 dollars per barrel for WTI and 74.33 for Brent. Stocks in Europe OPENED MIXED. ONSHORE YUAN CLOSED UP AT 6.2766 AGAINST THE DOLLAR. OFFSHORE YUAN CLOSED UP ON THE DOLLAR AT 6.2701 /ONSHORE YUAN TRADING WEAKER AGAINST OFFSHORE YUAN/ONSHORE YUAN TRADING STRONGER AGAINST USA DOLLAR/OFFSHORE YUAN TRADING A LITTLE STRONGER AGAINST THE DOLLAR /CHINA RETALIATES WITH TARIFFS/ TRUMP RESPONDS TO NEW TARIFFS AND IT NOW LOOKS LIKE A FULL TRADE WAR IS BEGINNING/
3 a NORTH KOREA/USA
North Korea/South Korea
3 b JAPAN AFFAIRS
Trump and Abe very friendly but cannot agree on anything with respect to trade
(courtesy zerohedge)
Trump, Abe Agree On Need For New Trade Deal, Disagree About Everything Else
President Donald Trump’s second Mar-a-Lago summit with Japanese Prime Minister Shinzo Abe has been replete with memorable moments that appeared to underscore the harmonious relationship between the two leaders.
Instead of sharing a slice of chocolate cake (like he did with Chinese President Xi Jinping), Trump hit the links with Abe…

And despite their warm body language and insistence on the valuable partnership between their two nations – along with Abe’s effusive praise of Trump’s handling of the North Korea crisis – when the subject turned to trade, the responses from the two leaders became considerably more muddled.

While both leaders expressed a desire to work together on a trade, Trump stuck to his administration’s line about preferring bilateral agreements, while Abe said Japan is still urging the US to rejoin the TPP, which Trump famously pulled out of during his first week in office.
“The United States is committed to free, fair and reciprocal — very important word — trade. And we’re committed to pursuing a bilateral trade agreement that benefits both of our great countries,” Trump said during a joint press conference with Abe at the end of a two-day summit at Mar-a-Lago, the president’s Florida resort.
Abe responded by saying “I am aware of U.S. interest in a bilateral deal. But we want to approach the discussions from the point of view that the TPP is best for both of the countries,” referring to the Trans-Pacific Partnership trade deal that Trump pulled the U.S. out of in his first week in office.
Japan is the US’s fourth-largest trading partner, swapping $200 billion in goods and services annually. In 2017, the US ran a $70 billion deficit, which Trump decried as “not fair”.
As Bloomberg points out, despite their mutual amity, Abe and Trump have made what appears to be zero progress on trade…
The dispute between the two allies is fundamentally about how they see that status quo on trade. Trump is pushing for an agreement that would reduce the U.S. trade deficit with Japan, while Abe is basically seeking a return to the situation before Trump became president — with the U.S. leading TPP, and no extra tariffs on metals that Trump announced last month.
…And this fact hasn’t been lost on diplomats and others. One former ambassador even called the agreement “a little incomprehensible.”
“Was there really an agreement on a trade deal? Was it the same as an FTA? Or was it some deals in some sectors? We have to watch and see,” Ichiro Fujisaki said on Bloomberg TV. “From a Japanese point of view, just to lift tariffs on steel and aluminum, which are not huge exports from Japan, doesn’t balance out with a new trade FTA.”
To be sure, there have been some signs of progress on the trade subject – though they’ve been fairly small and remote.
The Motegi-Lighthizer discussions will be part of the current economic dialogue between the two nations. That was announced in February 2017 just after Trump came into office, and is led by Japanese Finance Minister Taro Aso and Vice President Mike Pence.
It has met twice, and while it hasn’t produced major results, it has resolved some outstanding trade issues. After the second meeting last October, restrictions on Japanese persimmons and U.S. potatoes were removed, and Japan promised to streamline some auto testing procedures.
But complicating factors abound. Probably the biggest is whether Trump even grasps the subtleties of the various paths laid out before him.
Earlier this week, Trump tweeted that “While Japan and South Korea would like us to go back into TPP, I don’t like the deal for the United States…”
Donald J. Trump
✔@realDonaldTrump
While Japan and South Korea would like us to go back into TPP, I don’t like the deal for the United States. Too many contingencies and no way to get out if it doesn’t work. Bilateral deals are far more efficient, profitable and better for OUR workers. Look how bad WTO is to U.S.
However, South Korea isn’t a part of the TPP – and it never was.
Which begs the question: Is Trump’s rhetoric about possibly returning to the TPP “if we can get a deal” just an entree toward the US’s inevitable reentry?
With China continuing to slap tariffs on US goods (most recently on imports of sorghum), the trade spat between the world’s two largest economies is still simmering. Perhaps the administration is coming around to the idea that it might be in the US’s interest to rejoin a free-trade framework that would, if nothing else, at least counter China’s expansionary interests.
end
c) REPORT ON CHINA/HONG KONG
Chinese markets have not been doing well lately. This trader reveals why: China is now going to protect intellectual property and they will manufacture on the quality basis and not on the quantity basis. Markets are still reacting to the above.
(courtesy zerohedge)
“It’s An Ominous Sign”: Trader Reveals The “Nightmare Facing China’s Leaders”
With the market’s attention focused on how the China-US trade wars impact the US stock market, many have forgotten to check in on China’s markets. And it is here that Bloomberg commentator Kyoungwha Kim notes that things are going from bad to worse, as despite the recent spate of good economic news, the local market just can’t rally on good news, an indication of the “nightmare facing China’s leaders.”
The reason: Trump may have accidentally stumbled on China’s Achilles heal:
… the Shanghai Composite has failed to track the recent bounce in the S&P 500. The selloff in Chinese stocks has deepened since Xi Jinping’s speech in Boao to open up the world’s second-largest economy, increase imports and protect intellectual property rights.
The case of ZTE being banned from buying American tech products revealed the hurdles for the “Made in China 2025” strategy that’s supposed to upgrade the economy from a manufacturer of quantity to one of technology-driven quality.
Kim’s full thoughts in the latest BBG Macro View:
Chinese Stocks’ Blues Show Nightmare Facing Leaders
It’s an ominous sign when a market can’t rally on good news. And that’s exactly what’s happened to Chinese stocks recently.
The first quarter’s strong growth has done nothing for mainland equities. Even a surprise large reduction in banks’ reserve requirement ratios only prompted an underwhelming reaction.
After moving in tandem in early 2018, the Shanghai Composite has failed to track the recent bounce in the S&P 500. The selloff in Chinese stocks has deepened since Xi Jinping’s speech in Boao to open up the world’s second-largest economy, increase imports and protect intellectual property rights.
The case of ZTE being banned from buying American tech products revealed the hurdles for the “Made in China 2025” strategy that’s supposed to upgrade the economy from a manufacturer of quantity to one of technology-driven quality.
Chinese consumption is growing but not by enough to take up the slack from dwindling exports if tech industries are going to sag while “old economy” manufacturers continue to cut investment amid ongoing supply- side reform.
Pessimism stems from a government stuck between a rock and a hard place. China can follow Japan’s example from decades ago by bolstering property investment and adopting other stimulative policies and somehow hope to avoid the latters 1990s collapse. Or, it can endure a low-growth period of reform in order to avert financial market bubbles.
The Shanghai Composite is already 13% below January’s two-year high. One has to wonder where the next buyer will come from if the government fails to convince investors that it knows the optimal path.

end
The largest ever Chinese naval drill in the Taiwan straits has everybody on edge. It is meant to show support to Russia
(courtesy zerohedge)
Largest Chinese Naval Drill “In 600 Years” Begins: Live-Fire Exercise In Taiwan Strait
Last week, the People’s Liberation Army Navy (PLAN) assembled all of its most advanced warships, aircraft, and nuclear submarines for a massive show of force in the South China Sea. We explained, how the 3-day war drill from April 10 through 13 would be held in the waters south of China’s Hainan Island.

Asia Times estimates some 10,000 People’s Liberation Army airmen, marines and sailors boarded 48 naval warships and 76 aircraft to show their loyalty and devotion to President Xi Jinping, who was greeted on a destroyer “by a resounding chorus of platitudes from soldiers.”
Exclusive: Xi Jinping reviews PLAN Drill in the South China Sea
State-run Chinese papers said the number of warships assembled “the largest of its kind in 600 years.”This is following the 14th-century fleet admiral Zheng He, whose large expeditions in Southeast Asia, South Asia, Western Asia, and East Africa — helped establish China’s power through expansion of the Maritime Silk Road during the Ming dynasty era.

Which by the way, looks similar to President Xi Jinping 21st-Century Maritime Silk Road.

Just a few days after Beijing’s historic show of force in the South China Sea. President Xi Jinping sent Taipei a clear message with warnings of ‘last-minute’ live-fire drills in the Taiwan Strait, said the South China Morning Post.
“Beijing’s first live-fire exercise in the Taiwan Strait in three years, which is expected to include the first drill appearance in the area by aircraft carrier the Liaoning, appears to be a last-minute countermove to Washington’s attempt to play the Taiwan card.”
The one-day naval drill will be conducted on Wednesday, which marks the first time the PLAN has held live-fire exercises in the strait since September 2015; also coincides with Taiwanese President Tsai Ing-wen four-day trip to Swaziland.
Song Zhongping, a military expert and TV commentator, told the South China Morning Post that Liaoning’s presence at the upcoming war drill in the Strait would send a forceful message to Taipei.
“It’s likely the Liaoning carrier strike group will take part in the Taiwan Strait drill, presenting a direct and powerful deterrence to Tsai’s administration and the island’s independence-leaning forces,” he added.
A source close to the PLAN told the South China Morning Post that the major objective of the Taiwan Strait exercise is to show Beijing’s support for Russia, which is facing a very high possibility of direct military confrontation with the United States in Syria.
“[US President] Donald Trump’s warning of military attacks on Syria forces was a bit of a surprise for Beijing and Moscow,” the person said.
“As Russia’s strategic partner, Beijing is trying to cause some well-timed and controlled trouble for the US, a drill in the Taiwan Strait being the most plausible option that will benefit both Xi and his Russian counterpart, Vladimir Putin.”
Macau-based military analyst Antony Wong Dong, agreed with the South China Morning Post’s source, by saying: “Beijing is trying to give some relief to Russia from the unfolding disputes with the US over the Syria crisis.”
However, both military analysts, proficient in Sino-US relations, maintained that the military drill was aimed directly at Taipei ahead of a visit by US national security adviser John Bolton to the American Institute in Taiwan.

Earlier this month, the Trump administration cleared various American manufacturers for business to sell submarine technology to Taiwan, which deeply angered Beijing.
“The live-fire drills would almost certainly be intended to be seen as a response to the Trump administration’s new initiatives over Taiwan,” Steve Tsang, director of the SOAS China Institute at the University of London, said.
“It is probably intended more for Taipei than Washington as the military exercise cannot intimidate the US but can get Taipei to think of the security dilemma, which is that the more Taipei seeks to secure US support, the more Beijing will do to make Taipei feel less secure.”
Ni Feng, director of the Institute of American Studies at the Chinese Academy of Social Sciences, said the parallel events of the Syrian crisis and the Taiwan Strait war drill is coincidental.
“Beijing needs to send its warning to Taipei on time if Bolton wants to visit Taipei, which will obviously be a breakthrough [in the US-Taiwan relationship],” he said.
Yun Sun, director of the China programme at the Stimson Centre in Washington, agreed with the other military analyst, stating the Trump administration is playing a dangerous game “using Taiwan as a potential bargaining chip with China.”
“With Trump’s love for transactions and linking issues together, it is conceivable that he is using Taiwan as a potential bargaining chip with China,” she said.
That move increases “the possibility of an armed conflict between the US and [mainland] China out of miscalculation; and it creates an illusion that Taiwan is up for negotiation”.
“For many policy experts, US support for Taiwan is warranted, and should be independent from political or economic deals [between Washington and Beijing].”
The threat of World War III has never been greater…
end
4. EUROPEAN AFFAIRS
We have been reporting on numbers from Germany and they all seem to be flashing the yellow sign that a recession is coming to this behemoth export nation
(courtesy Mish Shedlock/Mishtalk)
Germany Recession Indicator Flashes Yellow
Authored by Mike Shedlock via MishTalk,
The ECB will soon be in a bind as the European economy slows. Germany leads the slowdown…

Gustav Horn, one of Germany’s most-experienced business-cycle analysts, says the Possibility of German Recession Increases Noticeably. The following snips are via Goggle translation from German.
The uncertainty in the economy and especially in the financial markets, which was largely triggered by US trade policy, is having an effect: the risk of Germany falling into recession over the next three months has increased noticeably from March to April. This is signaled by the economic indicator of the Institute for Macroeconomics and Business Cycle Research (IMK) of the Hans Böckler Foundation.
For the period from April to the end of June, the early warning tool, which brings together the latest available data on the economic situation, has a median recession probability of 32.4 percent. In March, the recession risk was only 6.8 percent. The indicator, which operates according to the traffic light system, jumps from “green” to “yellow” and thus signals increased uncertainty (recession probability from 30 percent).
The IMK explains the significant increase in recession risk with a mix of three factors: the recent noticeable decline in industrial production, increased volatility on the stock markets and a deterioration in sentiment indicators.
“President Trump’s flirtation with protectionism sends out shockwaves that hit the German economy through the financial markets. Even before it is clear whether the American punitive tariffs will be extended to European goods, there is a great deal of uncertainty, “says the scientific director of the IMK, Prof. Dr. med. Gustav A. Horn.
Numerous data from the real economy and the financial sector flow into the IMK economic indicator. In addition, the instrument takes into account sentiment indicators. The IMK uses industrial production as a benchmark for a recession because it reacts faster to a slump in demand than gross domestic product (GDP). The early warning system signals a recession when industrial production shrinks by at least one percent over a five-month period.

Eurointelligence Comment
Eurointelligence,which provided the above link offers this comment:
Horn says he is not yet ready to revise down his overall optimistic forecasts for 2018 and 2019, because of continued strong domestic demand. But if the current trend in the indicator were to persist, the forecast would have to be revised downwards dramatically.
We agree with his assessment that, in this climate, it will matter whether the Europeans are able to confront Trump with a single voice (we think this is not a given), and whether the ECB will slow down its exit from non-standard policies. We think the ECB is very sensitive to these indicators, and is unlikely to raise interest rates for quite some time after the end of the QE programme. What we don’t see is a more proactive fiscal policy in Germany – for example the abandonment of the Schwarze Null fiscal target of the German government: the explicit policy goal of running a fiscal surplus even though this not required under EU or national fiscal rules.
In this context we noted a point made by Claire Jones in the FT about the output gap discussion within the ECB’s governing council. She quotes from a recent speech by Benoît Coeuré, who argued that a slower-than-expected fall in the eurozone’s potential growth rate would imply that the neutral interest rate is higher. That idea would suggest that the ECB has more scope to raise interest rates before triggering monetary tightening. If Horn’s indicators are right that view would be refuted, because Horn suggests that Germany and the eurozone are reverting to the previous sluggish levels of economic growth. This debate is clearly not settled yet, but we are not yet ready to buy into the argument of a improvement in long-term structural growth rates for the eurozone.
Europe’s Slowing Economy Poses Challenge for ECB
The Wall Street Journal reports Europe’s Slowing Economy Poses Challenge for ECB.
The latest, unexpected sign of weakness came from Germany, Europe’s exporting powerhouse. Figures released by the country’s economics ministry recorded a 1.6% drop in industrial output in February compared with January. That was a big surprise, since economists surveyed last week by The Wall Street Journal were expecting an increase of 0.3%.
That was far from the only disappointment this year. The signs of unanticipated frailty in the region have included a drop in the overall Purchasing Managers Index, which tracks activity in the manufacturing and services sectors, as well as a drop in retail sales. Measures of confidence among consumers and businesses have also been declining.
Some of the weakness reflects temporary factors that shouldn’t act as a drag on growth in the months to come. A spell of unusually cold weather across Europe has been a hindrance to activity.
In Germany, strikes by the powerful IG Metall labor union—which represents metal and electrical workers—lowered industrial output in February, but concluded in a pay deal and further disruption is unlikely.
However, the surveys of purchasing managers point to a more durable problem: Businesses are experiencing shortages of some inputs and workers with particular skills, which suggests the eurozone economy can’t grow this fast for long.
The surprising strength of the eurozone’s recovery in 2017 was largely because of what was happening outside, rather than inside, the currency area. Across the globe, a synchronized acceleration in investment spending helped boost trade flows, and European industry in particular.
ECB officials are arguing publicly over how quickly to phase out crisis-era stimulus measures.
One group of officials, centered around Mr. Draghi and chief economist Peter Praet, don’t want to tighten monetary policy too fast, warning that eurozone inflation remains too weak at 1.4%. In a speech last month, Mr. Draghi highlighted several risks to the region’s economy that could further soften inflation, including a possible global trade war, and a stronger euro exchange rate.
Assessing the Economy
Is it a combination of cold weather and strikes or something more serious?
Signs point to the latter. It’s not just Germany. The reset of the Eurozone is weak as well. In the US, GDP estimates are down to two percent and generally falling.
The whole global economy is slowing.
All of which may help explain the fact that the spread between US 2Y Yields (driven by a data-independent, hike-at-all-costs-coz-we-need-the-ammo Fed) and German 2Y Yields (ECB suppression and a slowing economy) is at 300bps… the largest in history…

end
Bill Blain talks about his fears on the markets this morning
(courtesy Bill Blain/Mint Partners)
Blain: “More And More Folk Muttering Darkly About ‘Late Cycle’ Drift”
Submitted by Bill Blain of Mint Partners
“Late Cycle”, thin markets and boom to bust fears stifle activity
“Well, I’ve been foolish too many times, now I’m determined, I’m gonna get it right…..”
What’s going on in markets? A glance at price charts highlights the recent upside. But, if there is a theme to the market this morning, I’d say they are looking tired and unconvinced. Why? Phrase of the day is “Late Cycle”.
Take a look at the market numbers and ask if they really are “reasons to be cheerful?” The 10-year bond remains range bound at 2.85%, stock markets look top and tailed (with a worrying number of people who should know better saying daft things like: “its my strongest ever conviction trade – buy stocks”), and oil prices remain strong at $70.
The current upside drift in markets is being fuelled by short-term positivity.
- Geopolitics look sound: Nothing to worry. Korea is going to be solved – might even reap a peace dividend. The Russians have not kicked off after the Syria strikes. The prospects for negotiation on trade with China are looking stronger. Apparently.
- Policy is looking strong: US tax cuts are positively impacting Q1 reporting results and therefore sentiment. European inflation is edging up – to the extent where QE is threatened. China has embarked on a massive liquidity into its economy to oil the financial sector.
- Markets are buoyed by a massive wave of investment cash looking to play: hence much of the stock upside thinking.
However, the actual price action in stock markets doesn’t look convincing, and the volumes don’t look like a buying binge. More like covering positions. It feels like we’re still waiting for something to develop. In credit markets we’re still seeing a flood of supply, but there are clear concerns about liquidity traps in BBB credit, and the likelihood of a faster pace of US rate rises.
The flattening US yield curve is glossed over by the Global Macro Alignment prognosticators, but the 2-10yr curve flattening from 80 to 40 is a cause for concern. Inverted curves are never positive and scream recession. The trick is working out how much enforced duration buying by global investors of the 10-yr is making that cosmetic metric look worse than it should be.. ie: if you are a global investor what else can you do except by the long-end of the Treasury market? (Why? Because…)
You have to wonder where this is heading. Volumes, flat curves, slowing numbers look to be dark hints, portents, signs and shadows of recession lurking in the shadows. “Winter is Coming” say the analysts… More and more folk muttering darkly about “late cycle” drift… Recent lacklustre UK numbers, the unfounded worries about flattening curves, the concerns about 10-years of post-crisis financial exhaustion, economists wondering if entrepreneurs have forgotten how to entrep after so long a period of costless money and the simplicity of buying back their own shares.
At some point all booms bust, but when? When does labour tightness stall the economy (and what changed)? Where is inflation? Are corporates holding back CapEx because they forsee a slowdown? What to spend their tax-windfalls on – stock buybacks? Yeah, simple…
I might introduce a new market mantra: “Things are never as bad the might be”, but equally; “they are never as good as you hope.”
The reality is global fundamentals, trade growth and new trade initiatives could probably keep the rally going a while longer.. but when folk start to worry.. what’s to stop them?
Continuing the theme of not quite as great as you think it is… it looks to be a great time to be a US investment bank as Morgan Stanley posts stunning Q1 numbers, while Goldman also looked to have done well – but didn’t. Strip out the noise: The FT clinically dissects the Squid’s recent growth.
MS’s gains looked market driven, which we all know could switch off equally quickly. The imposition of tougher US stress tests, and continuing the returns in volatile markets will remain a big ask.
Meanwhile, its not such a great time for Deutsche Bank where the regulator has asked it to file a capital contingency plan for a quietus of its investment banking operation, while the night of the long knifes continues for senior staff associated with former CEO Cryan. Market banking remains as tough as ever, and isn’t getting any easier.
However, full marks to Barclays tech analysts who produced an 89 page research report on Tesla explaining their doubts on the name. At 89 pages they remarked “while it’s a bit skimpy for our European readers; “we recognise many US investors, and especially those on the tech side, need a twitter-length summary”. Barclay’s provided a series of tweets which boiled down to: the established car makers eating Tesla’s lunch, the failure of Tesla’s automation programme, rising production costs as a third shift is introduced, and advice to re-rate the Auto-dinosaurs.
WWSNBD? Swiss Franc Erases 2015 Re-Valuation
What Will The Swiss National Bank Do?
Earlier in April, SNB President Thomas Jordan said financial markets remain in a “fragile” state and the central bank didn’t want to “provoke” an appreciation in the franc by changing its monetary policy.
EURCHF just traded above 1.20 for the first time since the SNB shocked markets in January 2015 with its decision to remove the cap on the currency.
There has been no sign of SNB intervention this month: traders

So much for ‘safe-haven’ flows?
Latest flows driven by leveraged and inter-bank demand on the back of monetary policy projections and U.S. sanctions against Russia, which are seen hurting some Swiss companies where Russian names hold exposure, two traders in London and Europe tell Bloomberg.
The Franc has lagged behind its haven peer, the Japanese yen, in recent times of market turmoil…

Are Washington sanctions driving Swiss Franc outflows?
Are Russian oligarchs selling swissy and buying bitcoin?

The timing of the moves are certainly coincidental.
end
5. RUSSIAN AND MIDDLE EASTERN AFFAIRS
Containers of chlorine manufactured in Germany was found along with smoke grenades from the UK. These were stored in rebel areas
(courtesy zerohedge)
Containers With Chlorine From Germany, Smoke Grenades From UK Found In Syria’s Ghouta: Russia
Russian Foreign Ministry spokeswoman Maria Zakharova stated during a Thursday press conference that containers filled with chlorine from Germany and smoke bombs manufactured in the United Kingdom city of Salisbury were found in the East Ghouta region of Damascus, the location of the alleged chemical attack by Assad which resulted in the launch of 105 Tomahawks on 3 Syrian targets by US, UK and French forces last Friday.

“In the liberated areas of Eastern Ghouta, Syrian government troops have found containers with chlorine – the most horrible kind of chemical weapons – from Germany, and also smoke grenades produced – please pay attention to this – in the city of Salisbury, the UK,” Zakharova told a news conference in Moscow on Thursday.
The findings undermine “the faith in humaneness” of some states’ leadership, who “give such orders and make such decisions,” Zakharova added. No further details were released regarding this finding.
Of course, western leaders’ have alleged, if without demonstrating proof, that the Syrian government was behind the Douma attack based on “open sources”, YouTube video clips and other information on social media, including the reports of the so-called civil defense group, the White Helmets. The group is believed to be linked to militants and operates in the areas under their control.
Last week’s airstrike occurred just ahead of the arrival of an Organization for Prohibition of Chemical Weapons (OPCW) fact-finding mission tasked with establishing whether any chemical attack had taken place. The team of chemical-watchdog experts still can’t reach the site of the purported attack, as militants have hampered their work, according to Russian Deputy Foreign Minister Mikhail Bogdanov.
6 .GLOBAL ISSUES
Venezuelan Oil Enters The Disaster Zone
Authored by Nick Cunningham via OilPrice.com,
The decline of Venezuela’s oil production for the foreseeable future has been assumed, and to a large extent, already priced into the market. However, an acceleration in the rate of decline is possible, and a few recent developments raise the odds that such a disaster will become a reality.

Reuters reported that state-owned PDVSA is completely falling apart, with workers walking off the job at a frightening pace. The conditions for oil workers has deteriorated for years, with shortages of food, unsafe working conditions, and hyperinflation utterly hollowing out the value of paychecks.
Since last year, however, things have grown worse. Venezuela President Nicolas Maduro sacked the head of PDVSA and handed over control to the military in order to keep the armed forces on his side. But Major General Manuel Quevedo has only accelerated the decline of PDVSA, which once held a reputation as one of the better managed state-owned oil companies in the world.
Reuters reports that about 25,000 workers have quit PDVSA between January 2017 and January 2018, a staggering sum. PDVSA employs roughly 146,000 people. Thousands of workers are walking off of job sites, fed up with going to work hungry, putting their lives at risk at rickety refineries, all for a paycheck that fails to cover even the most basic expenses.
The worker exodus has grown so bad that the company has in some cases refused to process resignations. Those higher up are no less unhappy. Reuters says that General Quevedo “quickly alienated the firm’s embattled upper echelon and its rank-and-file.”
The loss of both top level engineers and managers as well as workers on the ground ensure the oil production losses will continue. Reuters reports that some rigs in the Orinoco Belt, where PDVSA produces heavy oil, are only operating “intermittently for lack of crews.”
Moreover, the situation at the company’s refineries are arguably worse. Fires are breaking out because they are falling apart and they no longer even have the staff to run them properly. Even ports are reducing operations because of a lack of workers.
But the problems don’t stop there. PDVSA only accounts for about half of the nation’s oil production on its own. The rest comes from joint ventures with international oil companies. Production at the joint ventures has eroded at a much slower pace than operations run solely by PDVSA.
Yet, the Venezuelan government is in danger of sparking steeper losses from joint venture operations. On Tuesday, Chevron said that two of its workers were arrested in Venezuela. Chevron has not fled the country even as its peers have packed up and departed, but the detainment of the oil company’s workers could very well lead the oil major into rethinking its operations. “Chevron has been one of the more steadfast participants in Venezuela, having stuck around through some of the most challenging times over the past two years,” Mara Roberts Duque, a BMI Research analyst, told Bloomberg. “These arrests will likely encourage them to turn away from Venezuela in a more definitive manner.”
Reuters says that Venezuelan intelligence “burst into the Petropiar joint venture’s office” and arrested two workers. The arrests appear to be the first to directly hit an international company operating in the country.
“Oil industry companies would do well to be cautious and stop assuming that good relations with PDVSA can last forever due to a common interest in pumping oil,” Raul Gallegos, associate director with the consultancy Control Risks, and author of Crude Nation, a book about how oil ruined the Venezuelan economy, said in an interview with Reuters.
“The level of corruption in PDVSA, especially under a military administration, can and will trump production logic.”
It isn’t necessarily that the few remaining international oil companies in Venezuela will immediately withdraw their personnel. But at some point the costs of operating become too high. Companies like Chevron and others have long been frustrated with lack of payment. Reuters reports that they are now also increasingly aggravated by PDVSA’s chief Miguel Quevedo, who refused to enact reforms to stop the decimation of the country’s oil and refining facilities.
Ultimately, President Maduro’s grip on the nation will become increasingly shaky. Utterly dependent on oil exports for revenues, the resources available to Maduro are vanishing.
8. EMERGING MARKET
end
Your early morning currency/gold and silver pricing/Asian and European bourse movements/ and interest rate settings THURSDAY morning 7:00 am
Euro/USA 1.2371 DOWN .0006/ REACTING TO MERKEL’S FAILED COALITION/ SPAIN VS CATALONIA/REACTING TO +GERMAN ELECTION WHERE ALT RIGHT PARTY ENTERS THE BUNDESTAG/ huge Deutsche bank problems + USA election:/TRUMP HEALTH CARE DEFEAT//ITALIAN REFERENDUM DEFEAT/AND NOW ECB TAPERING BOND PURCHASES/JAPAN TAPERING BOND PURCHASES /USA FALLING INTEREST RATES AGAIN/HOUSTON FLOODING/EUROPE BOURSES ALL MIXED
USA/JAPAN YEN 107.41 UP 0.059 (Abe’s new negative interest rate (NIRP), a total DISASTER/SIGNALS U TURN WITH INCREASED NEGATIVITY IN NIRP/JAPAN OUT OF WEAPONS TO FIGHT ECONOMIC DISASTER/DEADLY UNWINDING OF YEN CARRY TRADE
GBP/USA 1.4215 UP .0031 (Brexit March 29/ 2017/ARTICLE 50 SIGNED/BREXIT FEES WILL BE CAPPED
USA/CAN 1.2607 DOWN .0020 (CANADA WORRIED ABOUT TRADE WITH THE USA WITH TRUMP ELECTION/ITALIAN EXIT AND GREXIT FROM EU/(TRUMP INITIATES LUMBER TARIFFS ON CANADA/CANADA HAS A HUGE HOUSEHOLD DEBT/GDP PROBLEM)
Early THIS THURSDAY morning in Europe, the Euro FELL by 6 basis points, trading now ABOVE the important 1.08 level RISING to 1.2384; / Last night Shanghai composite CLOSED UP 25.98 POINTS OR 0.84% / Hang Sang CLOSED UP 424,19 POINTS OR 1.40% /AUSTRALIA CLOSED UP .34% / EUROPEAN BOURSES OPENED MIXED
The NIKKEI: this THURSDAY morning CLOSED UP 32.98 POINTS OR 0.15%
Trading from Europe and Asia
1/EUROPE OPENED MIXED
2/ CHINESE BOURSES / : Hang Sang CLOSED UP 424.19 POINTS OR 1.40% / SHANGHAI CLOSED UP 25.98 POINTS OR 0.84% /
Australia BOURSE CLOSED UP .34%
Nikkei (Japan) CLOSED UP 32.98 POINTS OR 0.15%
INDIA’S SENSEX IN THE GREEN
Gold very early morning trading: 1348.00
silver:$17.21
Early THURSDAY morning USA 10 year bond yield: 2.8913% !!! UP 2 IN POINTS from WEDNESDAY night in basis points and it is trading WELL ABOVE resistance at 2.27-2.32%. (POLICY FED ERROR)/
The 30 yr bond yield 3.0852 UP 2 IN BASIS POINTS from WEDNESDAY night. (POLICY FED ERROR)/
USA dollar index early THURSDAY morning: 89.65 UP 2 CENT(S) from WEDNESDAY’s close.
This ends early morning numbers THURSDAY MORNING
xxxxxxxxxxxxxxxxxxxxxxxxxxxxxxxxxxxxxxxxxxxxxxxxxxxxxxxxxxxxxxxxxxxxxxxxxxxxxxxxxxxxxxxxxxxxxxxxxxxxxxxxxxxxxxx
And now your closing THURSDAY NUMBERS \1: 00 PM
Portuguese 10 year bond yield: 1.656% UP 5 in basis point(s) yield from WEDNESDAY/
JAPANESE BOND YIELD: +.0.043% DOWN 1/2 in basis points yield from WEDNESDAY/JAPAN losing control of its yield curve/
SPANISH 10 YR BOND YIELD: 1.284% UP 7 IN basis point yield from WEDNESDAY/
ITALIAN 10 YR BOND YIELD: 1.781 UP 7 POINTS in basis point yield from WEDNESDAY/
the Italian 10 yr bond yield is trading 50 points HIGHER than Spain.
GERMAN 10 YR BOND YIELD:RISES TO +.600% IN BASIS POINTS ON THE DAY
END
xxxxxxxxxxxxxxxxxxxxxxxxxxxxxxxxxxxxxxxxxxxxxxxxxxxxxxxxxxxxxxxxxxxxxxxxxxxxxxxxxxxxxxxxxxxxxxxxxxxxxxxxxxxxxxxxxxxxxxxxxxxxxxxxxxxxx
IMPORTANT CURRENCY CLOSES FOR THURSDAY
Closing currency crosses for THURSDAY night/USA DOLLAR INDEX/USA 10 YR BOND YIELD/1:00 PM
Euro/USA 1.2361 DOWN .0042 (Euro DOWN 42 Basis points/ represents to DRAGHI A COMPLETE POLICY FAILURE/
USA/Japan: 107.39 UP 0.033 Yen DOWN 3 basis points/
Great Britain/USA 1.4189 DOWN .0011( POUND DOWN 11 BASIS POINTS)
USA/Canada 1.2644 UP .0017 Canadian dollar DOWN 17 Basis points AS OIL ROSE TO $68.93
xxxxxxxxxxxxxxxxxxxxxxxxxxxxxxxxxxxxxxxxxxxxxxxxxxxxxxxxxxxxxxxxxxxxxxxxxxxxxxxx
This afternoon, the Euro was DOWN 42 to trade at 1.2361
The Yen FELL to 107.39 for a LOSS of 3 Basis points as NIRP is STILL a big failure for the Japanese central bank/HELICOPTER MONEY IS NOW DELAYED/BANK OF JAPAN NOW WORRIED AS AS THEY ARE RUNNING OUT OF BONDS TO BUY AS BOND YIELDS RISE
The POUND FELL BY 11 basis points, trading at 1.4189/
The Canadian dollar FELL by 17 basis points to 1.2644/ WITH WTI OIL RISING TO : $68.93
The USA/Yuan closed AT 6.2791
the 10 yr Japanese bond yield closed at +.043% UP 1/2 IN BASIS POINTS / yield/
Your closing 10 yr USA bond yield UP 10 IN basis points from WEDNESDAY at 2.9228% //trading well ABOVE the resistance level of 2.27-2.32%) very problematic USA 30 yr bond yield: 3.113 UP 11 in basis points on the day /
THE RISE IN BOTH THE 10 YR AND THE 30 YR ARE VERY PROBLEMATIC FOR VALUATIONS
Your closing USA dollar index,89.82 UP 19 CENT(S) ON THE DAY/1.00 PM/
Your closing bourses for Europe and the Dow along with the USA dollar index closing and interest rates for THURSDAY: 1:00 PM EST
London: CLOSED UP 11.58 POINTS OR 0.16%
German Dax :CLOSED DOWN 3.41 POINTS OR 0.19%
Paris Cac CLOSED UP 11.47 POINTS OR 0.21%
Spain IBEX CLOSED UP 10.70 POINTS OR 0.11%
Italian MIB: CLOSED UP 32.16 POINTS OR 0.14%
The Dow closed DOWN 83.18 POINTS OR 0.34%
NASDAQ closed DOWN 157.18 Points OR 0.78% 4.00 PM EST
WTI Oil price; 68.93 1:00 pm;
Brent Oil: 74.19 1:00 EST
USA /RUSSIAN ROUBLE CROSS: 60.96 UP 9/100 ROUBLES/DOLLAR (ROUBLE LOWER BY 9 BASIS PTS)
TODAY THE GERMAN YIELD RISES TO +.600% FOR THE 10 YR BOND 1.00 PM EST EST
END
This ends the stock indices, oil price, currency crosses and interest rate closes for today 4:30 PM
Closing Price for Oil, 4:30 pm/and 10 year USA interest rate:
WTI CRUDE OIL PRICE 4:30 PM:$68.21
BRENT: $73.64
USA 10 YR BOND YIELD: 2.9117% THIS RAPID DECENT IN YIELD IS ALSO VERY DANGEROUS/RECESSION COMING
USA 30 YR BOND YIELD: 3.1023%/
EURO/USA DOLLAR CROSS: 1.2349 DOWN .0029 (DOWN 29 BASIS POINTS)
USA/JAPANESE YEN:107.36 UP 0.0090/ YEN UP 1 BASIS POINTS/ very dangerous as yen carry traders are getting killed/yen continues to rise despite the NYSE rising. however gold is now breaking away from yen influence.
USA DOLLAR INDEX: 89.85 UP 23 cent(s)/dangerous as the lower the dollar the higher the inflation.
The British pound at 5 pm: Great Britain Pound/USA: 1.40884: DOWN 0.01133 (FROM LAST NIGHT DOWN 113 POINTS)
Canadian dollar: 1.2657 DOWN 30 BASIS pts
German 10 yr bond yield at 5 pm: +0.600%
VOLATILITY INDEX: 16.67 CLOSED UP 1.07
LIBOR 3 MONTH DURATION: 2.3587% ..LIBOR HAS INCREASED FOR 50 CONSECUTIVE DAYS.
And now your more important USA stories which will influence the price of gold/silver
TRADING IN GRAPH FORM FOR THE DAY
GOP Chairman To Subpoena DOJ Over Comey Memos
While a criminal referral has been sent to the DOJ for James Comey, Hillary Clinton and others involved in the 2016 US presidential election, House Judiciary Committee Chairman Bob Goodlatte (R-VA) is expected to subpoena the Department of Justice (DOJ) as early as this week in order to obtain copies of James Comey’s memos – a major catalyst in the appointment of Robert Mueller as special counsel.

Chairman Goodlatte wants lawmakers to be able to review the seven memos Comey created allegedly documenting his interactions with President Trump, according to two people familiar with the matter in comments to The Hill.
The chairman on Wednesday notified the ranking Democrat, Rep. Jerrold Nadler (N.Y.), that a subpoena is forthcoming. Under Judiciary committee rules, the chairman must consult the ranking member two business days “before issuing any subpoena” — suggesting that the move is imminent.
The order comes after Deputy Attorney General Rod Rosenstein asked three powerful House lawmakers — Goodlatte, Oversight and Government Reform Committee Chairman Trey Gowdy (R-S.C.) and Intelligence Committee Chairman Devin Nunes (R-Calif.) — to give him extra time to consult with the “relevant parties” on whether he can make the memos available to them.
On Monday, Deputy Attorney General Rod Rosenstein told lawmakers that the Comey memos may be related to an “ongoing investigation,” as well as “report confidential presidential communications,” which means they have a “legal duty to evaluate the consequences of providing access to them.”
In other words, Rosenstein is stalling…
Rep. Nadler said in a statement that he welcomes the opportunity to take a look at the memos, though described the GOP’s imminent subpoena as political “theater” which may interfere or undermine Mueller’s probe.
“The Comey memos are key to the Special Counsel’s work. Pursuant to long-standing Department policy and absent any satisfactory accommodation, the Department of Justice cannot simply hand over evidence that is part of an ongoing criminal investigation,” Nadler said.
“If House Republicans refuse any accommodation short of the Department of Justice handing over custody of these documents —which it cannot do — I fear the Majority will have manufactured an excuse to hold the Deputy Attorney General in contempt of Congress. If they succeed in tarnishing the Deputy Attorney General, perhaps they will have given President Trump the pretext he has sought to replace Mr. Rosenstein with someone willing to do his bidding and end the Special Counsel’s investigation,” he added.
In other words, Nadler is stalling too…
In a Monday response from Rosenstein, the Deputy AG referenced a 77-year-old opinion of Attorney General Robert Jackson who wrote “all investigative reports are confidential documents of the executive department and that congressional and public access thereto would not be in the public interest,” while pointing to a long list of his predecessors who agreed.
“Investigative reports include leads and suspicions, and sometimes even the statements of malicious or misinformed people. Even though later and more complete reports exonerate the individuals, the use of particular or selected reports might constitute the grossest injustice, and we all know that a correction never catches up with an accusation,” Jackson argued at the time.
Rosenstein is really working hard to prevent the release of the Comey memos – which Comey leaked to the New York Times through friend and Columbia Law Professor, Daniel Richman.

Why is the Deputy Attorney General of the United States trying to delay Congress from seeing a pivotal document in the decision to launch a special counsel investigation on a sitting president?
end
My goodness!! that did not last long. The Dept of Justice caves and will hand over the 7 memos and now we will get to see why Rosenstein needed a special prosecutor who became Mueller
(courtesy zerohedge)
DOJ Caves, Will Hand Over Comey Memos Later Today
Faced with the threat of a subpoena, the Department of Justice (DOJ) is reportedly ready to hand over copies of former FBI Director James Comey’s memos detailing his interactions with President Trump, reports Bloomberg as well as CNN Justice Reporter Laura Jarrett.
Jake Tapper
✔@jaketapper
The Justice Department is expected to make the @Comey memos available to Congress later today, a source with knowledge of the matter tells @LauraAJarrett
The memos – leaked to the New York Times through Comey pal and Columbia Law professor Daniel Richman, were a major catalyst in Deputy Attorney General Rod Rosenstein’s decision to appoint former FBI Director Robert Mueller as special counsel to investigate Russian interference in the 2016 US election.

As reported Wednesday by The Hill, House Judiciary Committee Chairman Bob Goodlatte (R-VA) was expected to subpoena the Department of Justice as early as this week in order to obtain copies of seven memos Comey created.
The chairman on Wednesday notified the ranking Democrat, Rep. Jerrold Nadler (N.Y.), that a subpoena is forthcoming. Under Judiciary committee rules, the chairman must consult the ranking member two business days “before issuing any subpoena” — suggesting that the move is imminent.
The order comes after Deputy Attorney General Rod Rosenstein asked three powerful House lawmakers — Goodlatte, Oversight and Government Reform Committee Chairman Trey Gowdy (R-S.C.) and Intelligence Committee Chairman Devin Nunes (R-Calif.) — to give him extra time to consult with the “relevant parties” on whether he can make the memos available to them. –The Hill
Deputy Attorney General Rod Rosenstein seemingly began to stall on the requested document delivery – telling lawmakers on Monday that the Comey memos may be related to an “ongoing investigation,” and that they may “report confidential presidential communications,” meaning that Congressional investigators have a “legal duty to evaluate the consequences of providing access to them.”
Ranking Democrat Rep. Jerrold Nadler (NY) backed Rosenstein’s pushback earlier in the week, calling the GOP’s imminent subpoena as political “theater” which may interfere with Mueller’s investigation.
“The Comey memos are key to the Special Counsel’s work. Pursuant to long-standing Department policy and absent any satisfactory accommodation, the Department of Justice cannot simply hand over evidence that is part of an ongoing criminal investigation,” Nadler said.
“If House Republicans refuse any accommodation short of the Department of Justice handing over custody of these documents —which it cannot do — I fear the Majority will have manufactured an excuse to hold the Deputy Attorney General in contempt of Congress. If they succeed in tarnishing the Deputy Attorney General, perhaps they will have given President Trump the pretext he has sought to replace Mr. Rosenstein with someone willing to do his bidding and end the Special Counsel’s investigation,” he added.
In a Monday response from Rosenstein, the Deputy AG referenced a 77-year-old opinion of Attorney General Robert Jackson who wrote “all investigative reports are confidential documents of the executive department and that congressional and public access thereto would not be in the public interest,” while pointing to a long list of his predecessors who agreed.
“Investigative reports include leads and suspicions, and sometimes even the statements of malicious or misinformed people. Even though later and more complete reports exonerate the individuals, the use of particular or selected reports might constitute the grossest injustice, and we all know that a correction never catches up with an accusation,” Jackson argued at the time.
Arthur Schwartz
✔@ArthurSchwartz
Hey @Comey. Just heard that DOJ is ready to send your memos to congress. Perfect timing with the book tour — you can’t hide from the press.
end
Rosenstein tells Trump that he is not a target of Mueller’s probe. I highly doubt that…Rosenstein is lying
(courtesy zerohedge)
Rosenstein Told Trump He Is Not The Target Of Mueller’s Probe
According to a Bloomberg headline which instantly sent the Dow Jones 100 points higher from intraday lows, Deputy Attorney General Rod Rosenstein told President Donald Trump last week that he isn’t the target of any part of Special Counsel Robert Mueller’s investigation.
- ROSENSTEIN SAID TO TELL TRUMP HE’S NOT TARGET OF MUELLER PROBE
As Bloomberg adds, Rosenstein, who brought up the Mueller probe himself, “offered the assurance during a meeting with Trump at the White House last Thursday,” a development that helped tamp down the president’s desire to remove Rosenstein or Mueller, and probably explains why Trump hasn’t gone postal yet following the raid last week of his personal attorney Michael Cohen.
After the Rosenstein meeting, Trump told some of his closest advisers that it’s not the right time to remove either man since he’s not a target of the probe. One person said Trump doesn’t want to take any action that would drag out the investigation.
The news also helped send risk assets sharply higher as it would suggest the risk of impeachment – if the Bloomberg report is accurate – is far lower.

The report confirms what Comey told Trump all along: recall that back in March 2017, former FBI director Comey told Trump in private he wasn’t a target in the FBI’s investigation of Russian meddling in the 2016 election. Comey wrote in his new book, “A Higher Loyalty,” that Trump repeatedly asked him to help lift “the cloud” hanging over him by publicly announcing he wasn’t under investigation.
As is well-known by now, Comey also refused to make a public announcement, writing that “the FBI and Department of Justice had been reluctant to make public statements that we did not have an open case on President Trump for a number of reasons, most important that it would create a duty to correct that statement should that status change.”
* * *
If the Bloomberg report is true, it begs the question: so who is the target of Mueller’s probe?
And, parallel to that, many have also asked just what is the point of Mueller’s ongoing probe, which continues to cost taxpayers millions of dollars, a year and a half after Hillary Clinton’s humiliating loss in the presidential election.
To be sure, there is the distinct possibility that either Trump misunderstood what Rosenstein told him, or the Deputy AG simply lied. To be sure, far more bizarre events have taken place in the US in the past 18 months.
Truthful or not, however, the alleged shift gives breathing room for Mueller, as well as Rosenstein, who has been criticized strongly by House Republicans for being slow to comply with requests for classified documents. Last week’s meeting was set up in part to allow Rosenstein to assuage Trump’s frustration with his decisions.
Of course, there is the loophole that, as Bloomberg points out, Rosenstein’s message may have been based on a technicality, and while Trump may not officially be a target now, Mueller hasn’t ruled out making him one at some point in the future, according to a U.S. official with knowledge of the unfolding investigation.
During a Wedensday press conference, Trump – who still hasn’t ruled out removing Rosenstein and Mueller at some point – signaled his shift in approach responding to a reporter’s question about their fate by saying they are “still here.”
“They’ve been saying I’m going to get rid of them for the last three months, four months, five months,” Trump said at his Mar-a-Lago resort in Palm Beach, Florida. “And they’re still here. We want to get the investigation over with, done with, put it behind us. And we have to get back to business.”

ABC News Politics
✔@ABCPolitics
Pres. Trump on firing Robert Mueller or Rod Rosenstein: “They’ve been saying I’m going to get rid of them for the last three months, four months, five months—and they’re still here.” https://abcn.ws/2EZF5pv
In some ways this news, if true, would be anticlimatic and somewhat disappointing for a daily narrative that has led to so much outrage on both sides of the political aisle since the fall of 2016. Which is why we are confident that this is hardly the full story, and “something” will emerge in the coming weeks or days that – surprise – makes Trump the target of the probe.
And judging by the stock market’s lack of enthusiasm to rise more on the news – the S&P is already fading much of the move – we are not the only ones who think so.
END
TRUMP EYEING GIULIANI TO JOIN IS LEGAL TEAM
(courtesy zerohedge)
Rudy Giuliani Said To Be In Talks To Join Trump Legal Team
Just minutes before the closing bell, the Daily Beast reported that former New York City Mayor Rudy Giulianihas been in talks to join President Trump’s legal team, adding further speculation about a major shake up in Trump’s legal team which has been in limbo ever since the DOJ’s raid of Michael Cohen.
Trump’s legal team has also been suffering from a shortage of manpower since the resignation of lead attorney John Dowd. Trump had hoped to hire Joe diGenova and his wife, Victoria Toensing, but the two were forced to bow out because of a conflict. Trump’s personal attorney, Michael Cohen, is of course embroiled in a legal fiasco of his own.

Giuliani joining Trump’s team would go a long way toward alleviating a staffing shortage, as well as providing Trump with a person he trusts. The former mayor has been involved in several high-profile cases since the end of his political career, including representing Turkish gold trader Reza Zarrab. However, the former NYC mayor was reportedly disappointed that he was passed over for Secretary of State.
There were also rumors that Giuliani would be tapped to replace James Comey after the former FBI director was fired by Trump.
Giuliani has been a staunch ally of Trump’s since almost the beginning of Trump’s campaign. Back in November, 2016, he appeared on Fox News to harshly criticize Comey’s handling of the Clinton probe. He also gave a widely lauded speech at the Republican Convention before Trump accepted the nomination.
Meanwhile, facing a legal crackdown (or perhaps not), the Daily Beast adds that Trump has been too distracted with pressing foreign policy concerns from North Korea to Syria to focus on repopulating his legal team.
The “Beast” report followed another breaking news report from Bloomberg according to which Deputy AG Rod Rosenstein told the president that he isn’t currently a target of the Mueller probe – a report that briefly sent the Dow 100 points higher.
DOJ Inspector General Refers McCabe For Criminal Charges
Following yesterday’s criminal referral issued to former FBI Deputy Director Andrew McCabe, his ex-boss James Comey and several other individuals, alleging malfeasance during the 2016 US election, the Washington Post reports that McCabe was referred to the U.S. Attorney’s Office by the Department of Justice’s internal watchdog.

While CNN suggests that the criminal referral was recently issued, citing a “source familiar with the matter” – the Washington Post says it occurred “some time ago.”
The referral to the D.C. U.S. Attorney’s Office occurred some time ago, after the inspector general concluded McCabe had lied to investigators or his own boss, then-FBI Director James B. Comey, on four occasions, three of them under oath. –WaPo
It is unknown how the D.C. U.S. Attorney’s office has responded to the referral – including whether prosecutors have launched a separate investigation, as a criminal referral does not obligate officials to take action.
The DOJ, D.C. U.S. Attorney’s Office and a spokeswoman for McCabe declined to comment Thursday.
DOJ Inspector General Michael Horowitz released a report last week, accusing former FBI Deputy Director Andrew McCabe of repeatedly misleading investigators.
McCabe was fired on March 16 after the OIG found that he “had made an unauthorized disclosure to the news media and lacked candor – including under oath – on multiple occasions.”
Specifically, McCabe was fired when it was uncovered that he authorized an F.B.I. spokesman and attorney to tell Devlin Barrett of the Wall St. Journal, just days before the 2016 election, that the FBI had not put the brakes on a separate investigation into the Clinton Foundation – at a time in which McCabe was coming under fire for his wife taking a $467,500 campaign contribution from Clinton proxy pal, Terry McAuliffe.
The WSJ article in question reads:
New details show that senior law-enforcement officials repeatedly voiced skepticism of the strength of the evidence in a bureau investigation of the Clinton Foundation, sought to condense what was at times a sprawling cross-country effort, and, according to some people familiar with the matter, told agents to limit their pursuit of the case. The probe of the foundation began more than a year ago to determine whether financial crimes or influence peddling occurred related to the charity.
…
Some investigators grew frustrated, viewing FBI leadership as uninterested in probing the charity, these people said. Others involved disagreed sharply, defending FBI bosses and saying Mr. McCabe in particular was caught between an increasingly acrimonious fight for control between the Justice Department and FBI agents pursuing the Clinton Foundation case.
So McCabe was found to have leaked information to the WSJ in order to combat rumors that Clinton had indirectly bribed him to back off the Clinton Foundation investigation, and then lied about it four times to the DOJ and FBI, including twice under oath.

Sean Davis
✔@seanmdav
According to the just-released DOJ OIG report on Andrew McCabe, McCabe lied to the FBI director, lied to FBI agents under oath, and lied twice to DOJ OIG investigators under oath. https://static01.nyt.com/files/2018/us/politics/20180413a-doj-oig-mccabe-report.pdf …

As we reported yesterday, a massive battle is brewing between former FBI Director James Comey, and his deputy Andy McCabe over exactly who is lying about Comey knowing that McCabe had been leaking self-serving information to the Wall Street Journal.
Comey stopped by ABC’s The View to peddle his new book, A Higher Royalty Loyalty, where he called his former Deputy Andrew McCabe a liar, and admitted that he “ordered the report” which found McCabe guilty of leaking to the press and then lying under oath about it, several times.
Comey was asked by host Megan McCain how he thought the public was supposed to have “confidence” in the FBI amid revelations that McCabe lied about the leak.
“It’s not okay. The McCabe case illustrates what an organization committed to the truth looks like,” Comey said. “I ordered that investigation.”
Comey then appeared to try and frame McCabe as a “good person” despite all the lying.
“Good people lie. I think I’m a good person, where I have lied,” Comey said. “I still believe Andrew McCabe is a good person but the inspector general found he lied,” noting that there are “severe consequences” within the DOJ for doing so.
In response, McCabe’s attorney, Michael R. Bromwich (flush with cash from the disgraced Deputy Director’s half-million dollar legal defense GoFundMe campaign), fired back – claiming that Comey was well aware of the leaks.
“In his comments this week about the McCabe matter, former FBI Director James Comey has relied on the Inspector General’s (OIG) conclusions in their report on Mr. McCabe. In fact, the report fails to adequately address the evidence (including sworn testimony) and documents that prove that Mr. McCabe advised Director Comey repeatedly that he was working with the Wall Street Journal on the stories in question…” reads the statement in part.
Things are getting mighty interesting for Andy “the bag man” McCabe, as James Comey – worth an estimated $11 million before becoming FBI Director, trots around the country promoting his lucrative new book – while his former Deputy is undoubtedly tapping into his legal defense fund to prepare for battle.
END
HARVEY


