APRIL 29/OPTIONS EXPIRY TOMORROW ON LBMA/OTC CONTRACTS: GOLD DOWN $7.00 TO $1279.70//SILVER DOWN 13 CENTS//AGAIN NO GOLD ENTERS THE GOLD ARENA BUT A HUGE 69,365 OZ LEAVE//GOLD OZ STANDING WITH ONE DAY TO GO: 22.23 TONNES AGAINST 8 TONNES OF REGISTERED GOLD//USA LEAVES THE CHINESE TRADE TALKS //CHINA HAS A MASSIVE 8.1% OF NON PERFORMING LOANS//GOLDMAN SACHS NOW BASHES TURKEY AND STATES THAT THE LIRA WILL FALL TO 6.25 TO ONE//BART CHILTON FORMER COMMISSIONER OF THE CFTC AND A GOOD FRIEND DIES SUDDENLY//HUGE SWAMP STORIES FOR YOU TONIGHT//
GOLD: $1279.70 DOWN $7.00 (COMEX TO COMEX CLOSING)
Silver:$14.92 DOWN 13 CENTS (COMEX TO COMEX CLOSING)
Closing access prices:
Gold : $1279.50
silver: $14.90
TOMORROW, WE HAVE EXPIRY ON THE BIG ONES OTC/LONDON LBMA CONTRACTS FOR GOLD/SILVER. WE MIGHT HAVE A LITTLE WEAKNESS IN THE MORNING AND THEN CLEAR SAILING.
JPMorgan has been receiving gold with reckless abandon and sometimes supplying (stopping)
today RECEIVING: 118/201
EXCHANGE: COMEX
CONTRACT: APRIL 2019 COMEX 100 GOLD FUTURES
SETTLEMENT: 1,284.900000000 USD
INTENT DATE: 04/26/2019 DELIVERY DATE: 04/30/2019
FIRM ORG FIRM NAME ISSUED STOPPED
____________________________________________________________________________________________
323 H HSBC 199
657 C MORGAN STANLEY 2 661 C JP MORGAN 118
686 C INTL FCSTONE 2
991 H CME 81
____________________________________________________________________________________________
TOTAL: 201 201
MONTH TO DATE: 7,149
NUMBER OF NOTICES FILED TODAY FOR APRIL CONTRACT: 201 NOTICE(S) FOR 20100 OZ (0.6251 tonnes)
TOTAL NUMBER OF NOTICES FILED SO FAR: 7149 NOTICES FOR 714900 OZ (22.23 TONNES)
SILVER
FOR APRIL
XXXXXXXXXXXXXXXXXXXXXXXXXXXXXX
0 NOTICE(S) FILED TODAY FOR nil OZ/
total number of notices filed so far this month: 775 for 3,875,000 oz
IN SILVER THE COMEX OI FELL BY A HUMONGOUS SIZED 11,845CONTRACTS FROM 212,944 DOWN TO 201,099DESPITE FRIDAY’S 12 CENT RISE IN SILVER PRICING AT THE COMEX. , WE DID HAVE CONSIDERABLE LIQUIDATION OF SPREADERS WITH TODAY’S READING AND IT HAD A HUGE EFFECT ON PRICE. TODAY WE ARRIVED FURTHER FROM AUGUST’S 2018 RECORD SETTING OPEN INTEREST OF 244,196 CONTRACTS.
WE HAVE ALSO WITNESSED A LARGEAMOUNT OF PHYSICAL METAL STAND FOR COMEX DELIVERY AS WELL WE ARE WITNESSING CONSIDERABLE LONGS PACKING THEIR BAGS AND MIGRATING OVER TO LONDON IN GREATER NUMBERS IN THE FORM OF EFP’S. WE WERE NOTIFIED THAT WE HAD A VERYSTRONGSIZED NUMBER OF COMEX LONGS TRANSFERRING THEIR CONTRACTS TO LONDON THROUGH THE EFP:
0 FOR APRIL, 2155 FOR MAY, 0 FOR JUNE, 894 FOR JULY AND ZERO FOR ALL OTHER MONTHS AND THEREFORE TOTAL ISSUANCE 3049 CONTRACTS. WITH THE TRANSFER OF 3049CONTRACTS, WHAT THE CME IS STATING IS THAT THERE IS NO SILVER (OR GOLD) TO BE DELIVERED UPON AT THE COMEX AS THEY MUST EXPORT THEIR OBLIGATION TO LONDON. ALSO KEEP IN MIND THAT THERE CAN BE A DELAY OF 24-48 HRS IN THE ISSUING OF EFP’S. THE 3049 EFP CONTRACTS TRANSLATES INTO 15.24 MILLION OZ ACCOMPANYING:
1.THE 12 CENT RISE IN SILVER PRICE AT THE COMEX AND
2. THE STRONG AMOUNT OF SILVER OUNCES WHICH STOOD FOR DELIVERY IN THE LAST NINE MONTHS:
JUNE/2018. (5.420 MILLION OZ);
FOR JULY: 30.370 MILLION OZ
FOR AUG., 6.065 MILLION OZ
FOR SEPT. 39.505 MILLION OZ S
FOR OCT.2.525 MILLION OZ.
FOR NOV: A HUGE 7.440 MILLION OZ STANDING AND
21.925 MILLION OZ FINALLY STAND FOR DECEMBER.
5.845 MILLION OZ STAND IN JANUARY.
2.955 MILLION OZ STANDING FOR FEBRUARY.:
27.120 MILLION OZ STANDING IN MARCH.
AND NOW 3.875 MILLION OZ STANDING FOR SILVER IN APRIL.
ACCUMULATION FOR EFP’S/SILVER/J.P.MORGAN’S HOUSE OF BRIBES, / STARTING FROM FIRST DAY NOTICE/FOR MONTH OF APRIL:
36,399 CONTRACTS (FOR 20TRADING DAYS TOTAL 36,399 CONTRACTS) OR 181.99MILLION OZ: (AVERAGE PER DAY: 1819 CONTRACTS OR 9.098 MILLION OZ/DAY)
TO GIVE YOU AN IDEA AS TO THE HUGE SUPPLY THIS MONTH IN SILVER: SO FAR THIS MONTH OF MAR: 181.99 MILLION PAPER OZ HAVE MORPHED OVER TO LONDON. THIS REPRESENTS AROUND 25.99% OF ANNUAL GLOBAL PRODUCTION (EX CHINA EX RUSSIA)* JUNE’S 345.43 MILLION OZ IS THE SECOND HIGHEST RECORDED ISSUANCE OF EFP’S AND IT FOLLOWED THE RECORD SET IN APRIL 2018 OF 385.75 MILLION OZ.
ACCUMULATION IN YEAR 2019 TO DATE SILVER EFP’S: 749.79 MILLION OZ.
JANUARY 2019 EFP TOTALS: 217.455. MILLION OZ
FEB 2019 TOTALS: 147.4 MILLION OZ/
MARCH 2019 TOTAL EFP ISSUANCE: 207.835 MILLION OZ
RESULT: WE HAD A HUMONGOUS SIZED DECREASE IN COMEX OI SILVER COMEX CONTRACTS OF 11,845 DESPITE THE 12 CENT RISE IN SILVER PRICING AT THE COMEX /YESTERDAY... THE CME NOTIFIED US THAT WE HAD A HUGESIZED EFP ISSUANCE OF 3049CONTRACTS WHICH EXITED OUT OF THE SILVER COMEX AND TRANSFERRED THEIR OI TO LONDON AS FORWARDS. SPECULATORS CONTINUED THEIR INTEREST IN ATTACKING THE SILVER COMEX FOR PHYSICAL SILVER (SEE COMEX DATA) . OUR BANKERS RESUMED THEIR LIQUIDATION OF THE SPREAD TRADES TODAY.
TODAY WE LOST A HUGE SIZED:8796 TOTAL OI CONTRACTS ON THE TWO EXCHANGES:
i.e 3049 OPEN INTEREST CONTRACTS HEADED FOR LONDON (EFP’s) TOGETHER WITH DECREASE OF 11,845OI COMEX CONTRACTS. AND ALL OF THIS DEMAND HAPPENED WITH A 12 CENT RISE IN PRICE OF SILVER AND A CLOSING PRICE OF $15.05 WITH RESPECT TO FRIDAY’S TRADING. YET WE STILL HAVE A STRONG AMOUNT OF SILVER STANDING AT THE COMEX FOR DELIVERY!!
In ounces AT THE COMEX, the OI is still represented by JUST OVER 1 BILLION oz i.e. 1.008 BILLION OZ TO BE EXACT or 144% of annual global silver production (ex Russia & ex China).
FOR THE NEW FRONT MARCH MONTH/ THEY FILED AT THE COMEX: 0NOTICE(S) FOR nil OZ OF SILVER
IN SILVER,PRIOR TO TODAY, WE SET THE NEW COMEX RECORD OF OPEN INTEREST AT 243,411 CONTRACTS ON APRIL 9.2018. AND AGAIN THIS HAS BEEN SET WITH A LOW PRICE OF $16.51.
AND NOW WE RECORD FOR POSTERITY ANOTHER ALL TIME RECORD OPEN INTEREST AT THE COMEX OF 244,196 CONTRACTS ON AUGUST 22/2018 AND AGAIN WHEN THIS RECORD WAS SET, THE PRICE OF SILVER WAS $14.78 AND LOWER IN PRICE THAN PREVIOUS RECORDS.
ON THE DEMAND SIDE WE HAVE THE FOLLOWING:
HUGE AMOUNTS OF SILVER STANDING FOR DELIVERY (MARCH/2018: 27 MILLION OZ , APRIL/2018 : 2.485 MILLION OZ MAY: 36.285 MILLION OZ ; JUNE/2018 (5.420 MILLION OZ) , JULY 2018 FINAL AMOUNT STANDING: 30.370 MILLION OZ ) FOR AUGUST 6.065 MILLION OZ. , SEPT: A HUGE 39.505 MILLION OZ./ OCTOBER: 2,520,000 oz NOV AT 7.440 MILLION OZ./ DEC. AT 21.925 MILLION OZ JANUARY AT 5.825 MILLION OZ.AND FEB 2019: 2.955 MILLION OZ/ MARCH: 27.120 MILLION OZ/ AND NOW APRIL AT 3.875 MILLION OZ/
HUGE RECORD OPEN INTEREST IN SILVER 243,411 CONTRACTS (OR 1.217 BILLION OZ/ SET APRIL 9/2018) AND NOW AUGUST 22/2018: 244,196 CONTRACTS, WITH A SILVER PRICE OF $14.78.
HUGE ANNUAL EFP’S ISSUANCE EQUAL TO 2.9 BILLION OZ OR 400% OF SILVER ANNUAL PRODUCTION/2017
RECORD SETTING EFP ISSUANCE FOR ANY MONTH IN SILVER; APRIL/2018/ 385.75 MILLION OZ/ AND THE SECOND HIGHEST RECORDED EFP ISSUANCE JUNE 2018 345.43MILLION OZ
AND YET, WITH THE EXTREMELY HIGH EFP ISSUANCE, WE HAVE A CONTINUAL LOW PRICE OF SILVER DESPITE THE ABOVE HUGE DEMAND. TO ME THE ONLY ANSWER IS THAT WE HAVE SOVEREIGN (CHINA) WHO IS ENDEAVOURING TO GOBBLE UP ALL AVAILABLE PHYSICAL SILVER NO MATTER WHERE, EXACTLY WHAT J.P.MORGAN IS DOING. AND IT IS MY BELIEF THAT J.P.MORGAN IS HOLDING ITS SILVER FOR ITS BENEFICIAL OWNER..THE USA GOVERNMENT WHO IN TURN IS HOLDING THAT SILVER FOR CHINA.(FOR A SILVER LOAN REPAYMENT).
IN GOLD, THE OPEN INTEREST FELL BY A CONSIDERABLE SIZED 5498 CONTRACTS, TO 429,551 DESPITE THE RISE IN THE COMEX GOLD PRICE/(A GAIN IN PRICE OF $9.20//FRIDAY’S TRADING).
THE CME RELEASED THE DATA FOR EFP ISSUANCE AND IT TOTALED A STRONG SIZED 6931 CONTRACTS:
APRIL 0 CONTRACTS,JUNE: 6931 CONTRACTS DECEMBER: 0 CONTRACTS, JUNE 2020 0 CONTRACTS AND ALL OTHER MONTHS ZERO. The NEW COMEX OI for the gold complex rests at 429,551. ALSO REMEMBER THAT THERE WILL BE A DELAY IN THE ISSUANCE OF EFP’S. THE BANKERS REMOVE LONG POSITIONS OF COMEX GOLD IMMEDIATELY. THEN THEY ORCHESTRATE THEIR PRIVATE EFP DEAL WITH THE LONGS AND THAT COULD TAKE AN ADDITIONAL, 48 HRS SO WE GENERALLY DO NOT GET A MATCH WITH RESPECT TO DEPARTING COMEX LONGS AND NEW EFP LONG TRANSFERS. . EVEN THOUGH THE BANKERS ISSUED THESE MONSTROUS EFPS, THE OBLIGATION STILL RESTS WITH THE BANKERS TO SUPPLY METAL BUT IT TRANSFERS THE RISK TO A LONDON BANKER OBLIGATION AND NOT A NEW YORK COMEX OBLIGATION. LONGS RECEIVE A FIAT BONUS TOGETHER WITH A LONG LONDON FORWARD. THUS, BY THESE ACTIONS, THE BANKERS AT THE COMEX HAVE JUST STATED THAT THEY HAVE NO APPRECIABLE METAL!! THIS IS A MASSIVE FRAUD: THEY CANNOT SUPPLY ANY METAL TO OUR COMEX LONGS BUT THEY ARE QUITE WILLING TO SUPPLY MASSIVE NON BACKED GOLD (AND SILVER) PAPER KNOWING THAT THEY HAVE NO METAL TO SATISFY OUR LONGS. LONDON IS NOW SEVERELY BACKWARD IN BOTH GOLD AND SILVER AND WE ARE WITNESSING DELAYS IN ACTUAL DELIVERIES.
IN ESSENCE WE HAVE A FAIR SIZED GAIN IN TOTAL CONTRACTS ON THE TWO EXCHANGES OF 1433 CONTRACTS: 5498 OI CONTRACTS DECREASED AT THE COMEX AND 6931EFP OI CONTRACTS WHICH NAVIGATED OVER TO LONDON. THUS TOTAL OI GAIN OF 1433 CONTRACTS OR 143,300 OZ OR 4.457 TONNES. FRIDAYWE HAD A GAIN IN THE PRICE OF GOLD TO THE TUNE OF $9.20.…AND WITH THAT RISE, WE HAD A GOOD GAIN IN TONNAGE OF 8.696 TONNES!!!!!!.??????????????????????????????????????????
ACCUMULATION OF EFP’S GOLD AT J.P. MORGAN’S HOUSE OF BRIBES: (EXCHANGE FOR PHYSICAL) FOR THE MONTH OF APRIL : 138,405 CONTRACTS OR 13,840,500 OR 430.49 TONNES (20 TRADING DAYS AND THUS AVERAGING: 6920 EFP CONTRACTS PER TRADING DAY
TO GIVE YOU AN IDEA AS TO THE STRONG SIZE OF THESE EFP TRANSFERS : THIS MONTH IN 20 TRADING DAYS IN TONNES: 430.49 TONNES
TOTAL ANNUAL GOLD PRODUCTION, 2018, THROUGHOUT THE WORLD EX CHINA EX RUSSIA: 3555 TONNES
THUS EFP TRANSFERS REPRESENTS 430.49/3550 x 100% TONNES =12.12% OF GLOBAL ANNUAL PRODUCTION SO FAR IN DECEMBER ALONE.***
ACCUMULATION OF GOLD EFP’S YEAR 2019 TO DATE: 1803.88 TONNES
JANUARY 2019 TOTAL EFP ISSUANCE; 531.20 TONNES
FEB 2019 TOTAL EFP ISSUANCE: 344.36 TONNES
MARCH 2019 TOTAL EFP ISSUANCE: 497.16 TONNES
WHAT IS ALARMING TO ME, ACCORDING TO OUR LONDON EXPERT ANDREW MAGUIRE IS THAT THESE EFP’S ARE BEING TRANSFERRED TO WHAT ARE CALLEDRIAL FORWARD CONTRACT OBLIGATIONS AND THESE CONTRACTS ARE LESS THAN 14 DAYS. ANYTHING GREATER THAN 14 DAYS, THESE MUST BE RECORDED AND SENT TO THE COMPTROLLER, GREAT BRITAIN TO MONITOR RISK TO THE BANKING SYSTEM. IF THIS IS INDEED TRUE, THEN THIS IS A MASSIVE CONSPIRACY TO DEFRAUD AS WE NOW WITNESS A MONSTROUS TOTAL EFP’S ISSUANCE AS IT HEADS INTO THE STRATOSPHERE.
Result: A CONSIDERABLE SIZED DECREASE IN OI AT THE COMEX OF 5,498 DESPITE THE GAIN IN PRICING ($9.20) THAT GOLD UNDERTOOK FRIDAY) //.WE ALSO HAD A STRONG SIZED NUMBER OF COMEX LONG TRANSFERRING TO LONDON THROUGH THE EFP ROUTE: 6931 CONTRACTS AS THESE HAVE ALREADY BEEN NEGOTIATED AND CONFIRMED. THERE OBVIOUSLY DOES NOT SEEM TO BE MUCH PHYSICAL GOLD AT THE COMEX. I GUESS IT EXPLAINS THE HUGE ISSUANCE OF EFP’S…THERE IS HARDLY ANY GOLD PRESENT AT THE GOLD COMEX FOR DELIVERY PURPOSES. IF YOU TAKE INTO ACCOUNT THE 6931 EFP CONTRACTS ISSUED, WE HAD A GOOD GAIN OF 2796CONTRACTSIN TOTAL OPEN INTEREST ON THE TWO EXCHANGES:
6931 CONTRACTS MOVE TO LONDONAND5498CONTRACTS DECREASEDAT THE COMEX. (IN TONNES, THE GAIN IN TOTAL OI EQUATES TO 4.457 TONNES). ..AND THIS STRONG DEMAND OCCURRED WITH A RISE IN PRICE OF $9.20 IN YESTERDAY’S TRADING AT THE COMEX.
we had: 201 notice(s) filed upon for 20100 oz of gold at the comex.
With respect to our two criminal funds, the GLD and the SLV:
GLD...
WITH GOLD DOWN $7.00 TODAY
NO CHANGE IN GOLD INVENTORY AT THE GLD
INVENTORY RESTS AT 746.69 TONNES
TO ALL INVESTORS THINKING OF BUYING GOLD THROUGH THE GLD ROUTE: YOU ARE MAKING A TERRIBLE MISTAKE AS THE CROOKS ARE USING WHATEVER GOLD COMES IN TO ATTACK BY SELLING THAT GOLD. IT SURE SEEMS TO ME THAT THE GOLD OBLIGATIONS AT THE GLD EXCEED THEIR INVENTORY
SLV/
WITH SILVER DOWN 13 CENTS TODAY:
NO CHANGE IN SILVER INVENTORY AT THE SLV//
/INVENTORY RESTS AT 311.979 MILLION OZ.
end
First, here is an outline of what will be discussed tonight:
1. Today, we had the open interest in SILVER FELL BY A HUMONGOUS SIZED 11,845 CONTRACTS from 212,944 DOWNTO 201,099 AND FURTHER FROM THE NEW COMEX RECORD SET LAST IN AUG.2018 AT 244,196 WITH A SILVER PRICE OF $14.78/(AUGUST 22/2018)..THE PREVIOUS RECORD WAS SET ON APRIL 9/2018 AT 243,411 OPEN INTEREST CONTRACTS WITH THE SILVER PRICE AT THAT DAY: $16.53). AND PREVIOUS TO THAT, THE RECORD WAS ESTABLISHED AT: 234,787 CONTRACTS, SET ON APRIL 21.2017 OVER 1 1/3 YEARS AGO. THE PRICE OF SILVER ON THAT DAY: $17.89. AS YOU CAN SEE, WE HAVE RECORD HIGH OPEN INTERESTS IN SILVER ACCOMPANIED BY A CONTINUAL LOWER PRICE WHEN THAT RECORD WAS SET…..TODAY,IT LOOKS LIKE OUR SPREADERS SAW CONSIDERABLE ACTION WITH RESPECT TO THEIR USUAL AND CUSTOMARY LIQUIDATION, BUT TODAY NO EFFECT ON THE PRICE OF SILVER
HERE IS HOW THE CROOKS USED SPREADING AS WE ENTER AN ACTIVE DELIVERY MONTH. THUS SILVER HAS THE ACTIVE MONTH OF MAY COMING UP AND THUS SPREADERS DO THE FOLLOWING:
“YOU WILL ALSO NOTICE THAT THE COMEX OPEN INTEREST IS STARTING TO RISE IN THIS NON ACTIVE MONTH OF APRIL BUT SO IS THE OPEN INTEREST OF SPREADERS. THE OPEN INTEREST IN SILVER WILL CONTINUE TO RISE UNTIL ONE WEEK BEFORE FIRST DAY NOTICE OF AN UPCOMING ACTIVE DELIVERY MONTH (MAY), AND THAT IS WHEN THE CROOKS SELL THEIR SPREAD POSITIONS BUT NOT AT THE SAME TIME OF THE DAY. THEY WILL USE THE SELL SIDE OF THE EQUATION TO CREATE THE CASCADE (ALONG WITH THEIR COLLUSIVE FRIENDS) AND THEN COVER ON THE BUY SIDE OF THE SPREAD SITUATION AT THE END OF THE DAY. THEY DO THIS TO AVOID POSITION LIMIT DETECTION. THE LIQUIDATION OF THE SPREADING FORMATION CONTINUES FOR EXACTLY ONE WEEK AND ENDS ON FIRST DAY NOTICE.”
EFP ISSUANCE:
OUR CUSTOMARY MIGRATION OF COMEX LONGS CONTINUE TO MORPH INTO LONDON FORWARDS AS OUR BANKERS USED THEIR EMERGENCY PROCEDURE TO ISSUE:
0 CONTRACTS FOR APRIL., 2155 FOR MAY, FOR JUNE 0 CONTRACTS AND JULY: 894 CONTRACTS AND ALL OTHER MONTHS: ZERO. TOTAL EFP ISSUANCE: 3049 CONTRACTS. EFP’S GIVE OUR COMEX LONGS A FIAT BONUS PLUS A DELIVERABLE PRODUCT OVER IN LONDON. IF WE TAKE THE OI LOSS AT THE COMEX OF 11,845 CONTRACTS TO THE 3049OI TRANSFERRED TO LONDON THROUGH EFP’S, WE OBTAIN A STRONG LOSS OF 8380 OPEN INTEREST CONTRACTS. THUS IN OUNCES, THE LOSS ON THE TWO EXCHANGES: 43.98MILLION OZ!!! AND YET WE ALSO HAVE A STRONG DEMAND FOR PHYSICAL AS WE WITNESSED A FINAL STANDING OF GREATER THAN 30 MILLION OZ FOR JULY, A STRONG 6.065 MILLION OZ FOR AUGUST.. A HUGE 39.505 MILLION OZ STANDING FOR SILVER IN SEPTEMBER… OVER 2 million OZ STANDING FOR THE NON ACTIVE MONTH OF OCTOBER., 7.440 MILLION OZ FINALLY STANDING IN NOVEMBER. 21.925 MILLION OZ STANDING IN DECEMBER , 5.845 MILLION OZ STANDING IN JANUARY. 2.955 MILLION OZ STANDING IN FEBRUARY, 27.120 MILLION OZ FOR MARCH. AND NOW 3.875 MILLION OZ FOR APRIL.
RESULT: A HUMONGOUS SIZED DECREASE IN SILVER OI AT THE COMEX DESPITE THE TINY 12 CENT GAIN IN PRICING THAT SILVER UNDERTOOK IN PRICING// FRIDAY. WE ALSO HAD A SMALL SIZED 3049 EFP’S ISSUED TRANSFERRING COMEX LONGS OVER TO LONDON. TOGETHER WITH THE STRONG SIZED AMOUNT OF SILVER OUNCES STANDING FOR THIS MONTH, DEMAND FOR PHYSICAL SILVER CONTINUES TO INTENSIFY AS WE WITNESS SEVERE BACKWARDATION IN SILVER IN LONDON.
BOTH THE SILVER COMEX AND THE GOLD COMEX ARE IN STRESS AS THE BANKERS SCOUR THE BOWELS OF THE EXCHANGE FOR METAL
(report Harvey)
.
2.a) The Shanghai and London gold fix report
(Harvey)
2 b) Gold/silver trading overnight Europe, Goldcore
(Mark O’Byrne/zerohedge
and in NY: Bloomberg
3. ASIAN AFFAIRS
i)MONDAY MORNING/ FRIDAY NIGHT:
SHANGHAI CLOSED DOWN 23.90 POINTS OR 0.77% //Hang Sang CLOSED UP 187.80 POINTS OR 0.97% /The Nikkei closed/ Australia’s all ordinaires CLOSED DOWN .36%
/Chinese yuan (ONSHORE) closed UP at 6.7283 AS TRUCE DECLARED FOR 3 MONTHS /Oil DOWN to 64.03 dollars per barrel for WTI and 72.83 for Brent. Stocks in Europe OPENED MIXED// ONSHORE YUAN CLOSED UP // LAST AT 6.7283 AGAINST THE DOLLAR. OFFSHORE YUAN CLOSED UP ON THE DOLLAR AT 6.7380/ TRADE TALKS NOW ON/MAJOR PROBLEMS AT HUAWEI /CFO ARRESTED : /ONSHORE YUAN TRADING ABOVE LEVEL OF OFFSHORE YUAN/ONSHORE YUAN TRADING STRONGER AGAINST USA DOLLAR/OFFSHORE YUAN TRADING STRONGER AGAINST THE DOLLAR /CHINA RETALIATES WITH TARIFFS/ TRUMP RESPONDS TO NEW TARIFFS AND IT NOW A FULL TRADE WAR COMMENCED
3A//NORTH KOREA/ SOUTH KOREA
NORTH KOREA
b) REPORT ON JAPAN
3 China/Chinese affairs
i)China/USA
As promised, the trade deal with China is shattered. Again the White HOuse is threatening to walk away from the table. The USA does not understand that it is better off with what they have already..they are exporting worthless dollars to pay for goods.
( zero hedge)
ii)This will surely infuriate the Chinese as two USA warships sail through the Taiwan Strait
( zerohedge)
iii)The following is China’s Neutron Bomb: non performing loans. The total of all loans in China is around $35, billion dollars (and another 9 billion dollars in the peer to peer shadow banking sector. It looks like we have about an 8.1 % bad debt ratio or 081 x 35 = 1 trillion dollars of bad debts that the banks have to write off.
( zero hedge)
4/EUROPEAN AFFAIRS
i)EU/HUAWEI/USA/
War of words between Juncker and the USA as Europe will not ban Huawei just because it is Chinese
( zerohedge)
ii) Spain
Spain election: A hung parliament but they would probably gain some support form the Catalan separatists. The populist party VOX gains entry into Parliament with 24 seats.
(courtesy zerohedge)
5. RUSSIAN AND MIDDLE EASTERN AFFAIRS
i)TURKEY
The Turkish lira plummets to 6;95 as Goldman Sachs has entered the bashing of Turkey arena. They are recommending that the Lira will fall to 6.25 to the dollars. The reserves of Turkey in dollars is negative if you remove their gold value (511 tonnes..$21billion//total reserves including gold: 12 billion dollars)
(courtesy Goldman Sachs/zerohedge)
ii)Turkey indicts its third USA consulate worker in Istanbul on terrorism charges related to Gulen. He and his family our Turkish citizens.
(courtesy Middle East Monitor)
6. GLOBAL ISSUES
7. OIL ISSUES
8 EMERGING MARKET ISSUES
Argentina
9. PHYSICAL MARKETS
i)A central bank is seeking gold through the Comex via the EFP’s.
( Andrew Maguire/Kingworldnews?GATA)
ii)Chris Powell highlights is gold’s deliverance is at hand with the revelation that a sovereign is after gold at the comex.
(Chris Powell/GATA)
iii)Maguire explains how the Comex is designed for market rigging and that it is about to end as a sovereign wishes to attack the comex for its precious metal//gold.
(Maguire/GATA)
iv)The Russian Central banker Elvira is one smart cookie. She no doubt distrusts the dollar and that is why she is buying gold with reckless abandon
( CNBC/GATA)
v)One of great commissioners of the CFTC and a good friend, passes away at the age of 58 due to a “sudden illness”
( GATA)
vi)Two important points: The UK seems to be shipping gold directly to China. Generally China takes kilobars but maybe they are refining their own bars. The second importan points is tiny Azerbaijan who liquidated all of its 32 tonnes of gold in 2016, had decided that they had better buy some of the gold back. They added 8 tones.
(courtesy Lawrie Williams)
10. USA stories which will influence the price of gold/silver)
MARKET TRADING//early this morning/TRADING
ii)Market data
Without getting too technical but believe me that it is true that there is a shortage of dollars in the USA banking system despite the massive 1.5 trillion dollars of excess reserves. The dollar shortage of funding is causing havoc in banking circles and now Charlie McElligott of Nomura has now come out and states that he now expects a 50 basis cut out of gate and this will be soon. The problem is that the effective fund rate has surpassed the IOER or the rate at which the Fed gives a high interest rate for excess reserves.
Don’t pay attention to the details although it is true..just get the gist of the story and what will happen
(courtesy zerohedge)
ii)USA ECONOMIC/GENERAL STORIES
a)An extremely important commentary from Alasdair Macleod as he points out that there is no escape from the USA debt trap. He along with everybody else is highlighting the fact that the USA budgetary deficit must rise because of Trump’s spending initiatives. He gives a detailed explanation as to why (without increase US A savings) the uSA trade deficit must also rise and cannot fall despite Trump’s efforts at increasing tariffs..it is a foo’s game
( Macleod/GoldMoney.com)
b)A few things to note here:
Personal spending rose by a huge .9% month/month and thus USA savings rate plummets again
Person income: constant
thus from Alasdair Macleod’s thesis: as the USA budgetary deficit is skyrocketing so much its trade deficit
(zerohedge)
c)Michael Snyder correctly points out that 102 million Americans do not have a job right now and it is worse than at any point during the last recession.
( Michael Snyder)
d) It seems that everyone is perplexed as the strong GDP report on Friday. It is a fake
( zerohedge)
e)This is alarming: credit card write off soar to 7 yr highs.( zerohedge)
f)More Boeing troubles as the FAA turn to the new Dreamliner hydraulic leakage
( zerohedge)
SWAMP STORIES
a) the Ukraine connection and how the Ukrainian government did everything in their power to illegally help Clinton win against Trump and how the Manafort investigation started.
( zerohedge)
b)A good one!! Meijer explains why Biden’s nomination for President will be harmful to the DNC as he has considerable bad baggage
( Raul Meijer)
c)Another great commentary from Kim Strassel. Why didn’t Mueller determine whether the Steele dossier was Russian disinformation. Maybe I G Horowitz or Bill Barr will give us the answer to that
( Kim Strassel)
d)Lots of fun and games with this one>Kim Foxx is being subpoenaed over her office’s decision to drop the Smollet case
( zerohedge)
e)Joe DiGenova is one of the best constitutional lawyers in the uSA. He explains in detail why the Don Jr. meeting at Trump Tower is a phony..ie. the collecting of dirt from a foreign national violates USA election laed
(a must read…Joe Digenova)
E)SWAMP STORIES/MAJOR STORIES//THE KING REPORT
Let us head over to the comex:
THE TOTAL COMEX GOLD OPEN INTEREST FELL BY A CONSIDERABLE 5498 CONTRACTS.TO A LEVEL OF 430,914 DESPITE THE STRONG GAIN IN THE PRICE OF GOLD ($9.20) IN FRIDAY’S // COMEXTRADING)
WE ARE NOW IN THE ACTIVE DELIVERY MONTH OF APRIL.. THE CME REPORTS THAT THE BANKERS ISSUED A STRONG SIZED TRANSFER THROUGH THE EFP ROUTE AS THESE LONGS RECEIVED A DELIVERABLE LONDON FORWARD TOGETHER WITH A FIAT BONUS., THAT IS 6931 EFP CONTRACTS WERE ISSUED:
FOR APRIL 0 FOR JUNE ’19: 6931 CONTRACTS , DEC; 0 CONTRACTS: 0 AND ZERO FOR ALL OTHER MONTHS:
TOTAL EFP ISSUANCE: 6931 CONTRACTS.
THE OBLIGATION STILL RESTS WITH THE BANKERS ON THESE TRANSFERS. ALSO REMEMBER THAT THERE IS NO DOUBT A HUGE DELAY IN THE ISSUANCE OF EFP’S AND IT PROBABLY TAKES AT LEAST 48 HRS AFTER LONGS GIVE UP THEIR COMEX CONTRACTS FOR THEM TO RECEIVE THEIR EFP’S AS THEY ARE NEGOTIATING THIS CONTRACT WITH THE BANKS FOR A FIAT BONUS PLUS THEIR TRANSFER TO A LONDON BASED FORWARD.
ON A NET BASIS IN OPEN INTEREST WE GAINED THE FOLLOWING TODAY ON OUR TWO EXCHANGES:1433 TOTALCONTRACTS IN THAT 6931 LONGS WERE TRANSFERRED AS FORWARDS TO LONDON AND WE LOST A HUGE SIZED 5498 COMEX CONTRACTS.
NET GAIN ON THE TWO EXCHANGES : 1433contracts OR 143300 OZ OR 4.457 TONNES.
We are now in the active contract month of APRIL and here the open interest stands at 201 contracts, having LOST 46contracts.
We had 46 notices filed upon yesterday, so we LOST 0 contracts or an additional NIL oz will stand as these guys refused to morph into London based forwards as well as negating a fiat bonus. THE GOLD COMEX ,AND FOR THAT MATTER THE GLOBE, IS VOID OF GOLD AS THE CROOKS DESPERATELY SEARCH FOR BADLY NEEDED GOLD. TO PUT OUT FIRES OCCURRING ELSEWHERE!! THIS ENDS THE STREAK AT 9 CONSECUTIVE DAYS WHERE WE HAD AN INCREASE IN THE AMOUNT OF GOLD STANDING AND THE ODDS ARE THAT DURING THAT STREAK THE BANKERS WERE SEARCHING FOR METAL. HOWEVER DUE TO THE FACT THAT LONDON IS BASICALLY OUT OF METAL, IT IS POSSIBLE THAT SOVEREIGNS OR BIG INVESTORS MAY TURN TO THE COMEX FOR PHYSICAL GOLD.
The next non active delivery month after APRIL is the NON active delivery month is MAY and here the OI FELL by 353 contracts FALLING TO 571 contracts. The next contract month after May is June and it is an active month. Here the open interest FELL by 5584 contracts DOWN to 300,726 contracts.
TODAY’S NOTICES FILED:
WE HAD 201 NOTICES FILED TODAY AT THE COMEX FOR ,20,100 OZ. (0.1430 TONNES)
Total COMEX silver OI FELL BY A HUGE SIZED 11,845 CONTRACTS FROM 214,818 DOWN TO 201,099(AND FURTHER FROM THE NEW RECORD OI FOR SILVER SET ON AUGUST 22.2018. THE PREVIOUS RECORD WAS SET APRIL 9.2018/ 243,411 CONTRACTS)AND TODAY’S STRONG OI COMEX LOSS OCCURRED DESPITE A 12 CENT GAIN IN PRICING.//YESTERDAY.
WE ARE NOW INTO THE NON ACTIVE DELIVERY MONTH OF APRIL AND THE OPEN INTEREST IN THIS FRONT MONTH RESTS AT 0 CONTRACTS FOR A LOSS OF 1 CONTRACT ON THE DAY.
WE HAD 1 NOTICE SERVED UP ON FRIDAY, SO WE GAINED 0 CONTRACT OR AN ADDITIONAL NIL OZ OF SILVER WILL STAND AT THE COMEX AS INVESTORS REFUSED TO MORPH INTO LONDON BASED FORWARDS AS WELL AS NEGATING A FIAT BONUS. THE COMEX IS RUNNING OUT OF METAL TO FEED THE CROOKS.
AFTER APRIL, WE HAVE THE ACTIVE DELIVERY MONTH OF MAY AND HERE THE OI FELL BY 19,459 CONTRACTS DOWN TO 13,767. CONTRACTS.. THE NEXT MONTH OF JUNE GAINED 132 CONTRACTS TO 535. AFTER JUNE, THE VERY BIG DELIVERY MONTH OF JULY HAD A GAIN OF 6959 CONTRACTS UP TO 142,361 CONTRACTS.
ON A NET BASIS WE LOST A HUMONGOUS SIZED 8796 SILVER OPEN INTEREST CONTRACTS AS WE OBTAINED A 11845 CONTRACT LOSS AT THE COMEX COMBINING WITH THE ADDITION OF 3049 OI CONTRACTS NAVIGATING OVER TO LONDON.
NET LOSS ON THE TWO EXCHANGES: 8796CONTRACTS...AND ALL OF THIS LACK OF DEMAND OCCURRED WITH A 12 CENT GAIN IN PRICING// FRIDAY????
TODAY’S NUMBER OF NOTICES FILED:
We, today, had 0 notice(s) filed for NILOZ for the MARCH, 2019 COMEX contract for silver
Trading Volumes on the COMEX TODAY: 198,286 CONTRACTS
CONFIRMED COMEX VOL. FOR YESTERDAY: 290,281 contracts
Total monthly oz gold served (contracts) so far this month
7149 notices
714900 OZ
22.236 TONNES
Total accumulative withdrawals of gold from the Dealers inventory this month
NIL oz
Total accumulative withdrawal of gold from the Customer inventory this month
xxx oz
HOW COULD THIS BE POSSIBLE? WE NOW HAVE ONE TRADING DAYS LEFT, ( TUESDAY)
WE HAVE 22.23 TONNES OF GOLD STANDING AGAINST 8.8 TONNES??
we had 0 dealer entries:
total dealer deposits: nil oz
total dealer withdrawals: nil oz
We had 0 kilobar entries
we had 0 deposit into the customer account
i) Into JPMorgan: nil oz
ii) Into everybody else: zero oz
total gold deposits: nil oz
very little gold arrives from outside/ again zero amount arrived today
we had 0 gold withdrawals from the customer account:
(maybe investors are taking our advice by not storing their gold at the comex.)
this will hurt our bankers as they need to replace leased gold as all gold stored at the gold comex is unallocated.
Gold withdrawals;
i) we had ONE HUGE withdrawal
i) out of JPMorgan; 69,365.576 oz was withdrawn out of the customer account of JPMorgan.
total gold withdrawals; 69,365,576 oz
IS SOMETHING SCARING JPMORGAN ??
we had 0 adjustments…
FOR THE APRIL 2019 CONTRACT MONTH)
Today, 0 notice(s) were issued from JPMorgan dealer account and 0 notices were issued from their client or customer account. The total of all issuance by all participants equates to 201 contract(s) of which 0 notices were stopped (received) by j.P. Morgan dealer and 118 notice(s) was (were) stopped/ Received) by j.P.Morgan customer account and 0 notices by the squid (Goldman Sachs)
xxxxxxxxxxxxxxxxxxxxxxxxxxxxxxxxxxxxxxxxxxxxxxxxxxxxxxxxxxxxxxxxxxxxxxxxxx
To calculate the INITIAL total number of gold ounces standing for the APRIL /2019. contract month, we take the total number of notices filed so far for the month (7149) x 100 oz , to which we add the difference between the open interest for the front month of APRIL. (247 contract) minus the number of notices served upon today (201 x 100 oz per contract) equals 714,900 OZ OR 22.236 TONNES) the number of ounces standing in this active month of APRIL
Thus the INITIAL standings for gold for the APRIL/2019 contract month:
No of notices served (7149 x 100 oz) + (247)OI for the front month minus the number of notices served upon today (201 x 100 oz )which equals 714,900 ozstanding OR 22.236 TONNES in this active delivery month of APRIL.
WE LOST TODAY 0 CONTRACTS OR 0 ADDITIONAL OZ WILL STAND AT THE COMEX AND THESE GUYS REFUSED TO MORPH INTO LONDON BASED FORWARDS.(AS WELL AS ACCEPTING A FIAT BONUS FOR THEIR EFFORTS). THIS ENDS THE NINE CONSECUTIVE GAINS AT THE GOLD COMEX. TO HAVE 9 CONSECUTIVE GAINS IN AMOUNT STANDING IS UNPRECEDENTED AT THE COMEX. AS I DESCRIBED TO YOU LAST MONTH THE GOLD COMEX IS IN SERIOUS STRESS ALONG WITH THE SILVER COMEX. YOU CAN ALSO BET THE FARM THAT BASEL III IS PLAYING A BIG PART IN THIS AS THE BANKS SCRAMBLE TO REMOVE PAPER GOLD COLLATERAL ON THEIR BOOKS FOR THE REAL STUFF.
SURPRISINGLY LITTLE GOLD HAS BEEN ENTERING THE COMEX VAULTS AND WE HAVE WITNESSED THIS FOR THE PAST YEAR!! WE HAVE ONLY 8.856TONNES OFREGISTERED ( GOLD OFFERED FOR SALE) VS 22.236 TONNES OF GOLD STANDING// (with a probable 4.2 tonnes already settled.)
THEY SEEM TO BE USING CONSIDERABLE GOLD VAPOUR TO SETTLE UPON UNSUSPECTING LONGS.
total registered or dealer gold: 284,725.713 oz or 8.856 tonnes
total registered and eligible (customer) gold; 7,782,015.791 oz 242.05 tonnes
FOR COMPARISON FIRST DAY NOTICE FOR APRIL 2018 AND FINAL STANDING APRIL 30 2018
AT FIRST DAY NOTICE APRIL 1.2018: 19.897 TONNES STOOD FOR DELIVERY
AT CONCLUSION APRIL 30/2018: ONLY 4.6407 TONNES STOOD AS THE REST MIGRATED TO LONDON THROUGH EFP’S. AT THE BEGINNING OF APRIL IT LOOKED LIKE WE WERE GOING TO HAVE A REPEAT OF LAST YEAR WHERE MANY MORPH TO LONDON BECAUSE THERE IS NO METAL AT THE COMEX. WE ARE PROVEN WRONG: WE ARE DOING MUCH BETTER IN 2019 AS WE NOW HAVE TO 22.373 TONNES OF GOLD STANDING.
AT FIRST DAY NOTICE MAY 1 2018: WE HAD 1.284 TONNES OF GOLD STAND. BY MONTH’S END: 2.27 TONNES AS WE HAD ONE QUEUE JUMPING IN THE MIDDLE OF THE MONTH.
AND IF YOU ARE KEEPING SCORE AT THE SAME TIME LAST YEAR:
IN GOLD ON APRIL 27/2018 WE HAD 571 OPEN INTEREST CONTRACTS STILL REMAINING TO BE SERVED//1 TRADING DAY VS 574 CONTRACTS APRIL 29.2019 WITH 1 TRADING SESSION LEFT.
IN THE LAST 31 MONTHS 113 NET TONNES HAS LEFT THE COMEX.
THE GOLD COMEX IS NOW IN STRESS AS
1. GOLD IS LEAVING THE COMEX
2. GOLD IS LEAVING THE REGISTERED CATEGORY OF THE COMEX.
end
And now for silver
AND NOW THE DELIVERY MONTH OF APRIL
INITIAL standings/SILVER
APRIL 29 2019
Silver
Ounces
Withdrawals from Dealers Inventory
NIL oz
Withdrawals from Customer Inventory
31,753.042oz
cnt
DELAWARE
Deposits to the Dealer Inventory
nil oz
Deposits to the Customer Inventory
21,913.462 oz
Int Delaware
No of oz served today (contracts)
0
CONTRACT(S)
(NIL OZ)
No of oz to be served (notices)
0 contracts
NIL oz)
Total monthly oz silver served (contracts)
775 contracts
3,875,000 oz)
Total accumulative withdrawal of silver from the Dealers inventory this month
NIL oz
Total accumulative withdrawal of silver from the Customer inventory this month
**
we had 0 inventory movement at the dealer side of things
total dealer deposits: nil oz
total dealer withdrawals: nil oz
we had 1 deposits into the customer account
into JPMorgan: nil
*** JPMorgan for most of 2017 and in 2018 has adding to its inventory almost every single day.
JPMorgan now has 149.469 million oz of total silver inventory or 48.80% of all official comex silver. (149 million/305 million)
into Int Delaware:: 21,913.462 oz
total customer deposits today: 21,913.462 oz
we had 2 withdrawals out of the customer account:
i) Out of CNT: 24,868.052 oz
ii) Out of Delaware: 6884.990 oz
total withdrawals: 31,753.042 oz
we had 0 adjustments..
total dealer silver: 91.518 million
total dealer + customer silver: 307.050 million oz
The total number of notices filed today for the APRIL 2019. contract month is represented by 0 contract(s) FOR nil oz
To calculate the number of silver ounces that will stand for delivery in APRIL, we take the total number of notices filed for the month so far at 775 x 5,000 oz = 3,875,000 oz to which we add the difference between the open interest for the front month of APRIL. (0) and the number of notices served upon today (0 x 5000 oz) equals the number of ounces standing.
.
Thus the INITIAL standings for silver for the APRIL/2019 contract month:775(notices served so far)x 5000 oz + OI for front month of APRIL( 0) -number of notices served upon today (0)x 5000 oz equals 3,875,000 oz of silver standing for the APRIL contract month. This is a strong number of oz standing for an off delivery month.
We gained 0 contracts or an nil will stand at the comex as these guys refused to morph into London based forwards as well as negating a fiat bonus.
FOR COMPARISON VS LAST YEAR:
ON FIRST DAY NOTICE MARCH 29/2018: WE HAD 1,805,000 OZ STAND FOR DELIVERY FOR THE APRIL 2018 DELIVERY MONTH
AT CONCLUSION OF APRIL 2018: 2,485,000 OZ STOOD FOR DELIVERY AS QUEUE JUMPING WAS ALREADY WELL DEVELOPED IN SILVER. (APRIL IS A NON ACTIVE SILVER DELIVERY MONTH)
ON FIRST DAY NOTICE APRIL 30/2018 (FOR THE MAY 2018 CONTRACT MONTH) WE HAD 24.11 MILLION OZ STAND FOR DELIVERY. BY MONTH END WE HAD HUGE QUEUE JUMPING AND THUS 36.285 MILLION OZ EVENTUALLY STOOD FOR DELIVERY.
ON APRIL 27.2018 WE HAD A LARGE 14,230 OPEN INTEREST CONTRACTS STILL LEFT TO BE SERVED WITH 1 TRADING SESSION TO GO/ VS TODAY, APRIL 29.2019: 13,767 CONTRACTS//1 TRADING SESSIONS.
TODAY’S ESTIMATED SILVER VOLUME: 81,699 CONTRACTS (it will go higher on confirmation)
CONFIRMED VOLUME FOR YESTERDAY: 133,684 CONTRACTS..( we had huge liquidation of our spreaders//)
..
YESTERDAY’S CONFIRMED VOLUME OF 133,684 CONTRACTS EQUATES to 668 million OZ 95.4% OF ANNUAL GLOBAL PRODUCTION OF SILVER
COMMODITY LAW SUGGESTS THAT OPEN INTEREST SHOULD NOT BE MORE THAN 3% OF ANNUAL GLOBAL PRODUCTION. THE CROOKS ARE SUPPLYING MASSIVE PAPER TRYING TO KEEP SILVER IN CHECK.
The record level of silver open interest is 234,787 contracts set on April 21./2017 with the price at that day at $18.42
The previous record was 224,540 contracts with the price at that time of $20.44
1. Sprott silver fund (PSLV): NAV RISES TO -3.77% (APRIL 29/2019)
2. Sprott gold fund (PHYS): premium to NAV RISES TO -1.76% to NAV (APRIL 29/2019 )
Note: Sprott silver trust back into NEGATIVE territory at -3.77%-/Sprott physical gold trust is back into NEGATIVE/
(courtesy Sprott/GATA)
3.SPROTT CEF.A FUND (FORMERLY CENTRAL FUND OF CANADA):
NAV 12.83TRADING 12.28/DISCOUNT 4.31
END
And now the Gold inventory at the GLD/
APRIL 29/WITH GOLD DOWN $7.00: NO CHANGE IN GOLD INVENTORY AT THE GLD//INVENTORY RESTS AT 746.69 TONNES
APRIL 26/WITH GOLD UP $9.2//ANOTHER BIG CHANGE IN GOLD INVENTORY AT THE GLD; A WITHDRAWAL OF 1.18 TONNES OF GOLD FROM THE GLD.//INVENTORY LOWERS TO 746.69 TONNES TONNES
APRIL 25//WITH GOLD UP $.05 TODAY (BASICALLY FLAT) NO CHANGES IN GOLD INVENTORY AT THE GLD/INVENTORY RESTS AT 747.87 TONNES
APRIL 24 WITH GOLD UP $6.00 TODAY// TWO TRANSACTIONS: 1)A HUGE WITHDRAWAL OF 2.05 TONNES FROM THE GLD AND THEN II) ANOTHER WITHDRAWAL OF 1.76 TONNES//INVENTORY RESTS AT 747.87 TONNES
APRIL 23./WITH GOLD DOWN $4.45 TODAY: NO CHANGES AT THE GLD/INVENTORY RESTS AT 751.68 TONNES//
APRIL 22/WITH GOLD UP $1.75//A SMALL WITHDRAWAL OF .59 TONNES OF GOLD FROM THE GLD INVENTORY//INVENTORY RESTS AT 751.68 TONNES
APRIL 18/WITH GOLD DOWN $.45 TODAY: NO CHANGE IN GOLD INVENTORY AT THE GLD/INVENTORY RESTS AT752.27 TONNES
APRIL 17/WITH GOLD DOWN $0.10 TODAY: ANOTHER HUGE WITHDRAWAL OF 1.76 TONNES AT THE GLD WHICH WAS USED IN YESTERDAY’S RAID/INVENTORY RESTS AT 752.27 TONNES
APRIL 16/WITH GOLD DOWN $13.60 TODAY: A HUGE WITHDRAWAL OF 3.82 TONNES AT THE GLD/INVENTORY RESTS AT 754.03
APRIL 15/WITH GOLD DOWN $3.70 TODAY: NO CHANGES IN GOLD INVENTORY AT THE GLD/INVENTORY RESTS AT 757.85 TONNES
APRIL 12/WITH GOLD UP $2.10 TODAY:NO CHANGE IN GOLD INVENTORY AT THE GLD/INVENTORY RESTS AT 757..85 TONNES
APRIL 11/WITH GOLD DOWN $19.85 TODAY: NO CHANGE IN GOLD INVENTORY AT THE GLD/INVENTORY RESTS AT 757.85 TONNES
APRIL 10/WITH GOLD UP $5.45 AGAIN TODAY, THE CROOKS AGAIN RAIDED THE COOKE JAR BY 2.64 TONNES/INVENTORY RESTS AT 757.85 TONNES
APRIL 9/WITH GOLD UP AGAIN BY $6.40/THE CROOKS RAIDED THE COOKIE JAR AGAIN BY 1.18 TONNES/INVENTORY RESTS AT 760.49 TONNES
APRIL 8/WITH GOLD UP AGAIN BY $6.40: THE CROOKS RAIDED THE COOKIE JAR AGAIN BY .88 TONNES//INVENTORY RESTS TONIGHT AT 761.67 TONNES.
APRIL 5/WITH GOLD UP$1.35: ANOTHER WITHDRAWAL OF 1.74 TONNES OF PHYSICAL GOLD FROM THE GLD INVENTORY: INVENTORY RESTS AT 762.55 TONNES
APRIL 4/WITH GOLD DOWN 90 CENTS TODAY: NO CHANGES IN GOLD INVENTORY AT THE GLD/INVENTORY RESTS AT 764.29 TONNES
APRIL 3:WITH GOLD DOWN 20 CENTS: ANOTHER WHOPPER OF A WITHDRAWAL: 3.81 TONNES FROM THE GLD//INVENTORY RESTS AT 764.29 TONNES
APRIL 2//WOW! WE LOST A WHOPPING 16.16 TONNES OF GOLD WITH A RISE IN PRICE OF $1.80//INVENTORY RESTS AT 768.10
APRIL 1/WITH GOLD DOWN $3.80: NO CHANGE IN GOLD INVENTORY AT THE GLD/INVENTORY REMAINS AT 784.26 TONNES
MARCH 29/WITH GOLD UP $2.70 TODAY: NO CHANGES IN GOLD INVENTORY AT THE GLD/INVENTORY RESTS AT 784.26 TONNES
MARCH 28/WITH GOLD DOWN $20.60: NO CHANGE IN GOLD INVENTORY AT THE GLD/INVENTORY RESTS AT 784.26 TONNES
MARCH 27/SURPRISING! WITH GOLD DOWN AGAIN BY $4.05, THE CROOKS NEEDED TO PUT GOLD BACK INTO THE GLD: THEY ADDED 3.23 TONNES OF GOLD INTO THE GLD//INVENTORY RESTS AT 784.26 TONNES
MARCH 26/WITH GOLD DOWN $7.30 TODAY: NO CHANGES IN GOLD INVENTORY AT THE GLD/INVENTORY RESTS AT 781.03 TONNES
MARCH 25/WITH GOLD UP $9.85: A STRONG 2.94 TONNES DEPOSIT INTO THE GLD/INVENTORY RESTS AT 781.03 TONNES
MARCH 22/WITH GOLD UP $5.00 TODAY: NO CHANGE IN GOLD INVENTORY AT THE GLD/INVENTORY RESTS AT 778.09 TONNES
MARCH 21/WITH GOLD UP $7.00 TODAY: NO CHANGE IN GOLD INVENTORY AT THE GLD/INVENTORY RESTS AT 778.09 TONNES
March 20/WITH GOLD DOWN $5.15 TODAY: NO CHANGE IN GOLD INVENTORY AT THE GLD/INVENTORY RESTS AT 778.09 TONNES
xxxxxxxxxxxxxxxxxxxxxxxxxxxxxxxxxx
APRIL 29/2019/ Inventory rests tonight at 746.69 tonnes
*IN LAST 588 TRADING DAYS: 18.28 NET TONNES HAVE BEEN REMOVED FROM THE GLD
*LAST 488 TRADING DAYS: A NET 21.44 TONNES HAVE NOW BEEN LOST INTO THE GLD INVENTORY.
WE MUST BE GETTING CLOSER TO THE BOTTOM OF THE BARREL FOR PHYSICAL GOLD AT THE GLD.
end
Now the SLV Inventory/
APRIL 29/ WITH SILVER DOWN 13 CENTS TODAY: NO CHANGE IN SILVER INVENTORY AT THE SLV/INVENTORY RESTS AT 311.979 MILLION OZ.
APRIL 26//WITH SILVER UP 12 CENTS TODAY: NO CHANGE IN SILVER INVENTORY AT THE SLV/INVENTORY RESTS AT 311.979 MILLION OZ//
APRIL 25/WITH SILVER DOWN 4 CENTS TODAY: NO CHANGES IN SILVER INVENTORY AT THE SLV/INVENTORY RESTS AT 311.979 MILLION OZ///
APRIL 24/WITH SILVER UP 15 CENTS TODAY: NO CHANGES IN SILVER INVENTORY AT THE SLV/INVENTORY RESTS AT 311.979 MILLION OZ//
APRIL 23./WITH SILVER DOWN 21 CENTS TODAY: NO CHANGES IN SILVER INVENTORY AT THE SLV/INVENTORY RESTS AT 311.979 MILLION OZ///
APRIL 22/WITH SILVER UP 4 CENTS TODAY; NO CHANGE IN SILVER INVENTORY AT THE SLV/INVENTORY RESTS AT 311.979 MILLION OZ///
APRIL 18/WITH SILVER FLAT TODAY: A SHOCKING 2.8122 MILLION PAPER OZ WERE ADDED INTO SLV INVENTORY: INVENTORY RESTS AT 311.979 MILLION OZ/
APRIL 17/WITH SILVER UP ONE CENT TODAY; NO CHANGES IN SILVER INVENTORY AT THE SLV/INVENTORY RESTS AT 309.167 MILLION OZ///
APRIL 16/WITH SILVER DOWN 3 CENTS TODAY: NO CHANGES IN SILVER INVENTORY AT THE SLV/INVENTORY RESTS AT 309.167 MILLION OZ//
APRIL 15: WITH SILVER DOWN ONE CENT TODAY: A SMALL CHANGE IN SILVER INVENTORY AT THE SLV: A WITHDRAWAL OF 750,000 OZ//INVENTORY RESTS AT 309.167 MILLION OZ.
APRIL 12 WITH SILVER UP 11 CENTS TODAY: NO CHANGE IN SILVER INVENTORY AT THE SLV/INVENTORY RESTS AT 309.917 MILLION OZ.
APRIL 11/WITH SILVER DOWN 37 CENTS TODAY: A DEPOSIT OF 750,000 OZ INTO THE SLV/INVENTORY RESTS AT 309.917 MILLION OZ//
April 10/WITH SILVER UP 4 CENTS TODAY: NO CHANGES IN SILVER INVENTORY AT THE SLV/INVENTORY RESTS AT 309.167 MILLION OZ.
APRIL 9/WITH SILVER DOWN ONE CENT: NO CHANGES IN SILVER INVENTORY AT THE SLV.INVENTORY RESTS AT 309.167 MILLION OZ///
APRIL 8/WITH SILVER UP 14 CENTS TODAY: NO CHANGES IN SILVER INVENTORY AT THE SLV.INVENTORY RESTS AT 309.167 MILLION OZ///
APRIL 5/WITH SILVER DOWN 2 CENTS: NO CHANGES IN SILVER INVENTORY: THE CROOKS CANNOT RAID ANY SILVER BECAUSE THERE IS NONE: INVENTORY RETS AT 309.167 MILLION OZ//
APRIL 4/WITH SILVER FLAT TODAY; NO CHANGES IN SILVER INVENTORY AT THE SLV/INVENTORY RESTS AT 309.167 MILLION OZ/
APRIL 3/WITH SILVER UP TWO CENTS TODAY: NO CHANGES IN SILVER INVENTORY AT THE SLV/INVENTORY RESTS AT 309.167 MILLION OZ/
APRIL 2/ WITH SILVER DOWN ONE CENT TODAY: A SMALL WITHDRAWAL OF 134,000 OZ FROM THE SLV TO PAY FOR FEES/INVENTORY RESTS AT 309.167
APRIL 1/WITH SILVER DOWN ONE CENT TODAY: A SMALL WITHDRAWAL OF 656,000 OZ FROM THE SLV/INVENTORY RESTS AT 309.301 MILLION OZ//
MARCH 29/WITH SILVER UP 12 CENTS TODAY: NO CHANGES IN SILVER INVENTORY AT THE SLV/INVENTORY RESTS AT 309.957 MILLION OZ/
MARCH 28/WITH SILVER DOWN 31 CENTS TODAY: A BIG CHANGES IN SILVER INVENTORY AT THE SLV: A DEPOSIT OF 469,000 OZ INTO THE SLV INVENTORY//INVENTORY RESTS AT 309.957 MILLION OZ/
MARCH 27/WITH SILVER DOWN 12 CENTS; NO CHANGES IN SILVER INVENTORY AT THE SLV/INVENTORY RESTS AT 309.488 MILLION OZ//
MARCH 26/WITH SILVER DOWN 13 CENTS TODAY: NO CHANGES IN SILVER INVENTORY AT THE SLV/INVENTORY RESTS AT 309.488 MILLION OZ//
MARCH 25/WITH SILVER UP 15 CENTS TODAY: NO CHANGES IN SILVER INVENTORY AT THE SLV/INVENTORY RESTS AT 309.488 MILLION OZ////
MARCH 22/WITH SILVER DOWN 7 CENTS TODAY: A BIG CHANGES IN SILVER INVENTORY AT THE SLV: A WITHDRAWAL OF 1.356 MILLION OZ///INVENTORY RESTS AT 309.488 MILLION OZ///
MARCH 21/WITH SILVER UP 15 CENTS TODAY: NO CHANGES IN SILVER INVENTORY AT THE SLV/INVENTORY RESTS AT 310.848 MILLION OZ/
March 20/WITH SILVER DOWN 4 CENTS TODAY: NO CHANGES IN SILVER INVENTORY//INVENTORY RESTS AT 310.848 MILLION OZ//
APRIL 29/2019:
Inventory 311.979 MILLION OZ
LIBOR SCHEDULE AND GOFO RATES:
THE RISE IN LIBOR IS CREATING A SCARCITY OF DOLLARS BECAUSE FOREIGN EXCHANGE SWAPS (COSTS) ARE SIMPLY PROHIBITIVE
YOUR DATA…..
6 Month MM GOFO 2.13/ and libor 6 month duration 2.62
Indicative gold forward offer rate for a 6 month duration/calculation:
G0LD LENDING RATE: + .51/
XXXXXXXX
12 Month MM GOFO
+ 2.46%
LIBOR FOR 12 MONTH DURATION: 2.72
GOFO = LIBOR – GOLD LENDING RATE
GOLD LENDING RATE = +.26
end
PHYSICAL GOLD/SILVER STORIES
end
i) GOLDCORE BLOG/Mark O’Byrne
Death of Infl
GATA STORIES WITH RESPECT TO GOLD/PRECIOUS METALS.
A central bank is seeking gold through the Comex via the EFP’s.
(courtesy Andrew Maguire/Kingworldnews?GATA)
A central bank is seeking gold through Comex ‘exchange for physicals,’ Maguire tells KWN
Submitted by cpowell on Sat, 2019-04-27 00:50. Section: Daily Dispatches
8:45p ET Friday, April 26, 2019
Dear Friend of GATA and Gold:
In an interview today with King World News, London metals trader Andrew Maguire says a central bank is seeking to acquire gold with the mysterious “exchange for physicals” mechanism by which gold futures contracts on the New York Commodities Exchange appear to be transferred to London for delivery without any actual delivery ever being made there.
Maguire insists that the physical gold market is beginning to discipline the paper market, where price smashdowns have been frequent lately but of less lasting effect than in the past.
CHRIS POWELL, Secretaty/Treasurer
Gold Anti-Trust Action Committee Inc. CPowell@GATA.org
end
The Russian Central banker Elvira is one smart cookie. She no doubt distrusts the dollar and that is why she is buying gold with reckless abandon
(courtesy CNBC/GATA)
Russia gains gold to diversify reserves, not to distrust dollar, central banker says
Submitted by cpowell on Sat, 2019-04-27 00:59. Section: Daily Dispatches
By Matt Clinch
CNBC, New York
Friday, April 26, 2019
Russia’s gold-buying surge over the past year is simply down to a wish to diversify its portfolio of reserves, the central bank governor told CNBC today.
The country overtook China last year to become the world’s fifth largest official sector holder of gold. The central bank bought 8.8 million troy ounces of bullion last year, beating a record 7.2 million ounces set in 2017, and fresh data continues to show that the buying hasn’t stopped.
…
Experts have speculated that Western sanctions could have caused the move, with the safe-haven asset being exempt from any possibility of blacklisting. Others suggest Russia wants to reduce its reliance on the U.S. dollar, or is shying away from the euro or the pound, which have seen their values fall due to policy easing and Brexit, respectively.
But Elvira Nabiullina, the governor of Russia’s central bank, told CNBC’s Geoff Cutmore in Moscow that “diversification” was the key reason behind the purchases, not a lack of trust for any specific currency. …
GATA is a civil rights and educational organization based in the United States and tax-exempt under the U.S. Internal Revenue Code. Its e-mail dispatches are free, and you can subscribe at:
One of great commissioners of the CFTC and a good friend, passes away at the age of 58 due to a “sudden illness”
(courtesy GATA)
Former CFTC Commissioner Bart Chilton, lately TV news show host, dies at 58 after ‘sudden illness’
Submitted by cpowell on Sun, 2019-04-28 04:10. Section: Daily Dispatches
Chilton arranged for GATA to testify at the U.S. Commodity Futures Trading Commission’s hearing on the monetary metals markets in 2010 and wanted the commission to investigate manipulation of those markets.
* * *
‘Boom Bust’ Host, Former CFTC Commissioner Bart Chilton, dies at Age 58
From Russia Today, Moscow
Saturday, April 27, 2019
With great sorrow, we announce that our beloved colleague Bart Chilton has passed away at age 58 after a sudden illness.
Our friend Bart brought a unique combination of passion for business and extensive experience in the sphere of finance to his role as host of signature financial show, “Boom Bust,” elevating the content and profile to a new level, making it one of the most popular programs on RT America.
…
His trademark show opening, “Let’s go!” was a perfect expression of his enthusiasm and drive to constantly do more and learn more.
Since the first day he walked into our newsroom — tall, with a distinctive white mane, trademark cowboy boots, and his enchanting smile — Bart started making friends. We soon felt that he belonged with us. He became a member of our team and a part of us.
Bart always seemed to project a strong, quiet sense of dignity, and treated every person he met with respect, nomatter what their position, status, or age. He was one of those people who won hearts without saying a word.
His friends and colleague knew him as an overachiever. Prior to his TV career, Bart Chilton was commissioner at the U.S. Commodity Futures Trading Commission from 2007 to 2014. At the commission he headed the Energy and Environmental Advisory Committee and the Global Markets Advisory Committee.
He served on multiple local, federal, and presidential campaigns, the Obama presidential transition team, and in the U.S. House, Senate, and executive branch offices. His subject matter expertise spanned from politics and policy — specifically U.S. and global financial markets, agricultural, energy and the environment, and transportation — to music, movies, and pop culture.
Commissioner Chilton was known for his individualistic approach to financial regulation, his myriad media appearances, speeches, and frequent opinion editorials. From 1995 to 2001 Commissioner Chilton was a political appointee of President Bill Clinton, rising to deputy chief of staff to U.S. Agriculture Secretary Dan Glickman.
* * *
* * *
Maguire explains how the Comex is designed for market rigging and that it is about to end as a sovereign wishes to attack the comex for its precious metal//gold.
Maguire explains how Comex is designed for metals market rigging, expects silver to pop back up soon
Submitted by cpowell on Sat, 2019-04-27 15:48. Section: Daily Dispatches
11:45a ET Saturday, April 27, 2019
Dear Friend of GATA and Gold:
In his new interview with King World News, London metals trader Andrew Maguire details how the rules of the New York Commodities Exchange were designed to prevent ordinary futures traders from taking advantage of the market-rigging facilities of the bullion banks. He also explains why he thinks silver prices will shoot back up soon. The interview is 22 minutes long and can be heard at KWN here:
CHRIS POWELL, Secretary/Treasurer
Gold Anti-Trust Action Committee Inc. CPowell@GATA.org
end
Chris Powell highlights is gold’s deliverance is at hand with the revelation that a sovereign is after gold at thecomex.
(Chris Powell/GATA)
Could gold’s day of deliverance be at hand?
Submitted by cpowell on Sun, 2019-04-28 03:37. Section: Daily Dispatches
Get back to work. If it comes, you’ll notice.
* * *
11:48p ET Saturday, April 27, 2019
Dear Friend of GATA and Gold:
Does this weekend’s assertion on King World News by London metals trader Andrew Maguire that a central bank intends to acquire whatever gold remains at the New York Commodities Exchange —
— mean the end of the international gold price suppression policy?
Any central bank with substantial financial resources indeed could make trouble for the policy, since not much gold ever seems to be immediately available through the Comex. But don’t bet your life that Maguire’s story begins the countdown to the day of deliverance — if only because, like many involved with GATA, you may already have bet too much that the day of deliverance will come in your lifetime.
Here are a few cautionary thoughts.
Maguire is as sharp and experienced as they come in the monetary metals business, is supremely well-informed, and has done heroic service in fighting price suppression policy and exposing its tactics in the futures and over-the-counter markets. But are his sources telling him the truth? Or are they telling him what they would like the world to think, or using him to send a threat that may not be fulfilled?
For a few years now central banks have turned from net gold sellers to net gold buyers, announcing their purchases with some frequency, without exploding suppression policy and without reversing the trend of the gold price, which has been downward since 2011.
Prior to April 2013 many financial analysts were writing that China’s steady acquisitions had placed a put under the gold price. But the smashdown in gold in that month, obviously a coordinated intervention by central banks, vaporized the idea of a Chinese put. China’s foreign exchange reserves, the world’s largest, enable China to control any market, and the April 2013 smashdown could not have succeeded without China’s assent.
The U.S. economists Paul Brodsky and Lee Quaintance hypothesized in 2012 that most central banks, including those acquiring gold, were participating in suppression policy because its objective is to let central banks reacquire gold cheaply in a redistribution of world gold reserves in favor of central banks whose foreign exchange reserves are held disproportionately in U.S. dollars, which central banks figure must be devalued. Upon completion of that redistribution and the dollar’s devaluation, Brodsky and Quaintance predicted, central banks would reliquefy themselves by revaluing gold dramatically upward:
The Brodsky-Quaintance hypothesis fits the facts and was reiterated if without attribution seven weeks ago by a surprisingly candid report in the Italian newspaper It Sole / 24 Ore:
Also more or less confirming that all major central banks have been participating in gold price suppression was a speech given in 2005 by the head of the monetary and economic department of the Bank for International Settlements, William R. White. He told a conference at BIS headquarters in Basel, Switzerland, that among the five most important objectives of central bank cooperation is “the provision of international credits and joint efforts to influence asset prices (especially gold and foreign exchange) in circumstances where this might be thought useful.”
That is, rigging the gold and currency markets is simply what modern central banking does:
So a central bank’s move on the Comex gold futures market, a primary mechanism of price suppression, would suggest that central bank cooperation was weakening if not coming apart.
But even if such a move is underway, it well might be resisted for a long time with countermeasures by other central banks and governments.
Vaulting the gold of many other countries, the United States and United Kingdom have access to plenty of metal that might be thrown at the Comex to repel an attack, at least for a while. The Bank of England already has essentially confiscated Venezuelan gold reserves at the request of the United States:
If such countermeasures seemed likely to fail, they might be backed up by more of the economic warfare the United States is already waging against much of the world, weaponizing the dollar, the world reserve currency, more than ever before.
GATA has been documenting international gold price suppression policy for almost 20 years —
— and while it has been an amazing education — the secret knowledge of the financial universe, actually — it is also the study of a cosmic injustice, the daily triumph of totalitarian imperialism. So no one could wish for the policy to explode more than GATA does. We would like to turn our lives to something else — if only flying saucers, Bigfoot, or the search for D.B. Cooper.
For many years we have thought that gold price suppression policy’s implementation through market intervention could not get more obvious, and yet it has gotten more obvious almost every week, still with not a peep of complaint or even curiosity from the monetary metals mining industry or mainstream financial news organizations.
In that respect GATA has been a humiliating failure.
So while we hope for victory and expect that the ascent of man will continue through the centuries ahead, we don’t predict or promise victory, just persistence, figuring that, as Lee Strasberg’s Hyman Roth tells Al Pacino Michael Corleone in the second “Godfather” movie, “This is the business we’ve chosen”:
Whenever gold price suppression policy blows up or is changed — whether it happens Sunday night, or next year, or 10 years on, or longer — if you’re still alive, you’ll notice.
CHRIS POWELL, Secretary/Treasurer
Gold Anti-Trust Action Committee Inc. CPowell@GATA.org
* * *
Help keep GATA going
GATA is a civil rights and educational organization based in the United States and tax-exempt under the U.S. Internal Revenue Code. Its e-mail dispatches are free, and you can subscribe at:
No one in authority helped the monetary metals cause as much as Bart Chilton did
Submitted by cpowell on Mon, 2019-04-29 01:35. Section: Daily Dispatches
9:36p ET Sunday, April 28, 2019
Dear Friend of GATA and Gold:
While the former member of the U.S. Commodity Futures Trading Commission, Bart Chilton, disappointed some monetary metals investors, he was a hero to GATA for several reasons.
First, he forced the commission to take public testimony from GATA Chairman Bill Murphy and GATA Director Adrian Douglas at the commission’s much-publicized hearing on the monetary metals markets in March 2010. This brought national attention to our issue.
…
Second, he repeatedly gave credence in public to complaints of manipulation of the gold and silver markets.Third, he conscientiously answered mail from ordinary investors and others.
Fourth, he saw his responsibility to represent the producing classes against the financial class, which has taken over the country and the world.
And fifth, he did what he could to legitimize the market manipulation issue without violating what he understood as the confidentiality requirements of a regulatory agency.
No one in any official position has done more than that during GATA’s campaign against surreptitious market rigging by governments and their agents.
Bloomberg News has produced a news obituary for Chilton here:
Three weeks before Chilton died your secretary/treasurer e-mailed him to try to pin him down about something he had been hinting at, a question the CFTC has refused to answer for GATA and U.S. Rep. Alex Mooney, R-West Virginia.
Could Chilton, your secretary/treasurer asked, say whether manipulative futures trading undertaken directly or indirectly by the U.S. government is subject to the CFTC’s jurisdiction, or is it legal?
Uncharacteristically Chilton did not acknowledge the inquiry — which may have been as dispositive an answer as the CFTC’s refusal to answer.
By virtue of his work on the CFTC Chilton surely knew the answer, which would explain why the commission looks away from even the most blatant manipulations of the monetary metals markets. We can only hope that his knowing the answer and his willingness to hint at it had nothing to do with the “sudden illness” to which his death is being attributed. But the world is full of evil governments and evil financial institutions.
CHRIS POWELL, Secretary/Treasurer
Gold Anti-Trust Action Committee Inc. CPowell@GATA.org
* * *
Help keep GATA going:
GATA is a civil rights and educational organization based in the United States and tax-exempt under the U.S. Internal Revenue Code. Its e-mail dispatches are free, and you can subscribe at:
Bart Chilton, arguably the most famous CFTC commissioner who on various occasions vowed to crack down (unsuccessfully) on precious metals and VIX manipulation, who called for cryptocurrency regulation, and who sported shoulder-length silver hair and wore cowboy boots during his frequent TV appearances, has died “after a sudden illness”, RT reports. He was only 58.
Chilton, who most recently was an op-ed writer for Forbes and had his own daily business and finance television show “Boom Bust with Commissioner Bart Chilton on RT America” spent a career in government during the Clinton, Bush and Obama Administrations, on Capitol Hill as a senior staffer in the House and Senate, concluding as a CFTC financial regulator between 2007 and 2014 where he repeatedly railed against precious metal manipulation and called for appropriate regulation of crypto currencies. In his own words, “I’ve always looked out for average folks and spoken my mind.”
At the CFTC, he headed the Energy and Environmental Advisory Committee and the Global Markets Advisory Committee. He has served on multiple local, federal and presidential campaigns, the Obama presidential transition team, and in the US House, Senate, and Executive branch. His subject matter spanned from politics and policy – specifically US and global financial markets, agricultural, energy and the environment, and transportation – to music, movies, and pop culture. Commissioner Chilton was known for his individualistic approach to financial regulation, his myriad media appearances, speeches, and frequent opinion editorials. From 1995 to 2001, Commissioner Chilton was a political appointee of President Bill Clinton, rising to Deputy Chief of Staff to US Secretary of Agriculture Dan Glickman.
“We remember his intelligence, his compassion, his joyful laughter. With his passing, nothing could fill the void in our newsroom, nor the space Bart held in our hearts,” said Mikhail Solodovnikov, RT America’s News Director. “We will seek solace, and honor his memory, by delivering the best news content to our viewers, with the dedication and diligence that is the hallmark and legacy of our friend Bart Chilton.”
Our News Team expresses deepest condolences to Bart’s wife, Sherry.
Over the years, Zero Hedge had repeatedly covered Chilton’s seemingly sole attempts to crackdown on precious metals regulation, often critically, as in the end he was unable to put an end to an activity that has subsequently cost banks billions in legal settlement fees. That said, Chilton was at least one of the few regulators to admit that Wall Street is rigged, most notably in his Christmas 2013 CFTC parting letter which we posted at the time, and which we excerpt from one last time.
* * *
While one may criticize now-ex CFTC commissioner Bart Chilton for years and years of sound and fury signifying nothing, countless promises of regulatory enforcement (all of which fell short of the target) and finally putting an end to precious metals manipulation only for the world to discover that while every other asset class is manipulated (involving such individuals as JPM’s chief currency dealer), gold and silver are exempt, one must admit the former regulator does have a way wtih words (and of course haircuts). Sure enough, Chilton’s most memorable parting gift will not be something he did, but rather what he said.
William Cohan memorializes his parting message: “As we long suspected, Wall Street continues to use every trick in its playbook to do whatever it can to eviscerate numerous post-financial-crisis rules. The arsenal includes high-powered lobbyists who outnumber lawmakers 10-to-1; $1,000-an-hour letter-writing lawyers who gain strength from negotiating over arcana; and the occasional hoodwinking of a president whose knowledge of the ways of finance are close to nil.”
Chilton’s take home message: “The lesson for me is: The financial sector is so powerful that they will roll things back over time,” Chilton says. “The Wall Street firms have tremendous influence, and they can impact policy to a greater degree than any one regulator or a small group of regulators can.”
What are Chilton’s other laments? Why being underfunded of course. Because if the CFTC only had more money, all would have been fixed.
In fiscal 2013, for example, the CFTC requested funding of $308 million and got only $195 million ($10 million less than the previous year) despite many new responsibilities. “There are crooks who are getting away with crimes because we don’t have the resources to go after them,” Chilton says. The SEC has a similar discrepancy between its appropriation and what it needs to fulfill legal mandates.
With its regulators overwhelmed and underfunded, Wall Street firms then move to the relentless negotiation stage. “As you try to deal with the regulatory agency,” he says of Wall Street, “the first thing you do is you say, ‘Well, would you exempt us?’ And when that doesn’t work, you try to ameliorate your regulation.” If that strategy fails, the industry defaults to litigation.
Chilton said he has noticed one additional tactic that Wall Street has been employing lately: stalling or thwarting nominees to regulatory agencies. The nomination of Timothy Massad, the U.S. Treasury Department official who managed the Troubled Asset Relief Program, to replace Gary Gensler as CFTC chairman came late in the year and a confirmation vote has now been delayed, probably to February 2014. That means further Dodd-Frank rule-writing and enforcement could be delayed, too, because only two of five commissioners will be seated and they would both have to agree to get anything done. “It’s a gift to Wall Street,” he said. “This is what they’ve been trying to do. They’ve been trying to stop Dodd-Frank.”
Chilton knows why Wall Street always seems to win. Financial-industry executives contribute more money “in every election, than any other sector, and they have made more profits in every single quarter since the fall of 2008 when many of them helped crash the economy,” he explains. “So while the rest of the nation is suffering still, and trying to get a leg up to get out of the ditch, the financial sector didn’t miss a beat.”
In case you didn’t catch Chilton’s meaning, here is the shorter version: Unless and until Wall Street’s disproportionate ability to bully Washington is curtailed, the rest of us will be held hostage to its agenda. For those interested in the fuller version, Chilton has been writing a book. Its working title: “Theft.”
One sure can’t say that those 30 years he spent in Washington of which nearly 7 years at the CFTC were lost on the Alexander Godunov lookalike: at least he figured out who runs the show.
END
Bill Murphy on the death of Bart Chilton…
Sunday…
*The stunning news today is that former CFTC Commissioner Bart Chilton died at the age of 58 from a “sudden illness.” It is really sad. Having met Bart personally in December of 2009 in Washington, D.C., I know he was one of the good guys. Bart assembled a government group to hear what GATA had to say about the manipulation of the gold and silver markets. Then in March of 2010 Bart arranged for me to speak on GATA’s behalf in front of a CFTC hearing on the monetary metals, which was televised on the internet.
There are no two ways around it. Bart’s death is something out of a conspiracy movie made for TV, or perhaps a Russian/North Korean spy movie. He was one of the very few out there in the government world that would give GATA’s price suppression viewpoints the light of day. And now he is dead.
Does anyone else, outside of Harvey Organ, even know another commissioner’s name? In our world it was Bart Chilton and nobody else.
Andrew Maguire had been in touch with Bart last week and said he was “fighting fit.” Andrew interviewed Bart in December and Bart pointed to JP Morgan as far as having a role in the manipulation issue. And now he is dead.
A coincidence? Nobody will probably ever know, but this is not the first mysterious death of someone going up against JPM. Was it a coincidence that my presentation at the CFTC hearing was the only one not televised, “due to technical difficulties?” Whatever suddenly happened to Bart, his demise will be food for the fodder mill for years to come. Very much a bummer anyway you look at it.
end
From my good friend: “J. Johnson” on Bart Chilton
Standing Against The Machine, and now RIP, Mr. Bart Chilton
I had posted a concern that Mr. Chilton should be placed under protective custody for his own safety after I heard his interview. Now he’s dead but his employment history he just walked us thru needs to be congressionally reviewed. Who was it that Mr. Chilton worked for that helped in this collusion that Bart may have viewed live? Good Ol’ Gary Gensler was there leading the regulatory body into questionable actions like the conversation GG had with a Senator over a weekend, that soon became the head of a collapsed commodity investment firm out there named MFGlobal. Not only was Gensler watching over the regulatory body, he was best friends with John Corzine who just so happened to be one of Obama’s greatest money finders during his run for presidency. We remember the accusation brought out during the Congressional Hearing and we also remember nothing being done after many of the MFG regulators claimed Corzine knew what he was doing using other people’s money to trade. We also remember Gary Gensler being very helpful when it came to voting in the Frank-Dodd act, now it’s time to review it all, criminally.
Sure we’ll leave room for Bart dying a natural death, but that interview was a major blow out against the regulatory body that has been used to protect the machine against the people the body was created to protect in the first place. This regulatory group needs to be fully and publicly exposed, including those that came in and left, to go back to the banks they worked for before they entered into the regulatory body. Not all are bad, but the few who are, need to be dragged out so the public can see the who/what/when/why/where it all leads to.
God Bless you Bart Chilton, to me you are an American Patriot! The rest of us, need to continue to pick apart the system that is coming down as we watch. It is happening ever so slowly, then all at once, like in the merging currencies! So keep your precious metals close, have a positive attitude no matter what, take more precious metals out of the system if you can, and as always …
Stay Strong!
J. Johnson
end
Due to the criminal conviction of trader Edmonds, the USA prosecution is seeking to halt the civil lawsuit. I was misinformed: all discoveries in a civil suit are public and because of that, the prosecution gives the defendants the right to plead the 5th if their testimony incriminates them
(courtesy zerohedge/Chris Powell)
US seeks halt in civil lawsuit accusing JP Morgan of manipulating metals market, citing criminal case
The U.S. wants a federal judge to halt a civil lawsuit accusing J. P. Morgan of manipulating precious metals markets. The Justice Department cited an ongoing criminal case as its reason for the request.
A former J. P. Morgan trader pleaded guilty in Connecticut last month to manipulation charges.
In the guilty plea, the trader said he had learned to make bogus trade orders from senior traders at the bank and that he used the strategy hundreds of times with the knowledge and consent of his immediate supervisors.
A sign of JP Morgan Chase Bank is seen in front of their headquarters tower in New York.
The Justice Department is asking a judge to put the brakes on a civil lawsuit against J. P. Morgan Chase, citing an ongoing probe into a “related criminal case” that involves alleged manipulation of precious metals markets.
The department wants a six-month postponement in the proceedings of the civil lawsuit, which was filed in 2015 by hedge fund manager Daniel Shak and two commodity traders. The government also says it could ask for a longer delay in the case, according to a court filing on Monday.
The move comes days after Shak’s lawyer, David Kovel, sought permission to reopen questioning of two former J. P. Morgan traders and the bank’s current global head of base and precious metals trading.
Kovel, in making the request with the Manhattan federal judge in the civil case, cited last month’s guilty plea by one of those former traders, John Edmonds, in federal court in Connecticut.
Edmonds admitted making bogus bids on precious metals contracts while working at the bank from 2009 to 2015.
Neither J. P. Morgan Chase nor Kovel’s clients have opposed the Justice Department’s request.
In arguing for a delay, the Justice Department said Shak’s lawsuit is “related” to Edmonds’ criminal case and that Edmonds has “pleaded guilty and acknowledged his own participation in such conduct, as well as that of other traders.”
“Edmonds awaits sentencing, but the broader investigation is ongoing,” the Justice Department said. The U.S. wants to delay the civil case “to protect the integrity of its ongoing criminal investigation,” it said.
J. P. Morgan did not respond to a request for comment by CNBC. Kovel declined to comment.
Tuesday night, after this story first was published, Judge Paul Engelmayer ordered the federal prosecutors to explain in detail by Monday why postponing proceedings in the civil lawsuit would not harm those involved, and why reopening questioning “would be detrimental to the Government’s ongoing criminal investigation.”
Englemayer also wrote that he regards Edmonds’ guilty plea “as potentially highly consequential” to the civil case.
In his guilty plea, the 36-year-old Edmonds said he had learned to make bogus trade orders from senior traders at the bank and that he used the strategy hundreds of times with the knowledge and consent of his immediate supervisors. He admitted to working with “unnamed co-conspirators” at J. P. Morgan, according to the Justice Department.
Kovel wants to question Edmonds again as well as Michael Nowak, the bank’s global head of base and precious metal trading, and former J. P. Morgan Chase Managing Director Robert Gottlieb. The three had previously answered questions under oath in the civil case.
Kovel said in court filings that Nowak was the immediate supervisor of Edmonds, while Gottlieb was Edmonds’ mentor.
In his prior deposition, Edmonds said that Gottlieb sat only a “couple feet” away from him for about five years, and that he was “somebody [he] looked up to in the business,” who helped guide and train him.
Nowak is described by Edmonds as his direct supervisor, with whom he would sometimes discuss trading strategies. Nowak was also the person responsible for overseeing the performance and risk of Edmonds’ portfolio, according to the deposition.
Edmonds also stated in his prior deposition that he would enter precious metals trades for both Nowak and Gottlieb, among others.
The civil lawsuit claims Shak and his fellow plaintiffs lost tens of millions of dollars as a result of actions by J. P. Morgan’s traders.
A federal judge tells traders that they can combine cases (with the other 6 banks) as they accused JPMorgan of rigging the precious metals market
(courtesy CNBC)
Federal judge tells traders they can combine cases accusing JP Morgan of rigging metals market
Litigation in a separate civil case has been put on hold until at least May at the behest of the Justice Department, which is investigating a “related criminal case” that involves alleged market manipulation by precious metals traders at J. P. Morgan.
Judge John Koeltl of the Southern District of New York appointed the White Plains, N.Y., law firm Lowey Dannenberg as interim lead counsel for the proposed class action.
Spencer Platt | Getty Images
A group of traders from across the U.S. who allege that J. P. Morgan Chase manipulated precious metals markets for years are one step closer to bringing a class action suit against the nation’s largest bank.
Earlier this month, a federal judge said five separate lawsuits making similar allegations against the bank could be combined, potentially including thousands of people who traded in the precious metals market from Jan. 2009 through Dec. 2015.
Litigation in a separate civil case has been put on hold until at least May at the behest of the Justice Department, which is investigating a “related criminal case” that involves alleged market manipulation by precious metals traders at J. P. Morgan.
J. P. Morgan declined to comment on this story.
Judge John Koeltl of the Southern District of New York appointed the White Plains, N.Y., law firm Lowey Dannenberg as interim lead counsel for the proposed class action.
Vincent Briganti, a partner at the firm, filed the first suit seeking class action status in November on behalf of Dominick Cognata, a trader who alleges he suffered losses due to J.P. Morgan’s illegal trading conduct in the silver and gold futures and options markets.
That was after the federal court in Connecticut unsealed a criminal plea agreement by John Edmonds, a former J.P. Morgan metals trader. In his guilty plea, Edmonds, who is 36-years old, admitted that he and other “unnamed co-conspirators” fraudulently manipulated the precious metals markets while they were employed at J. P. Morgan from 2009 to 2015.
Edmonds said he had learned the illegal trading tactics from senior traders, and then used them hundreds of times with the knowledge of and consent of his immediate supervisors.
Briganti’s lawsuit also names John Edmonds and a group of yet-to-be-identified precious metals traders and the bank as defendants.
On Wednesday, the lawyers sent a letter to Judge Koeltl saying they were having difficulty locating Edmonds to serve him legal papers and requested a 30-day extension to do so, which the judge granted on Thursday. Briganti noted that they have been in contact with Edmonds’ attorney in the criminal case. Edmonds’ attorney and Briganti could not be reached for comment.
“We are hopeful that this extension will result in completing service on Mr. Edmonds without formal motion practice and a request for alternative means of service,” Briganti said in the letter.
The next step in the civil case is for the plaintiffs to file an amended class action complaint and set a schedule for defendants to respond.
In addition to the proposed class action, J. P. Morgan also faces a separate civil suit which also accuses the bank of rigging precious metals markets.
end
March 4.2019
Parker City News
JP Morgan faces potential class action lawsuit after guilty pleas by a former metals trader
Traders from across the U.S. are banding together to accuse J. P. Morgan Chase of manipulating precious metals markets for years.
At least six lawsuits, all making similar allegations against the nation‘s largest bank, have been filed in New York federal court in the past month, since federal prosecutors in Connecticut with a former J. P. Morgan Chase metals trader.
The cases could potentially include thousands of people who traded in the precious metals market. The White Plains, N.Y., law firm Lowey Dannenberg is asking the court to combine the cases and name it as the lead.
The law firm‘s commodities group is led by Vincent Briganti, the attorney who filed the first lawsuit on behalf of Dominick Cognata, a New York resident who alleges he suffered losses due to J. P. Morgan‘s trading conduct in the silver and gold futures and options markets.
A combined case, seeking class action status, would include anyone who purchased or sold futures contracts or an option on NYMEX platinum or palladium or COMEX silver or gold between at least Jan. 1, 2009, and Dec. 31, 2015. The lawyers believe that “at least hundreds, if not thousands” of traders would be eligible to join the case.
Named as defendants in all of the lawsuits are John Edmonds, a 36-year old former metals trader at J. P. Morgan, a group of yet-to-be-identified precious metals traders and the bank.
Edmonds, a New York resident, pleaded guilty in October to one count of conspiracy to defraud the market and manipulate prices of precious metals futures contracts and one count of commodities fraud. In the criminal plea, Edmonds admitted that he and other “unnamed co- conspirators” at J. P. Morgan, fraudulently manipulated precious metals markets from 2009 to 2015, the same time frame covered in the class action suits.
Briganti filed the initial class action on Nov. 7, just one day after the Justice Department unsealed Edmonds‘ plea in the U.S. District Court of Connecticut.
Edmonds admitted in his guilty plea that he deployed the illegal trading scheme hundreds of times with the direct knowledge and consent of his immediate supervisors. Plaintiffs say they have suffered economic injury, including monetary losses, as a direct result of actions by Edmonds and the other unnamed J. P. Morgan metals traders in the futures and options contracts.
One of the suits alleges that “the number of unlawful trades that JP Morgan traders executed in precious metals futures markets is at least in the thousands.”
J. P. Morgan declined to comment. Lowey Dannenberg did not respond to a request for comment by CNBC.
The Justice Department‘s criminal investigation is still ongoing and recently caused a separate related civil case to be put on hold for at least six months while the government continues its investigation. That civil lawsuit, which also accuses J. P. Morgan of rigging the precious metals market, was filed in 2015 by hedge fund manager Daniel Shak and two commodity traders.
After reviewing the details of the plea agreement, David Kovel, the attorney for Shak‘s suit, sought to re- interview Edmonds, along with two other current and former senior traders at the bank. However, the government argued that reopening questioning would be detrimental to the ongoing criminal investigation. The federal judge overseeing the proceedings ordered a six-month stay in the civil case.
Kovel declined to comment.
Edmonds was originally scheduled to be sentenced in Hartford, Conn., on Wednesday, Dec. 19, but a court filing on Nov. 27 shows the sentencing has been postponed until June. A spokesman for the U.S. Attorney for Connecticut could not elaborate on why the sentencing was postponed since the court filing is under seal.
-END-
Justice Department stalls another class action in gold market rigging, this one against JPM
Submitted by cpowell on Tue, 2019-03-05 14:40. Section: Daily Dispatches
9:47a ET Tuesday, March 5, 2019
Dear Friend of GATA and Gold:
Proceedings in the federal class-action anti-trust lawsuit against JPMorganChase charging the investment bank with manipulating the gold and silver futures markets —
— have been suspended for three months at the request of the U.S. Justice Department, just as the department has arranged suspension of proceedings in the class-action anti-trust lawsuit against Deutsche Bank charging similar market manipulation.
…
In both cases the Justice Department has told U.S. District Court for the Southern District of New York that proceedings would jeopardize its criminal investigation into market rigging, which has been admitted by a former JPMorganChase trader, John Edmonds, who awaits sentencing.
According to court filings, the White Plains, New York, law firm representing the plaintiffs against JPMorganChase, Lowey Dannenberg, concurred in the government’s request to suspend proceedings. The stay is to continue for three months and may be extended.
The Justice Department’s motion, granted by the court on February 26 —
— said “the government is not seeking an open-ended stay that could indefinitely postpone this matter and thus jeopardize the parties’ interests in a timely resolution.” The motion added, “Any developments in the criminal case during the period the consolidated action is stayed may reduce or completely resolve the need to litigate certain issues in the consolidated action.”
Much of the Justice Department’s motion is redacted to conceal from the public evidence still under investigation. Edmonds has said he and other traders manipulated the gold and silver markets for years with the knowledge of their supervisors at JPMorganChase. In its motion to conceal that evidence, also granted by the court on February 26, the Justice Department said disclosure “could lead to destruction of evidence, flight from prosecution, and otherwise interfere with the government’s ability to conduct its investigation”:
Monetary metals investors may be skeptical of the Justice Department’s stalling the Deutsche Bank and JPMorganChase cases, since the department and the U.S. Commodity Futures Trading Commission do not seem ever to have responded conscientiously to complaints of gold and silver market rigging until the class actions commenced.
How much time will the court give the Justice Department to delay getting to the bottom of the issue? The court might hasten matters if enough monetary metals mining companies protested the harm done to them and their shareholders by market rigging, but of course most monetary metals mining companies don’t mind at all.
CHRIS POWELL, Secretary/Treasurer
Gold Anti-Trust Action Committee Inc. CPowell@GATA.org
* * *
endTwo important points: The UK seems to be shipping gold directly to China. Generally China takes kilobars but maybe they are refining their own bars. The second importan points is tiny Azerbaijan who liquidated all of its 32 tonnes of gold in 2016, had decided that they had better buy some of the gold back. They added 8 tones.(courtesy Lawrie Williams)
LAWRIE WILLIAMS: UK shipping gold direct to China – and Azerbaijan
London and the UK remains at the centre of the world’s gold trade – at least for now. Primarily it imports newly produced gold from a number of primary gold producers and then either holds it in vaults, or ships much of it to Switzerland for re-refining and onward delivery to the world’s primary consumer markets. But interestingly the latest gold export figures out of the UK show an export proportion directly to mainland China which, perhaps, is a counter to comparatively weak February export figures for Switzerland into China. Charts showing UK gold imports and exports for February from Nick Laird’s http://www.goldchartsrus.com service are shown below:
Regarding the gold import figures there are few surprises. Most of the major sources of the gold imports are significant gold mining nations or from countries like Switzerland, Japan and Hong Kong which have largish internal gold trading markets.
The major anomalies, though, come in the UK’s gold export figures for February, although the overall figure is quite low (well below the import figure) but this could relate to accounting periods and shipment dates. Nonetheless the biggest destination for UK gold exports that month was mainland China which took in 14.9 tonnes. That might be seen as surprising, but ties in with Chinese gold import figures overall and also with relatively high Shanghai Gold Exchange gold withdrawal figures in March.
Perhaps an even bigger surprise though was the volume of gold exports to tiny Azerbaijan. While exports of 8 tonnes may not be particularly significant in a global context, in the case of Azerbaijan it is a HUGE amount and could signify a big reboot for that country’s gold reserves. In recent years Azerbaijan has reported gold reserves of zero tonnes to the IMF, but does have a past history of holding gold. Back in 2016 it reportedly held 30.2 tonnes of gold but appears to have liquidated all these by 2017. Maybe the imports from the UK mean that the Azerbaijani central bank may have turned back to holding some gold in its forex reserve holdings, particularly as it is technically within the Russian sphere of influence and Russia has been the biggest expander of gold reserves over the past several years.
Azerbaijan’s biggest export is oil, but it is also a small gold producer with latest production estimates of around 6 tonnes a year (mostly produced by UK registered and AIM-quoted Anglo Asian Mining PLC and state-owned Azergold) – a significant amount in relation to the country’s oil dominated GDP of around 40 billion US dollars. It is believed that this gold is exported, primarily to Russia, but some could be going into forex reserves but that won’t be known unless, or until, the country reports its gold holdings to the IMF.
29 Apr 2019
-END-
* * *
Your early MONDAY morning currency, Asian stock market results, important USA/Asian currency crosses, gold/silver pricing overnight along with the price of oil Major stories overnight/9 AM EST
i) Chinese yuan vs USA dollar/CLOSED/ LAST AT: 6.7283/
//OFFSHORE YUAN: 6.7380 /shanghai bourse CLOSED DOWN 23.80 POINTS OR 0.77%
HANG SANG CLOSED UP 287,80 points or 0.97%
2. Nikkei closed
3. Europe stocks OPENED RED
USA dollar index RISES TO 98.03/Euro RISES TO 1.1154
3b Japan 10 year bond yield: FALLS TO. –.04/ !!!!(Japan buying 100% of bond issuance)/Japanese yen vs usa cross now at 111.75/ THIS IS TROUBLESOME AS BANK OF JAPAN IS RUNNING OUT OF BONDS TO BUY./JAPAN 10 YR YIELD IS NOW TARGETED AT .11%/JAPAN LOSING CONTROL OF THEIR BOND MARKET//CARRY TRADERS GETTING KILLED
3c Nikkei now JUST BELOW 17,000
3d USA/Yen rate now well below the important 120 barrier this morning
3e WTI:: 63.05 and Brent: 71.70
3f Gold DOWN/JAPANESE Yen DOWN CHINESE YUAN: ON -SHORE UP/OFF- SHORE: UP
3g Japan is to buy the equivalent of 108 billion uSA dollars worth of bond per month or $1.3 trillion. Japan’s GDP equals 5 trillion usa./“HELICOPTER MONEY” OFF THE TABLE FOR NOW /REVERSE OPERATION TWIST ON THE BONDS: PURCHASE OF LONG BONDS AND SELLING THE SHORT END
Japan to buy 100% of all new Japanese debt and by 2018 they will have 25% of all Japanese debt. Fifty percent of Japanese budget financed with debt.
3h Oil DOWN for WTI and DOWN FOR Brent this morning
3i European bond buying continues to push yields lower on all fronts in the EMU. German 10yr bund RISES TO –00%/Italian 10 yr bond yield DOWN to 2.57% /SPAIN 10 YR BOND YIELD DOWN TO 1.01%…ITALIAN 10 YR BOND YIELD/GERMAN BUND: 2.57: DANGEROUS FOR THE ITALIAN BANKING SYSTEM
3j Greek 10 year bond yield RISES TO : 3.31
3k Gold at $1280.80 silver at: 14.97 7 am est) SILVER NEXT RESISTANCE LEVEL AT $18.50
3l USA vs Russian rouble; (Russian rouble UP 15/100 in roubles/dollar) 64.64
3m oil into the 63 dollar handle for WTI and 71 handle for Brent/
3n Higher foreign deposits out of China sees huge risk of outflows and a currency depreciation. This can spell financial disaster for the rest of the world/
JAPAN ON JAN 29.2016 INITIATES NIRP. THIS MORNING THEY SIGNAL THEY MAY END NIRP. TODAY THE USA/YEN TRADES TO 111.75 DESTROYING JAPANESE CITIZENS WITH HIGHER FOOD INFLATION
30 SNB (Swiss National Bank) still intervening again in the markets driving down the SF. It is not working: USA/SF this morning 1.0199 as the Swiss Franc is still rising against most currencies. Euro vs SF is 1.1377 well above the floor set by the Swiss Finance Minister. Thomas Jordan, chief of the Swiss National Bank continues to purchase euros trying to lower value of the Swiss Franc.
3r the 10 Year German bund now NEGATIVE territory with the 10 year RISING to –0.00%
The bank withdrawals were causing massive hardship to the Greek bank. the Greek referendum voted overwhelming “NO”. Next step for Greece will be the recapitalization of the banks and that will be difficult.
4. USA 10 year treasury bond at 2.51% early this morning. Thirty year rate at 2.93%
5. Details Ransquawk, Bloomberg, Deutsche bank/Jim Reid.
6. TURKISH LIRA: UP TO 5.9327.. VERY DEADLY
US Futures Drift Lower As Chinese Stocks Extend Worst Drop Of 2019
US equity futures and European bourses drifted lower, failing to carry over Asian optimism into Monday trading, while Chinese stocks extended the worst weekly loss of 2019 with another 0.8% drop to start the week despite profits at Chinese industrial firms growing for the first time in four months and a strong GDP print, if only superficially, on Friday. Most European markets were mostly in the red, with Italy sliding despite S&P reaffirming Italy’s BBB rating late on Friday, while the dollar rose alongside US Treasury yields, while the yen slumped as Japan remains closed for a weeklong holiday.
The MSCI All-Country World Index was flat after the start of European trading, lifted higher by Asian markets (ex China) but pressured by poor European trading. After rising initially, the Stoxx 600 dropped to session lows while the Spain’s IBEX 35 index underperformed peers, down over half a percent after Prime Minister Pedro Sanchez overcame a challenge from nationalists in elections on Sunday. The elections had little immediate impact on the country’s bond market. Shares in Italian banks got a boost and Italian government bonds rallied after S&P Global affirmed Italy’s sovereign credit rating.
Also in Europe, the ECB reported that Eurozone credit growth decelerated markedly despite decent M3 growth, as loan growth to firms decreased to 3.5% in March from 3.8% in Feb, while loans to households stood at 3.2% in March, down from 3.3% in Feb.
Earlier in the session, a similar see-saw pattern was observed in Chinese stocks, which initially moved higher but closed near session lows, down 0.8% after losing 5.6% last week, the worst of 2019.
The latest Chinese data showed industrial profits grew in March after four months of contraction, but analysts said sentiment remained fragile. Economists polled by Reuters expect factory activity in the world’s second largest economy to grow at a steady but modest pace in April.
Australian shares were down 0.4% after hitting an 11-year closing high on Friday, while Seoul’s KOSPI was up 1.4 percent. While Japan’s cash markets are closed for a long national holiday this week, Nikkei 225 futures index in Singapore was 0.9% higher.
Emerging-market stocks headed for their biggest advance in almost two weeks and currencies traded stronger for a second day after the S&P 500 hit a record on Friday while the dollar rally cooled.
In currencies, with Japan on an extended break, currency markets were calm ahead of the FOMC meeting and U.S. jobs numbers. The dollar was 0.2 percent higher against the yen at 111.74, and the euro was up 0.1 percent at $1.1162. The dollar index, which tracks the greenback against a basket of six major rivals, slipped 0.03 percent to 97.985. South Africa’s rand led the gains, set for its best run in almost a month with elections approaching at the start of May. Turkey’s lira edged higher even as Goldman Sachs Group Inc. questioned the central bank’s credibility and predicted losses for the currency over the coming 12 months. The pound led Group-of-10 currency gains as some strategists predicted the Bank of England to adopt a slightly more hawkish tone at this week’s meeting. The euro held up and bunds slipped amid fading fears of political instability in Spain, with Pedro Sanchez set to return as prime minister after Sunday’s election saw the Socialists emerge as winners.
Monday’s directionless trading followed data showing U.S. gross domestic product grew at a 3.2% annualized rate in the first quarter, but the internals were far weaker. Nomura FX strategist Jordan Rochester noted last week’s U.S. GDP was driven by a surge in inventories, government spending, and a big contribution from net trade. “None of those are likely to be sustained, hence why market reaction was limited,” he said in a note to clients. “But overall, the past week has been dominated by higher U.S. equity prices and consequently a U.S. dollar outperformance story. In our view, this week should see a test of that new trend,” he said, referencing upcoming economic data this week.
Investors were mostly on the sidelines ahead of an event-packed week, and were looking forward to the latest Fed meeting and Chinese factory data for further clues on policy direction in the world’s biggest economies.
“For stock traders, it seems that the important catalysts are pointing higher: the U.S. sees strong domestic growth, low inflation keeps the Fed at bay and could potentially trigger a rate cut so it seems that equities have nowhere to go but higher – at least in the short term,” said Konstantinos Anthis, head of research at ADSS.
The March reading for core personal consumption expenditures (PCE), the Fed’s favored inflation measure, is due later on Monday. The central bank’s Federal Open Market Committee (FOMC) will announce its policy decision on Wednesday, with Chair Powell expected to balance the strong domestic growth data against persistent concerns over the global outlook. Markets will also be looking to global factory activity surveys this week, particularly official and private readings on Chinese manufacturing which will both be released on Tuesday.
Alphabet is the highlight of Monday’s earnings, with Spotify and NXP Semiconductors also reporting. Data on personal income and spending is due.
In commodities, oil prices fell, extending a slump from Friday that ended weeks of rallying, after President Donald Trump demanded that producer club OPEC raise output to soften the impact of U.S. sanctions against Iran. Brent crude fell half a percent to $71.80 per barrel. Spot gold was down 0.3 percent, trading at $1,281.81 per ounce
Market Snapshot
S&P 500 futures down 0.1% at 2,939
STOXX Europe 600 up 0.1% to 391.55
MXAP up 0.3% to 162.56
MXAPJ up 0.5% to 540.49
Nikkei down 0.2% to 22,258.73
Topix down 0.2% to 1,617.93
Hang Seng Index up 1% to 29,892.81
Shanghai Composite down 0.8% to 3,062.50
Sensex up 0.9% to 39,067.33
Australia S&P/ASX 200 down 0.4% to 6,359.49
Kospi up 1.7% to 2,216.43
German 10Y yield rose 1.5 bps to -0.007%
Euro up 0.07% to $1.1159
Brent Futures down 0.7% to $71.67/bbl
Italian 10Y yield fell 10.3 bps to 2.213%
Spanish 10Y yield fell 1.9 bps to 1.005%
Brent Futures down 0.7% at $71.67/bbl
Gold spot down 0.4% at $1,281.70
U.S. Dollar Index down 0.02% at 97.98
Top Overnight Headlines from Bloomberg
Socialist Sanchez is set to return as prime minister of Spain with his left-leaning allies close to a majority, though he may still rely on Catalan separatists to govern
Economic confidence in the euro area dropped for a 10th month in April to the lowest in more than two years, indicating the region may struggle to pick up from its recent slump
The next round of China-U.S. trade talks will get under way in Beijing this week with significant issues still unresolved, according to a senior Trump administration official
The Bank of England got its Brexit forecasts wrong, according to lawmakers and pundits. Mark Carney would beg to differ, and has defended pre-referendum predictions that a vote to leave would lead to slower growth, a drop in the pound and faster inflation — all of which transpired
China’s largest lenders posted increases in first-quarter profit and higher interest income as authorities encouraged fresh lending to support the economy. Industrial & Commercial Bank of China Ltd., Agricultural Bank of China Ltd., Bank of Communications Co. and Bank of China Ltd. reported net income rose as much as 4.9 percent in the three months ended March 31
Chinese industrial firms’ profits rose 13.9% in March y/y, vs a 14% decline in the first two months of this year combined
President Trump urged Japan to end tariffs on U.S. farm products when he met Prime Minister Shinzo Abe, who appears to have deflected the most damaging U.S. demands on trade weeks before the pair are likely to meet again
Asian equities traded mixed despite last Friday’s gains on Wall St where strong Q1 GDP and soft Core PCE Prices suggested a Goldilocks economy and propelled US stock markets to fresh record closes, as this week’s looming risk events and holiday closures restricted upside for the region. ASX 200 (-0.4%) was the laggard amid losses in its largest-weighted financials sector and with energy names also downbeat after a pullback in oil prices, while this week’s array of key releases including Chinese PMI, US NFP, BoE and FOMC announcements also added to the tentative tone. Elsewhere, Hang Seng (+0.9%) was positive after data showed Chinese Industrial Profits recovered in March and with focus on earnings including Agricultural Bank of China which kicked off the Big 4 bank earnings with an improvement in Q1 net, while Shanghai Comp. (-0.7%) was less decisive after the PBoC refrained from liquidity operations and with the mainland only open for the first 2 days of this week. As a reminder, Japan is closed until May 7th.
Top Asian News
CIC Said to Estimate 3-4% Overseas Investment Loss for 2018
China Firm’s Plunge Is Said to Cost Interactive Brokers Millions
Thai Finance Ministry Cuts 2019 GDP Growth, Export Forecasts
Goldman Says These Australia Stocks at Risk of Profit Warnings
Major European indices are choppy but overall marginally lower [Euro Stoxx 50 -0.5%], following on from their Asian counterparts ahead of a week with multiple market closures and several key risk events. Sectors are similarly mixed, with some mild underperformance seen in energy names in-line with the complex in general. The IBEX 35 (-0.4%) is lagging its peers this morning following on from the Spanish elections where the incumbent Socialist party emerged as the only one with the potential to form a coalition; within the index utility names are underperforming, which is dragging the utility sector in general down, with some speculation that this may be due to the success of the far right Vox party which secured 24 seats. Downside in utilities likely stemming from pledges by Vox to keep nuclear plants open, which contradicts the incumbent socialist party’s policies of closing nuclear plants and supporting renewable energy, which has been beneficial to Spanish utility names. Notable movers this morning include, Altice (+5.1%) who have reportedly attracted 3 potential bidders for their fibre optic network. Following the dissolution of merger discussions, Commerzbank (+1.6%) have rebutted speculation that the Co. may be sold, stating that they are strong enough alone and their customer relationships remain intact. Elsewhere, Bayer (-2.5%) are down after a spokesman stated that the majority of the Co’s investors voted against ratifying the executive boards 2018 business conduct, for reference the Co. are trading ex-div today.
Top European News
Czech Bank Stocks Slump as Babis Mulls Turnaround on Extra Tax
Caius Capital Hires Credit Analysts in Distressed-Debt Expansion
Opus Jumps to Highest Since January on China-Linked Rail Deal
UBS Banker Cleared After Seeing Tip on Eurostar Neighbor’s Phone
In FX, the Greenback has regained some composure after last Friday’s post-data downturn, but remains on a mixed footing vs G10 peers and EM currencies at the start of what looks like a busy/pivotal week on paper at least. First up, more inflation data and the Fed’s preferred price measure in the form of core y/y PCE following softer than expected Q1 reads within the advance GDP release, and then it’s month end on Tuesday with FX rebalancing models suggesting a Usd sell signal that could be countered to an extent by supportive SOMA flows. On to May 1, and the FOMC follows the first NFP proxies for Friday via the ADP survey plus employment readings in the manufacturing PMI and ISM. In the run up, the index is straddling 98.000 in a relatively narrow 98.066-97.917 range, with last week’s new 98.330 ytd peak providing resistance vs support at 97.693 that held on Friday.
GBP/EUR/AUD/NZD – Cable continues to display resilience ahead of the 1.2900 handle even though Brexit remains up in the air and talks between the Tory and Labour Party are still grid-locked, but the Pound is still looking toppy around 1.2950 amidst offers at 1.2945 (last month’s low) and with DMAs in close proximity (100 and 200 from 1.2962-65). Similarly, the single currency is finding support off 1.1100 and 2019 lows, as mostly weaker than forecast Eurozone sentiment indicators are countered by a degree of relief post-Spanish election and S&P reaffirming Italy’s BBB rating. Meanwhile, an improvement in Chinese industrial profits and latest US-China trade reports suggesting negotiations are reaching the last stretch are propping up the Aussie and Kiwi circa 0.7050 and 0.6670 respectively.
CHF/CAD/JPY – All on a more even keel vs the Usd and in relatively thin confines as the Franc meanders between 1.0200-1.0185 and Loonie roams from 1.3472-51 amidst a further pull-back in crude and ahead of tomorrow’s Canadian monthly GDP and PPI data. Meanwhile, Usd/Jpy has extended its trading parameters, but only to 111.54-77 in the absence of Japanese markets at the start of Golden Week and with strong chart support sub-111.50 as the 30 DMA, 38.2% Fib retracement of April peak to March trough (112.40-109.70) and last week’s low all fall at 111.37.
EM – At last some respite for the beleaguered Lira as an improvement in Turkish industrial confidence nudges Usd/Try off near 5.9600 peaks awaiting Tuesday’s CBRT inflation report for more independent impetus. As we reported last night, Goldman Sachs sees EUR/USD declining to 1.10 in the next 3 months and DXY rising to 99.00, while it suggested global growth is unlikely to be strong enough to weigh on the greenback. Furthermore, Goldman Sachs forecasts USD/TRY at 6.25 in 3 months, 6.50 in 6 months and 7.00 in 12 months.
In commodities, Brent (-0.9%) and WTI (-0.5%) prices are subdued in reaction to US President Trump’s comments on Friday that he contacted OPEC and told them to lower oil prices; although, there were subsequent reports that OPEC or Saudi officials have not spoken to President Trump regarding oil prices. However, some of the downside was mitigated by the Baker Hughes total rig count which fell by 21, with oil rigs falling by 20 to 805 in the steepest decline since January. Regarding the Iranian waivers a Trump Official says there is no wind down period or short-term waiver being considered for China’s oil purchases from Iran, and that it should be easy for China to comply as business with the US is more important for them than Iran. Elsewhere, sources report that exports of Nigeria’s Amenam crude oil is currently under a force majeure; these exports are operated by Total and typically equal 100k BPD. Gold (-0.3%) is marginally weaker, although the yellow metal is trading within a relatively narrow USD 5/oz range. After the metal printed its biggest daily gain in over a month on Friday, following US data which was disappointing in-spite of the larger than expected headline GDP print of 3.2%. Elsewhere, China’s Iron and Steel association stated that the industry is at risk from excess capacity which could impact profits in the industry.
US Event Calendar
8:30am: Personal Income, est. 0.4%, prior 0.2%
8:30am: Personal Spending, est. 0.7%; Real Personal Spending, est. 0.3%
8:30am: PCE Deflator MoM, est. 0.3%; PCE Deflator YoY, est. 1.6%
8:30am: PCE Core Deflator MoM, est. 0.1%; PCE Core Deflator YoY, est. 1.7%
10:30am: Dallas Fed Manf. Activity, est. 10, prior 8.3
DB’s Craig Nicol concludes the overnight wrap
If markets had the excuse of having too few catalysts to trade off in the last couple of weeks then the same excuse need not apply this week as we’ve got a star-studded line of up events to look forward to. We’ll touch on them in more detail further down but to whet the appetite they include Fed and BoE policy meetings, the latest US employment report, the final PMIs around the world, Q1 GDP in the Euro Area, various inflation readings in the US and Europe, more US and China trade talks and another bumper week of earnings. Last week it felt like the market was having a bit of a tug of war on the global growth narrative particularly with the US versus Europe story and then separately DM versus EM. So, this week could be a very important test and could very well go a long way to answering some of the lingering questions out there at the moment.
All that to look forward to then but in the meantime, it’s straight to the weekend news where the highlight was the election in Spain. With all votes counted, the centre-left PSOE was the clear winner with 123 seats and 28.7% of the vote, up from 85 seats in 2016, with 176 needed for a majority. DB’s Marc De-Muizon notes that this was broadly in line with polls. The centre-right PP gained the second most seats but suffered a huge drop, going from 137 seats to 66 seats. Citizens Party gained 57 seats compared to 32 seats previously while Podemos dropped to 42 seats from 71 previously.
Marc highlights in his report this morning (see here ) that there appears to be only two options to form a government that in Sanchez’s words will be a “pro-EU government, to fortify and not weaken Europe”. One is a PSOE-Podemos alliance supported by regionalist and Catalan independent parties. The other is a PSOE-Citizens alliance. The latter does, however, appear fairly unlikely at this point. In any case parties are unlikely to reach an agreement before June given upcoming regional and European elections, so it’s likely to drag on for some time.
The hasn’t been much of a reaction in the Euro post that result, making a modest +0.08% advance this morning. Risk assets more broadly in Asia are lacking direction meanwhile, with the Hang Seng (+0.78%) and Kospi (+1.07%) making decent gains, but the Shanghai Comp (-0.11%) and ASX (-0.51%) both down. Markets in Japan are closed for an extended holiday-week. Meanwhile bond markets are quiet, and US equity futures are slightly up.
Back to this week where for the Fed on Wednesday, while no policy change is expected, all eyes will be on how Powell and the Committee balance the dichotomy of improved growth prospects and easy financial conditions on the one hand and easy softening inflation pressures on the other – as Friday’s Q1 GDP report details showed (more on that below). Our economists ultimately believe that the Committee is likely to continue to emphasize that the current policy remains appropriate and that patience remains the proper prescription. You can see their full preview here .
As for the data, we’ll warm up with the March PCE report in the US today before China’s official April PMIs become the next focal point early tomorrow morning. The Q1 GDP print for the Euro Area in just over 24 hours’ time follows that where the market is looking for a +0.3% qoq reading. There’s little slowdown as Wednesday follows with the April ISM manufacturing reading in the US before we get the final April manufacturing PMIs in Europe on Thursday. A reminder that the Euro Area reading ‘improved’ to 47.8 when we got the flash albeit with <50 readings for Germany and France, with Italy also expected to post a similar reading. If that wasn’t enough then Friday ends with a bang with the April employment report where our economists expect a slight slowdown for nonfarm payrolls growth to 160k, albeit enough to hold the unemployment rate at 3.8%. They also expect earnings to rise +0.2% mom, which would be enough to hold the year-on-year rate at +3.2%.
There’s also the not-so-insignificant obstacle of 164 S&P 500 earnings reports to get through this week including the likes of Google today and Apple tomorrow. And last but by no means least, Lighthizer and Mnuchin travel to Beijing tomorrow for yet another round of trade talks. However, given that both sides have signalled hope of getting to a draft agreement by the end of next month, these talks may go some way to deciding the fate of that pledge. Interestingly, a Bloomberg story this morning suggests that Trump may walk away from talks with China should he not be satisfied with how talks progress this week.
Plenty to keep us all busy then. Turning now to a recap of Friday’s action, where US equities advanced strongly and treasury yields fell. The S&P 500 ended the week +1.20% higher (+0.47% on Friday) as economic data came in stronger-than expected and earnings reports continued to surprise to the upside. With 230 of S&P 500 companies having reported first quarter results, 78% have beaten earnings expectations for an aggregate beat of 5.36%. The surprises have been concentrated in the tech sector (where 24 of 25 companies have beaten profit expectations for a beat of 7.40%) and the consumer discretionary (aggregate beat of 27.02% thanks to Amazon’s 51.60% earnings beat). Earnings also helped the NASDAQ to a +1.85% gain (+0.34% Friday), though the DOW fell -0.06% (+0.31%) as a few large-cap firms like 3M, Intel, and Caterpillar disappointed.
Away from earnings, focus was on the first quarter US GDP report, which surprised to the upside, showing growth 3.2% on an annualized basis. That substantially beat expectations for a print of 2.3%, but the details were less encouraging. Core PCE inflation was 0.1pp lower than expected at 1.3% qoq, which raises the risk that a monthly print will fall to 1.5% mom, possibly worrying the Fed. Inventories and net exports (due to weak import growth) both contributed extra to the headline print, leaving underlying domestic demand running a bit soft at 1.3%. Still, seasonality effects and the government shutdown both weighed a bit on the headline figure.
The print’s softer details helped Treasury yields fall -6.2bps on the week (-3.4bps Friday). Bund yields were down -4.6bps (-1.3bps Friday), while BTPs experienced volatility, rising as much as 10bps earlier in the week only to retrace and end -1.8bps lower (-10.5bps Friday). After markets closed on Friday, ratings agency S&P affirmed Italy’s credit rating at BBB with a negative outlook. WTI oil prices also took a roundtrip on the week, rising as much as +4.06% early in the week after the Trump administration declined to renew waivers on Iran sanctions. They then retraced after US data showed another build in inventories and President Trump tweeted about asking OPEC to increase production, ultimately ending the week -1.20% lower (-2.93% Friday).
end
3. ASIAN AFFAIRS
i)MONDAY MORNING/ FRIDAY NIGHT:
SHANGHAI CLOSED DOWN 23.90 POINTS OR 0.77% //Hang Sang CLOSED UP 187.80 POINTS OR 0.97% /The Nikkei closed/ Australia’s all ordinaires CLOSED DOWN .36%
/Chinese yuan (ONSHORE) closed UP at 6.7283 AS TRUCE DECLARED FOR 3 MONTHS /Oil DOWN to 64.03 dollars per barrel for WTI and 72.83 for Brent. Stocks in Europe OPENED MIXED// ONSHORE YUAN CLOSED UP // LAST AT 6.7283 AGAINST THE DOLLAR. OFFSHORE YUAN CLOSED UP ON THE DOLLAR AT 6.7380/ TRADE TALKS NOW ON/MAJOR PROBLEMS AT HUAWEI /CFO ARRESTED : /ONSHORE YUAN TRADING ABOVE LEVEL OF OFFSHORE YUAN/ONSHORE YUAN TRADING STRONGER AGAINST USA DOLLAR/OFFSHORE YUAN TRADING STRONGER AGAINST THE DOLLAR /CHINA RETALIATES WITH TARIFFS/ TRUMP RESPONDS TO NEW TARIFFS AND IT NOW A FULL TRADE WAR COMMENCED
3 a NORTH KOREA/SOUTH KOREA
3 b JAPAN AFFAIRS
end
3 C CHINA/CHINESE AFFAIRS
China/USA
As promised, the trade deal with China is shattered. Again the White HOuse is threatening to walk away from the table. The USA does not understand that it is better off with what they have already..they are exporting worthless dollars to pay for goods.
(courtesy zero hedge)
Trade-Deal Narrative Shattered: White House Again Threatens To Walk Away From The Table
Though it was entirely ignored by the market, the latest US-China trade-deal headline, which hit late last night, shortly before Robert Lighthizer and Steve Mnuchin were set to leave for Beijing to begin what was supposed to be the ‘final’ round of talks, offers what has become an increasingly rare dose of pessimism right in the Bloomberg headline: With ‘significant issues’ still unresolved (despite Larry Kudlow’s assurances that he was ‘cautiously optimistic’ about a deal breakthrough), President Trump is once again threatening to walk away “if he isn’t satisfied with how talks are progressing.”
According to a White House statement, this week’s talks “will cover trade issues including intellectual property, forced technology transfer, non-tariff barriers, agriculture, services, purchases, and enforcement.”
After this week’s round of talks wraps up, Chinese Vice Premier Liu He will lead a delegation to Washington for talks beginning on May 8. Reports last week suggested that Washington and Beijing had been hoping to announce a tentative deal, and a date for a signing summit between President Trump and Xi Jinping, following the close of last week’s talks.
Though both China and the US recently reported better than expected Q1 growth (though the data underlying the headline weren’t quite so rosy, and some have raised questions about ‘fake growth’, while the pickup in China was likely driven by one of the biggest credit injections on record), gauges of global trade have showed a sharp drop off since the beginning of the year.
Expressing dissatisfaction with Beijing’s willingness to compromise on issues like IP protections (Beijing has reportedly rankled at furhter compromise after passing a law purportedly banning forced technology transfers) and market access, Washington kept China on a “priority watch list” of nations that don’t adequately protect IP rights, according to the annual report of the USTR’s office on IP practices around the world.
Meanwhile, during a speech to 40 world leaders at Beijing’s annual “Belt & Road Initiative” conference, Xi promised to scale back Beijing’s ‘debt trap diplomacy’ and also offered some positive comments about the trade deal.
However, with his job possibly on the line, Mnuchin hasn’t given up on the sunny rhetoric. During an appearance at the Milken conference on Sunday, he said the negotiations were nearing their ‘final laps’, though he declined to say whether the talks would be wrapped up by June.
Mr. Mnuchin, one of President Trump’s lead negotiators, said that while the two sides are closer to an agreement, more work remains to be done, and that the talks are nearing a point where they would either produce a deal or end with no agreement, according to the New York Times.
“We’re getting into the final laps,” Mr. Mnuchin said in an interview on the sideline of the Milken Institute Global Conference in Los Angeles.
“I think both sides have a desire to reach an agreement,” Mr. Mnuchin said. “We’ve made a lot of progress.”
Though he did acknowledge that there are some “significant issues that remain open.”
end
This will surely infuriate the Chinese as two USA warships sail through the Taiwan Strait
(courtesy zerohedge)
Two US Warships Sail Through Taiwan Strait In Dare To Beijing
With US-China trade talks set to resume this week amid what flashing red headlines, Larry Kudlow and Donald Trump’s twitter account remind us every day, if not hour, is a sense of “optimism” about an imminent deal, on Sunday the US navy reminded Beijing to stick to the script (one in which Trump supposedly comes off as a negotiating giant), when it two warships through the hotly contested Taiwan Strait as the Pentagon increases the frequency of movement through the strategic waterway despite vocal and often time angry opposition from China.
While the voyage risks further raising tensions with China – at an especially sensitive time for trade negotiations – it will also be viewed by Taiwan as a sign of support from the Trump administration amid growing friction between Taipei and Beijing.
According to Reuters, the two destroyers were the William P. Lawrence and Stethem.
The guided-missile destroyer USS Stethem. Photo: Reuters
“The ships’ transit through the Taiwan Strait demonstrates the U.S. commitment to a free and open Indo-Pacific,” Commander Clay Doss, a spokesman for the U.S. Navy’s Seventh Fleet, said in a statement. The 112-mile-wide Taiwan Strait separates Taiwan from China. Winking at China, Doss also said there were no unsafe or unprofessional interactions with other countries’ vessels during the transit. Beijing may beg to differ.
Despite an alleged convergence of view on trade between Beijing and DC., Taiwan remains one of a growing number of flashpoints in the U.S.-China relationship, which also include a trade war, U.S. sanctions, the future of Huawei and 5G and China’s increasingly muscular military posture in the South China Sea, where the United States also conducts freedom-of-navigation patrols to remind China that the US will never cede implicit control of the world’s most important naval area.
Commenting on the transit, Taiwan’s Ministry of Defense said the US ships had sailed north through the strait. “U.S. ships freely passing through the Taiwan Strait is part of the mission of carrying out the Indo-Pacific strategy,” it said in a statement. Taiwan’s armed forces monitored the transit and nothing out of the ordinary happened, the ministry said.
Beijing was far less enthusiastic: China’s foreign ministry spokesman Geng Shuang said China had paid close attention to the sailing and had expressed concern to the United States. “The Taiwan issue is the most important and sensitive issue in Sino-U.S. relations,” he told a daily news briefing.
While the United States has no formal ties with Taiwan, it is bound by law to help provide the island with the means to defend itself and is its main source of arms. More importantly, just like Saudi Arabia, Taiwan is one of the biggest clients of US weapons. The Pentagon says Washington has sold Taipei more than $15 billion in weaponry since 2010.
China has been ramping up pressure to assert its sovereignty over the island, which it considers a wayward province of “one China” and sacred Chinese territory.
It said a recent Taiwan Strait passage by a French warship, first reported by Reuters on Wednesday, was illegal. China’s Geng added that China hoped that France could ensure such an incident did not happen again.
As Reuters notes, Beijing’s concerns about Taiwan are likely to factor into Chinese defense spending this year, following a stern New Year’s speech from President Xi Jinping in which he threatened to attack Taiwan should it not accept Chinese rule.
To that end, last month, Beijing unveiled a target of 7.5 percent rise in defense spending for 2019, a slower rate than last year but still outpacing its economic growth target. In response to US moves in the region, China has repeatedly sent military aircraft and ships to circle Taiwan on exercises in the past few years and worked to isolate it internationally, whittling down its few remaining diplomatic allies.
END
The following is China’s Neutron Bomb: non performing loans. The total of all loans in China is around $35, billion dollars (and another 9 billion dollars in the peer to peer shadow banking sector. It looks like we have about an 8.1 % bad debt ratio or 081 x 35 = 1 trillion dollars of bad debts that the banks have to write off.
(courtesy zero hedge)
China’s “Neutron Bomb” Returns: Bad Loans Surge Most In 3 Years
The last time we did a closer look at China’s bad debt, a topic that has been particularly sensitive for an economy whose financial sector is now over $40 trillion, was in late 2015 when CLSA stumbled on what we then dubbed China’s “neutron bomb”: Chinese banks’ bad debts ratio could be as high 8.1% a whopping 6 times higher than the official 1.5% NPL level reported by China’s banking regulator!
So if one very conservatively assumes that loans are about half of China’s total asset base of $35 trillion(realistically 60-70%), and applies an 8% NPL to this number instead of the official 1.5% NPL estimate, the capital shortfall is a staggering $1.1 trillion. (HARVEY: TOTAL LOANS ARE AROUND 44 BILLION USA WITH THE ADDITION BEING ATTRIBUTED TO SHADOW BANKING LOANS)
Our conclusion back in 2015 was that “while China has been injecting incremental liquidity into the system and stubbornly getting no results for it leading experts everywhere to wonder just where all this money is going, the real reason for the lack of a credit impulse is that banks have been quietly soaking up the funds not to lend them out, but to plug a gargantuan, $1 trillion, solvency shortfall which amounts to 10% of China’s GDP!”
Since then, China’s bad debt fears took a back stage to even bigger Chinese problems, including capital flight, a slowing economy, a sharp decline in the country’s FX reserves, and most recently, a bitter trade war with the US which has crippled China’s manufacturing sector.
But, sadly, that did not mean that China’s bad debt problem had gone away; to the contrary, as Bloomberg reports, “China’s biggest banks are seeing bad loans grow at the fastest pace since at least 2017, as the country’s economic slowdown leaves its mark on the financial sector.“
While reporting generally strong Q1 earnings, China’s four largest lenders said in recent days that non-performing loans hit fresh multi-year highs in the latest quarter, reflecting risks to China’s banks as the government pushes them to lend more.
ICBC reported a 5.2 billion yuan ($770 million) rise in non-performing loans in the first three months, the biggest quarterly increase in almost three years. Bank of China saw its bad loans rise by 6.1 billion yuan – the most in three years – to the highest level since at least 2006. At Agricultural Bank of China Ltd., bad debt rose by 2.7 billion yuan, the biggest increase since the first quarter of 2017. China Construction Bank Corp.’s soured credit increased by 6.6 billion yuan, the most since 2016.
Even more striking: the surge in bed debt comes just as China made its biggest new credit injection ever in the first quarter, flooding the economy with 40% more total credit in 2019 compared to a year ago, and has once again saddled the local banks with even louder ticking timebombs on their balance sheets.
And while Bloomberg speculated that the increase in delinquent debt may give policy makers pause, we doubt it: after all prevailing consensus now is that China in coordinate with global central banks has launched a Second Shanghai Accord, and will not stop before the aggregate level of global inflation is comfortably high to delay the inevitable next recession by at least a few more quarters. Still, while China’s banks are seen as key to reinvigorating the economy, especially by lending to traditionally riskier smaller and private companies, some have expressed concerns that soured loans could continue to rise.
“Pressure to lend to small and micro-enterprises may gradually start to appear in bank’s NPLs,” said Shujin Chen, CFO of Huatai Securities. Weaker economic conditions will also impact bad loans though as a share of total lending it may remain little changed, she said.
The problem is only going to get worse: 45% of 202 bankers surveyed by China Orient Asset Management, one of four state-owned bad-debt managers, expect the nation’s bad-loan ratio to peak next year, according to the annual survey published in April.
The good news is that, for now at least, this growing bad debt problem has yet to appear in the income statement: despite concerns around bad loans, total earnings at the five biggest lenders, which control more than a third of China’s banking assets, are this year estimated to grow at the fastest pace in five years. “Banking stocks are likely to deliver both absolute and relative returns in the phase of monetary and credit easing,” China International Capital Corp. analysts led by Victor Wang said in an April 22 note to clients.
Others aren’t quite so sanguine, and as Bloomberg analyst Francis Chan writes, “ICBC and BoCom loan provisions could offset mild revenue gains, restricting earnings growth to mid-single digits in 2019. CCB may need to raise credit costs later this year. BoC earnings may get a short-term boost from robust sector loan growth, yet with full-year profit gains staying in the mid-single digits.”
Investors are similarly skeptical, as shares of China-listed banks have gained “only” 19% this year, underperforming the 23% increase in the Shanghai Composite. Among their concerns: increased lending to smaller businesses may hurt their asset quality and profitability in the longer term, and some analysts predict a turn in monetary policy to avoid over-stimulating the economy.
The big question, of course, is what Beijing will do with this data. Two Fridays ago, China’s Politburo said that the economy was better than expected in the first quarter, fueling concern that the government will dial back economic support measures. If China has indeed pulled its foot of the gas pedal, and the level of stimulus is about to drop off a (record) cliff, it’s time to quietly exit stage left, or as we put it last Sunday, just before the worst week for Chinese stocks in 2019, “If your bullish thesis to buy stocks in recent months has been anchored by the expectation of aggressive monetary easing by China reinforcing the narrative that “bad news is good news” for the market, you may consider selling.”
The Chinese did just that.
END
4/EUROPEAN AFFAIRS
EU/HUAWEI/USA/
War of words between Juncker and the USA as Europe will not ban Huawei just because it is Chinese
(courtesy zerohedge)
Juncker Rips US Stance On Huawei: EU Won’t Ban Firm “Just Because It’s Chinese”
European Commission President Jean-Claude Juncker has said he won’t bow to US pressure over Huawei, saying that he won’t block the telecom giant from doing business in Europe merely because it’s a foreign or specifically Chinese firm, so long as it plays by the rules.
Speaking alongside Japanese PM Shinzo Abe on Thursday, Juncker told reporters, “We are not rejecting someone because he is coming from faraway, because he is Chinese, the rules have to be respected.”
Prior file photo of Japanese Prime Minister Shinzo Abe and European Commission President Jean-Claude Junker (front), via UPI
Amid Washington’s demands that Huawei be barred from Europe’s 5G buildout over suspicious it uses its equipment and network to provide a backdoor for Chinese state spying on the West, Juncker pushed back, saying further, “The European Union and our internal market are open markets and all those respecting our rules governing this internal market are welcome.”
A Japanese reporter had asked the European and Japanese leaders, “the U.S. is calling on the allies to eliminate telecom equipment of Chinese companies including Huawei, so what did you discuss about that? And on this issue, what do you plan to deal with at G20?”
The Japanese PM had responded to the question in a less direct manner: “We did not talk about specific countries or specific products. Dealing with cyber-security-related risks is extremely important, and we agree that we need to take coordinated actions at G20,” Abe said, according to Xinhuanet. Japan has recently banned Huawai 5G technology and equipment from being implemented in its territory.
“In the past, the importance of ICT, the importance of security countermeasures related to the use of ICT has been recognized, and therefore based on that recognition, we will continue that discussion and we wish to continue to collaborate with the EU,” Abe said, in reference to information and communications technology (ICT).
Though Washington has lately been aggressive in ramping up pressure on European allies to prevent the multinational China-based firm from getting a toe-hold in Europe’s future 5G, the American stance has been met with mixed reactions globally.
Currently, the US, Australia, New Zealand, and Japan maintain blanket bans on the Chinese company’s technology from being sold or implemented in their countries. And other so-called “Five Eyes” intelligence sharing countries the UK and Canada are reportedly strongly considering a ban.
Huawei CEO Ren Zhengfei, via LinkedIn
But crucially, Germany last week has indicated there are no plans in place to prevent the Chinese telecommunications giant from participating in building Germany’s ultra-high speed 5G internet.
Juncker’s latest comments could embolden other EU countries — andespecially those leaders who’ve remained ambivalent in their public stance — to step out of sync with Washington and remain open to business with Huawei.
In recent interviews with German newspapers, Huawei founder and CEO Ren Zhengfei said that he’s assured the country’s telecommunications regulator that no surveillance “backdoors” on its 5G equipment in the country would be possible, and that he’s proposed and will commit to a “no spy agreement” with German regulators.
END
Spain election: A hung parliament but they would probably gain some support form the Catalan separatists. The populist party VOX gains entry into Parliament with 24 seats.
(courtesy zerohedge)
Spanish Election Ends With Hung Parliament, Forming New Government “Could Prove Challenging”
Spain’s ruling socialist party led by prime minister Pedro Sanchez is set to regain control with his left-leaning allies close to a majority following Sunday’s vote for Spain’s Congress of Deputies, although based on most all of the votes counted, he would need a handful of votes from Catalan separatists, which may prove to be problematic.
According to Goldman Sachs, based on a projections of votes counted by 11:45 pm BST (roughly 99.8% of the sections where votes have been collected for Congress and about 89% for the Senate) point to a hung Parliament, in line with indications from opinion and exit polls. In other words, as expected no party has won enough votes to form a government on its own. The Socialist Party (PSOE) is projected to be the party with the highest share of seats in Parliament. And while Goldman expects that it will take time for a new government to be put in place, a center-left coalition led by PSOE is likely to emerge as a government, potentially with the support of a moderate group of Basque separatists.
As Bloomberg adds, the ruling Socialists are on track to win 123 seats, up from 85 in 2016. Its left-wing ally Podemos platform has another 42 seats while the Basque Nationalists, another group close to Sanchez, has six. That would give Sanchez 171 seats, just shy of the 176 he would need for a majority. The moderate Catalan separatist group Esquerra Republicana has another 15 seats and has signaled its willing to help. This could give the 47-year-old premier a shot at forming Spain’s first stable government in almost four years and enable him to chart a way forward for the country after years of economic crisis and political turmoil.
It will mean a government in Madrid that seeks conciliation rather than confrontation with the separatists controlling Catalonia and will make him the standard bearer for social democracy in Europe
Notably, a second Sanchez government would reverse the trend of a collapse in voter support for Europe’s other center-left parties. He achieved this by boosting the minimum wage and pension payments while remaining committed to spending within the fiscal limits set by the European Union. While Sanchez had already served 10 months as the head of a minority government, he was forced to call a snap election when he failed to pass his budget.
Also of note: a new nationalist party has emerged “to motivate supporters, who have historically been less reliable than voters on the right” according to Bloomberg. Vox is set to win seats in parliament for the first time, but its 24 seats suggest it’s set to fall short of expectations and the huge buzz around their sudden emergence on the political scene.Vox’s parliamentary presence will mean Spain is no longer exempt from the right-wing populism that’s swept across Europe and the U.S. But unlike Italy and some other European nations, Spain remains a particularly enthusiastic member of the European Union. Not even Vox is suggesting pulling out.
The traditional conservative group, the People’s Party, lost about half its seats and will have 67 deputies in the new parliament.
Vote Highlights via Goldman:
On 28 April, all 350 seats in the Spanish Congress of Deputies were up for election, as well as 208 of the 266 seats in the Spanish Senate. According to projections based on votes counted by 11.45 pm BST, the allocation of seats in Congress is as follows:
Socialist Party (PSOE) – centre-left: 123 seats (28.7% of votes)
People’s Party (PP) – centre-right: 66 seats (16.7% of votes)
Ciudadanos party – liberal: 57 seats (15.8% of votes)
Unidos Podemos – left-leaning: 42 seats (14.3% of votes)
Vox – right-leaning: 24 seats (10.3% of votes)
Small regional parties: 38 seats (14.2% of votes).
1. The general election has delivered a hung Congress, with no party winning an absolute majority of seats. About 89% of votes have been counted for the Senate, and projections show that PSOE has a majority of seats (122 seats out of 208). A coalition government is likely to emerge but only after lengthy negotiations among political parties, which will likely start only after the regional and European elections on May 26. Forming a government could prove challenging given how fragmented Congress is.
2. A centre-left coalition of PSOE, Unidos Podemos and regional nationalist parties from the Basque Country, Valencia, the Canary Islands and Catalonia (including the separatist Catalan Republican Left, ERC and Catalan European Democratic Party, PdeCAT), would have the strongest majority in Congress, controlling 199 seats, of which 123 seats would be held by PSOE, 42 by Unidos Podemos and 34 by regional parties (of which 10 are from regional non-separatist parties, and 24 from separatist parties). But, it could prove challenging to form such a government, since regional nationalist parties, which did not vote in favour of the government budget in March causing the government’s collapse, would play a critical role in the coalition.
3. Two other possible coalitions would not have the majority of seats in Congress (176) needed to form a majority government. A centre-left coalition of PSOE and Unidos Podemos would have 165 seats and a centre-right coalition government formed by PP, Ciudadanos and Vox would have 147 seats. Finally, the centre-left coalition of PSOE and Ciudadanos would have an absolute majority of seats in Congress (180 seats), but, so far, Ciudadanos has denied the potential for such a coalition because of differences with PSOE over how to confront the separatist movement in Catalonia.
4. Given the fragmentation in Congress, the possibility of a minority government can not be excluded, or that a government cannot be formed as happened in 2015. Also, it could be possible that any coalition government that may eventually emerge will not remain in power for the entire term and that new elections will be necessary at some point in the future, before the end of the legislature.
5. Political and policy uncertainty will be of little consequence for the 2019 economic outlook, but the type of government that emerges from the general election could matter for Spain’s medium-term outlook.
end
5.RUSSIAN AND MIDDLE EASTERN AFFAIRS
6.GLOBAL ISSUES
7 OIL ISSUES
end
8. EMERGING MARKETS
ARGENTINA
.
end
Your early morning currency/gold and silver pricing/Asian and European bourse movements/ and interest rate settings MONDAY morning 7:00 AM….
Euro/USA 1.1154 UP .0012 REACTING TO MERKEL’S FAILED COALITION/ REACTING TO +GERMAN ELECTION WHERE ALT RIGHT PARTY ENTERS THE BUNDESTAG/ huge Deutsche bank problems ///ITALIAN CHAOS /AND NOW ECB TAPERING BOND PURCHASES/JAPAN TAPERING BOND PURCHASES /USA RISING INTEREST RATES /FLOODING/EUROPE BOURSES /GREEN EXCEPT LONDON
USA/JAPAN YEN 111.75 UP .179 (Abe’s new negative interest rate (NIRP), a total DISASTER/NOW TARGETS INTEREST RATE AT .11% AS IT WILL BUY UNLIMITED BONDS TO GETS TO THAT LEVEL…
GBP/USA 1.2922 UP 0.0019 (Brexit March 29/ 2019/ARTICLE 50 SIGNED/BREXIT FEES WILL BE CAPPED/BREXIT EXTENDED TO OCT 31/2019//
USA/CAN 1.3470 UP .0018 CANADA WORRIED ABOUT TRADE WITH THE USA WITH TRUMP ELECTION/ITALIAN EXIT AND GREXIT FROM EU/(TRUMP INITIATES LUMBER TARIFFS ON CANADA/CANADA HAS A HUGE HOUSEHOLD DEBT/GDP PROBLEM)
Early THIS MONDAY morning in Europe, the Euro ROSE BY 12 basis points, trading now ABOVE the important 1.08 level RISING to 1.1154 Last night Shanghai COMPOSITE CLOSED DOWN 23.90 POINTS OR 0.77%.
//Hang Sang CLOSED UP 287.80 POINTS OR 0.97%
/AUSTRALIA CLOSED DOWN .36%// EUROPEAN BOURSES ALL RED
The NIKKEI: this MONDAY morning CLOSED
Trading from Europe and Asia
1/EUROPE OPENED ALL RED/
2/ CHINESE BOURSES / :Hang Sang CLOSED UP 287.80 POINTS OR 0.97%
/SHANGHAI CLOSED DOWN 23.90 POINTS OR 0.77%
Australia BOURSE CLOSED DOWN .36%
Nikkei (Japan) CLOSED
INDIA’S SENSEX IN THE GREEN
Gold very early morning trading: 1280.50
silver:$14.97
Early FRIDAY morning USA 10 year bond yield: 2.51% !!! UP 1 IN POINTS from THURSDAY’S night in basis points and it is trading WELL ABOVE resistance at 2.27-2.32%.
The 30 yr bond yield 2.93 UP 1 IN BASIS POINTS from THURSDAY night.
USA dollar index early WEDNESDAY morning: 98.03 UP 3 CENT(S) from THURSDAY’s close.
Portuguese 10 year bond yield: 1.13% DOWN 6 in basis point(s) yield from FRIDAY/
JAPANESE BOND YIELD: -.04% DOWN 1 BASIS POINTS from FRIDAY/JAPAN losing control of its yield curve/
SPANISH 10 YR BOND YIELD: 1.01% DOWN 2 IN basis point yield from FRIDAY
ITALIAN 10 YR BOND YIELD: 2.59 UP 1 POINTS in basis point yield from FRIDAY/
the Italian 10 yr bond yield is trading 158 points HIGHER than Spain.
GERMAN 10 YR BOND YIELD: RISES -.00% IN BASIS POINTS ON THE DAY//
THE IMPORTANT SPREAD BETWEEN ITALIAN 10 YR BOND AND GERMAN 10 YEAR BOND IS 2.59% AND NOW ABOVE THE THE 3.00% LEVEL WHICH WILL IMPLODE THE ENTIRE ITALIAN BANKING SYSTEM. AT 4% SPREAD THERE WILL BE A MASSIVE BANK RUN…
END
IMPORTANT CURRENCY CLOSES FOR MONDAY
Closing currency crosses for MONDAY night/USA DOLLAR INDEX/USA 10 YR BOND YIELD/1:00 PM
Euro/USA 1.1170 UP .0029 or 29 basis points
USA/Japan: 111.81 UP 0.017 OR YEN DOWN 17 basis points/
Great Britain/USA 1.2919 UP .0029 POUND UP 29 BASIS POINTS)
Your closing 10 yr USA bond yield UP 3 IN basis points from FRIDAY at 2.53 % //trading well ABOVE the resistance level of 2.27-2.32%) very problematic USA 30 yr bond yield: 2.96 UP 4 in basis points on the day
Your closing USA dollar index, 97.97 DOWN 3 CENT(S) ON THE DAY/1.00 PM/
Your closing bourses for Europe and the Dow along with the USA dollar index closing and interest rates for MONDAY: 12:00 PM
London: CLOSED UP 12.47 0.17%
German Dax : UP 12.84 POINTS OR 0.10%
Paris Cac CLOSED UP 11.62 POINTS OR 0.10%
Spain IBEX CLOSED UP 11.20 POINTS OR 0.12%
Italian MIB: CLOSED UP 50.57 POINTS OR 0.23%
WTI Oil price; 63.16 1:00 pm
Brent Oil: 72.22 12:00 EST
USA /RUSSIAN / ROUBLE CROSS: 64.55 THE CROSS LOWER BY 0.24 ROUBLES/DOLLAR (ROUBLE HIGHER BY 24 BASIS PTS)
TODAY THE GERMAN YIELD RISES TO –.00FOR THE 10 YR BOND 1.00 PM EST EST
END
This ends the stock indices, oil price, currency crosses and interest rate closes for today 4:30 PM
Closing Price for Oil, 4:00 pm/and 10 year USA interest rate:
WTI CRUDE OIL PRICE 4:30 PM : 63.61
BRENT : 71.99
USA 10 YR BOND YIELD: … 2.53… STILL DEADLY//
USA 30 YR BOND YIELD: 2.96..VERY DEADLY
EURO/USA 1.1184 ( UP 42 BASIS POINTS)
USA/JAPANESE YEN:111.66 UP .086 (YEN DOWN 6 BASIS POINTS/..
USA DOLLAR INDEX: 97.85 DOWN 16 cent(s)/
The British pound at 4 pm: Great Britain Pound/USA:1.2938 UP 34 POINTS
the Turkish lira close: 5.9502
the Russian rouble 64.48 UP 32 Roubles against the uSA dollar.( UP 32 BASIS POINTS)
Canadian dollar: 1.3448 UP 4 BASIS pts
USA/CHINESE YUAN (CNY) : 6.7336 (ONSHORE)/
USA/CHINESE YUAN(CNH): 6.7392 (OFFSHORE)
German 10 yr bond yield at 5 pm: ,-0.00%
The Dow closed UP 11.06 POINTS OR 0.04%
NASDAQ closed up 15.46POINTS OR 0.19%
VOLATILITY INDEX: 13.11 CLOSED UP .38
LIBOR 3 MONTH DURATION: 2.583%//
FROM 2.582
And now your more important USA stories which will influence the price of gold/silver
TRADING IN GRAPH FORM FOR THE DAY/WEEKLY SUMMARY/FOLLOWED BY TODAY
S&P Hits Record High, Most Overbought Since VIXmageddon
The last time the S&P 500 was at a record high and this overbought was January 2018 – right before the world fell out of the bottom of VIX shorts…
And remember, VIX traders have never been shorter vol than they are now…
Notably, extending last week’s decoupling, VIX was higher as stocks rose today… The last time we saw this was January 2018’s melt-up as buyers bid up vol on the back of call options
Ignore this…
“Probably nothing”
After the worst week in six months last week, Chinese stocks were very mixed overnight with ChiNext dumping and the big cap SSE50 rallying…
Notably, SHCOMP broke below the 3100 level and its 50DMA…
The day started ugly for Spain after their elections but a magic bid arrived across Europe and lifted everything back to breakeven by the close…
After Friday’s late-day melt-up, was there ever any doubt that the S&P 500 would break to record intraday highs…
Small Caps led on the day, Trannies lagged…with the Dow managed to just hold green
Treasury yields rose on the day with the long-end the biggest price laggard, steepening 3bps against the short-end (NOTE – Japan on golden week)…
30Y remains well below 3.00% though.
The slide in the dollar continues (albeit modestly)…
Cryptos were mixed with Bitcoin and Ether higher, Bitcoin Cash and Litecoin lower…
Copper and Crude managed gains as gold (and worse silver) slipped lower (despite a flat dollar)…
Finally, we ask a simple question – if everything is so awesome (which it ‘clearly’ is, just ask stocks), why are markets pricing in 29bps of rate cuts in the rest of 2019?
end
Market trading/this morning:
S&P Surges To New Intraday Record High
“Everything is awesome”
S&P 500 tops its Sept 21st record intraday highs…
Will earnings and macro catch up now?
END
Bellwether Google tumbles after missing everything.
(courtesy zerohedge)
Google Tumbles After Missing Across The Board
With Google parent Alphabet closing at all time highs ahead of it earnings, expectations were clearly both high, and priced to perfection. Too much perfection in fact, because unlike many of its peers, the company reported Q1 results which missed across the board and showed that ad revenue is slowing substantially.
Here are the highlights:
Q1 revenue ex-TAC $29.48 billion, missing the estimate of $30.04 billion
Q1 EPS $9.50, Exp. $10.17
Q1 paid clicks on Google properties +39% vs. +66% q/q
Q1 cost-per-click on Google properties -19% vs. -29.0% q/q
Q1 operating margin 18%, vs 21% Q/Q
But this was the punchline: ad growth slowed significantly with google ads only growing 15% during the quarter, a marked slowdown from prior years. In the first quarter of 2018, the ads business posted 24% growth. In the company’s statement, CFO Ruth Porat, said growth came from “mobile search, YouTube and Cloud.”
The immediate comparison made by analysts is one with Facebook which beat revenue across the board, prompting some to wonder if the broader ad business is slowing down, or if the company has conceded even more advertising market share to Facebook (and Amazon).
The topline was disappointing across the board, with 1Q Google advertising revenue $30.72 billion sliding from $32.64 billion q/q; total Google properties revenues of $25.68 billion dropped in Q1 vs. $27.02 billion q/q; Google other revenue also dropped in the quarter to $5.45 billion vs. $6.49 billion.
Just as concerning has been Google’s rising expenses, and in Q1 the company’s traffic acquisition costs (TAC), the amount Google pays out to websites and mobile partners, rose to $6.87 billion for the quarter.
The flipside is that after CapEx soared toward the end of 2018, Alphabet did manage to rein it in during the quarter. As a result, overall CapEx fell to $4.6 billion, from $7.3 billion last year. According to Google, the drop in CapEx came, in part, from the big real estate spending blip in the first quarter of 2018. Still, the company’s spending is trending up. The overall spending on Google during the quarter ($4.5 billion) is nearly double the amount of spending from 2017. Additionally, spending on Alphabet’s “Other Bets,” which include driverless car unit Waymo, grew during the quarter, reaching $868 million in loses. The units reported $170 million in sales.
Silver lining aside, the Nasdaq is suffering from a minor tremor after hours, as investors were clearly disappointed by the results and since the stock was – as noted above – priced beyond perfection, it is tumbling after hours, and was down as much as 6%.
GOOGL hasn’t fallen this much in the reporting aftermath since at least 2014.
ii)Market data/
Without getting too technical but believe me that it is true that there is a shortage of dollars in the USA banking system despite the massive 1.5 trillion dollars of excess reserves. The dollar shortage of funding is causing havoc in banking circles and now Charlie McElligott of Nomura has now come out and states that he now expects a 50 basis cut out of gate and this will be soon. The problem is that the effective fund rate has surpassed the IOER or the rate at which the Fed gives a high interest rate for excess reserves.
Don’t pay attention to the details although it is true..just get the gist of the story and what will happen
(courtesy zerohedge_
Nomura: The Fed Will Go Large; Expect A 50bp Cut Out Of The Gate… And Soon
it may seem morbid, if not grotesque, to discuss the Fed cutting rates on the day when the S&P just hit a new all time high, but as a result of the previously discussed US bank liquidity and dollar shortage thesis, now also espoused by JPMorgan, and the coincident “funding-squeeze” dynamic, which as we have shown over the past week has expressed itself via the much-discussed “Fed Funds (Effective) trading through IOER” phenomenon…
… this is precisely the topic of the latest note from Nomura’s Charlie McElligott who writes this morning that with the Fed increasingly concerned about what even the big banks admit is a funding shortage in the US banking system (ironically enough, with over $1.4 trillion in excess reserves still sloshing in the system), Powell may have no choice but to cut rates aggressively, slash the IOER rate – perhaps as soon as this week – and eventually resume QE.
As if to validate McElligott’s point, amid increasing buzz of an imminent rate cut, the dollar keeps rising, and instead of tracking rate cut odds, which are now back to cycle highs, is instead tracking the excess EFF over IOER tick for tick as the clearest indicator of what is now perceived as a widespread liquidity shortage, and in doing so is escalating the recent turmoil across EMFX, as the US Dollar breaks out to fresh highs despite Friday’s worse than expected (below the surface) GDP print.
As discussed over the weekend, McElligott reminds readers that there is now “again a mounting belief in the market for a Fed “technical” IOER cut at some point into the Summer” – or even this week according to Morgan Stanley – as a necessity to “buy time” into still-tightening/shrinking excess reserves (especially since the Fed seemingly has been slow to move on a ”standing repo facility” alternative) prior to the Fed again expanding the balance sheet to add reserves again in the Fall via what the Nomura strategist calls the commencement of “QE Lite” (MBS reinvestments into USTs, most likely T-Bills to shorten the portfolio’s WAM and further steepen curve as an additional side benefit).
Additionally, with today’s core PCE Deflator data coming in even weaker than expected, and dropping to just 1.6% Y/Y, the lowest print since 2017, the pressure will be on Powell to be even more dovish at this week’s FOMC meeting grows according to McElligott, “especially ahead of the June Fed research conference in Chicago, focused on inflation and likely to advocate a “run labor hot” policy.”
So despite a growing number of banks warning that the one thing that can break the market’s relentless levitation is a return to curve steepening, McElligott once again pounds the table on Steepeners (via curve caps), something he has been doing since last Summer, especially since the case “now only grows stronger as when the Fed does indeed “go,” they’ll go large – think 50bps out of the gates, and likely sooner than most expect, as they now have three cut “justifications”:
cycle “insurance” (EVERYBODY talking the ’95-’96 weakening price-pressure analog, then again in ’98 on ‘external’ factors EM- and LTCM-)
“reflation”-seeking policy rethink, and
near-term Dollar funding dynamics as banking system reserves continue to shrink prior to the re-expansion of the BS in 4Q19
So how to trade an imminent rate cut, potentially as large as 50bps? As McElligott discussed last week, and echoing what Deutsche Bank’s Aleksandar Kocic said over the weekend, the 2s10s is likely then the better “trade location” now…
… as it has lagged the initially preferred expressions (5s30s, 2s30s which began steepening-out 2H18)—however simple ED$ Longs (Greens & Reds) / options “Upside” expressions continue to make sense…
… with Call Spreads offering attractive leverage.
Finally, and totally unrelated, McElligott points out the following “bonus chart” showing that market neutral hedge fund performance has been abysmal so far in 2019 as MNs can’t run enough “net” to capture the dovish Fed capitulation and rate-cut bets relative to long-shorts.
END
iii)USA ECONOMIC/GENERAL STORIES
An extremely important commentary from Alasdair Macleod as he points out that there is no escape from the USA debt trap. He along with everybody else is highlighting the fact that the USA budgetary deficit must rise because of Trump’s spending initiatives. He gives a detailed explanation as to why (without increase US A savings) the uSA trade deficit must also rise and cannot fall despite Trump’s efforts at increasing tariffs..it is a foo’s game
(courtesy Macleod/GoldMoney.com)
The US Government Is Ensnared In A Debt Trap.. And There’s No Escape
This article explains why the US Government is ensnared in a debt trap from which there is no escape. Its finances are spiralling out of control. In the context of a rapidly slowing global economy, the budget deficit can only be financed by QE and bank credit expansion. Do not draw comfort from trade protectionism: it will not prevent the trade deficit increasing at the expense of domestic production, unless you believe there will be an unlikely resurgence in personal saving rates. We can now begin to see how the debt crisis will evolve, leading to the destruction of the dollar.
Introduction
At the time of writing (Thursday April 24) bond yields are crashing, the euro has broken down against the dollar and equities are hitting new highs. Obviously, equities are taking their queue from bonds. But bond yields are crashing because the global economy is sending some very worrying signals. Equity investors will be hoping monetary easing (which they now fully expect) will kick the can down the road once again and economies will continue to bubble along. They are ignoring some very basic economic facts…
Regular readers of my Insight articles will be aware of strong indications that the expansionary phase of the credit cycle is now over, and that we at grave risk of falling headlong into a global credit and systemic crisis. The underlying condition is that economic actors and their bankers accustomed to credit expansion are beginning to realise the assumptions behind their borrowing commitments earlier in the credit cycle were incorrect.
That’s why it is a credit cycle. It is driven by prior credit expansion which corrals all producers into acting in an expansionary manner at the same time. Random activity, the condition of a true laissez-faire economy, ceases. Instead, credit conditions act on profit-seeking businesses in a state-managed context. Entrepreneurs take the availability of subsidised credit to be a profit-making opportunity. The same cannot be said of governments because they do not seek profits, only revenue.
If a government acts responsibly it should never have to borrow, except perhaps in an emergency, such as to defend the country against invasion. The evolution into unbacked fiat currencies has changed all that by permitting governments to finance themselves through the printing press.
There is only one way a government funds the excess of spending over tax revenue without it being inflationary, and that is to borrow money from savers. There is a downside to this. The government bids for existing savings, including those held in pension and insurance funds, diverting them from other borrowers. In the 1980s this was described as “crowding out” other borrowers and had the effect of increasing interest rates to the point where these other borrowers stop borrowing. In the post-war years, this has been the consequence of spendthrift socialism.
The other two sources of finance for high-spending governments are simply inflationary. Bank credit is expanded to finance short-term treasury bills and treasury bonds. Before 2008, a combination of savings and bank credit expansion was used to cover government funding requirements. But since the great financial crisis, money-printing by central banks through quantitative easing has opened a new avenue for government funding. It is this last financing mechanism which future historians are likely to attribute to the beginning of the end for fiat currencies.
Notionally, quantitative easing is promoted as a monetary policy to stimulate the economy by injecting large amounts of base money into a failing banking system and allowing banks to build their reserves. But the more important effect is it permits a government to spend even more beyond its tax revenues.
Keynesian theory, at least in its original form, recommended excess government spending to stimulate the economy early in what Keynes termed the business cycle. The assumption was that a stronger economy resulting from the earlier credit expansion would improve government finances by increasing tax revenue, and thereby achieve a budget surplus later in the cycle. From time to time governments still pay lip service to the concept of balancing the budget over the business cycle, but not so much now.
As a fiscal policy, balancing budgets over the cycle is no longer relevant; nor is the way in which deficits were funded in classical economic models. The character of today’s welfare-driven economies has changed, with the majority of consumers no longer saving, except though pension and insurance funds. In recent decades these institutionalised savings have reduced their exposure to bonds while increasing their equity investments. They seek returns through capital gains rather than compounding interest. Monetary policy has always favoured the suppression of interest rates and of lower bond yields, encouraging this trend. Savings as a means of financing government debt have virtually disappeared on a personal level and have declined in importance in all but specialised bond funds.
Therefore, the Keynesian desire to maximise current consumption by denigrating savers is almost fulfilled in a number of leading economies. The way in which welfare-driven spendthrift governments fund themselves has changed radically from when individuals invested their savings in government bonds. Instead, governments have become increasingly dependent on financing budget deficits by inflationary means.
US Government borrowing is out of control
There are a number of Western governments whose accumulating debt has become so large relative to their economies that their finances are undeniably out of control. For the purpose of this analysis, we shall restrict our attention to that of the US Government, because it is the issuer of the world’s reserve currency.
Despite the Fed’s suppression of interest rates over the long-term, the cost of federal government borrowing has escalated noticeably, as the following chart up to fiscal 2018 clearly shows.
My colleague, James Turk, calculates the US Government’s insolvency ratio (the interest cost as a percentage of government revenue) to be 17.2% for the first six months of fiscal 2019.[i] In other words, for every $100 raised in taxes, $17.20 goes to pay interest. On this measure, federal government finances are already in crisis.
The Congressional Budget Office’s out-of-date forecast for the 2019 deficit stands at $897bn. The most recent estimates from the Office of Management and Budget (part of the president’s office) is a deficit of $1,092bn for the year. In other words, the debt and interest problem has accelerated significantly in the last six months. Turk concludes the Fed has no option but to reduce interest rates to rescue the finances of the US Government.
It’s a pretty pass. The problem can be viewed from another angle: there has been insufficient growth in nominal GDP to produce the taxes to finance the debt. In the absence of GDP growth, the only way the threat of escalating debt can be addressed is by eliminating the federal deficit. Under current policies, that is not happening, and according to the CBO, budget deficits are set to increase out to 2028 at least.
For fiscal 2019, the CBO had assumed an increase in GDP of 5.02% and 4.08% for 2020. In the light of the sharp economic slow-down which is now becoming apparent, these estimates appear to be incorrect. In other words, not only is the US Government’s insolvency ratio going through the roof, not only is the budget deficit out of control, but the assumptions over GDP growth appear to be far too optimistic.
Since the Lehman crisis in 2008/09 the US Government has been using a singularly bad escape route from the GDP problem by fiddling the inflation figures. To appreciate the full ramifications, we need to understand what GDP represents. GDP is simply a total of recorded qualifying transactions in the economy during a stated period, normally annual or annualised. Growth in the GDP number is not a record of anything else other than monetary inflation applied to those qualifying transactions. In other words, the solution to the lack of inflation in the GDP number is to simply inflate it. This is done through accelerated quantitative easing and by the Federal government increasing its spending in the domestic economy.
As a fix, it may temporarily benefit government finances. But it is the worst thing a government can do, because through wealth-transfer it impoverishes and destroys the non-government economy upon which the government relies for its future tax revenue. While the attractions of easy money to a spendthrift government are immediate and doubtless will be recommended by mainstream economists and commentators, it is the road to accelerating price inflation and the eventual collapse of the currency.
To date, the effect of monetary inflation on the economy has been deliberately concealed. If it had not, the true state of government finances would have been obvious to the general public years ago. By statistical method, mandated index-linked adjustments for price inflation have been reduced to a fraction of what they should be to reflect the true cost of living. When it comes to considerations of pure cost, the benefits of this suppression to government finances are obvious. The more insidious problem is that cost overruns dominate government spending, reflecting the true effects of monetary inflation on prices.
It is an increasingly serious problem. According to the Chapwood Index[ii], price inflation on the goods and services Americans typically buy has been running at close to 10% on average in 50 major cities over the last five years. Instead, financial analysts doggedly accept government CPI statistics, which claim price inflation has averaged only 1.52% over the same timescale. The Chapwood Index reckons by mid-2018 prices were rising annually at 12.6% in New York City, 12.1% in Los Angeles and 11.9% in Chicago. If we accept the Chapwood estimates and apply them as a GDP deflator, we must conclude that in real terms the US economy has been in a continual slump since the financial crisis, and that there is a huge gulf between official interest rates and those that would be demanded by savers if free markets were permitted to operate properly.
One of the oldest clichés in politics is you can fool all of the people for only some of the time. There will come a point where all of the people, collectively the markets, wake up to state-sponsored statistical fraud. With price inflation appearing to accelerate, public apathy over price inflation will be replaced by a substantial and possibly sudden adjustment to money-preferences relative to goods.
The timing of an economic awakening is likely to be linked to the credit cycle, when public support for reflationary actions evolves from complacency to sudden concern. It is one thing to tolerate government intervention when things appear to be going reasonably well or there is a prospect of it succeeding, but when the economy runs into trouble a different mood prevails. If the recent economic slowdown gathers pace public psychology will make that change.
I have argued in other Insight articles that the combination of trade protectionism and the end of the expansionary phase of the credit cycle is a lethal economic combination.[iii] The empirical evidence from the 1929-32 episode could not be clearer. At that time, the Smoot-Hawley Tariff Act coincided with the top of the 1920s credit cycle. Through its trade policy, the US Government is imposing the same conditions today that led to the Great Depression in the 1930s. This time the same combination is being applied with the dollar as reserve currency, backed only by what will become the diminishing faith in and credit of the US Government. And we will then face the prospect of a further acceleration of money-printing in the form of QE.
Assuming the conditions of the 1929-32 Wall Street crash are being only half-replicated, US Government funding requirements will go through the roof. Under the guise of bailing out a deteriorating economy, it is clear that the US Government will not cut its spending. We are seeing a well-established maxim being proved, and that is no government with a fiat currency can resist resorting to the printing press.
The foreign dimension is changing things for the worse
The most inflationary funding mechanism is for one government department (the treasury) to issue bonds to the public and the banks, and another government department (the central bank) to buy them off the public and the banks by issuing raw currency. So as to not raise inflationary suspicions, this overtly inflationary mechanism is called quantitative easing and it is set to return big-time.
So far, QE has covered only part of the US Government’s funding requirement since the Lehman crisis. The full breakdown is shown in the following table, which incorporates both long-term and short-term debt.
It should be noted that foreigners bought an estimated $3,611bn of Treasury debt, significantly more than US banks, funds and other US private sector investors.[iv] By mid-2018, total foreign investments in US Treasuries amounted to $6,201bn, so their holdings have more than doubled since the Lehman crisis. Foreign funding of US debt is the consequence of trade deficits, because dollars end up in foreign hands. It is only part of the trade deficit reinvestment story, but that is what concerns us here.
Foreigners invest in US Treasury and other dollar assets because they need a reserve of dollars to facilitate international trade. Furthermore, with few exceptions they are the most important component of foreign exchange reserves maintained by foreign governments, their central banks and sovereign wealth funds.
Therefore, the level of foreign ownership of dollars is determined primarily by the long-term outlook for trade conditions. If trade is generally expanding foreigners will tend to increase their holdings of dollars, and if trade is contracting, they are likely to reduce them. Some holders will speculate by holding more or less than they normally would on trade considerations alone, but the underlying relationship between the volume of trade and dollar holdings is the most important factor.
In recent years there has been a tendency for some central banks and sovereign wealth funds to reduce their dollar exposure, leading to liquidation of their US Treasury holdings. Between 2015-18, foreign governments and associated sovereign accounts sold a net $893bn of US Treasury securities, most of which was compensated for by foreign private sector purchases. Private sector holdings are likely to be more influenced by the trade outlook than government holdings, which are more strategic in nature.
Given the deteriorating outlook for international trade, it appears likely that foreign corporations will now reduce their dollar holdings, adding to net sales by foreign governments. That being the case, at the same time that the US Government’s funding requirement starts increasing above forecasts, foreigners will be liquidating their Treasury holdings and selling dollars. Therefore, QE is set to become the principal funding mechanism for US Government debt.
Those who reckoned that the Triffin dilemma would guarantee infinite demand for the dollar despite the US Government’s poor financial management could be in for a severe shock. The long-run effect on both the dollar and bond yields is clear to see and should not be underestimated.
How an increasing budget deficit intensifies the slump
Neo-Keynesian economists claim that a budget deficit puts demand into the economy that otherwise would not be there. Along with everyone else they will be alarmed at the speed the budget deficit escalates during a slump, but they are sure to argue that to reduce it will only make things worse.
Assuming there is no change in the savings ratio, the twin deficit phenomenon suggests that an increasing budget deficit will be matched by an increasing trade deficit. (A fuller explanation of the relationship between the deficits and changes in the level of savings is to be found here.) The source of confusion over what is a simple accounting identity is the Keynesians’ denial of Say’s law, incorrectly described by Keynes himself in his General Theory. The correct interpretation of Say’s law is that socially active humans specialise in their production to acquire the goods and services they don’t produce yet need and desire. Money is no more than the transmission mechanism which turns production into consumer goods. Money saved turns production into future goods. It is why the division of labour works to improve our living standards more effectively than any other form of social cooperation.
The key bit is the role of money. Through their control of currency, governments and their licenced banks inflate its quantity. More currency in circulation acts on demand without it being earned and therefore the extra goods and services being produced. Inevitably, prices tend to rise as that money is absorbed in the existing framework of production and consumption. And when prices rise, demand switches to extra imports.
If people saved the inflated money, it would not fuel consumption and therefore a trade deficit would not arise. But Keynesians discourage saving, and as noted earlier in this article, their misplaced policies have virtually destroyed personal savings, except for institutionalised pensions and insurance funds. Allowing for consumer debt, to all intents there are no consumer savings in America. The budget deficit is therefore financed almost entirely by inflationary means, so when an economic slump increases the budget deficit, it must also increase the trade deficit.
Far from maintaining demand levels an increase in the budget deficit, by leading to an increase in the trade deficit, has a catastrophic effect on domestic production. This is because in slump conditions an increasing trade deficit will simply displace domestic production. And attempts to alter the balance in favour of domestic production by raising tariffs against imported goods always fail because of the twin deficit problem. A close study of the consequences of the Smoot-Hawley Tariff Act illustrates this point in spades.
Therefore, unemployment will rise, and the currency will fall. Doubtless, Keynesians will console themselves that a lower currency makes labour costs competitive, an error from which they have been proved incapable of learning. What they miss is that a savings-driven economy, which tends to run trade surpluses for the same reasons a country like America without savings runs deficits,uses consumer savings to invest in reducing unit production costs and improved products. This is shown to be the case by empirical evidence from Germany and Japan in the post-war years, when their rising currencies failed to eliminate their export surpluses.
All that will happen is foreigners end up having more dollars to sell. The currency weakens on the foreign exchanges while its purchasing power in the domestic economy declines. The US Treasury will be funding escalating budget deficits and killing domestic production in the process.
Why bond yields will rise, and the dollar will fail
In the great depression, the dollar was convertible into physical gold at $20.67 to the ounce, and then notionally at $35 from January 1934 onwards. This meant that the interest cost to the US Treasury reflected that of lending gold plus a premium for issuer risk. Today, there is no gold backing, and lenders are aware they must take currency risk into account.
So long as lenders believe government finances are reasonably stable and state-issued statistics are credible, a central bank can depress borrowing costs through an expansionary monetary policy. This is the current position; but when it is no longer the case, a central bank faces an impossible task.
If my thesis that a combination of trade protectionism and the top of the credit cycle is leading the global economy into an economic slump is correct, the consequences will dramatically undermine the US Government’s finances for the reasons detailed in this article. Budget and trade deficits will escalate; the former can only lead to the most inflationary form of funding being deployed and the latter will depress domestic production. And at its hour of greatest need, foreigners will be selling down their dollar portfolios, visiting a new, post-Triffin crisis upon the nation.
It will soon become obvious that the US Government, along with all other high-spending states, is caught in a debt trap of its own making. The folly of post-Keynesian economic and monetary policies, designed to justify governments’ economic existence, will be fully exposed. And as bond yields and the dollar head towards an Argentinian adjustment, the days of the dollar and dollar-denominated debt will be numbered.
end
A few things to note here:
Personal spending rose by a huge .9% month/month and thus USA savings rate plummets again
Person income: constant
thus from Alasdair Macleod’s thesis: as the USA budgetary deficit is skyrocketing so much its trade deficit
(zerohedge)
US Savings Rate Plunges As Consumer Spending Soars By Most In A Decade
After lagged (govt shutdown) and mixed performances in the last two months, income and spending growth was expected to rebound notably in March (despite a weak signal from within the GDP data) and while income growth was lower than expected (+0.1% MoM vs +0.4% MoM exp), spending exploded…
Personal Spending rose 0.9% MoM (well above the 0.7% expected) and the biggest rise since August 2009…
On a year over year basis, spending has accelerated beyond income growth once again…
On the income side, wages unchanged from last month on an annual basis:
Private workers +4.4% Y/Y
Govt Workers +3.0% Y/Y
And as expected given the surge in spending, the savings rate collapsed from 7.3% to 6.5% – the lowest since November.
This is the biggest monthly drop in the savings rate since Jan 2013.
At the same time the Core PCE Deflator is at its lowest since 2017…
…allowing ‘goldilocks’ narratives to flourish ahead of this week’s FOMC.
end
Michael Snyder correctly points out that 102 million Americans do not have a job right now and it is worse than at any point during the last recession.
(courtesy Michael Snyder)
Nearly 102 Million Americans Do Not Have A Job Right Now – Worse Than At Any Point During The Last Recession
Wouldn’t it be horrible if the number of Americans without a job was higher today than it was during the Great Recession of 2008 and 2009? Well, that is actually true.
As you will see below, nearly 102 million Americans do not have a job right now, and at no point during the last recession did that number ever surpass the 100 million mark. Of course the U.S. population has grown a bit over the last decade, but as you will see below, the percentage of the population that is engaged in the labor force is only slightly above the depressingly low levels from the last recession. Sadly, the truth is that the rosy employment statistics that you are getting from the mainstream media are manufactured using smoke and mirrors, and by the time you are done reading this article you will understand what is really going on.
Before we dig into the long-term trends, let’s talk about what we just learned.
According to CNBC, initial claims for unemployment benefits just rose by the most that we have seen in 19 months…
Initial claims for state unemployment benefits jumped 37,000 to a seasonally adjusted 230,000 for the week ended April 20, the Labor Department said on Thursday. The increase was the largest since early September 2017.
In addition, we need to remember that over the last decade lawmakers across the country have made it more difficult to apply for unemployment benefits and have reduced the amount of time that unemployed workers can receive them. In reality, the unemployment situation in this nation is far worse than the mainstream media is telling us.
When a working age American does
not have a job, the federal number crunchers put them into one of two different categories. Either they are categorized as “unemployed” or they are categorized as “not in the labor force”.
But you have to add both of those categories together to get the total number of Americans that are not working.
Over the last decade, the number of Americans that are in the “unemployed” category has been steadily going down, but the number of Americans “not in the labor force” has been rapidly going up.
In both cases we are talking about Americans that do not have a job. It is just a matter of how the federal government chooses to categorize those individuals.
At this moment, we are told that only 6.2 million Americans are officially “unemployed”, and that sounds really, really good.
But that is only half the story.
What the mainstream media rarely mentions is the fact that the number of Americans categorized as “not in the labor force” has absolutely exploded since the last recession. Right now, that number is sitting at 95.577 million.
When you add 6.2 million “officially unemployed” Americans to 95.577 million Americans that are categorized as “not in the labor force”, you get a grand total of almost 102 million Americans that do not have a job right now.
If that sounds terrible to you, that is because it is terrible.
Yes, the U.S. population has been growing over the last decade, and that is part of the reason why the number of Americans “not in the labor force” has been growing.
But overall, the truth is that the level of unemployment in this country is not that much different than it was during the last recession.
John Williams of shadowstats.com tracks what the real employment figure would be if honest numbers were being used, and according to him the real rate of unemployment in the United States at the moment is 21.2 percent.
That is down from where it was a few years ago, but not by that much.
Another “honest” indicator that I like to look at is the civilian labor force participation rate.
In essence, it tells us what percentage of the working age population is actually engaged in the labor force.
Just before the last recession, the civilian labor force participation rate was sitting at about 66 percent, and that was pretty good.
But then the recession hit, and the civilian labor force participation rate fell below 63 percent, and it stayed between 62 percent and 63 percent for an extended period of time.
So where are we today?
At this moment, we are sitting at just 63.0 percent.
Does that look like a recovery to you?
Of course not.
If you would like to claim that we have had a very marginal “employment recovery” since the last recession, that is a legitimate argument to make. But anything beyond that is simply not being honest.
The good news is that employment levels have been fairly stable in recent years, but the bad news is that unemployment claims are starting to shoot up again.
A number of the experts that I am hearing from expect job losses to escalate in the months ahead. Many of those that are currently living on the edge financially suddenly won’t be able to pay their mortgages or their bills.
Just like the last recession, we could potentially see millions of middle class Americans quickly lose everything once economic conditions start getting really bad.
The economy is not going to get any better than it is right now. As you look forward to the second half of 2019, I would make plans for rough sailing ahead.
end
It seems that everyone is perplexed as the strong GDP report on Friday. It is a fake
(courtesy zerohedge)
Fake Growth? Exploring The Big Mystery In Friday’s GDP Report
We have become accustomed to the miraculous economic data ‘surprises’ that are propagandized out of China month after month – not too hot, not too cold, but just right – but in the latest US GDP data, as MarketWatch’s Greg Robb investigates, mystery theater comes to American government data…
It is a case that would make Sherlock Holmes proud.
Growth in the first quarter smashed expectations, fueled in part by strong inventory building. According to the government, $32 billion of goods were added to inventories this quarter, or $128 billion annualized.
This stockpiling of goods boosted first-quarter GDP growth by about 70 basis points and helped propel growth to a 3.2% annual rate, well above forecasts.
The problem is that it is not at all obvious where these inventories came from. Goods have to come from somewhere, either produced by domestic firms or imported from abroad.
The mystery is that both production and imports fell in the first three months of the year, according to government data.
“You can’t stockpile what you do not import or do not produce,” said Robert Brusca, chief economist at FAO Economics.
The Fed reported last week that industrial output slipped at a 0.3% annual rate in the first quarter.
And the government’s GDP report estimates that imports fell 3.7% in the first three months of the year.
The one other explanation — that consumption fell sharply enough to leave businesses with unexpected unsold goods — also doesn’t fit the evidence, Brusca said.
Consumption did not fall faster than industrial production or imports to generate any surplus, he said. To be sure, spending on consumer durable goods fell 5.3%, the biggest drop in 10 years. Business spending on equipment was also weak.
“Any way you slice it, this GDP report…is an apparent mess,” he said.
One possible culprit is Boeing, which could have some unsold 737 Max 7 airplanes. But these have a list price of $100 million. That doesn’t account for $32 billion in inventories.
Another possibility is that the government tinkered with the report to try to solve an ongoing problem of “residual seasonality”that tended to push down first-quarter growth estimates, Brusca said.
The White House had a few different explanations for the discrepancy.
Top White House economic adviser Larry Kudlow said the inventory build was mainly in autos, and wouldn’t be a problem because consumers would be opening their wallets.
Another White House economist, Kevin Hassett, seemed to suggest that the extra production wasn’t picked up in the Fed’s report on industrial production.
“People built new factories last year. This year they’re turning them on and are beginning to produce output. In the first quarter, I think a lot of that new output from the new factories went into inventories,” Hassett told CNBC.
The inventory mystery has key implications for the outlook. If the inventory build is real and unwanted, it might slow production.
On the other hand, if it is somehow revised away, growth in the second quarter might not be as weak as some expect. All this when Fed officials have stressed they are going to be more dependent on the data in setting interest rates.
END
We have been pointing this out to you on several occasions. As the world is slowly bypassing the dollar there is a huge amount of dollars floating around the world with no place to go except the uSA. This is coupled with the high budgetary deficit of the uSA which is also sucking dollars into the USA with reckless abandon. Brace for everyday food prices to rise.
(courtesy zerohedge)
Americans Brace For Shocking Surge In Everyday Food Prices
The ‘patient’ Fed has been lamenting the “lack of inflation” for far too long. It is about to get its wish.
American food merchants are struggling to import fruits and vegetables from Mexico as wait times at port of entries along the Mexico–US border have surged because of a shift in Customs and Border Protection (CBP) personnel away from the port of entries to remote regions of the border to fight illegal crossings. As a result, shipments of food have dramatically declined in recent weeks, and the result is an imminent spike in imported food prices in the coming months that could put a sizeable dent in consumer wallets.
After the avocado price surge, cucumbers, eggplants, bell peppers, squash, cherry tomatoes, watermelons, and most other fruit and vegetables imported from the tropics would be affected.
“(The) Mexican border, it’s one of the most important crossings to the United States,” said Joshua Duran, Amore Produce sales representative.
About 43% of all US fruit and vegetables originate from Mexico. In the last several decades, Mexico has become the top trading partner with the US. Much of the US-Mexico commerce involves mega-corporations that send products back and forth across the border as part of a critical segment of their supply chain that has increased since the North American Free Trade Agreement (NAFTA) took effect in 1994.
This month [April], distributor Amore Produce truck drivers hauling product from Mexico have experienced a 300% wait time at the various port of entries along the Mexico–US border, stuck in line for up to 15 hours.
“Now we are having a lot of problems in the border,” Duran said. “So, let’s say we used to have like five hours. We’re getting 10 or 15 hours to pass that truck to the United States…one or two (gates) are not enough to get all the entire trucks coming from Mexico and not only for produce, for all the products that people here in the United States get from Mexico.”
Increase wait times have depleted cold storage inventories of McAllen Produce Terminal Market, located just 20 minutes from the border. Duran said the importer cannot ship fresh produce across the country anymore becuase their truck drivers are waiting almost a day to move product across the port of entry – by the time it makes it to the US, the produce won’t make it fresh to the wholesaler.
“We couldn’t get it here and we couldn’t send it to the customers in the north,” Duran said.
Marabella Produce owner Alejandro Knight suggested that wait time increases have impacted his cold-storage levels in the last month. Knight said his warehouse is always at full capacity, but now, the floors are covered with empty pallets. Most of the produce Knight receives from Mexico is spoiled, thanks to wait time increases, warehouse workers have to immediately throw out the produce once it arrives.
“We cannot deliver a fresh product anymore if we have to wait for each load to cross, five to six days, it’s impossible to work like this,” Knight warned.
Knight said Mexican farmers are now “afraid” to export fruits and vegetables to the US because of extended wait times.
Salavador Contreras, an economist at the University of Texas Rio Grande Valley, said if wait times increase, it could inflate produce for everyday American consumers.
“It’s going to be felt at the grocery stores when we start paying more for limes and our avocados at the grocery store,” Contreras said.
If the wait times persist at the border, in the coming months Americans will be shocked by soaring prices in the produce section of their local grocery stores, a move that could reverse consumer sentiment right before an important election year. But at least the Fed will be delighted: it will have achieved some of that “symmetric” inflation overshoot it has been seeking for so long… and all thanks to Trump.
end
This is alarming: credit card write off soar to 7 yr highs.
(courtesy zerohedge)
Alarms Go Off As Credit Card Charge-Offs Soar To Seven Year High
An ominous trend, indicating US consumers are in far worse shape than assumed by conventional wisdom, has re-emerged.
Regular readers may recall that two years ago we wrote that “Credit Card Defaults Surge Most Since Financial Crisis.” And while this deteriorating trend had more or less plateaued for much of 2018, it has taken another big step higher and as Bloomberg reports “red flags are flying in the credit-card industry after a key gauge of bad debt jumped to the highest level in almost seven years.”
According to advance data from Bloomberg Intelligence, which will soon flow through to the S&P/Experian Bankcard Default Index, after staying largely flat for much of 2017 and 2018, the first three months of 2019 saw a troubling jump in the nationwide credit card charge-off, or default rate to 3.82%, the highest in seven years or since the second quarter of 2012. At the same time, the number of loans 30-days past due, a leading indicator of future write-offs, jumped at all seven of the largest U.S. card issuers.
Some examples: Capital One said this week that its first-quarter U.S. card charge-off rate climbed to 5.04% from 4.64% at the end of 2018. At Discover Financial Services, which also reported results on Thursday, the charge-off rate rose to 3.5% from 3.23% in the prior quarter.
As for what is causing this sharp jump in charge offs, some credit card issuers blamed artificially increased FICO scores. As readers may recall, two weeks ago we asked if “Inflated” FICO Scores Will Be The Catalyst For The Next Meltdown” noting that credit score inflation “is the idea that debtors are actually riskier than their scores indicate, due to metrics not accounting for the “robust” economy, which may negatively affect the perception of borrowers’ ability to pay back bills on time. This means that when a recession finally happens, there could be a larger than expected fallout for both lenders and investors.”
There are around 15 million more consumers with credit scores above 740 today than there were in 2006, and about 15 million fewer consumers with scores below 660, according to Moody’s.
The problematic implication is that while FICO scores may represent a far stronger US consumer, the reality is just the opposite, as Capital One implied during its Thursday conference call, when Richard Fairbank, CEO of Capital One which is the country’s third-largest credit card issuer, warned that there’s been a “degradation” in credit quality for certain customers, adding that “some customers with negative credit events during the financial crisis are now seeing those problems disappear from their credit-bureau reports.” And yet, the same customers are just as unlikely to repay their credit card bill whether their FICO score is 750 or 680.
“We may be looking at data that might not paint the full picture of a consumer’s credit history,” Fairbank said during the Thursday earnings call with analysts. “Part of the context for our caution has been not only how deep we are in the cycle but, also, this is the time period when there is less information than there once was.”
Did someone say non-GAAP credit scores? Because that’s precisely what the artificially inflated FICO scores have become, and they are presenting an unreliable picture of a customer’s ability, or eagerness, to pay down their credit card debt. Hence the jump in charge offs.
Others echoing the warning included the CEO of Discover Card, Roger Hochschild, who said that “certainly, this has been one of the longest recoveries, so, in general, we have been contracting credit policy at the margin and tightening.” In an interview with Bloomberg, Hochschild said his company has been closing inactive accounts and slowing down the number and size of credit-line increases for both new and existing customers.
Almost as if those artificially higher non-GAAP FICO scores no longer represent reality… just like non-GAAP financial results.
Meanwhile, as Bloomberg adds, the credit card industry’s latest warnings build on developments in January, when fourth-quarter results showed charge-off rates near the lowest in decades were coming to an end, something we discussed at the time. As a result, competition for the highest-quality customers remains fierce, leading many issuers to spend more on marketing and rewards to gain market share with that group.
“If you think about lending products, there are always people who want to take your money,” Hochschild said. “You’re going for people who have many choices — they have existing cards, they could get any card they want. So our job is to make sure those are the ones we attract to Discover.”
But a growing wariness about the potential for a rise in bad debt has led many issuers to tighten underwriting and to make issuance of new credit more problematic, creating a vicious loop where those who need credit the most are also the least likely to get it.
That said, it’s certainly not a crisis yet: charge-offs remain not far from historic lows as banks benefit from low unemployment rates in the US. On the other hand, with overall interest rates in the US still near historic, record lows, the fact that charge offs are already surging is just another reason why the Fed will find it impossible to hike rates higher, and in fact, if the deteriorating default trend continues, the central bank may have no choice but to cut rates soon. And while that may kick the can for a few quarter, all such a goosing of US consumer will achieve, is make the next recession – and financial crisis – that much worse when it finally hits, because if American’s can make their credit card payment when unemployment is a record low and GDP is – allegedly – growing above 3%, one wonder what will happen when the next recession does finally hit.
end
More Boeing troubles as the FAA turn to the new Dreamliner hydraulic leakage
(courtesy zerohedge)
Boeing Shares Slide As FAA Turns Attention To Dreamliner Hydraulic Leakage
Ahead of Boeing CEO Dennis Muilenburg’s first showdown with shareholders since the March 10 crash of Ethiopian Airlines flight 302, the FAA has drawn attention to recent reports about dangerous hydraulic leakages involving the Boeing 787, otherwise known as the ‘Dreamliner’.
The regulator is imposing a new ‘flight directive’ on Dreamliners, meaning planes could be grounded if they don’t undergo additional rounds of inspections and records checks to make sure parts including the aileron and elevator power control units are still working properly.
Shares dumped as this news added to anxieties about a weekend report about Boeing’s failure to alert the FAA and Southwest, its biggest customer, that it had disabled an important safety feature on the 737 MAX 8.
Still, Boeing shares are – incredibly – still up 17% on the year.
end
SWAMP STORIES
the Ukraine connection and how the Ukrainian government did everything in their power to illegally help Clinton win against Trump and how the Manafort investigation started.
(courtesy zerohedge)
Ukraine Tapped By Obama Admin To Hurt Trump, Help Clinton And Protect Bidens
In January, 2016, the Obama White House summoned Ukrainian authorities to Washington to discuss several ongoing matters under the guise of coordinating “anti-corruption efforts,” reports The Hill‘s John Solomon.
The January 2016 gathering, confirmed by multiple participants and contemporaneous memos, brought some of Ukraine’s top corruption prosecutors and investigators face to face with members of former President Obama’s National Security Council (NSC), FBI, State Department and Department of Justice (DOJ).
The agenda suggested the purpose was training and coordination. But Ukrainian participants said it didn’t take long — during the meetings and afterward — to realize the Americans’ objectives included two politically hot investigations: one that touched Vice President Joe Biden’s family and one that involved a lobbying firm linked closely to then-candidate Trump. –The Hill
The Obama officials – likely knowing that lobbyist Paul Manafort was about to join President Trump’s campaign soon (he joined that March), were interested in reviving a closed investigation into payments to US figures from Ukraine’s pro-Russia Party of Regions – which both Paul Manafort and Tony Podesta did unregistered work for, according to former Ukrainian Embassy political officer Andrii Telizhenko.
The 2014 investigation focused heavily on Manafort, whose firm was tied to Trump through his longtime partner and Trump adviser, Roger Stone.
Agents interviewed Manafort in 2014 about whether he received undeclared payments from the party of ousted Ukrainian President Viktor Yanukovych, an ally of Russia’s Vladimir Putin, and whether he engaged in improper foreign lobbying.
The FBI shut down the case without charging Manafort
Telizhenko and other attendees of the January, 2016 meeting recall DOJ employees asking Ukrainian investigators from their National Anti-Corruption Bureau (NABU) if they could locate new evidence about the Party of Regions’ payments to Americans.
“It was definitely the case that led to the charges against Manafort and the leak to U.S. media during the 2016 election,” said Telizhenko – which makes the January 2016 gathering in DC one of the earliest documented efforts to compile a case against Trump and those in his orbit.
Nazar Kholodnytskyy, Ukraine’s chief anti-corruption prosecutor, told me he attended some but not all of the January 2016 Washington meetings and couldn’t remember the specific cases, if any, that were discussed.
But he said he soon saw evidence in Ukraine of political meddling in the U.S. election. Kholodnytskyy said the key evidence against Manafort — a ledger showing payments from the Party of Regions — was known to Ukrainian authorities since 2014 but was suddenly released in May 2016 by the U.S.-friendly NABU, after Manafort was named Trump’s campaign chairman.
“Somebody kept this black ledger secret for two years and then showed it to the public and the U.S. media. It was extremely suspicious,” said Kholodnytskyy – who specifically instructed NABU not to share the “black ledger” with the media.
“I ordered the detectives to give nothing to the mass media considering this case. Instead, they had broken my order and published themselves these one or two pages of this black ledger regarding Paul Manafort,” he added. “For me it was the first call that something was going wrong and that there is some external influence in this case. And there is some other interests in this case not in the interest of the investigation and a fair trial.”
Manafort joined Trump’s campaign on March 29, 2016 and became campaign manager on May 19, 2016. The ledger’s existence leaked on May 29, 2016, while Manafort would be fired from the Trump campaign that August.
NABU leaked the existence of the ledgers on May 29, 2016. Later that summer, it told U.S. media the ledgers showed payments to Manafort, a revelation that forced him to resign from the campaign in August 2016.
A Ukrainian court in December concluded NABU’s release of the ledger was an illegal attempt to influence the U.S. election. And a member of Ukraine’s parliament has released a recording of a NABU official saying the agency released the ledger to help Democratic nominee Hillary Clinton’s campaign.
Rudy Giuliani
✔@RudyGiuliani
If the media continues to ignore the possible Ukrainian-DNC conspiracy in 2016 to find and create damaging information about Trump, Manafort and the Trump campaign, it will amount to corruption. For those of us still open to change, help us and cover it. You know it’s NEWS!
Ignoring others, protecting Bidens
Kostiantyn Kulyk – deputy head of the Ukraine prosecutor general’s international affairs office, said that Ukraine also had evidence of other Western figures receiving money from Yanukovych’s party – such as former Obama White House counsel Gregory Craig – but the Americans weren’t interested.
“They just discussed Manafort. This was all and only what they wanted. Nobody else,” said Kulyk.
Another case raised at the January 2016 meeting involved the Bidens – specifically Burisma Holdings; a Ukrainian energy company which was under investigation at the time for improper foreign transfers of money. Burisma allegedly paid then-Vice President Joe Biden’s son Hunter more than $3 million in 2014-15 as both a board member and a consultant, according to bank records.
According to Telizhenko, U.S. officials told the Ukrainians they would prefer that Kiev drop the Burisma probe and allow the FBI to take it over. The Ukrainians did not agree. But then Joe Biden pressured Ukrainian President Petro Poroshenko to fire Ukraine’s chief prosecutor in March 2016, as I previously reported. The Burisma case was transferred to NABU, then shut down.
The Ukrainian Embassy in Washington on Thursday confirmed the Obama administration requested the meetings in January 2016, but embassy representatives attended only some of the sessions.
Last Wednesday on Fox and Friends, Trump attorney Rudy Giuliani said “I ask you to keep your eye on Ukraine,” referring to collusion to help Hillary Clinton in the 2016 election.
What’s more, DOJ documents support Telizhenko’s claim that the DOJ reopened its Manafort case as the 2016 election ramped up – including communications between Associate Attorney General Bruce Ohr, his wife, Nellie, and ex-British spy Christopher Steele, as Solomon writes.
Nellie Ohr and Steele worked in 2016 for the research firm, Fusion GPS, that was hired by Clinton’s campaign and the Democratic National Committee (DNC) to find Russia dirt on Trump. Steele wrote the famous dossier for Fusion that the FBI used to gain a warrant to spy on the Trump campaign. Nellie Ohr admitted to Congress that she routed Russia dirt on Trump from Fusion to the DOJ through her husband during the election.
DOJ emails show Nellie Ohr on May 30, 2016, directly alerted her husband and two DOJ prosecutors specializing in international crimes to the discovery of the “black ledger” documents that led to Manafort’s prosecution.
“Reported Trove of documents on Ukrainian Party of Regions’ Black Cashbox,” Nellie Ohr wrote to her husband and federal prosecutors Lisa Holtyn and Joseph Wheatley, attaching a news article on the announcement of NABU’s release of the documents.
Politico reported previously that the Ukrainian Embassy in Washington assisted the Hillary Clinton campaign through a DNC contractor, while the Ukrainian Embassy acknowledges that it got requests from a DNC staffer to find dirt on Manafort (though it denies providing any improper assistance.”
As Solomon concludes: “what is already confirmed by Ukrainians looks a lot more like assertive collusion with a foreign power than anything detailed in the Mueller report.”
END
A good one!! Meijer explains why Biden’s nomination for President will be harmful to the DNC as he has considerable bad baggage
Joe Biden is working for Donald Trump, right? I haven’t heard either of them say it outright, but it’s the only reason I can see that would explain why Biden is running for president. And if Biden works for Trump, that means he works for Putin, because Trump is Putin’s puppet, no matter how often Robert Mueller denies it.
Then again, if we would suggest, purely hypothetically and for entertainment purposes only, that Biden is neither Putin’s nor Trump’s puppet, what on earth drives him to declare his candidacy as the oldest ever presidential candidate in US history? Biden will be Trump’s punching bag. There is so much wrong with and about the man, Trump’s not even laughing, just saying: “oh yes, please, bring it.”
Biden has the Anita Hill boondoggle to his name, there’s a huge nascent story concerning Ukraine, where he interfered, while vice-president, to benefit his son, and there are tons of women who will come with groping tales. This will be a very long list, as long as his career in Washington. Biden bumbles and stumbles for a living. Someone’s going to write a book about that someday.
And perhaps most of all, Biden is the product and candidate of the DNC, which may think they got away with what they did in 2016, but will find out that it just ain’t so. They may all think that if Trump is made of Teflon, Joe can be as well, but Teflon is a rare material for politicians to be made of.
The Democrats’ hard-to-grasp decision to put everything on the red of collusion for 3 years, and their subsequent colossal loss, will play an outsize role in the 2020 campaign, and of course much more so if an old hand like Joe Biden is put out front to catch the worst of the blows. A lot will come out of the upcoming “counter-Mueller” investigations, starting with DOJ IG Michael Horowitz’s in May, and Trump will only have to say: “You were there all along, Joe, all the way”.
Despite the DNC’s illegal actions and shenanigans, they are still the organization that in the end picks the candidate. Will it be Joe Biden, or will he be knock-out by this time next year? It all depends on who the DNC is going to nominate support, and the DNC is still very much Hillary and the Debbie Wasserman-Schultz cabal.
Bernie Sanders is polling second at this point in time, but Bernie would have to explain away why he surrendered his spot to Hillary after the DNC took it away from him in a clearly fraudulent manner (as we know though WikiLeaks files). What all those people whose millions in campaign donations he squandered away by doing that, even endorsing Hillary, should want to know is: will you do it again this time, Bernie, turn your back on us? You know, once bitten, twice shy?
CNN made up another story out of nothing to make us believe Trump is scared of Biden: “Biden Is Trump’s Most Anticipated – And Feared – Rival”. The gist of it is that they have a source in the White House who says Trump has mentioned Biden in a meeting, and that must mean he fears him.
What is Trump supposedly afraid of? Of Biden taking up print- and airspace and luring away “lower-income white voters who propelled Trump to the White House.” Sure. And if you’re interested, I still own that bridge. To balance things out they also include a line that makes their entire article look useless and ridiculous in two seconds flat. They quote David Urban, a senior adviser to the Trump campaign in Pennsylvania, saying. “If voters wanted a third Obama term, they would have voted for Hillary (Clinton) over Donald Trump.”. And:
[Trump] has denied to reporters that he views the former vice president as a danger, telling CBS News in an interview last year he “dreamed” of running against Biden. Earlier this month he insisted Biden was saddled with a long and ignominious record – including during the Obama administration, which Trump has blamed with increased frequency for foreign and economic policy blunders. “I don’t see Joe Biden as a threat. No, I don’t see him as a threat. I think he is only a threat to himself,” Trump said. “He’s been there a long time. His record’s not good. He’d have to run on the Obama failed record.”
Makes you wonder why CNN wrote that piece, doesn’t it? Are they also on Putin’s payroll? It’s something I’ve often suspected as the mainstream media bungled their way through Mueller Time. Kim Dotcom also had a nice one on Twitter:
Barack Obama didn’t endorse Joe Biden and advised him not to run because now everyone will be looking for dirt on Biden. There’s a lot of dirt and Obama is right there with him in the mud of corruption and unlawfulness. Exciting times.
The DNC, and the Democratic Party as a whole, have a massive legacy problem. Their entire leadership look like a Monday Bingo night in a pensioners home, with botox overdoses for the winners. The entire culture is based on “it’s her/his turn”, and it’s exceedingly rare for anyone to volunteer to step down before they have attained full dementia.
They appear to have a number of younger people who could fill in those roles, but those will have to wait until Pelosi et al have had their fill at the power trough. This is extremely damaging to the party, and ultimately for the whole country, which badly needs a strong party to balance out Trump and his ilk.
But there’s no such balance, and Biden doesn’t have a chance in hell against Trump. The Democrats don’t see this, because that would mean their leaders have to remove themselves from their positions. Fat -old- chance.
The Democrats have promising -though not flawless- young candidates lining up, and they are being pushed to the sidelines. I like the idea that they are letting 20 or more of them in the race just so in the end the DNC will have to decide, and they already have Kamala Harris lined up, but Kamala would only be another DNC candidate. Same problem as Biden.
The ‘leadership’ still clings to the collusion narrative, and that is playing right into Trump’s hands. Collusion, Julian Assange, Maria Butina, these are all made-up stories the Democrats think will be profitable for them. But they only think it because it’s the only way to explain Hillary’s loss that doesn’t expose their gross incompetence.
The Democrat-ruled Congress should make sure the Trump administration frees Butina, drops the extradition request for Assange, and apologizes to Russia for all the empty and hostile allegations. Not going to happen. Pelosi, Hillary and Schumer need the collusion narrative Mueller just entirely discredited. Yes, that is desperate as it sounds.
The Democrat old guard have given up on having a vision for the nation, and instead focus all their energy on scheming and plotting and hanging on to their power. And on trying to get old white men elected. But America is no longer a country for white old men. That ends with Trump. Like a lot ends with Trump. But for now he’s still there.
END
Another great commentary from Kim Strassel. Why didn’t Mueller determine whether the Steele dossier was Russian disinformation. Maybe I G Horowitz or Bill Barr will give us the answer to that
Since the release of special counsel Robert Mueller’s redacted report, several questions have been asked as to why certain things were not investigated, and key players were never interviewed, according to President Trump.
Donald J. Trump
✔@realDonaldTrump
Isn’t it amazing that the people who were closest to me, by far, and knew the Campaign better than anyone, were never even called to testify before Mueller. The reason is that the 18 Angry Democrats knew they would all say ‘NO COLLUSION’ and only very good things!
Perhaps the most glaring omission is Mueller’s failure to consider that the infamous “Steele Dossier” – which used Kremlin sources – could have been Russian disinformation itself.
Asking that very question, the Wall Street Journal’s Kimberly Strassel opines on this “stunning omission.”
Politicians keep reminding us not to lose sight of special counsel Robert Mueller’s broader assignment: to investigate Russia’s interference in the 2016 election. If only someone had reminded Mr. Mueller.
One of the biggest failures of the Mueller probe concerns not what was in the final report, but what was not. Close readers will search in vain for any analysis of the central document in this affair: the infamous “dossier.” It’s a stunning omission, given the possibility that the Russians used that collection of reports to feed disinformation to U.S. intelligence agencies, sparking years of political maelstrom.
The dossier—compiled by former British spy Christopher Steele on behalf of Fusion GPS, an opposition-research firm working for the Hillary Clinton campaign and the Democratic National Committee—fed to the Federal Bureau of Investigation and the media the principal allegations of the “collusion” narrative. It claimed Paul Manafort was at the center of a “well-developed” Trump-Russia “conspiracy”; that Carter Page served as his intermediary, conducting secret meetings with a Kremlin official and the head of a state energy company; that Michael Cohen held a clandestine meeting in Prague with Vladimir Putin cronies; and that the Russians had compromising material on Donald Trump, making him vulnerable to blackmail. The dossier was clearly important to the FBI probe. Its wild claims made up a significant section of the FBI’s application for a secret surveillance warrant on Mr. Page.
The Mueller report exposes the dossier claims as pure fiction. Yet in describing the actions of the Trump campaign figures the FBI accused, the report assiduously avoids any mention of the dossier or its allegations. Mr. Mueller refers to Mr. Steele and his work largely in passing, as part of the report’s description of how former FBI Director James Comey informed Mr. Trump of the dossier’s existence. The dossier is blandly described several times as “unverified allegations compiled” by Mr. Steele.
Once Mr. Mueller established that the dossier was a pack of lies, he should have investigated how it gained such currency at the highest levels of the FBI. Yet his report makes clear he had no interest in plumbing the antics of the bureau, which he led from 2001-13. Instead, he went out of his way to avoid the dossier and give cover to the FBI.
The special counsel had another, more pressing reason to look at the dossier: It fell within his core mission. Since its publication by BuzzFeed in January 2017, we’ve learned enough about Mr. Steele and Fusion GPS to wonder if the Russians used the dossier for their own malign purposes.
In the first telling, Mr. Steele was described by friendly media as simply a “former Western intelligence official” with a history at Britain’s overseas intelligence service. It turns out he worked in Russia. Mr. Steele spent his first years of service under diplomatic cover in Moscow, later in Paris. And in 1999 he was among 117 British spies whose covers were publicly blown by a disgruntled ex-MI6 officer.
The former spy, known to the public and therefore to Russia, also became known for sending reports to the U.S. government. Last year former Obama State Department official Jonathan Winer explained that in 2009 he became friendly with the self-employed Mr. Steele, and starting as early as 2013 ensured that “more than 100 of Steele’s reports” on Russia topics were shared with the State Department. Given that the dossier is largely based on Russian sources, some supposedly connected to the Kremlin, did the Kremlin know about this arrangement and see an opportunity to spoon-feed the U.S. government disinformation?
We’ve also learned more about Mr. Steele’s and Fusion’s connections to Russians. Mr. Steele sent a series of emails to Justice Department employee Bruce Ohr in 2016 inquiring about the status of a visa for Oleg Deripaska, an oligarch with Kremlin ties. Fusion GPS was working alongside Natalia Veselnitskaya, the Russian lawyer who arranged the infamous meeting with Donald Trump Jr. in June 2016. Fusion was hired as part of a team to help Ms. Veselnitskaya undermine Bill Browder, the man behind the Magnitsky Act, a law that imposes sanctions on Russians for corruption and human-rights violations.
How did Mr. Mueller spend two years investigating every aspect of Russian interference—cyberhacking, social-media trolling, meetings with Trump officials—and not consider the possibility that the dossier was part of the Russian interference effort?
Justice Department Inspector General Michael Horowitz and Attorney General William Barr may answer some of the questions Mr. Mueller refused to touch. Thanks to the special counsel we know Republicans weren’t playing footsie with Russians. But thanks to BuzzFeed, we know that Democrats were. America deserves to know how far that interaction extended.
Joe DiGenova is one of the best constitutional lawyers in the uSA. He explains in detail why the Don Jr. meeting at Trump Tower is a phony..ie. the collecting of dirt from a foreign national violates USA election laed
(a must read…Joe Digenova)
DiGenova Destroys Media’s “Reckless” Promotion Of Trump Tower Meeting As Crime
Leading up to the Mueller report, one of the long-promised “gotchas” peddled by the anti-Trump media is that that Donald Trump Jr. would be indicted over a June 9, 2016 meeting in Trump Tower with Russian representatives who promised negative information on Hillary Clinton.
Keep in mind, the Russian attorney who sought the discussion – Natalia Veselnitskaya – met with Fusion GPS co-founderGlenn Simpson before and after the Trump Tower meeting. Fusion was hired by the Clinton campaign and the DNC to produce the now-infamous “Steele Dossier.”
Also keep in mind that Trump Jr. reportedly shut down the meeting when it was obviously not going to bear fruit.
Obvious setups aside, former US Attorney Joe diGenova has penned an Op-Ed for Fox Newsexcoriating the media for ‘recklessly’ promoting an untested falsehood; that the meeting was illegal in the first place.
The president’s eldest son, an outspoken and unapologetic conservative, is a favorite punching bag of the left. For more than two years, liberal journalists and shrieking “#resistance” activists have salivated over the thought of seeing Don Jr. carted off in handcuffs.
To their dismay, there is only one crucial takeaway from the Mueller report’s conclusions about the utterly inconsequential “Trump Tower meeting” between Don Jr., several Russians, and others: neither Don Jr. nor anyone else involved in the meeting was charged with any crime.
The reasons are clear. The entire theory about what was potentially illegal about the meeting was speculative and untested. What’s more, even if it were illegal, the report concluded that Don Jr. didn’t have the “willful” intent to break the law that would be necessary to make it a crime.
In their disappointment, Don Jr.’s detractors have latched on to a new theory: that he was simply “too stupid” to be charged with a crime because he didn’t know that his conduct was illegal.
They hang this blatant misconstruction on these words from the report: “the Office did not obtain admissible evidence likely to meet the government’s burden to prove beyond a reasonable doubt that these individuals acted ‘willfully,’ i.e. with general knowledge of the illegality of their conduct.”
That’s not just some minor technicality, absent which Robert Mueller’s prosecutors would have had Don Jr. in shackles while revelers in cat-eared pink hats danced in the streets. It’s a central element of the offense they were investigating, and they decided to clear Don Jr. because without it there is no crime.
One often-used definition of “willful” intent states that it “requires proof beyond a reasonable doubt that the defendant knew his or her conduct was unlawful and intended to do something that the law forbids; that the defendant acted with a purpose to disobey or disregard the law.”
In essence, in order to be charged with conspiring to cheat, you have to have been actually meaning to cheat. That’s the law. Without intent, there is no crime. And Mueller’s team, even his hand-picked Democrat attack dog Andrew Weissmann, knew they didn’t have evidence to convince a jury that Don Jr. meant to circumvent election laws when he typed “I love it” in response to a tangentially-related British publicist’s suggestion the Russian government might have “information that would incriminate Hillary.” Don Jr. even voluntarily released his email correspondence related to that meeting.
But even if there were the requisite intent, the Mueller report still exonerates Don Jr., stating that “the government would likely encounter difficulty proving beyond a reasonable doubt that the value of the promised information exceeded the threshold for a criminal violation.”
Did you catch that?
For the English speakers among you, let me translate that from Weissmann-speak: “This ‘crime’ we thought up as a way to nail Don Jr. is so speculative and unprecedented, we don’t think there’s a court in the land that would let this fly.”
The entire notion of a criminal conspiracy is predicated on the idea that the federal election law’s ban on campaigns taking “contributions” or “things of value” from foreign nationals also applies to “dirt” on opposing candidates.
That’s hardly an established interpretation of the law. In fact, no one has ever been convicted of something similar. If “dirt” is a “thing of value” for campaign finance purposes, that is a dangerously radical innovation with huge potential First Amendment implications.
Personally, I think it’s a completely untenable interpretation, but don’t take my word it. Mueller and his team considered it, as well — and then rejected it as too “difficult to prove” in their report.
I wonder how many of the journalists calling Don Jr. stupid were so certain about this far-fetched legal theory. I further wonder how many of them felt the same way when foreign national Christopher Steele handed the Hillary Clinton campaign a whole dossier of “dirt” on President Trump — at a hefty, agreed-upon price, no less.
The whole thing is pure “#resistance” fantasy.
It was reckless for the media to promote the Trump Tower meeting as a crime, and it was irresponsible for Mueller’s report to discuss the matter using language that allows people who hate Don Jr. to continue in that delusion.
Lots of fun and games with this one>Kim Foxx is being subpoenaed over her office’s decision to drop the Smollet case
(courtesy zerohedge)
Top Chicago Prosecutor Subpoenaed Over Office’s Decision To Drop Smollett Charges
Following a wave of departures from her office and an intensifying inspector general investigation into her handling of the Jussie Smollett case, where she dropped a 16-count felony indictment against the actor after he allegedly faked his own hate crime, one retired judge is turning up the heat on Kim Foxx, Chicago’s state’s attorney.
According to the Chicago Sun-Times, Foxx has been subpoenaed by ex-appellate Judge Sheila O’Brien to appear at a hearing over her handling of the case. The judge is pushing for the appointment of a federal prosecutor.
O’Brien has also subpoenaed Foxx’s top deputy Joseph Magats; she also filed a document requesting that Smollett – who was accused of staging the attack for personal gain – appear at the hearing.
She alleged that Foxx’s handling of the case was “plagued with irregularity.”
“Foxx’s conflict in this matter is beyond dispute,” O’Brien argued, adding that Foxx should have sought appointment of a special prosecutor. “Instead, Foxx misled the public into believing that Smollett’s case was handled like any other prosecution and without influence.”
However, Foxx didn’t disclose that she had been in communication with a “family friend” of the Smolletts, former Michelle Obama chief of staff Tina Tchen.
In her subpoena, the former judge asked that Foxx and Magats produce all the original documents in the case to prove “that they have not been altered or destroyed and will not be destroyed throughout this case.”
Smollett, who is black and openly gay, told Chicago police that he was attacked in late January in Streeterville, the city neighborhood where he lived, as two white men yelled racist and homophobic slurs at him, then poured bleach on him and tied a noose around his neck.
But after weeks where media figures spoke out about the racist culture inspired by Trump that had led to the attacks, the narrative started to unravel. After several inconsistencies – including the fact that video cameras showed two Nigerian brothers purportedly ‘attacking’ Smollett (Smollett had said his attackers were white), and the discovery of a check written by Smollett to the two brothers – surfaced, police eventually charged filed a smattering of charges against Smollett. Police said he staged the attack and filed a false report. Then, at a surprise hearing March 26, all charges were dropped. Foxx had recused herself from the case after allegations of improper influence surfaced, but the allegations that she improperly influenced the case have persisted.
end
SWAMP STORIES/MAJOR STORIES//THE KING REPORT
and special thanks to Chris Powell of GATA for sending this down for us:
Pancreatic cancer has NEVER been described as a “sudden short” illness. If anything, it’s THE EXACT opposite, 1 of the most long drawn out problems.
Out of respect for the man who has died & his family, won’t say anything more than this, except that after the explosive interview he gave only few weeks ago, this has been an incredibly distressing news to hear.


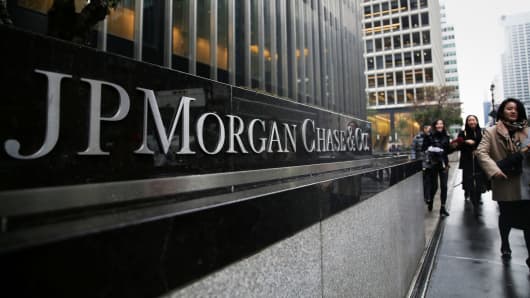


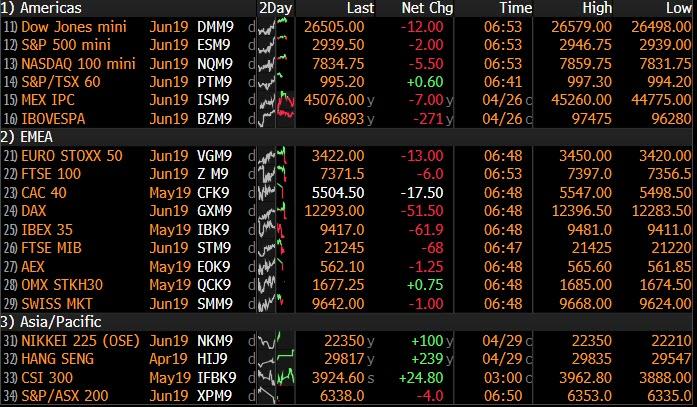
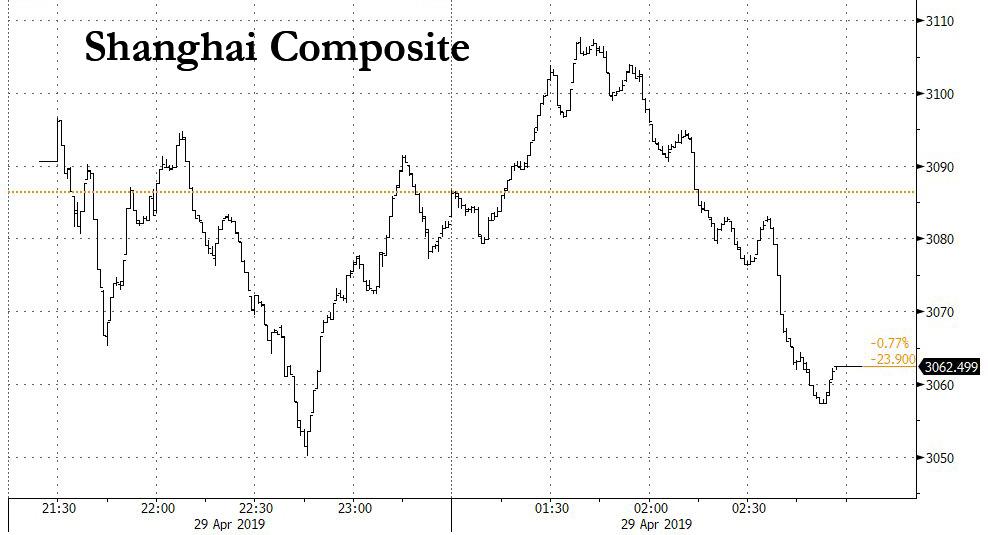


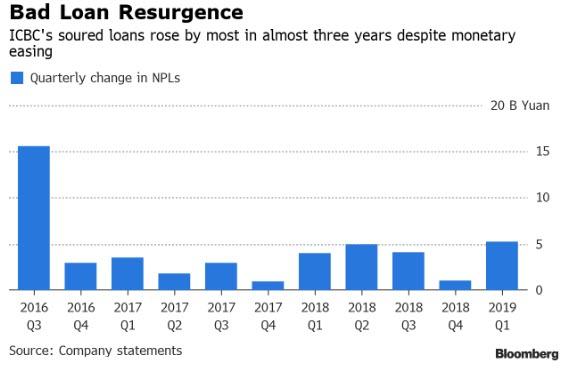


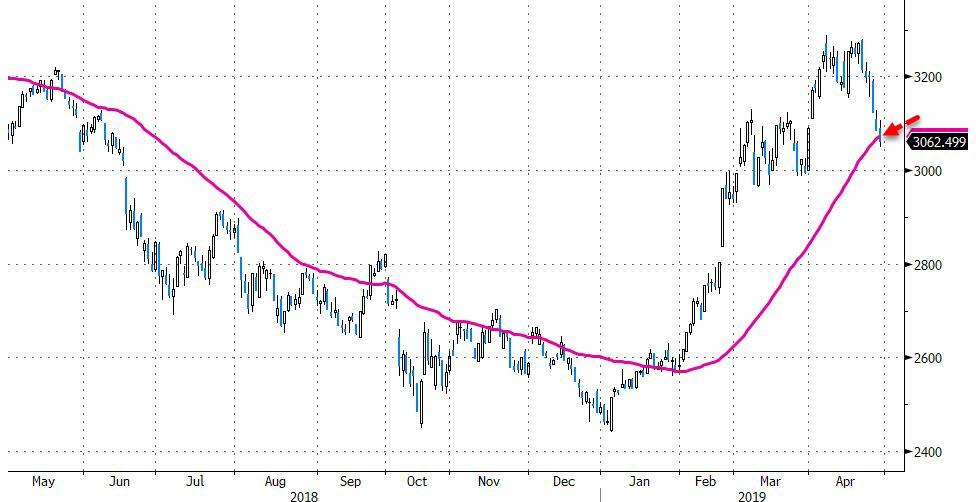
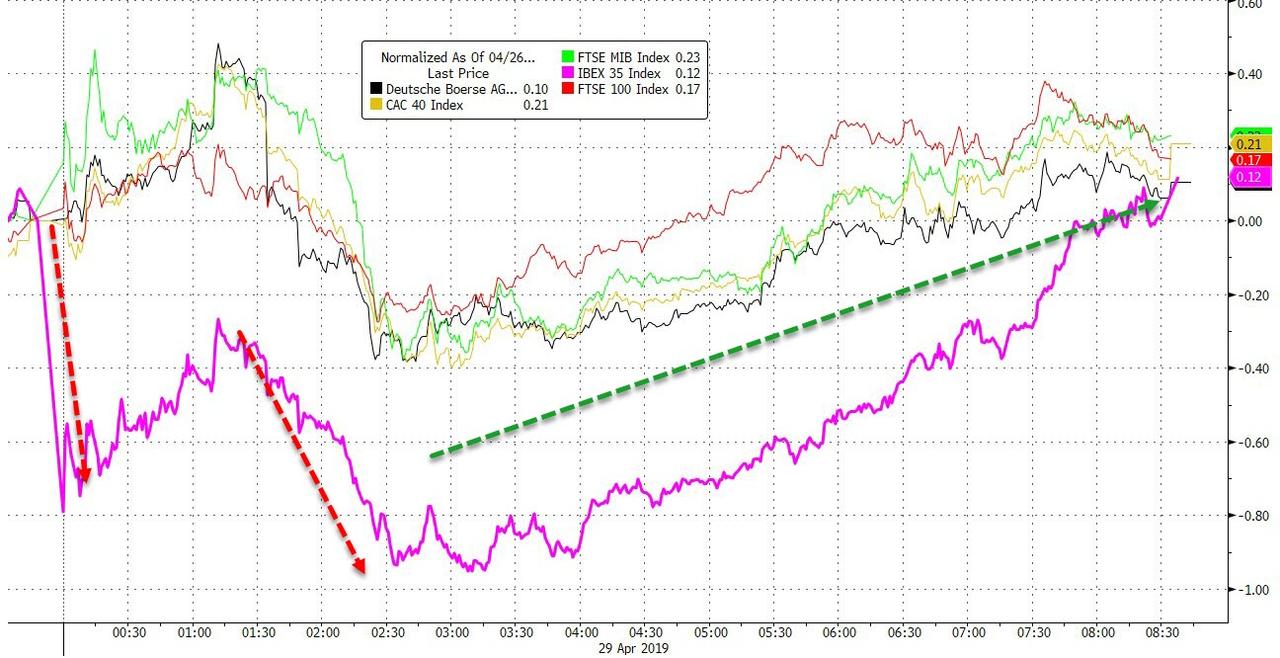
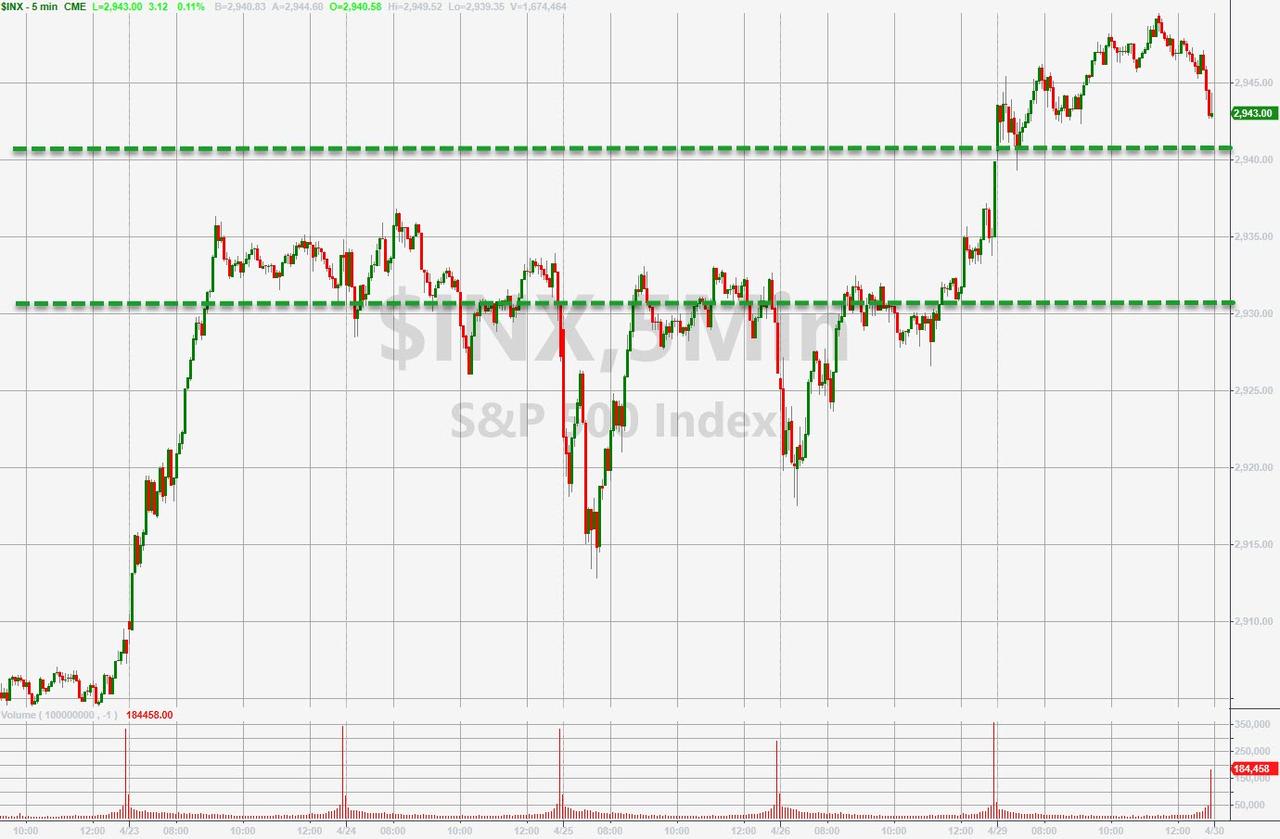
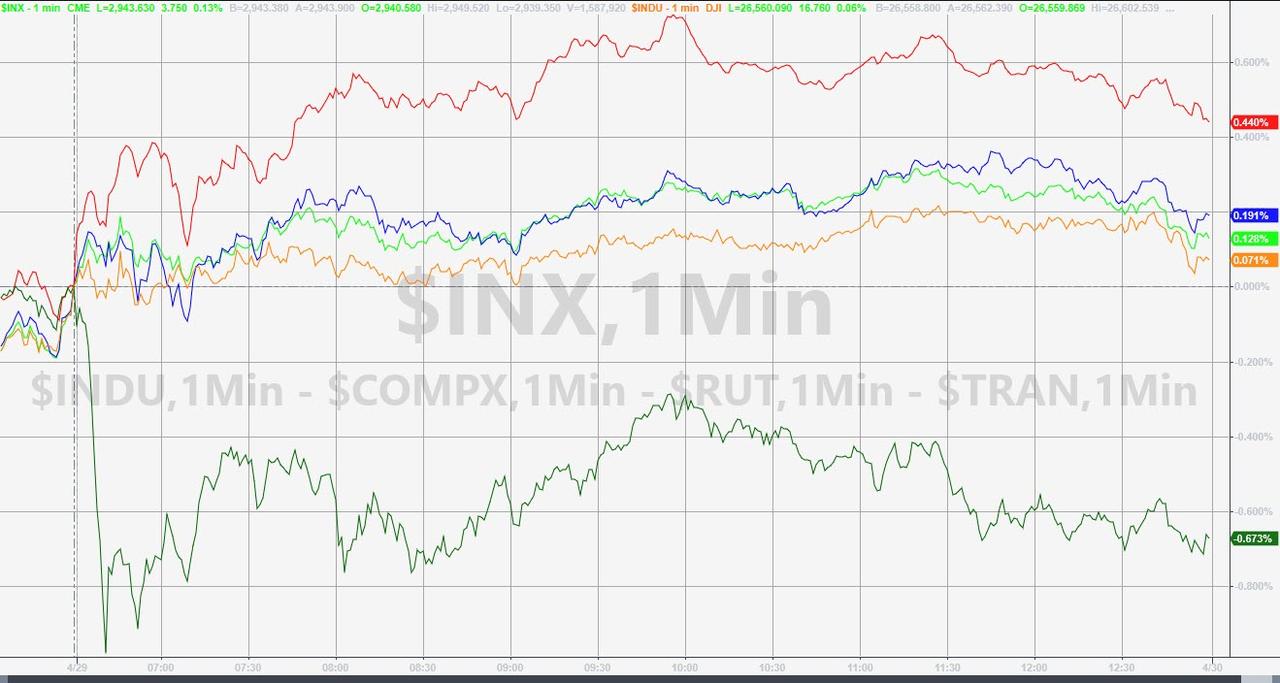
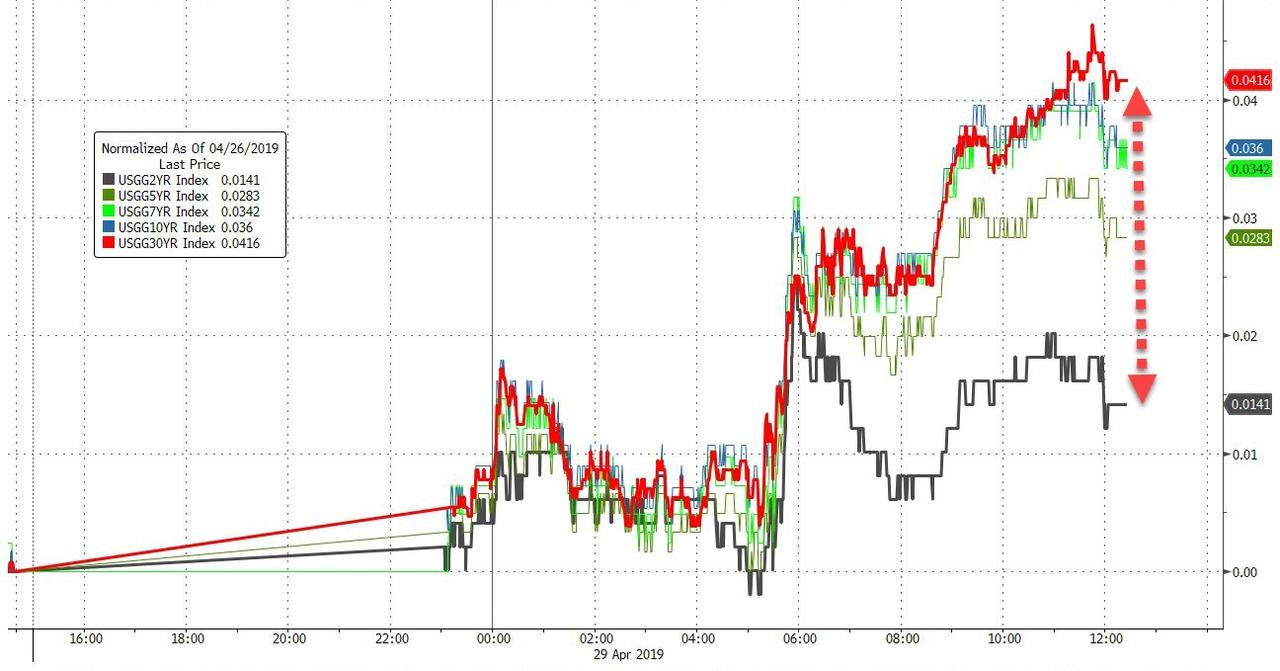
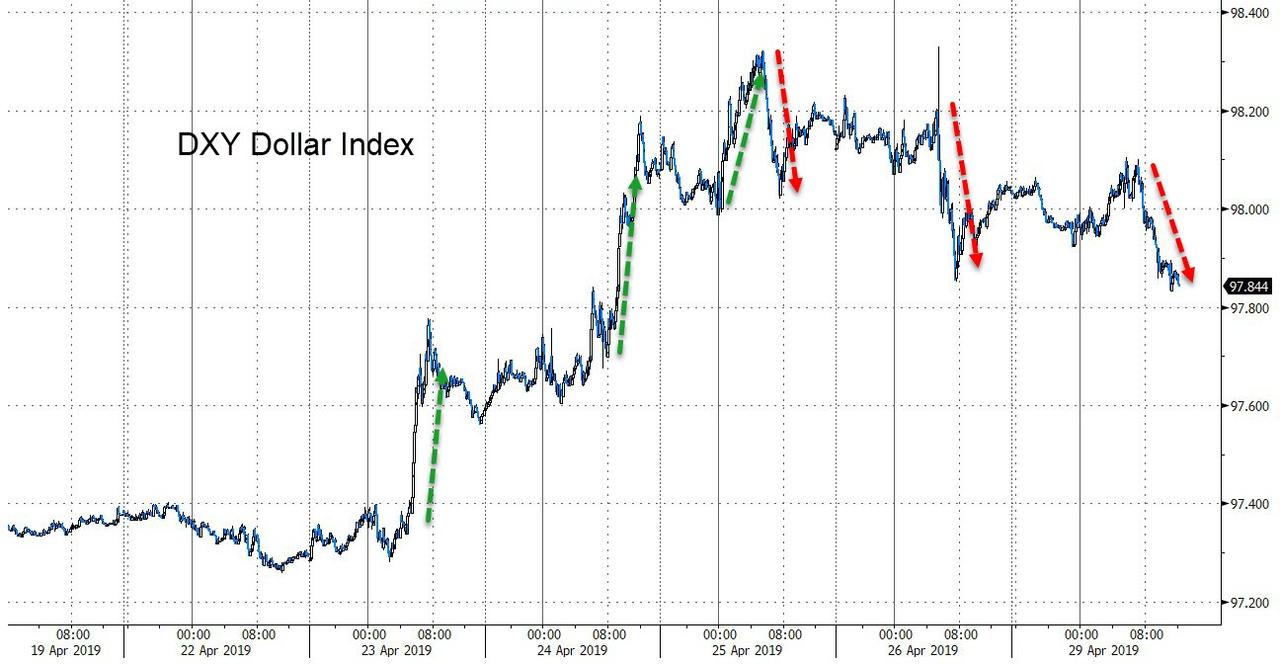

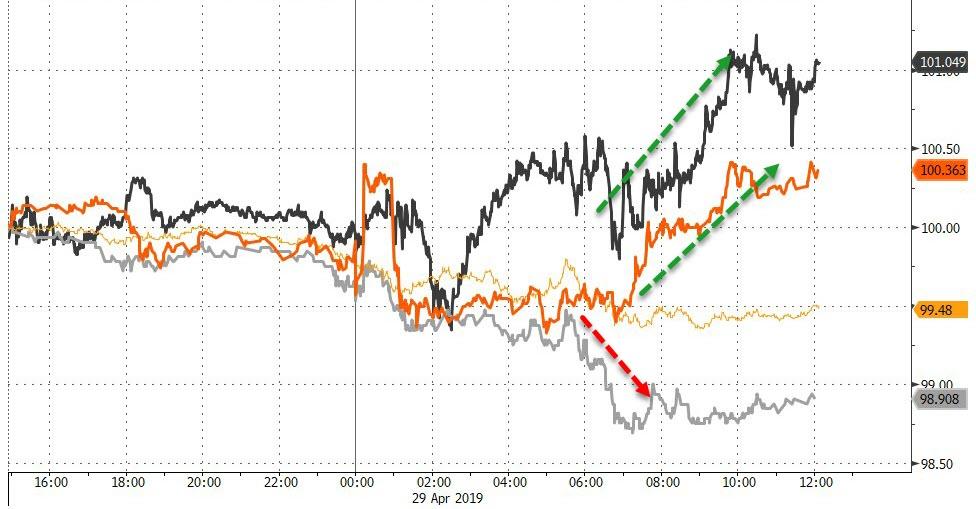
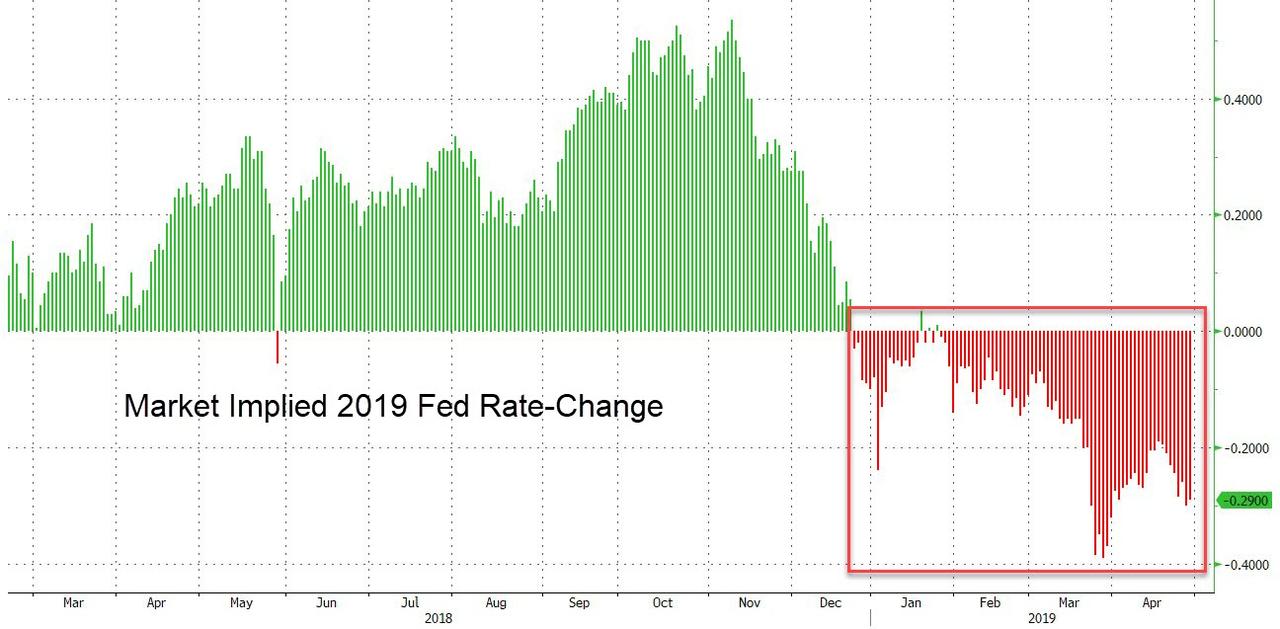
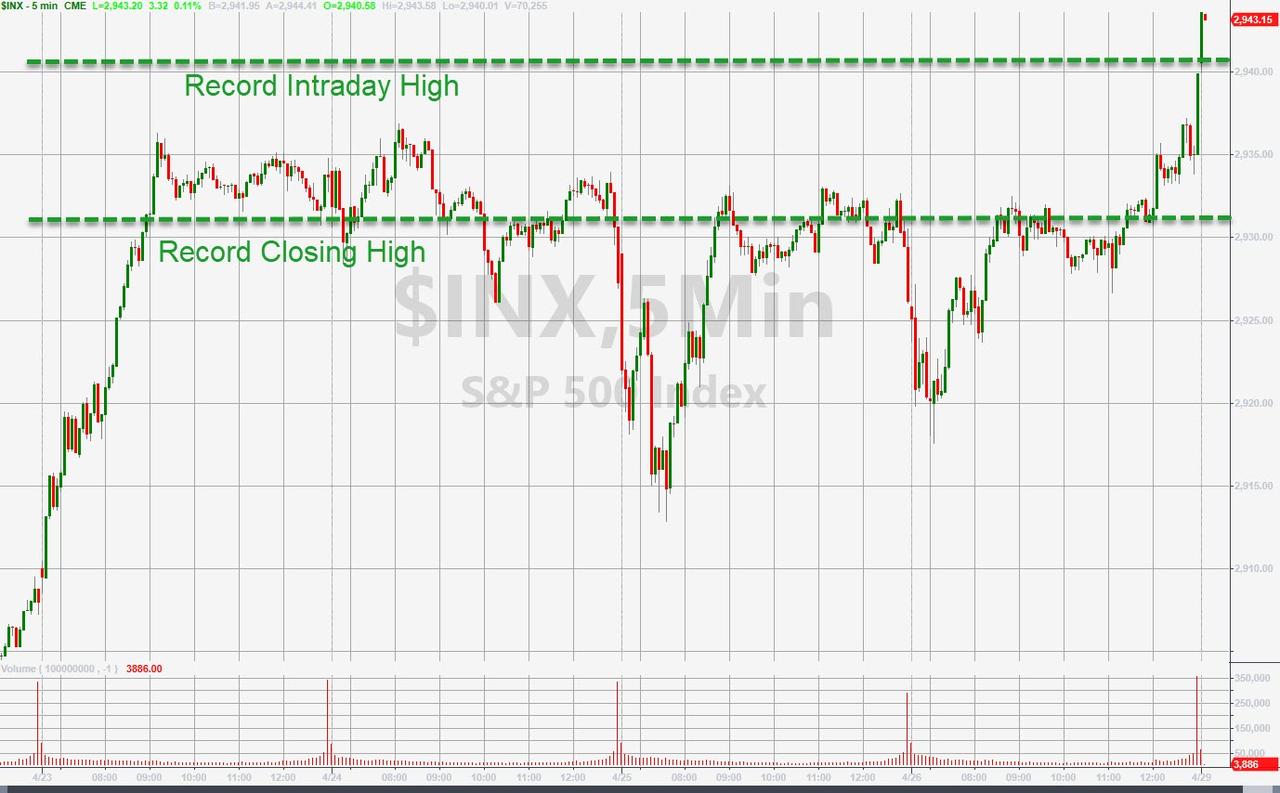
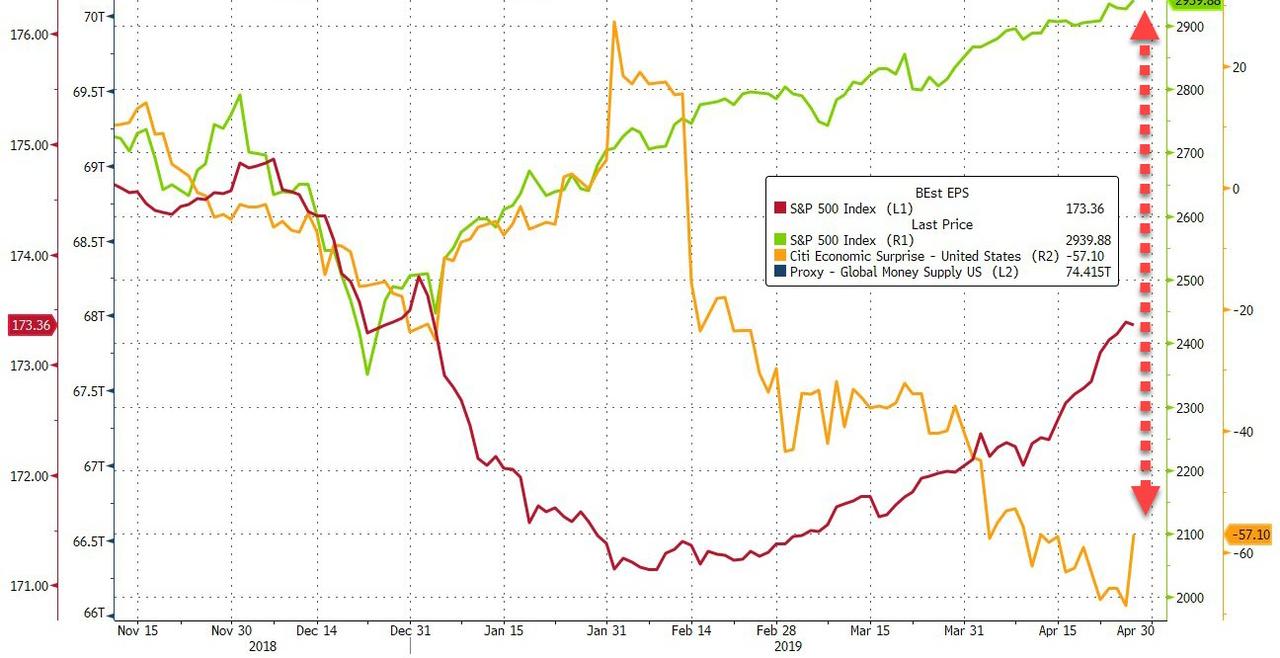
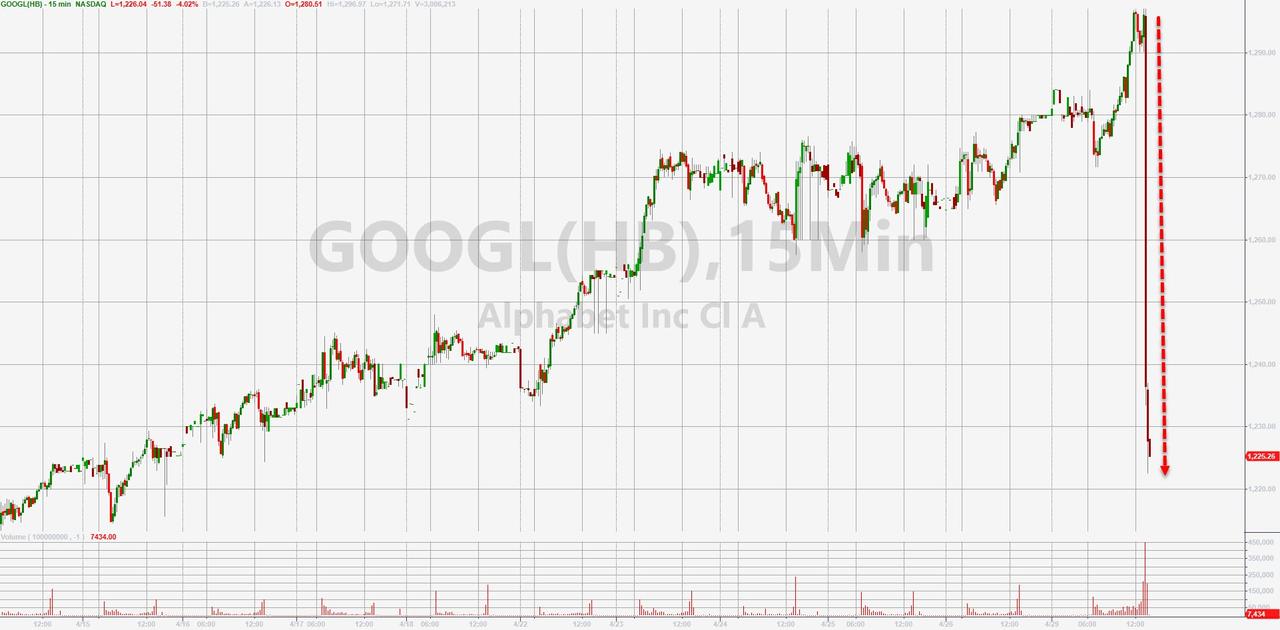


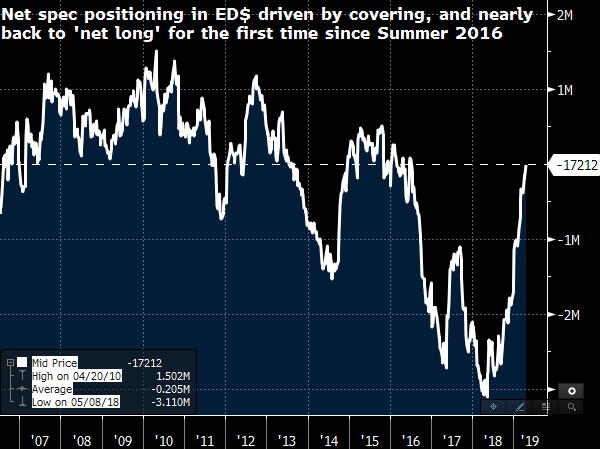
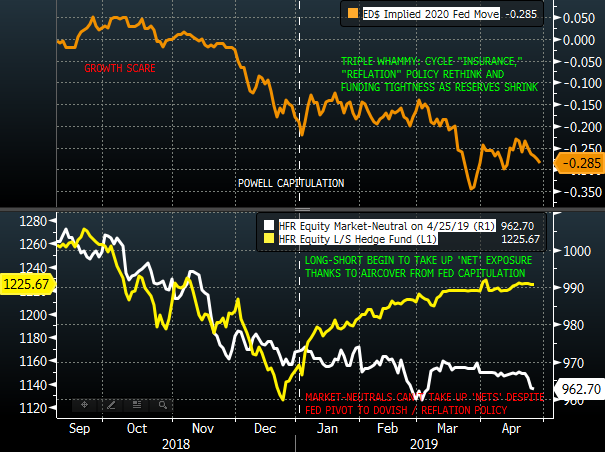

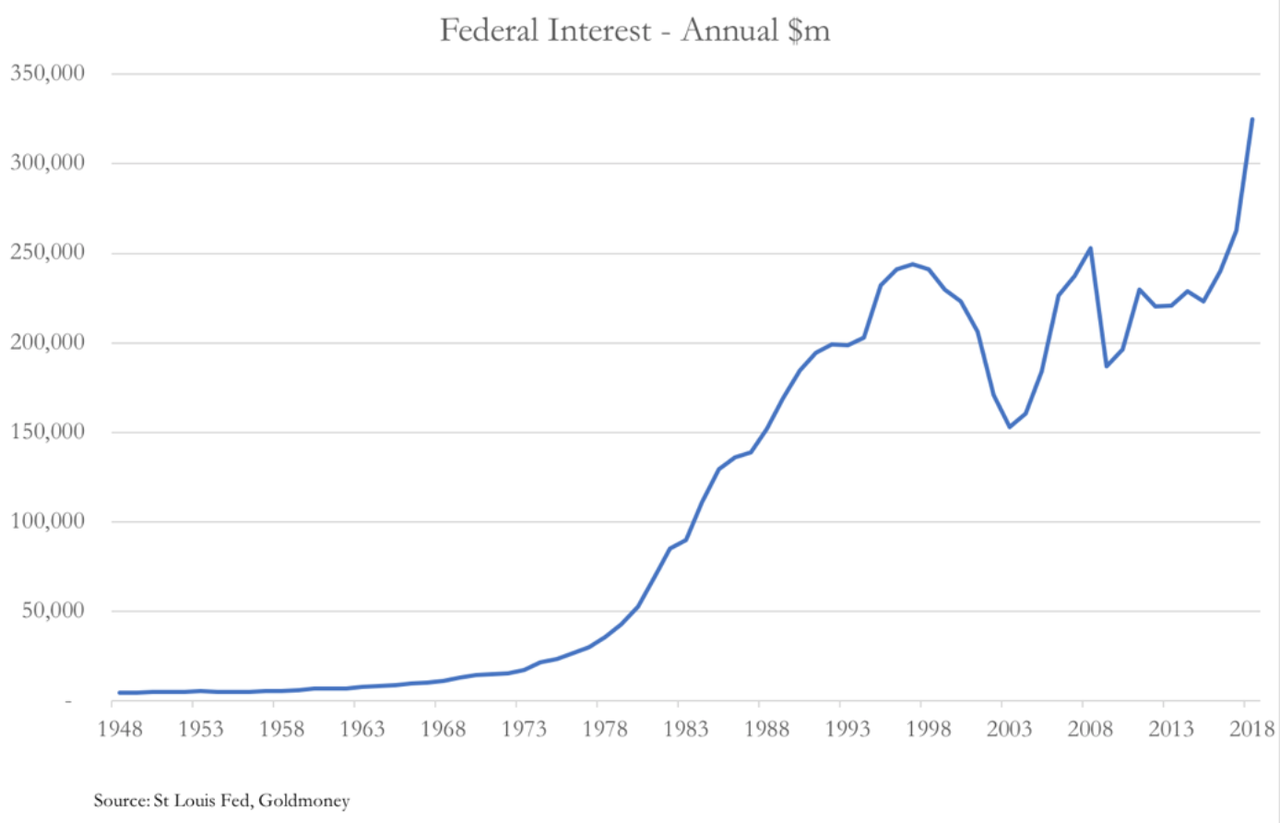
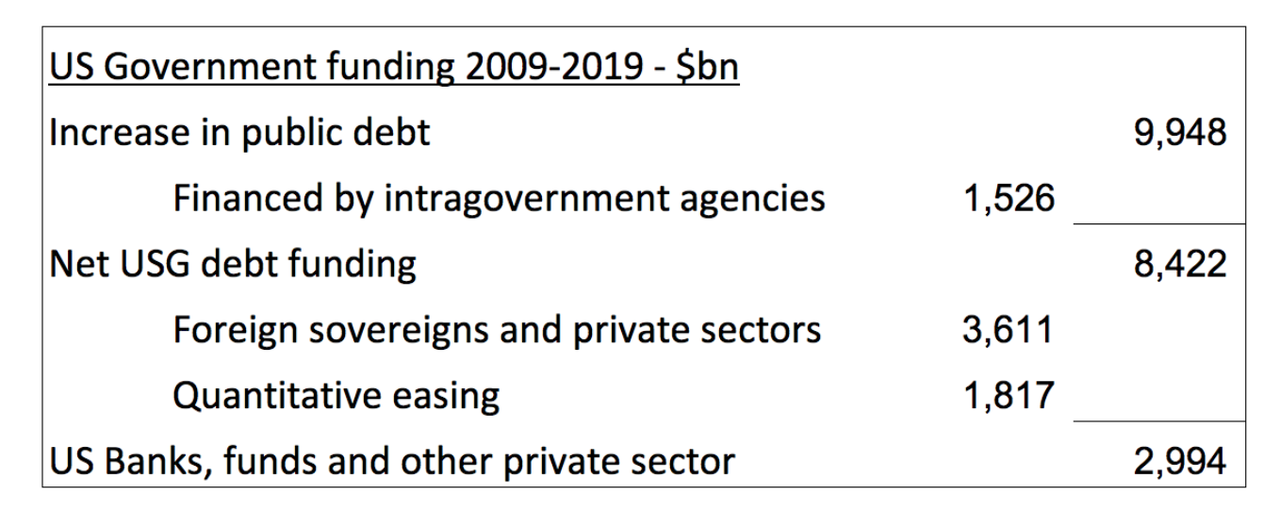
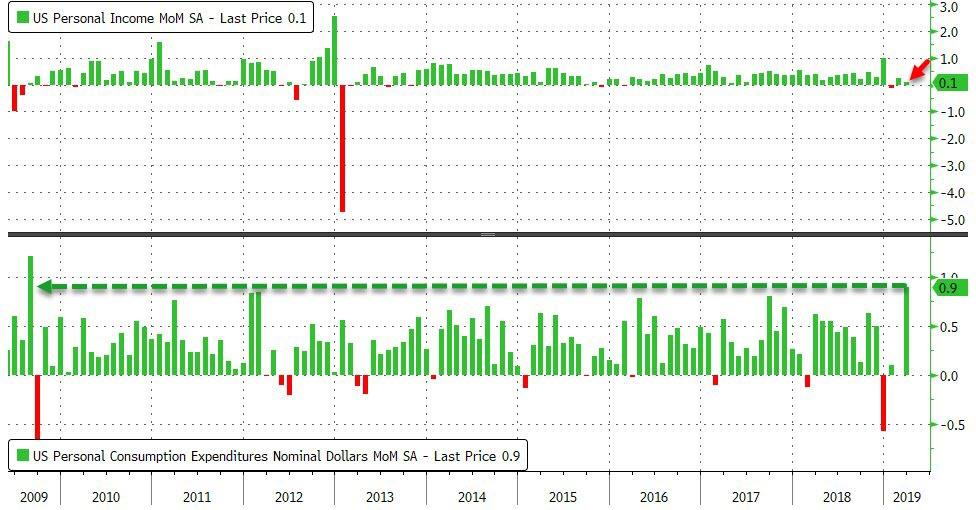
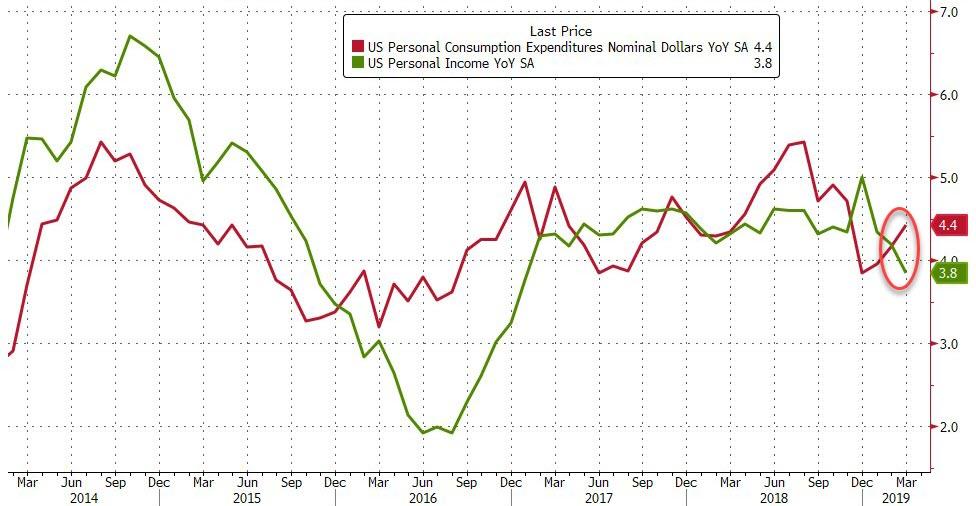

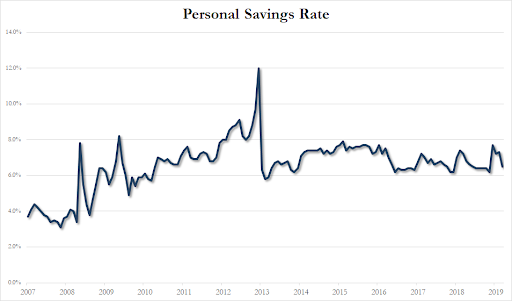
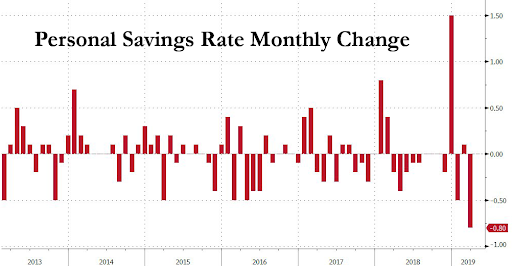
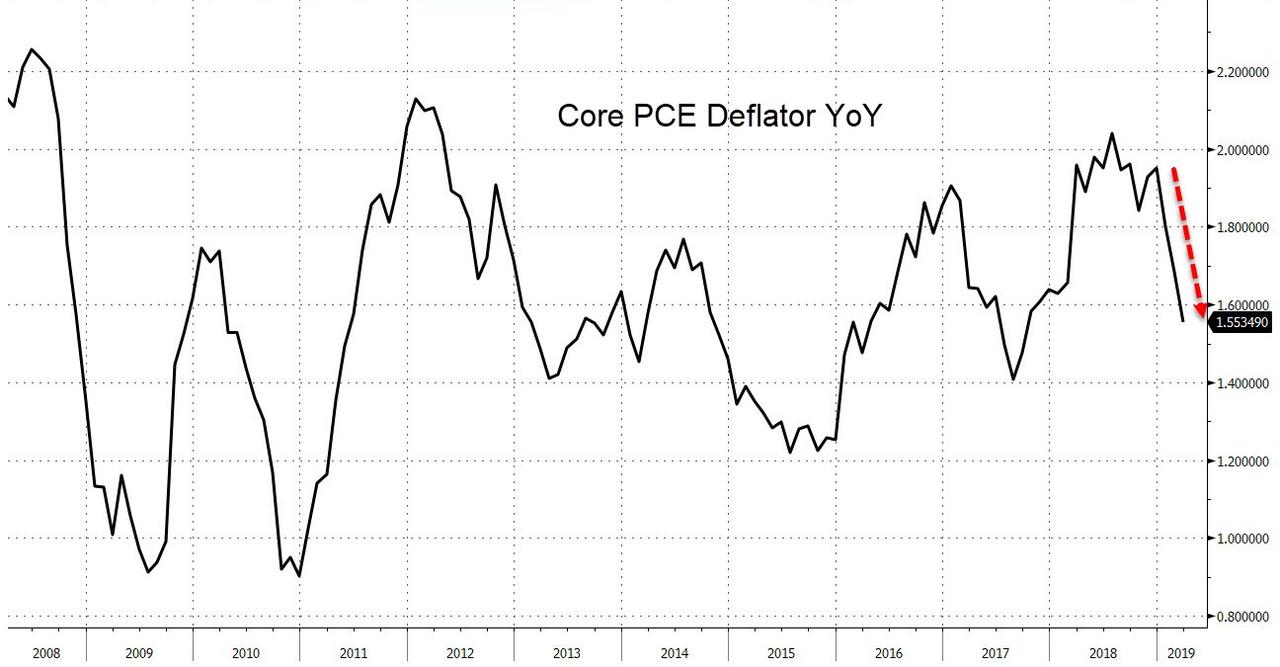


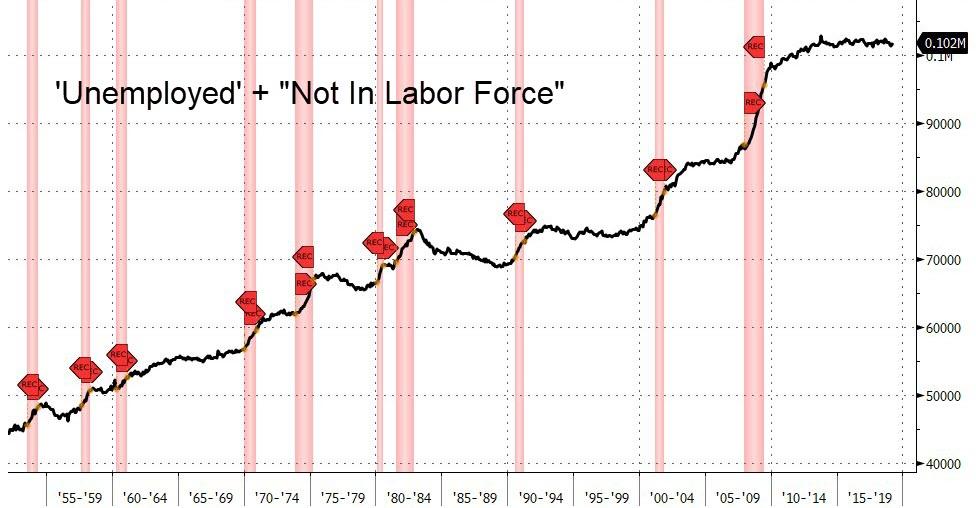
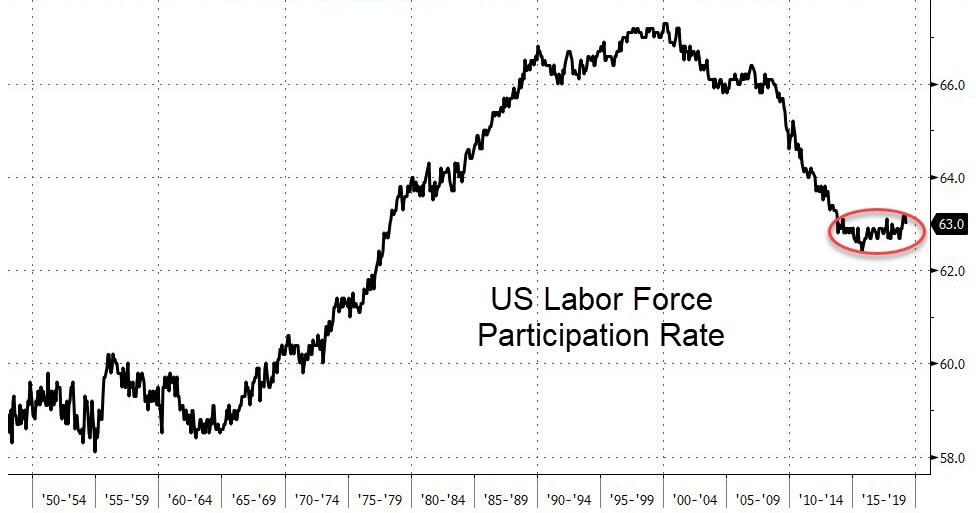

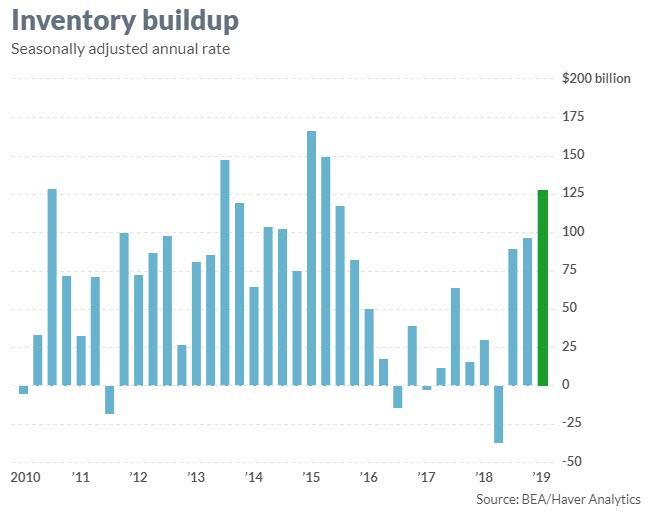
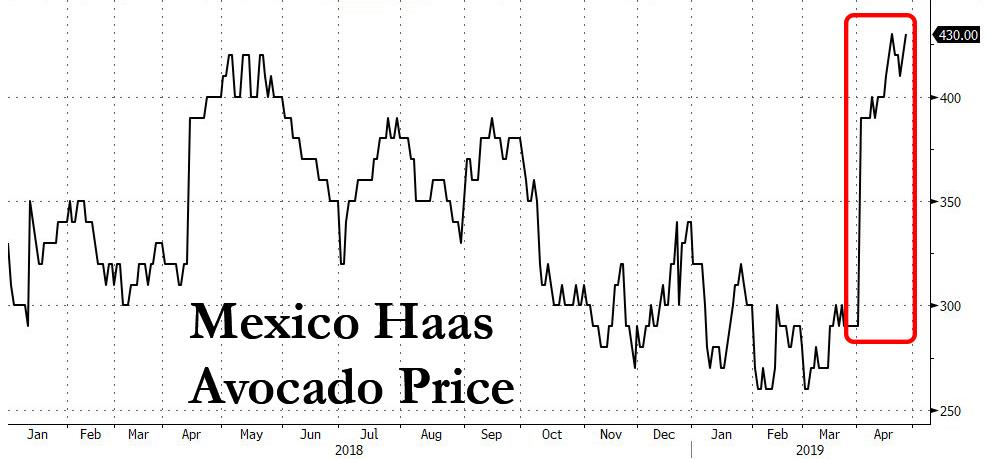

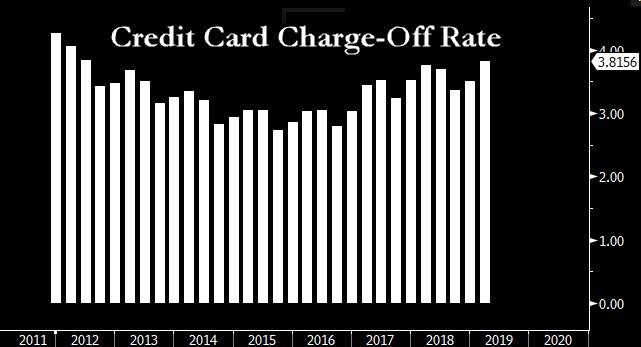
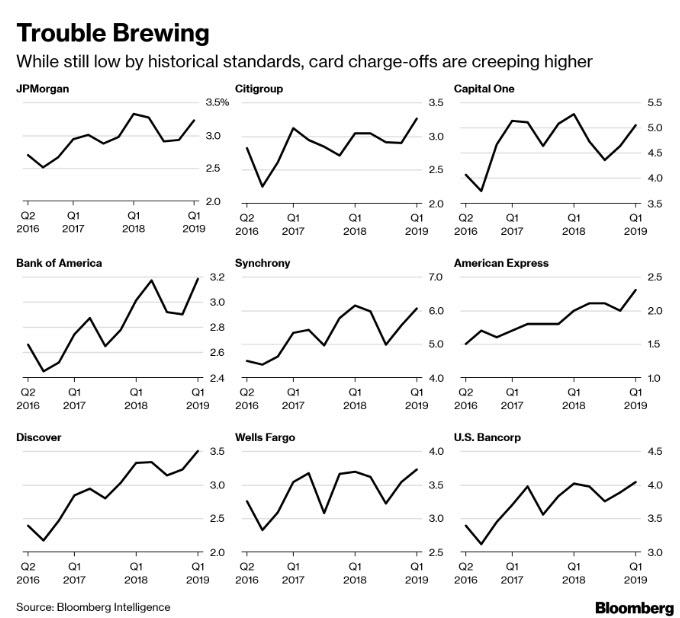
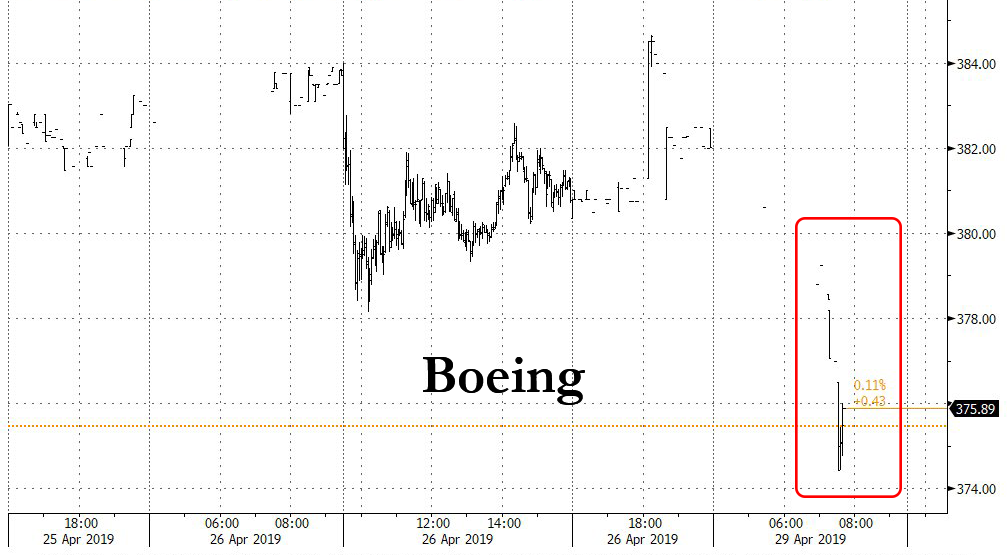


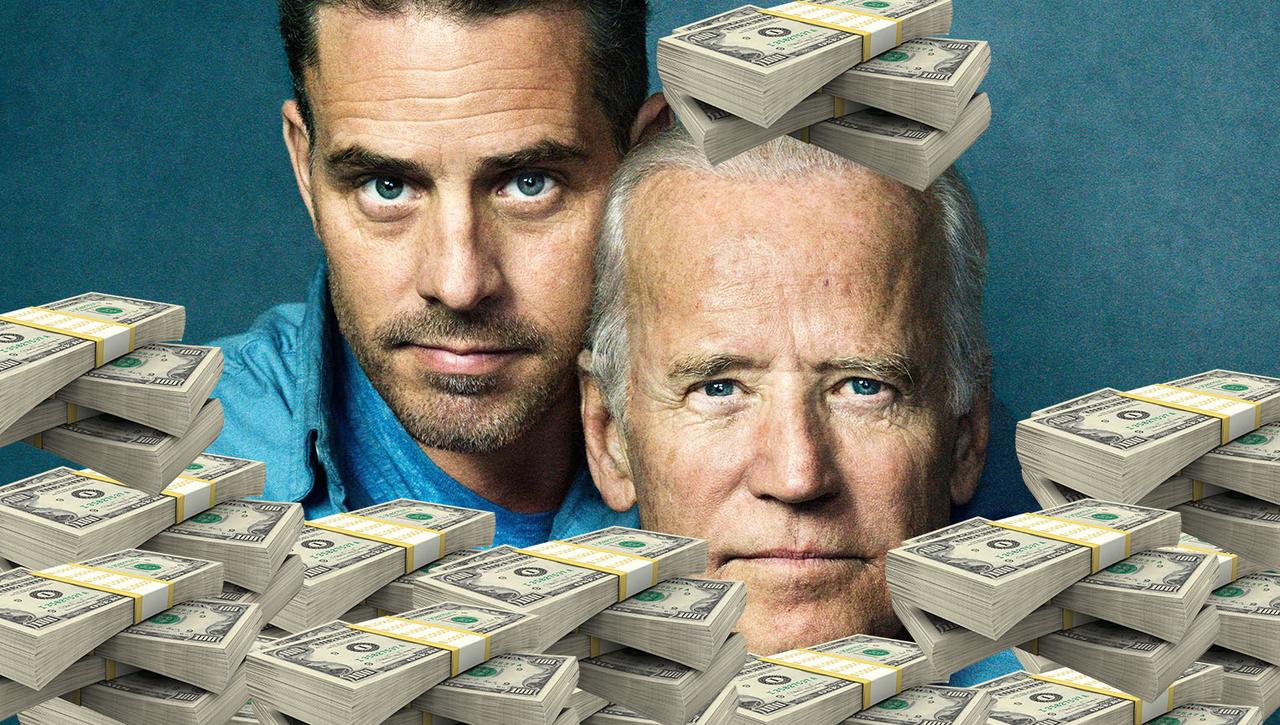


Regarding Bart Chilton:
Pancreatic cancer has NEVER been described as a “sudden short” illness. If anything, it’s THE EXACT opposite, 1 of the most long drawn out problems.
Out of respect for the man who has died & his family, won’t say anything more than this, except that after the explosive interview he gave only few weeks ago, this has been an incredibly distressing news to hear.
RIP.
LikeLike