
COMEX DATA/PRELIMINARY NUMBERS FOR MONDAY:
EXCHANGE: COMEX
CONTRACT: SEPTEMBER 2026 COMEX 100 GOLD FUTURES
SETTLEMENT: 4,385.900000000 USD
INTENT DATE: 09/18/2026 DELIVERY DATE: 09/22/2026
FIRM ORG FIRM NAME ISSUED STOPPED
099 H DEUTSCHE BANK AG 103
118 C MACQUARIE FUTURES US 105
118 H MACQUARIE FUTURES US 143
190 H BMO CAPITAL MARKETS 160
661 C JP MORGAN SECURITIES 76
709 C BARCLAYS 16
905 C ADM 3
TOTAL: 303 303
MONTH TOTAL 3,527
GOLD: NUMBER OF NOTICES FILED FOR SEPT./2026: 303 CONTRACTs NOTICES FOR 30,300 OZ or 0.9424 TONNES
total notices so far: 3527 contracts FOR 352,700 OZ OR 10.970 TONNES
SILVER NOTICES:53 NOTICE(S) FILED FOR 265,000 OZ /
total number of notices filed so far this month : 6168 CONTRACTS (NOTICES) for 30.840 million oz
GLD
SEPT: INITIAL STANDING: 24.172 MILLION OZ//FOLLOWED BY TODAY’S STRONG 18 CONTRACT OR 88,000 OZ QUEUE JUMP//STANDING ADVANCES TO 32.210 MILLION OZ//
SEPT: INITIAL STANDING 8.756 MILLION OZ//FOLLOWED BY TODAY’S 0.088 MILLION OZ QUEUE JUMP//STANDING ADVANCES TO 32.210 MILLION OZ
GOLD COMEX OUTLINE;
1.MAY SUMMARY FOR MAY TONNES WHICH STOOD FOR DELIVERY:
4. AUGUST: 60.547 TONNES OF INITIAL GOLD FIRST DAY NOTICE FOLLOWED BY THE NET MONTH’S QUEUE JUMP OF 47.2312 TONNES TO WHICH WE ADD THE FOLLOWING EXCHANGE FOR RISK ISSUANCE RECEIVED FOR THE MONTH: 5.4432 TONNES EX FOR RISK/AUG 7 , AUG 11: 2.413 TONNES EX FOR RISK AND AUG. 12 OF 2.
5.SEPT: INITIAL 8.093 TONNES OF GOLD PLUS TODAY’S QUEUE JUMP OF 0.4883 TONNES PLUS 2.2827 TONNES OF EXCHANGE FOR RISK TODAY//NEW TOTAL EX. FOR RISK/MONTH = 22.923//NEW TOTAL STANDING FOR GOLD SEPT ADVANCES TO = 48.801 TONNES!!
6.OCTOBER: 90.012 TONNES OF INITIAL GOLD STANDING WITH TODAY’S TINY 0.00311 TONNES QUEUE JUMP WHICH FOLLOWS ALL OTHER QUEUE JUMPS DURING OCT OF 76.1656 TONNES
THEN WE MUST ADD OUR 14.553 TONNES OF OUR ISSUANCE OF EXCHANGE FOR RISK/6 OCCASIONS//NEW TOTAL OF GOLD STANDING ADVANCES TO 197.5141 TONNES OF GOLD.
7.NOVEMBER BEGINS WITH 15.651 TONNES INITIALLY STANDING FOR DELIVERY FOLLOWED BY TODAY’S QUEUE JUMP OF 2.323 TONNES FOLLOWED BY ALL PREVIOUS QUEUE JUMPS IN OF OF 21.3775 TONNES TO WHICH WE ADD OUR TWO EXCHANGE FOR RISK ISSUANCE OF 4.5596 TONNES//NEW STANDING ADVANCES TO 43.9716 TONNES OF GOLD.
8. DECEMBER BEGINS WITH INITIAL STANDING OF 83.813 TONNES OF GOLD FOLLOWED BY TODAY’S 0.0TONNE QUEUE JUMP WHICH FOLLOWS ALL OTHER QUEUE JUMPS OF: 37.163 TONNES//NEW STANDING ADVANCES TO 115.390 TONNES TO WHICH WE ADD OUR 4 EXCHANGE FOR RISK FOR DECEMBER OF 6.587 TONNES/NEW STANDING ADVANCES TO 121.977 TONNES
9. JANUARY: INITITAL STANDING: 13.785 TONNES TO WHICH WE ADD OUR FIRST EXCHANGE FOR PHYSICAL TRANSFER OF 0.08709 TONNES WHICH FOLLOWS ALL OTHER QUEUE JUMPS OF 30.7117TONNES //NEW TOTAL QUEUE JUMPS 30.7117//NORMAL DELIVERY OF GOLD ADVANCES TO 36.8958 TONNES TO WHICH WE ADD OUR SIX EXCHANGE FOR RISK OF 22.315 TONNES//NEW STANDING ADVANCES TO 59.2108 TONNES.
FEB; INITIAL AMOUNT OF GOLD STANDING FOR DELIVERY: 93.567 TONNES OF GOLD TO WHICH WE ADD OUR NEXT 0.0248 TONNES 0.1555 TONNES QUEUE JUMP TO 41.2082 TONNES/ NEW NET QUEUE JUMP INCREASES TO 41.233 TONNES// AND THEN WE ADD OUR SIX EXCHANGE FOR RISK: 10,080 CONTRACTS OR 31.251 TONNES//NEW STANDING REDUCES TO 157.878 TONNES
MARCH:: INITIAL AMOUNT OF GOLD STANDING FOR DELIVERY: 8.099 TONNES TO WHICH WE ADD TODAY’S FAIR 4600 OZ QUEUE JUMP (0.2320 TONNES) AND THEN WE ADD OUR THREE EXCHANGE FOR RISK OF 22.3818 TONNES //NEW STANDING ADVANCES TO 67.6648 TONNES/
APRIL: INITIAL AMOUNT OF GOLD STANDING FOR DELIVERY: 52.600 TONNES FOLLOWED BY OUR 345 CONTRACT QUEUE JUMP FOR 34,500 OZ/ (1.073 TONNES)/NEW STANDING ADVANCES TO 70.286 TONNES TO WHICH WE ADD OUR 2ND EXCHANGE FOR RISK OF 1498 CONTRACTS FOR 149800 OZ OR 4.659 TONNES. THE NEW TOTAL EXCHANGE FOR RISK FOR THE MONTH OF APRIL IS 2239 CONTRACTS OR 223900 OZ OR 6.964 TONNES AND THIS WILL BE ADDED TO OUR NORMAL DELIVERY TOTALS (70.762 TONNES) TO GIVE US WHAT WILL STAND IN APRIL (77.726 TONNES)
MAY: INITIAL AMOUNT OF GOLD WILLING TO STAND: 12.24 TONNES OF GOLD TO WHICH WE ADD OUR NEXT QUEUE JUMP OF 345 CONTRACTS OR 34500 OZ (1.073 TONNES) TO WHICH WE ADD OUR FIVE EXCHANGE FOR RISK ISSUANCES FOR 24.635 TONNES/STANDING NOW ADVANCES TO 51.554 TONNES OF GOLD.
JUNE; INITIAL AMOUNT OF GOLD WILLING TO STAND; 64.496 TONNES.(CME CORRECTED) TO WHICH WE ADD OUR NEXT EXCHANGE FOR PHYSICAL TRANSFER OF 0.0186 TONNES/NEW STANDING REDUCES TO 127.03 TONNES
JULY: INITIAL AMOUNT OF GOLD WILLING TO STAND: 23.306 TONNES TO WHICH WE ADD OUR NEXT QUEUE JUMP OF 0.000 TONNES/ TO WHICH WE ADD OUR FIRST EXCHANGE FOR RISK 0F 0.0062 TONNES/NEW STANDING ADVANCES TO 40.824TONNES
AUGUST INITIAL STANDING 48.687 TONNES TO WHICH WE ADD OUR 5TH EXCHANGE FOR RISK OF 5 CONTRACTS FOR 500 OZ OR 0.0155 TONNESS TO OUR 4TH EXCHANGE FOR RISK OF 200 CONTRACTS OR 20,000 OZ OR 6.220 TONNES TO OUR 3RD EXCHANGE FOR RISK OF 1.7045 TONNES TO OUR 2ND EXCHANGE FOR RISK OF 1.552 TONNES TO OUR FIRST 0.0715 TONNES EXCHANGE FOR RISK//NEW TOTAL EXCHANGE FOR RISK: 3.9688 AND THEN ADD OUR NEXT QUEUE JUMP OF 39 CONTRACTS FOR 3,900 OZ OR 0.1213 TONNES//STANDING THUS ADVANCES TO 67.2441 TONNES
SEPT: INITIAL STANDING: 8.756 TONNES OF GOLD FOLLOWED BY TODAY’S 117 CONTRACTS OR 11,700 OZ QUEUE JUMP (.3639 TONNES) TO WHICH WE ADD OUR TWO, 2000 CONTRACT EXCHANGE FOR RISK FOR 200,000 OZ OR 6.2208 TONNES//// // NEW STANDING ADVANCES TO 17.8133 TONNES..
IN ESSENCE WE HAVE A FAIR GAIN IN TOTAL CONTRACTS IN GOLD ON THE TWO EXCHANGES OF 3539 CONTRACTS WITH 2124 CONTRACTS INCREASED AT THE COMEX// AND A FAIR SIZED 1415 EXCHANGE FOR PHYSICAL OI CONTRACT ISSUANCE WHICH NAVIGATED OVER TO LONDON.
THUS TOTAL OI GAIN ON THE TWO EXCHANGES OF 3539 CONTRACTS.. WE HAD THE FOLLOWING TAS CONTRACTS INITIATED (ISSUED): A SMALL SIZED AND CRIMINAL 964 CONTRACTS AND THESE ISSUANCES ARE GENERALLY USED TO INITIATE A RAID WHEN CALLED UPON .
GOLD PRICE ROSE BY $26.45
STANDING FOR THE LAST 8 MONTHS JANUARY TO AUGUST:
FINAL STANDING FOR GOLD, JANUARY CONTRACT AT 59.08 TONNES OF GOLD
FEBRUARY: INITIAL STANDING FOR GOLD: 157.878 TONNES!! WHICH INCLUDES ALL QUEUE JUMPING, THREE EXCHANGE FOR PHYSICAL TRANSFERS TO LONDON AND OUR SIX ISSUANCES EXCHANGE FOR RISK!!
MARCH: INITIAL STANDING AT 8.099 TONNES TO WHICH WE ADD OUR FINAL DAY: 0.2320 TONNES QUEUE JUMP AND THEN ADD +22.3818 TONNES EXCHANGE FOR RISK//NEW STANDING ADVANCES TO 67.6648 TONNES
APRIL: INITIAL STANDING 52.600 TONNES PLUS 27,800 OZ QUEUE JUMP (0.8648TONNES): NEW STANDING ADVANCES TO 70.286 TONNES PLUS OUR TWO EXCHANGE FOR RISK FOR 223,900 OZ OR 6.964 TONNES/NEW FINAL STANDING: 77.726 TONNES
MAY: INITIAL AMOUNT OF GOLD WILLING TO STAND; 12.24 TONNES TO WHICH WE ADD OUR NEXT QUEUE JUMP FOR 345 CONTRACTS/34,500 OZ// 1.073 TONNES/ THEN WE MUST ADD OUR EXCHANGE FOR RISK ISSUANCE: TOTAL EXCHANGE FOR RISK MAY// 5 OCCASIONS: 24.635 TONNES///NEW FINAL STANDING NOW ADVANCES TO 51.554 TONNES
JUNE: INITIAL AMOUNT OF GOLD WILLING TO STAND: 64.496 TONNES TO WHICH WE ADD OUR NEXT EXCHANGE FOR PHYSICAL TRANSFER JUMP OF 0.0186 TONNES//NEW STANDING 127.03 TONNES//FINAL
JULY: INITIAL AMOUNT OF GOLD WILLING TO STAND: 23.306 TONNES OF GOLD TO WHICH WE ADD OUR NEXT QUEUE JUMP OF 0.0000 TONNES/ PLUS 0.0062 TONNES EX FOR RISK///NEW STANDING FOR GOLD REMAINS AT 40.824TONNES.
AUGUST INITIAL STANDING 48.687 TONNES TO WHICH WE ADD OUR FIRST 0.0715 TONNES EXCHANGE TO OUR 2ND EXCHANGE FOR RISK = 1.552 TONNES TO OUR 3RD EXCHANGE FOR RISK OF: 1.7045//TOTAL FOR EXCHANGE FOR RISK 3.3312 TONNES TO OUR 4TH EXCHANGE FOR RISK OF 200 CONTRACTS FOR 0.6220 TONNES/TO OUR 5TH EXCHANGE FOR RISK OF 0.0155 TONNES//TOTALL EXCHANGE FOR RISK: 3.9688 TONNES TO OUR NEXT QUEUE JUMP OF 0.1213 TONNES//STANDING ADVANCES TO 67.2441 TONNES
SEPT: INITIAL STANDING FOR GOLD: 8.756 TONNES FOLLOWED BY TODAY’S 11,700 OZ QUEUE JUMP (.3639TONNES) TO WHICH WE ADD OUR SECOND 1000 CONTRACT EXCHANGE FOR RISK TO OUR FIRST: THUS// NEW EXCHANGE FOR RISK: 6.2208 TONNES// NEW STANDING ADVANCES TO 17.8033 TONNES.
JAN. 2025: 257.919 TONNES (ISSUANCE WILL BE PRETTY GOOD THIS MONTH BUT MUCH LOWER THAN LAST MONTH)
FEB: 207.21 TONNES//EX FOR PHYSICAL ISSUANCE (WILL BE A FAIR SIZED ISSUANCE THIS MONTH)
MARCH 130.84 TONNES//QUITE SMALL THIS MONTH.
APRIL; 208.57 TONNES. STRONG THIS MONTH
MAY: 113.499 TONNES OF GOLD EFP ISSUANCE//QUITE SMALL THIS MONTH
JUNE: 97.79 TONNES OF GOLD EFP ISSUANCE/EXTREMELY SMALL
JULY : 150.877 TONNES// QUITE SMALL
AUGUST: 175.86 TONNES A LOT LARGER THIS MONTH.
SEPT. 116.13 TONNES VERY SMALL
OCT. 252.72 TONNES//CERTAINLY MUCH LARGER THIS MONTH/VERY STRONG
NOV: 124.74 TONNES
DEC: 190.04 TONNES//GOOD SIZED THIS MONTH FINAL.
TOTAL EXCHANGE FOR PHYSICAL ISSUED FOR YEAR 2025: 2,026.20 TONNES (LOWER THAN LAST YR 2,569.00 TONNES
YEAR 2026:
JANUARY: 209.08 TONNES ( (WILL BE A STRONG MONTH FOR EXCHANGE FOR PHYSICAL)
FEB. 176.35 TONNES (WHICH IS A FAIR ISSUANCE)
MARCH: 214.67 TONNES//WILL BE STRONG ISSUANCE THIS MONTH
APRIL; 88.00 TONNES// WILL BE VERY SMALL THIS MONTH
MAY 118.430 TONNES
JUNE: 142.053 TONNES
JULY: 163.82 TONNES
AUGUST: 151.107 TONNES
SEPT: 64.73 TONNES
XXXXXXXXXXXXXXXXXXXXXXXXXX
SHANGHAI CLOSED UP 36.27 PTS OR 0.94%
HANG SENG CLOSED UP 146.40 PTS OR 0.60%
Nikkei CLOSED UP 977.75 PTS OR 1.52%
//Australia’s all ordinaries CLOSED DOWN 0.96%
//Chinese yuan (ONSHORE) CLOSED UP TO 6.6979
/ OFFSHORE CLOSED UP AT 6.6966 Oil DOWN TO 100.89 dollars per barrel for WTI and BRENT DOWN TO 104.33 Stocks in Europe OPENED ALL GREEN
ONSHORE USA/ YUAN// WITH YUAN TRADING UP (6.6979 OFFSHORE YUAN TRADING UP TO 6.6966 ONSHORE YUAN TRADING BELOW LEVEL // OFF SHORE AND UP ON THE DOLLAR)// / AND THUS STRONGER/OFF SHORE YUAN TRADING UP AGAINST US DOLLAR/ AND THUS STRONGER
HERE IS A BRIEF SYNOPSIS OF HOW THE CROOKS FLEECE UNSUSPECTING LONGS
YOU WILL ALSO NOTICE THAT THE COMEX OPEN INTEREST STARTS TO RISE BUT SO IS THE OPEN INTEREST OF SPREADERS. THE OPEN INTEREST IN WILL CONTINUE TO RISE UNTIL ONE WEEK BEFORE FIRST DAY NOTICE OF AN UPCOMING ACTIVE DELIVERY MONTH (OCT), AND THAT IS WHEN THE CROOKS SELL THEIR SPREAD POSITIONS BUT NOT AT THE SAME TIME OF THE DAY. THEY WILL USE THE SELL SIDE OF THE EQUATION TO CREATE THE CASCADE (ALONG WITH THEIR COLLUSIVE FRIENDS) AND THEN COVER ON THE BUY SIDE OF THE SPREAD SITUATION AT THE END OF THE DAY. THEY DO THIS TO AVOID POSITION LIMITS
WHAT IS ALARMING TO ME, ACCORDING TO OUR LONDON EXPERT ANDREW MAGUIRE IS THAT THESE EFP’S ARE BEING TRANSFERRED TO WHAT ARE CALLED SERIAL FORWARD CONTRACT OBLIGATIONS AND THESE CONTRACTS ARE LESS THAN 14 DAYS. ANYTHING GREATER THAN 14 DAYS, THESE MUST BE RECORDED AND SENT TO THE COMPTROLLER, GREAT BRITAIN TO MONITOR RISK TO THE BANKING SYSTEM. IF THIS IS INDEED TRUE, THEN THIS IS A MASSIVE CONSPIRACY TO DEFRAUD AS WE NOW WITNESS A MONSTROUS TOTAL EFP’S ISSUANCE AS IT HEADS INTO THE STRATOSPHERE.
The crooks also use the spread in the TAS account (trade at settlement). They buy the spot TAS (e.g. June) and sell the future TAS two months out (e.g. August). Then they unload the front month (i.e. unload the buy side first so the price of gold/silver falls. This occurs in the middle of the front delivery month cycle. They unload the sell side of the equation, two months down the road. The crooks violate position limits as the OCC refuse to hear our complaints.
First, here is an outline of what will be discussed tonight:
SILVER:
1.TODAY WE HAD THE OPEN INTEREST AT THE COMEX IN SILVER ROSE BY A STRONG 527 CONTRACTS TO AN OI OF 105,576
EFP ISSUANCE 668 CONTRACTS
OUR CUSTOMARY MIGRATION OF COMEX LONGS CONTINUE TO MORPH INTO LONDON FORWARDS AS OUR BANKERS USED THEIR EMERGENCY PROCEDURE TO ISSUE:
DEC 668 CONTRACTS and 0 ALL OTHER MONTHS: ZERO. TOTAL EFP ISSUANCE: 0 CONTRACTS. EFP’S GIVE OUR COMEX LONGS A FIAT BONUS PLUS A DELIVERABLE PRODUCT OVER IN LONDON. IF WE TAKE THE COMEX OI GAIN OF 527 CONTRACTS AND ADD TO THE 668 E.FP. ISSUED
WE OBTAIN A MEGA HUGE GAIN OF 1195 OI OPEN INTEREST CONTRACTS FROM OUR TWO EXCHANGES WITH OUR GAIN OF $1.04
THUS IN OUNCES, THE GAIN ON THE TWO EXCHANGES TOTAL 5.975 MILLION PAPER OZ
STANDING SEPT AT 32.210 MILLION OZ
SILVER PRICE GAIN OF $1.04
XXXXXXXXXXXXXXXXXXXXXXXXXXXXXXXXXXXXX
LET US BEGIN:
THE TOTAL COMEX GOLD OPEN INTEREST ROSE BY A FAIR 2124 CONTRACTS TO 413,,204 STILL WELL ABOVE ITS NEW LOW OF 326,052 OI SET JUNE 3, CLOSE TO THE PREVIOUS ALL TIME LOW OF 345,705 SET (MAY 28) AND CLOSE TO THE PREVIOUS ALL TIME LOW IN OI OF 353,490 SET MAY 27.. PREVIOUS TO THAT THE ALL TIME LOW IN OI WAS 390,000 SET IN THE YEAR 2001 WHEN GOLD WAS TRADING $260.00. THE CME SHOULD BE PROUD OF THEMSELVES AS MANY HAVE ABANDONED THIS CROOKED ARENA!!THUS OUR NEW ALL TIME LOW OF COMEX OI HAS NOW BEEN SET AT 326,052 //JUNE 3 2026 WITH GOLD AT AN EXTREMELY HIGH $4,450.00 WHICH MAKES ABSOLUTELY NO SENSE!!! REMEMBER THAT THE RAID OCCURRED AT 2 PM AFTER THE COMEX GOLD PRICE CLOSED.
WE HAD ZERO T.A.S. LIQUIDATION DURING FRIDAY’S COMEX TRADING HOURS// . IT SEEMS THAT MANY OF THE SPECULATORS THAT HAVE NOW CONTINUED AGAIN TO BE ON THE SHORT SIDE WITH BANKERS ON THE LONG SIDE AND THESE GUYS WERE AGAIN OBLITERATED YESTERDAY WHEN THE LONGS TENDERED FOR DELIVERY:
CENTRAL BANKS TENDERED THEIR NEW LONG CONTRACTS AT THE END OF THE DAY FOR PHYSICAL GOLD. YOU CAN VISUALIZE THIS WITH THE STRONG AMOUNT OF GOLD STANDING AT THE COMEX FOR THIS JULY CONTRACT MONTH!!
WE HAD A FAIR SIZED GAIN ON OUR TWO EXCHANGES (3539 CONTRACTS) OCCURRED WITH OUR GAIN IN PRICE IN GOLD (UP $26.45)
WE THUS HAD A FAIR GAIN IN OI ON BOTH OF OUR EXCHANGES (3539 CONTRACTS), WITH OUR GAIN IN PRICE, AS WE WERE INFORMED OF A FAIR CONTRACT EXCHANGE FOR PHYSICAL ISSUANCE EQUATING TO 1415 CONTRACTS.
THEN WE WERE NOTIFIED TODAY OF A 0 CONTRACT FOR RISK ISSUANCE IN GOLD CONTRACTS FOR 0 OZ OR 0 TONNES OF GOLD. TOTAL THUS SO FAR THIS MONTH: 2000 CONTRACTS//200,000 OZ OR 6.2208 TONNES (2 OCCASIONS)
MONTH OF MAY RECORD ISSUANCE OF EXCHANGE FOR RISK: THE HIGHEST EVER ISSUANCE!!
MAY 22 RECORDS THE HIGHEST EVER EXCHANGE FOR RISK AT 12.4416 TONNES. WE HAD OUR FIRST ISSUANCE FOR EXCHANGE FOR RISK IN THE MONTH OF MAY ON MAY 7, THEN OUR 2ND ISSUANCE FOR OUR MAY GOLD MONTH ON MAY 12. THE THIRD ON MAY 18 , THEN MAY 21 OUR 4TH ISSUANCE AND THEN FINALLY FRIDAY, OUR 5TH ISSUANCE. THIS GOLD WILL BE ADDED TO OUR NORMAL MAY DELIVERIES TO GIVE US OUR FINAL AMOUNT OF GOLD WILLING TO STAND AT THE COMEX..
HISTORY OF EXCHANGE FOR RISK ISSUANCE THIS YEAR: FEBRUARY THROUGH JULY AND AUGUST
FEBRUARY:
DURING THE MIDDLE OF THE FEBRUARY CONTRACT MONTH, WE HAD TWO IDENTICAL MONSTER 3,000 CONTRACT ISSUED FOR THE SAME 9.33 TONNES OF GOLD, AND THESE WERE THE HIGHEST EVER IN TONNAGE EVER ISSUED BY THE COMEX. ALTOGETHER THE TOTAL ISSUANCE FOR FEB TOTALLED SIX.(31.251 TONNES).
MARCH:
THURSDAY MARCH 17 WE RECEIVED ITS INITIAL 2000 CONTRACT EXCHANGE FOR RISK ISSUANCE FOR 6.22 TONNES. LAST FRIDAY: 0 ISSUANCE OF EXCHANGE FOR RISK. BUT ON MONDAY MARCH 23 WE RECEIVED NOTICE OF OUR SECOND EXCHANGE FOR RISK ISSUANCE FOR 2,200 CONTRACTS (220,000 OZ OR 6.843 TONNES) AND NOW FRIDAY WITH A MONSTER 2996 CONTRACTS FOR 9.3138 TONNES. THESE THREE ISSUANCES WILL NOW BE ADDED TO THE REGULAR AMOUNT OF GOLD STANDING, I.E. 22.3818 TONNES TO OUR NORMAL GOLD STANDING TO GIVE US WHAT WILL STAND FOR PHYSICAL GOLD FOR MARCH!
APRIL;: 2 EXCHANGE FOR RISK SO FAR, I.E. 2239 CONTRACTS FOR 223,900 OZ OR 6.964 TONNES AND THIS TOTAL TONNES WILL BE ADDED TO OUR NORMAL DELIVERY TO GIVE US WHAT WILL STAND IN APRIL
MAY: FIVE ISSUANCES SO FAR FOR 7920 CONTRACTS OR 792,000 OZ OR 24.635 TONNES.
JUNE: 0 IN GOLD. THUS FOR THE ENTIRE MONTH IN GOLD ZERO NOTICES WERE FILED.
JULY: 2 FOR 200 OZ OR 0.00622 TONNES
AUGUST: 1276 CONTRACTS FOR 127,600 OZ OR 3.9688 TONNES (5 OCCASIONS THIS MONTH)
SEPT: SO FAR: 2000 CONTRACTS FOR 200,000 OZ OR 6.2208 TONNESS (TWO OCCASIONS)
XXXXXXXXXXXXXXXXXXXXXXXXXXXXXXXXX
A LITTLE HISTORY OF EXCHANGE FOR RISK DECEMBER THROUGH TO SEPT:
IN DECEMBER WE HAVE RECORDED 5 ISSUANCES OF EXCHANGE FOR RISK/4 FOR DEC AND THE LAST ONE ON DEC 31 FOR JANUARY. WE NOW HAVE 3 CHOICES FOR THE RECIPIENT OF THIS ISSUANCE AND IT MUST BE A CENTRAL BANK. YOU WILL RECALL THAT THE BUYER ASSUMES THE RISK OF THAT DELIVERY. (THUS TOTAL EXCHANGE FOR RISK FOR THE MONTH OF DECEMBER IS 6.56 TONNES/4 OCCASIONS.
MONTH OF JANUARY/EXCHANGE FOR RISK
IN JANUARY THEY HAVE 6 TOTAL ISSUANCE : 3.446 TONNES EARLY, THEN JAN 9 ISSUANCE OF 9,331 TONNES AND THEN JAN 16: 0.1996 TONNES JAN 26: 1.499 TONNES, JAN 27: 3.160 AND FINALLY JAN 29: 4.659 TONNES TONNES//TOTAL EXCHANGE FOR RISK JANUARY 22.315 TONNES WHICH WAS ADDED TO OUR NORMAL DELVERIES.
AND FEBRUARY:
FEB EXCHANGE FOR RISK: NOW 6 ISSUANCES: 10,080 CONTRACTS FOR 1,008,000 OZ OR 31.251 TONNES!
HERE ARE THE CHOICES FOR THE RECIPIENT OF THOSE ISSUANCES:
1 THE CENTRAL BANK OF ENGLAND. BUT THEY RECEIVED CLEARANCE THAT THEIR GOLD IS BACK SO IT IS NOT LIKELY THAT THEY WOULD LIKE TO ADD TO THEIR RESERVES.
2. THE CENTRAL BANK OF THE USA: THE FED. LOGICAL CHOICE AS THEY CLAMOUR TRYING TO REDUCE THEIR 131+ TONNES OF SHORTAGE. HOWEVER THEY SEEM NOT TO BE IN A HURRY TO COVER THEIR HUGE SHORTFALL
3. THE CENTRAL BANK OF CHINA AS THEY BATTLE WITS WITH THE USA.
TOTAL EXCHANGE FOR RISK FOR DECEMBER IS 6.56 TONNES AND THIS WAS ADDED TO OUR NORMAL DELIVERY TOTALS..
THE JANUARY ISSUANCE OF 17.656 TONNES WAS ADDED TO OUR DAILY DELIVERY TOTALS!!
FEBRUARY ISSUANCES 6 FOR; 31.251 TONNES !! AND THIS WAS ADDED TO OUR DELIVERY TOTALS FOR THIS MONTH.
MARCH: CME ANNOUNCES ITS FIRST EXCHANGE FOR RISK FOR 2000 CONTRACTS FOR 200,000 OZ OR 6.22 TONNES OF GOLD DURING THE FIRST WEEK OF MARCH, AND THEN MONDAY, MARCH 22, WE RECEIVED ITS SECOND NOTICE ISSUANCE OF 2200 CONTRACTS OR 220000 OZ (6.843 TONNES). THEN FINALLY WE RECEIVED NOTICE OF OUR THIRD EXCHANGE FOR RISK OF 2996 CONTRACTS OR 9.3188 TONNES. TOGETHER ALL 3 ISSUANCES TOTAL 22.3818 TONNES WHICH WILL BE ADDED TO OUR NORMAL DELIVERY SCHEDULE.
APRIL: 2 EXCHANGE FOR RISK SO FAR FOR 223,900 OZ OR 6.964 TONNES. AND THIS TOTAL WILL BE ADDED TO OUR NORMAL DELIVERY TO GIVE US WHAT WILL STAND FOR APRIL!!
MAY: FIVE ISSUANCES SO FAR FOR 7920 CONTRACTS, 792,000 OZ OR 24.635 TONNES OF GOLD. THIS TOTAL WILL BE ADDED TO OUR NORMAL DELIVERIES IN MAY TO GIVE US WHAT WILL STAND IN MAY.
JUNE: ZERO
JULY 2 FOR 200 OZ OR 0.00622 TONNES. I DOUBT VERY MUCH THAT THIS IS A CENTRAL BANK
AUGUST: 1276 CONTRACTS FOR 127,600 OZ OR 3.9688 TONNES//5 OCCASIONS
SEPT: SO FAR: 2000 CONTRACTS FOR 200,000 OZ OR 6.2208 TONNES/TWO OCCASIONS
DETAILS ON OUR NEW SEPT COMEX CONTRACT MONTH//
IN TOTAL WE HAD A FAIR GAIN ON OUR TWO EXCHANGES OF 3539 CONTRACTS WITH OUR GAIN IN PRICE (UP $26.45). HOWEVER, OUR FRIENDLY PHYSICAL LONDON BOYS HAD ANOTHER FIELD DAY AGAIN THROUGHOUT THIS WEEK AS THEY WERE READY FOR THE FRBNY.S CONTINUED ORCHESTRATED ATTACKS VERY EARLY IN THE COMEX SESSIONS AS THEY TRIED TO ABSORB EVERYTHING IN SIGHT FROM THEIR DAILY ATTACKS. LONDONERS EXERCISED THEIR BOUGHT CONTRACTS FOR PHYSICAL GOLD VIA THE EXCHANGE FOR PHYSICAL ROUTE AND THANKED THE FRBNY AND OUR SHORT SPECULATORS FOR THEIR THOUGHTFULNESS.
LONDON ANNOUNCED EARLY IN THE YEAR (AND SCARCITY CONTINUES TO THIS DAY) THAT THEY WERE OUT OF GOLD. WRONGLY IT WAS ATTRIBUTED TO THEIR SHIPPING PHYSICAL GOLD TO COMEX FOR STORAGE DUE TO TRUMP’S INITIATION OF TARIFFS. THE TRUTH OF THE MATTER IS THAT THIS GOLD LEFT LONDON TO OTHER CENTRAL BANKS, AND COMEX BANKS HAVE BEEN PAPERING THEIR LOSSES (DERIVATIVE) WITH KILOBAR ENTRIES. BOTH COMEX AND LBMA ARE WITNESSING MASSIVE AMOUNTS OF GOLD LEAVING THEIR VAULTS.
THE LIQUIDATION OF T.A.S. CONTRACTS THROUGHOUT THE MONTHS OF JUNE/JULY/AUG CONTINUES TO DISTORT OPEN INTEREST NUMBERS GREATLY ALTHOUGH THE T.A.S. ISSUANCES IN GOLD HAVE GENERALLY BEEN ON THE LOW SIDE COMPARED TO SILVER WHICH HAVE BEEN HUGE. TODAY’S NUMBER HOWEVER IS A SMALL SIZED T.A.S ISSUANCE CONTRACTS .THE CME NOTIFIES US THAT THEY HAVE ISSUED 964 T.A.S CONTRACTS. THESE ARE GENERALLY USED FOR RAID PURPOSES TO STOP GOLD’S RISE AND TO TEMPER HUGE LOSSES IN OTC DERIVATIVE BETS.
IT SURE LOOKS LIKE THE BIS HAS SOMEHOW LOOKED THE OTHER WAY WITH ITS GOLD SWAPS WITH THE FRBNY AS THIS ENTITY FOR THE FED REFUSES THE BIS MARCHING ORDERS TO COVER AND THAT MAY EXPLAIN THE STRONG NUMBER OF T.A.S. ISSUANCES IN DECEMBER , JANUARY AND THROUGHOUT FEBRUARY TO GO ALONG WITH OUR HUGE NUMBER OF EXCHANGE FOR RISK ISSUED DURING THESE MONTHS INCLUDING FEBRUARY’S 6 EXCHANGE FOR RISK WHICH ALSO INCLUDED TWO MONSTER 9.3312 TONNE ISSUANCE (FEB 10 AND FEB 12). TOTAL EXCHANGE FOR RISK/FEB EQUALS 31.251 TONNES!! AND MARCH’S THREE ISSUANCES FOR 22.3818 TONNES! OTHER CENTRAL BANKS ARE PAYING ATTENTION AS THEY TAKE DELIVERY OF HUGE AMOUNTS OF PHYSICAL GOLD. APRIL HAD 2 EXCHANGE FOR RISK ISSUANCES FOR 6.694 TONNES. AND MAY WITH ITS 5TH ISSUANCE FOR 12.4436 TONNES///TOTAL EXCHANGE FOR RISK FOR MAY: 24.635 TONNES ISSUED MAY 6 ,MAY 12, MAY 18 MAY 21 AND NOW MAY 22..
THEN IT SLOWS DOWN!
JUNE: ZERO FOR THE MONTH
JULY: 2 SO FAR FOR 200 IZ IR 0.00622 TONNES
AUGUST: 1276 CONTRACTS FOR 127,600 OZ OR 3.9688 TONNES
SEPT: 2000 CONTRACTS SO FAR FOR 200,000 OZ OR 6.2208 TONNES (TWO OCCASIONS)
WE MUST ALSO REMEMBER THAT THE FRBNY IS SHORT 141+ TONNES OF GOLD, THIS COMMENCED ON JAN 2 2023 AS THEY REFUSE TO COVER DESPITE THE BIS’S PLEA TO DO SO.
HERE IS A SUMMARY OF GOLD STANDING FOR DELIVERY ON OUR LAST 16 MONTHS:
1.APRIL AT 209 TONNES
2. AND THIS CONTINUED INTO MAY WITH FINAL STANDING AT 90.23 TONNES.
3. JUNE WHICH IS A HUGE DELIVERY MONTH , FINAL STANDING WAS RECORDED AT A STRONG 93.085 TONNES. //(TOTAL NET QUEUE JUMPING FOR THE JUNE MONTH: 31.027 TONNES.)
4. IN JULY WE HAD HUGE DELIVERY NOTICES ESPECIALLY FOR A NON ACTIVE DELIVERY MONTH WITH INITIAL STANDING AT 17.947 TONNES PLUS MANY QUEUE JUMPS + 3.75 TONNES EX FOR RISK = 41.106 TONNES OF GOLD // FINAL TOTAL TONNES STANDING JULY: 41.106 TONNES
5. FOR THE MONTH OF AUGUST 2025
INITIAL AMOUNT OF GOLD STANDING FOR AUGUST: 60.547 TONNES PLUS THE MONTHS HUGE QUEUE JUMPS OF 47.2312 TONNES +44.696 TONNES EX FOR RISK (7 ISSUANCES) //NEW STANDING 152.208 TONNES WHICH IS MONSTROUS!!!
6. FINAL AMOUNT OF GOLD STANDING FOR SEPT; INITIAL STANDING; 2,602 CONTRACTS OR 260,200 OZ FOR 8.093 TONNES OF GOLD FOLLOWED BY TODAY’S 0.4883 TONNES QUEUE JUMP TO GO ALONG WITH TODAY’S 1.244 TONNES OF EXCHANGE FOR RISK ISSUANCE TODAY AND // TOTAL EXCHANGE FOR RISK ISSUANCE SEPT: 22.923 TONNES//NEW TOTALS STANDING ADVANCES TO 48.801 TONNES OF GOLD!!!
7. OCTOBER:
OCTOBER: INITIAL STANDING FOR GOLD: 90.164 TONNES TO WHICH WE ADD OUR LATEST OCT 30 QUEUE JUMP OF 0.00311 TONNES WHICH FOLLOWS OCT 29 QUEUE JUMP OF .4096 WHICH FOLLOWS; OCT 28 QUEUE JUMP OF .5069 TONNES WHICH FOLLOWS OCT 27 OF 0.3048 TONNES WHICH FOLLOWS: OCT 24 OF 0.8615 TONNES, FOLLOWING OCT 23 QUEUE JUMP OF 1.695 TONNES OCT 22 JUMP OF 8.622 TONNES WHICH FOLLOWS OCT 21: 3.8600 TONNES TO OCT 20 QUEUE JUMP OF 7.695 TONNE
SUMMARY FOR OCTOBER STANDING:
NOVEMBER WHERE INITIAL AMOUNT OF GOLD STANDING IS REGISTERED AT 15.651 TONNES OF GOLD FOLLOWED BY TODAY’S QUEUE JUMP OF 2 TONNES AND FOLLOWED BY ALL OTHER NOV QUEUE JUMPS OF 21.3775 TONNES TO WHICH WE ADD OUR TWO EXCHANGE FOR RISK ISSUANCE FOR 4.5596 TONNES.
/STANDING ADVANCES TO 43.9716 TONNES OF GOLD.
DECEMBER: INITIAL AMOUNT OF GOLD STANDING FOR DELIVERY IN THIS ACTIVE MONTH IS 83.813 TONNES FOLLOWED BY TODAY’S 0.05 TONNES QUEUE JUMP. THIS FOLLOWS ALL OTHER QUEUE JUMPING: 37.163 TONNES//NEW STANDING ADVANCES TO 115.390 TONNES TO WHICH WE ADD OUR FOUR EXCHANGE FOR RISK ISSUANCE OF 6.559 TONNES//NEW STANDING THUS INCREASES TO 121.977 TONNES
JANUARY: INITITAL STANDING: 13.785 TONNES TO WHICH WE ADD OUR QUEUE JUMP OF 0.000 TONNES WHICH FOLLOWS ALL OTHER QUEUE JUMPS OF 30.7117TONNES //NEW TOTAL QUEUE JUMPS 30.7117//NORMAL DELIVERY OF GOLD ADVANCES TO 36.8958 TONNES TO WHICH WE ADD OUR SIX EXCHANGE FOR RISK OF 22.315 TONNES//NEW STANDING ADVANCES TO 59.2108 TONNES.
FEBRUARY: . FEBRUARY: INITIAL STANDING: 93.566 TONNES TO WHICH WE ADD OUR NEXT QUEUE JUMP OF 0.0248 TONNES WHICH MUST BE ADDED ALL OTHER QUEUE JUMPS OF 41.2087 TONNES QUEUE JUMP//TOTAL QUEUE JUMP FOR FEB::ADVANCES TO 41.233 TONNES///STANDING ADVANCES TO 126.628 TONNES TO WHICH WE ADD OUR SIX EXCHANGE FOR RISK OF 31.251 TONNES/NEW STANDING FINALIZES AT 157.879 TONNES, ITS HIGHEST STANDING RECORDED IN OVER 4 YEARS.
MARCH: INITIAL STANDING FOR GOLD: 8.099 TONNES TO WHICH WE ADD OUR NEXT QUEUE JUMP OF 0.2320 TONNES AND THEN WE ADD OUR THREE EXCHANGE FOR RISK OF 22.3818 TONNES////NEW STANDING FOR GOLD ADVANCES TO: 67.6648TONNES WHICH IS ABSOLUTELY HUGE FOR A NON ACTIVE DELIVERY MONTH!!
APRIL 2026: INITIAL STANDING FOR GOLD: 52.20 TONNES FOLLOWED BY TODAY’S SMALL 500 OZ QUEUE JUMP/ TO WHICH WE ADD OUR TWO EXCHANGE FOR RISK ISSUANCES TOTALLING 223,900 OZ OR 6.964 TONNES//STANDING ADVANCES TO 77.726 TONNES WHICH IS ABSOLUTELY HUGE
MAY: INITIAL AMOUNT OF GOLD WILLING TO STAND: 12.24 TONNES OF GOLD TO WHICH WE ADD OUR NEXT HUGE QUEUE JUMP OF 34,500 OZ (1.073 TONNES) TO WHICH WE ADD OUR FIVE EXCHANGE FOR RISK ISSUANCE FOR 792,000 OZ OR 24.635 TONNES////NEW TOTALS STANDING FOR GOLD ADVANCES TO 51.554 TONNESS
JUNE: INITIAL AMOUNT OF GOLD WILLING TO STAND: 64.496 TONNES TO WHICH WE SUBTRACT AN EXCHANGE FOR PHYSICAL TRANSFER TO LONDON OF 0.0186 TONNES//NEW STANDING REDUCES TO 127.03 TONNES// TOTAL QUEUE JUMPING FOR THE MONTH FINALIZES AT 62.4217 TONNES OR AVERAGING 3.285 TONNES PER DAY IN JUNE.
JULY: INITIAL AMOUNT OF GOLD WILLING TO STAND: 749,300 OZ OR 23.306 TONNES OF GOLD TO WHICH WE ADD OUR NEXT QUEUE JUMP OF 0.000TONNES//NEW STANDING REMAINS AT 40.818TONNES PLUS 0.00622 TONNES EXHANGE FOR RISK// NEW TOTAL 40.824 TONNES . TOTAL QUEUE JUMPING SO FAR: 17.5802 TONNES OR 0.8790 TONNES ON EACH TRADING DAY LEAVING COMEX FOR EASTERN SHORES.
AUGUST INITIAL; INITIAL AMOUNT OF GOLD WILLING TO STANDS: 48.687 TONNES TO WHICH WE ADD OUR 5TH EXCHANGE FOR RISK OF 5 CONTRACTS FOR 500 OZ OR 0.0155 TONNES TO OUR 4TH EXCHANGE FOR RISK OF 220 CONTRACTS FOR 20,000 OZ OR 0.6220 TONNES TO OUR 3RD EXCHANGE FOR RISK AT 1.7045 TONNES TO OUR 2ND EXCHANGE FOR RISK AT 1.552 TONNES TO OUR FIRST: 0.0715 NEW TOTAL EXCHANGE FOR RISK = 3.9688 TONNES AND THEN ADD OUR NEXT QUEUE JUMP OF 39 CONTRACTS OR 3900 OZ (0.1213 TONNES)//STANDING, IN TOTAL, THUS ADVANCES HUGELY TO 67.2441 TONNES.
SEPT/2026. INITIAL STANDING : 8.756 TONNES//FOLLOWED BY TODAY’S QUEUE JUMP OF 11,70000 OZ OR .3639 TONNES TO WHICH WE ADD THIS TO OUR TWO EXCHANGE FOR RISK OF 2,000 CONTRACTS/200,000 OZ OR 6.2208 TONNES: /NEW STANDING ADVANCES TO 17.8133 TONNES
HERE ARE THE AMOUNTS THAT STOOD FOR DELIVERY IN THE 4 YEARS 2021-2024
DEC 2021: 112.217 TONNES
NOV. 8.074 TONNES
OCT. 57.707 TONNES
SEPT: 11.9160 TONNES
AUGUST: 80.489 TONNES
JULY 7.2814 TONNES
JUNE: 72.289 TONNES
MAY 5.77 TONNES
APRIL 95.331 TONNES
MARCH 30.205 TONNES
FEB ’21. 113.424 TONNES
JAN ’21: 6.500 TONNES.
TOTAL YEAR 2021 (JAN- DEC): 601.213 TONNES
YEAR 2022: STANDING FOR GOLD/COMEX
JANUARY 2022 17.79 TONNES
FEB 2022: 59.023 TONNES
MARCH: 36.678 TONNES
APRIL: 85.340 TONNES FINAL.
MAY: 20.11 TONNES FINAL
JUNE: 74.933 TONNES FINAL
JULY 29.987 TONNES FINAL
AUGUST:104.979 TONNES//FINAL
SEPT. 38.1158 TONNES
OCT: 77.390 TONNES/ FINAL
NOV 27.110 TONNES/FINAL
Dec. 64.000 tonnes
(TOTAL YEAR 656.076 TONNES)
JAN/2023: 20.559 tonnes
FEB 2023: 47.744 tonnes
MAR: 19.0637 TONNES
APRIL: 75.676 tonnes
MAY: 19.094 TONNES + 1.244 tonnes of exchange for risk = 20.338
JUNE: 64.354 TONNES
JULY: 10.2861 TONNES
AUGUST: 38.855 TONNES(INCLUDING .6842 EXCHANGE FOR RISK)
SEPT: 15.281 TONNES FINAL
OCT. 35.869 TONNES + 1.665 EXCHANGE FOR RISK =37.0355 tonnes
NOV: 18.7122 TONNES + 16.2505 EX. FOR RISK = 34.9627 TONNES
DEC. 47.073 + 4.634 TONNES OF EXCHANGE FOR RISK = 51.707 TONNES
TOTAL 2023 YEAR : 436.546 TONNES
2024/STANDING FOR GOLD/COMEX
JAN ’24. 22.706 TONNES
FEB. ’24: 66.276 TONNES (INCLUDES 1.723 TONNES EX. FOR RISK)
MARCH: 18.8398 TONNES + 1.1695 EX FOR RISK = 20.093 TONNES
APRIL: 2024: 53.673TONNES FINAL
MAY/ 2024 8.5536 TONNES + 3.3716 TONNES EX FOR RISK/= 11.9325
JUNE; 95.578 TONNES. + 1.045 TONNES EXCHANGE FOR RISK =96.623 THIS IS THE HIGHEST RECORDED GOLD STANDING SINCE AUGUST 2022
JULY: 11.692 TONNES
AUGUST 69.602 TONNES//FINAL STANDING
SEPT. 13.164 TONNES.
OCT 39.474 TONNES + + 20.917 TONNES EXCHANGE FOR RISK =60.391 TONNES
NOV . 11.265 TONNES +4.665 TONNES EXCHANGE FOR RISK/TUESDAY + 3.11 TONNES OF EX. FOR RISK/PRIOR = 19.0425 TONNES
DEC: 80.4230 TONNES PLUS DEC MONTH EXCHANGE FOR RISK TOTAL 14.6836 TONNES EQUALS 95.1066 TONNES
total year 2024: 540.30 tonnes
COMEX GOLD TRADING BEGINNING SEPT CONTRACT;
THE SPECS/HFT WERE UNSUCCESSFUL IN LOWERING GOLD’S PRICE ( IT ROSE BY $26.45).
WE HAD ZERO T.A.S. SPREADER LIQUIDATION FRIDAY // COMEX SESSION// WITH OUR GAIN IN PRICE.
OTHER EASTERN CENTRAL BANKS TENDERED FOR PHYSICAL EVERY NIGHT WHICH ALSO EXPLAINS THE HUGE NUMBER OF TONNES OF GOLD THAT STOOD FOR GOLD DURING THESE PAST SEVERAL MONTHS
THE CROOKS COULD NOT STOP OTHER CENTRAL BANK LONGS, SEIZING THE MOMENT, THEY EXERCISED AGAIN FOR PHYSICAL IN A BIG WAY TENDERING FOR PHYSICAL FRIDAY EVENING SATURDAY MORNING AND THUS OUR HUGE NUMBER OF GOLD CONTRACTS STANDING FOR DELIVERY AT THE COMEX. CENTRAL BANKERS WAIT PATIENTLY FOR THE GOLD
ALL OF THIS WAS ACCOMPLISHED WITH OUR GAIN IN PRICE AT COMEX OF $26.45
WE HAD A HUGE XXXX CONTRACTS REMOVED // PRELIMINARY NUMBERS TO FINAL COMEX NUMBERS.
NET GAIN ON THE TWO EXCHANGES: 3539 CONTRACTS OR 353,900 OZ 11.007 TONNES
SEPT DELIVERY MONTH
SEPT 21
| Gold | Ounces |
| Withdrawals from Dealers Inventory in oz | nil |
| Withdrawals from Customer Inventory in oz | 0 ENTRIES |
| Deposit to the Dealer Inventory in oz | 0 ENTRIES |
| Deposits to the Customer Inventory, in oz | DEPOSITS/CUSTOMER//gold 0 ENTRIES xxxxxxxxxxxxxxxx |
| No of oz served (contracts) today | 303 CONTRACTS 30,300 OZ 0.9424 TONNES OF GOLD |
| No of oz to be served (notices) | 200 Contracts 20,000 OZ 0.6220 TONNES |
| Total monthly oz gold served (contracts) so far this month | 3527 notices 352,700 OZ 10.970 TONNES |
| Total accumulative withdrawals of gold from the Dealers inventory this month | NIL oz |
| Total accumulative withdrawal of gold from the Customer inventory this month |
dealer deposits: 0
xxxxxxxxxxxxxxxxxxx
ENTRIES: 0
xxxxxxxxxxxxxxxxxx
comex withdrawal
0 ENTRIES
adjustments: 0
COMEX IS DRAINING GOLD
chaos inside the comex
THE FRONT MONTH OF SEPT OI STANDS AT 503 CONTRACTS HAVING A GAIN OF 117 CONTRACTS.
FRIDAY WE HAD NORMAL STANDING AT 361,000 OZ //TODAY: 372,700 OZ STAND. THUS A GAIN OF 11,700 OZ(0.3639 TONNES) OR 117 CONTRACTS UNDERWENT A QUEUE JUMP.
OCT LOST 581 CONTRACTS TO AN OI OF 42,492
NOVEMBER LOST 4 CONTRACTS FALLING TO 1096
.
We had 303 contracts filed for today representing 30,300 oz
Today, 0 notice(s) were issued from J.P.Morgan dealer and 0 notices issued from their client or customer account. The total of all issuance by all participants equate to 303 contract(s) of which 0 notices were stopped (received) by j.P. Morgan dealer and 76 notice(s) was (were) stopped (received) by J.P.Morgan//customer account
To calculate the INITIAL total number of gold ounces standing for SEPT /2026. contract month, we take the total number of notices filed so far for the month (3527) to which we add the difference between the open interest for the front month of SEPT (503 CONTRACTS) minus the number of notices served upon today 303x 100 oz per contract) equals 372,700 OZ OR(11.5925 Tonnes of gold) to which we add our two exchange for risk, 2000 contracts or 200,000 oz (6.2208 tonnes)///// thus new standing thus advances to 17.8133 tonnes
THUS: INITIAL total number of gold ounces standing for SEPT. /2026. contract month,we take the total number of notices filed so far for the month (3527) to which we add the difference between the open interest for the front month of SEPT(503) contracts minus the number of notices served upon today 303 x 100 oz per contract) equals 372,700 OZ OR(11.5925 Tonnes of gold) to which we add our two exchange for risk of 6.2208 tonnes/new standing advances to 17.8133 tonnes
new total of gold standing in SEPT becomes 17.8133TONNES//
TOTAL COMEX GOLD STANDING FOR SEPT.: 17.8133 TONNES WHICH IS NOW VERY STRONG FOR THIS NON ACTIVE DELIVERY MONTH OF SEPT
confirmed volume FRIDAY confirmed 189,617/ fair//
COMEX GOLD INVENTORIES/CLASSIFICATION
NEW PLEDGED GOLD:
241,794.285 oz NOW PLEDGED /HSBC 5.94 TONNES
204,937.290 OZ PLEDGED MANFRA 3.08 TONNES
83,657.582 PLEDGED JPMorgan no 1 1.690 tonnes
265,999.054, oz JPM No 2
1,152,376.639 oz pledged Brinks/
Manfra: 33,758.550 oz
Delaware: 193.721 oz
International Delaware:: 11,188.542 oz
total pledged gold: 1,732,993.643 oz 53.903 tonnes pledged gold lowers
total inventories in gold declining rapidly
total pledged gold: 1,732,993.643 tonnes oz 53.903 tonnes
TOTAL OF ALL GOLD ELIGIBLE AND REGISTERED GOLD 27,383,818.341 oz
TOTAL REGISTERED GOLD 15,156,292.646 tonnes (471.424 tonnes)
TOTAL OF ALL ELIGIBLE GOLD 12,227,525,095 oz. Lots of eligible gold leaving the comex
REGISTERED GOLD THAT CAN BE SERVED UPON 13,422,528 oz ((REG GOLD- PLEDGED GOLD)=
424.30 Tonnes //
total inventories in gold declining rapidly
SILVER COMEX
SEPT DELIVERY MONTH
SEPT 21
| Silver | Ounces |
| Withdrawals from Dealers Inventory | NIL oz |
| Withdrawals from Customer Inventory | 4 entries i) Out of ASAHI 601,729.560 OZ ii) Out of Loomis 636,776,160 oz iii) Out of Brinks 602,423.773 oz iv) Out of Manfra 200,415.408 oz total withdrawal 2,041,345.301 OZ |
| Deposits to the Dealer Inventory | 0 ENTRY |
| Deposits to the Customer Inventory | ENTRIES: 1 i) Into Asahi: 598,433.200 oz total deposit 598,433.200 oz |
| No of oz served today (contracts) | 53 CONTRACT(S) ( 265,000 OZ) |
| No of oz to be served (notices) | 274 Contracts (1.370 MILLION oz) |
| Total monthly oz silver served (contracts) | 6168 contracts 30.840 MILLIONoz |
| Total accumulative withdrawal of silver from the Dealers inventory this month | NIL oz |
| Total accumulative withdrawal of silver from the Customer inventory this month |
DEPOSITS INTO DEALER ACCOUNTS
ENTRY:0
DEPOSIT ENTRIES/CUSTOMER ACCOUNT
1 ENTRIES:
i) Into Asahi: 598,433.200 oz
total deposit 598,433.200 oz
xxxxxxxxxxxxxxxxxxxxxxxxx
withdrawals:
4 entries
i) Out of ASAHI 601,729.560 OZ
ii) Out of Loomis 636,776,160 oz
iii) Out of Brinks 602,423.773 oz
iv) Out of Manfra 200,415.408 oz
total withdrawal 2,041,345.301 OZ
adjustments : 0
xxxxxxxxxxxxxx
TOTAL REGISTERED SILVER: 97.285 MILLION OZ//.TOTAL REG + ELIGIBLE. 330.083 Million oz
registered silver dropping in numbers
CALCULATIONS FOR THE NEW STANDING FOR SILVER FOR SEPT
FRONT MONTH: SILVER OPEN INTEREST CONTRACTS: 327 FOR A LOSS OF 42 CONTRACTS.
FRIDAY WE HAD 31.330 MILLION OZ STAND: MONDAY 32.210 MILLION OZ FOR A GAIN OF 0.088 MILLION OZ (88,000 OZ OR A 18 CONTRACT QUEUE JUMP WHERE THEY WILL TAKE EXTRA DELIVERY ON THIS SIDE OF THE POND.
OCT GAINED 70 CONTRACTS TO AN OI OF 2999
NOVEMBER GAINED 16 CONTRACTS UP TO AN OI OF 527
TOTAL NUMBER OF NOTICES FILED FOR TODAY: 53 or 0.265 MILLION oz
CONFIRMED volumeFRIDAY;XXXX// excellent/
AND NOW SEPT. DELIVERIES:
To calculate the number of silver ounces that will stand for delivery in SEPT. we take the total number of notices filed for the month so far at 6168 X5,000 oz = 30.840 MILLION oz.
Then we take the difference between the front month of September and the number of notices filed for today x 5000 to give us our standing
Thus the standings for silver for the Sept 2026 contract month: (6168 )Notices served so far) x 5000 oz + OI for the front month of SEPT 327) minus number of notices served upon today ( 53 x 5000 oz) equals silver standing for the SEPT .contract month equating to 32.210 MILLION OZ. ( a very strong delivery month)
We must also keep in mind that there is considerable silver standing in London coming from our longs
There are ONLY 97.285 million oz of registered silver
JPMorgan as a percentage of total silver: 133.090/330.083million: 40.30%
The record level of silver open interest is 234,787 contracts set on April 21./2017 with the price on that day at $18.42.
The previous record was 224,540 contracts with the price at that time of $20.44.
BOTH GLD AND SLV ARE MASSIVE FRAUD
XXXXXXXXXXXXXXXXXXXXXXXXXXXXXXXXXXXXXXXXXXX
SEPT 21//2026/WITH GOLD UP $XXXX /XXX CHANGES IN GOLD AT THE GLD:///:/INVENTORY RESTS AT XXX TONNES
SEPT 18//2026/WITH GOLD UP $26.45 /HUGE CHANGES IN GOLD AT THE GLD://A DEPOSIT OF 0.85 TONNES OF GOLD INTO THE GLD/:/INVENTORY RESTS AT 1052.84 TONNES
SEPT 17//2026/WITH GOLD UP $14.05 /HUGE CHANGES IN GOLD AT THE GLD://A DEPOSIT OF 1.71 TONNES OF GOLD INOT THE GLD/:/INVENTORY RESTS AT 1051.99 TONNES
SEPT 16//2026/WITH GOLD UP $53.40 /HUGE CHANGES IN GOLD AT THE GLD://A DEPOSIT OF 2.86 TONNES OF GOLD INOT THE GLD/:/INVENTORY RESTS AT 1050.28 TONNES
SEPT 15//2026/WITH GOLD DOWN $19.45 /NO CHANGES IN GOLD AT THE GLD://A WITHDRAWAL OF 0.353 TONNES OF GOLD FROM THE GLD/:/INVENTORY RESTS AT 1047.420 TONNES
SEPT 14//2026/WITH GOLD DOWN $54.50 /SMALL CHANGES IN GOLD AT THE GLD://A WITHDRAWAL OF 0.353 TONNES OF GOLD FROM THE GLD/:/INVENTORY RESTS AT 1047.420 TONNES
SEPT 11//2026/WITH GOLD UP $1.05 /SMALL CHANGES IN GOLD AT THE GLD://A WITHDRAWAL OF 0.353 TONNES OF GOLD FROM THE GLD/:/INVENTORY RESTS AT 1050.277 TONNES
/SEPT 10//2026/WITH GOLD UP $50.60 /NO CHANGES IN GOLD AT THE GLD://:/INVENTORY RESTS AT 1050.63 TONNES
SEPT 9//2026/WITH GOLD UP $20.40 /HUGE CHANGES IN GOLD AT THE GLD:A WITHDRAWAL OF 1.43 TONNES OF GOLD OUT OF THE GLD/ ////:/INVENTORY RESTS AT 1050.63 TONNES
SEPT 8//2026/WITH GOLD DOWN $34.20 /HUGE CHANGES IN GOLD AT THE GLD:A WITHDRAWAL OF 1.42 TONNES OF GOLD OUT OF THE GLD/ ////:/INVENTORY RESTS AT 1052.06 TONNES
SEPT 4//2026/WITH GOLD DOWN $63.50 /HUGE CHANGES IN GOLD AT THE GLD:A WITHDRAWAL OF 3.14 TONNES OF GOLD OUT OF THE GLD/ ////:/INVENTORY RESTS AT 1053.48 TONNES
SEPT 3//2026/WITH GOLD UP $141.55 /HUGE CHANGES IN GOLD AT THE GLD:A DEPOSIT OF 9.98 TONNES OF GOLD INTO THE GLD/ ////:/INVENTORY RESTS AT 1056.62 TONNES
SEPT 2//2026/WITH GOLD UP $19.25 /HUGE CHANGES IN GOLD AT THE GLD:A DEPOSIT OF 4.28 TONNES OF GOLD INTO THE GLD/ ////:/INVENTORY RESTS AT 1046.64 TONNES
SEPT 1//2026/WITH GOLD DOWN $80.25 /NO CHANGES IN GOLD AT THE GLD:// ////:/INVENTORY RESTS AT 1042.36 TONNES
AUGUST 31//2026/WITH GOLD DOWN $48.20 /HUGE CHANGES IN GOLD AT THE GLD:A WITHDRAWAL OF 4.25 TONNES OF GOLD FROM THE GLD// ////:/INVENTORY RESTS AT 1042.36 TONNES
AUGUST 28//2026/WITH GOLD DOWN $119.00 /HUGE CHANGES IN GOLD AT THE GLD:A WITHDRAWAL OF 1.71 TONNES OF GOLD FROM THE GLD// ////:/INVENTORY RESTS AT 1046.64 TONNES
AUGUST 27//2026/WITH GOLD UP $11.35 /NO CHANGES IN GOLD AT THE GLD: ////:/INVENTORY RESTS AT 1048.950 TONNES
AUGUST 26//2026/WITH GOLD DOWN $75.35 /HUGE CHANGES IN GOLD AT THE GLD: // A STRONG WITHDRAWAL OF 1/138 TONNES OF GOLD OUT OF THE GLD//:/INVENTORY RESTS AT 1048.950 TONNES
AUGUST 25//2026/WITH GOLD FLAT /HUGE CHANGES IN GOLD AT THE GLD: // A STRONG DEPOSIT OF 2.279 TONNES OF GOLD INTO THE GLD//:/INVENTORY RESTS AT 1049.489 TONNES
AUGUST 24//2026/WITH GOLD UP $15.30 /HUGE CHANGES IN GOLD AT THE GLD: // A MASSIVE DEPOSIT OF 12.50 TONNES OF GOLD INTO THE GLD//:/INVENTORY RESTS AT 1047.21 TONNES
AUGUST 21//2026/WITH GOLD UP $103.98 /NO CHANGES IN GOLD AT THE GLD: //:/INVENTORY RESTS AT 1034.65 TONNES
AUGUST 20//2026/WITH GOLD UP $29.30 /HUGE CHANGES IN GOLD AT THE GLD: A MASSIVE DEPOSIT OF 9.41 TONNES OF GOLD INTO THE GLD: //:/INVENTORY RESTS AT 1034.65 TONNES
AUGUST 19//2026/WITH GOLD UP $123.70 /HUGE CHANGES IN GOLD AT THE GLD: A MASSIVE WITHDRAWAL OF 5.42 TONNES OF GOLD OUT OF THE GLD: //:/INVENTORY RESTS AT 1025.24 TONNES
AUGUST 18//2026/WITH GOLD DOWN $51.50 /HUGE CHANGES IN GOLD AT THE GLD: A MASSIVE DEPOSIT OF 7.13 TONNES OF GOLD INTO THE GLD: //:/INVENTORY RESTS AT 1030.66 TONNES
AUGUST 17//2026/WITH GOLD UP $36.70 /HUGE CHANGES IN GOLD AT THE GLD: A WITHDRAWAL OF 2.28 TONNES OF GOLD FORM THE GLD: //:/INVENTORY RESTS AT 1023.53 TONNES
AUGUST 14//2026/WITH GOLD UP $16.55 /NO CHANGES IN GOLD AT THE GLD: : //:/INVENTORY RESTS AT 1025.80 TONNES
AUGUST 13//2026/WITH GOLD DOWN $43.05 /HUGE CHANGES IN GOLD AT THE GLD: A DEPOSIT OF 3,139 TONNES OF GOLD INTO THE GLD. : //:/INVENTORY RESTS AT 1025,80TONNES
AUGUST 12//2026/WITH GOLD UP $24.55 /HUGE CHANGES IN GOLD AT THE GLD: A DEPOSIT OF 2.562 TONNES OF GOLD INTO THE GLD. : //:/INVENTORY RESTS AT 1022.672TONNES
AUGUST 11//2026/WITH GOLD UP $20.25 /HUGE CHANGES IN GOLD AT THE GLD: A DEPOSIT OF 2.52 TONNES OF GOLD INTO THE GLD. : //:/INVENTORY RESTS AT 1020.06TONNES
AUGUST 10//2026/WITH GOLD UP $22.00 /HUGE CHANGES IN GOLD AT THE GLD: A DEPOSIT OF 2.82 TONNES OF GOLD INTO THE GLD. : //:/INVENTORY RESTS AT 1017. 540TONNES
/AUGUST 7//2026/WITH GOLD UP $98.00 /HUGE CHANGES IN GOLD AT THE GLD: A DEPOSIT OF 0.57 TONNES OF GOLD INTO THE GLD. : //:/INVENTORY RESTS AT 1014.720TONNES
AUGUST 6//2026/WITH GOLD DOWN $2.45 /HUGE CHANGES IN GOLD AT THE GLD: A DEPOSIT OF 4.851 TONNES OF GOLD FROM THE GLD. : //:/INVENTORY RESTS AT 1014.143TONNES
GLD INVENTORY: 1052.84 TONNES, TONIGHTS TOTAL GOLD INVENTORY
SILVER
SEPT 21 WITH SILVER UP $XXXX : :XXX CHANGES IN INVENTORY AT THE SLV: :INVENTORY RESTS AT XXXX MILLION OZ
SEPT 18 WITH SILVER UP $1.04 : :NO CHANGES IN INVENTORY AT THE SLV: :INVENTORY RESTS AT 489.558 MILLION OZ
SEPT 17 WITH SILVER UP $1.10 : :HUGE CHANGES IN INVENTORY AT THE SLV: A WITHDRAWAL OF 1.265 MILLION OZ FROM THE SLV/ :INVENTORY RESTS AT 489.558 MILLION OZ
SEPT 16 WITH SILVER UP $0.95 : :HUGE CHANGES IN INVENTORY AT THE SLV: A WITHDRAWAL OF 813,000 OZ FROM THE SLV/ :INVENTORY RESTS AT 490.823 MILLION OZ
SEPT 15 WITH SILVER DOWN $0.16 : :HUGE CHANGES IN INVENTORY AT THE SLV: A WITHDRAWAL OF 813,000 OZ FROM THE SLV/ :INVENTORY RESTS AT 491.636 MILLION OZ
SEPT 14 WITH SILVER DOWN $0.91 : :NO CHANGES IN INVENTORY AT THE SLV:/ :INVENTORY RESTS AT 492.449 MILLION OZ
SEPT 11 WITH SILVER DOWN $3.50 : :NO CHANGES IN INVENTORY AT THE SLV:/ :INVENTORY RESTS AT 492.449 MILLION OZ
SEPT 10 WITH SILVER DOWN $3.50 : :NO CHANGES IN INVENTORY AT THE SLV:// / :INVENTORY RESTS AT 493.171 MILLION OZ
SEPT 9 WITH SILVER UP $0.56 : :NO CHANGES IN INVENTORY AT THE SLV:// / :INVENTORY RESTS AT 493.171 MILLION OZ
SEPT 8 WITH SILVER UP $0.31 : :HUGE CHANGES IN INVENTORY AT THE SLV:/ A DEPOSIT OF 0.632 MILLION OZ INTO THE SLV// / :INVENTORY RESTS AT 493.171 MILLION OZ
SEPT 4 WITH SILVER UP $2.20 : :NO CHANGES IN INVENTORY AT THE SLV:/// / :INVENTORY RESTS AT 492.539 MILLION OZ
SEPT 3 WITH SILVER UP $2.20 : :HUGE CHANGES IN INVENTORY AT THE SLV:A WITHDRAWAL OF 1.293 MILLION OZ FROM THE SLV//// / :INVENTORY RESTS AT 492.539 MILLION OZ
SEPT2 WITH SILVER UP $0.15 : :NO CHANGES IN INVENTORY AT THE SLV:// / :INVENTORY RESTS AT 493.832 MILLION OZ
SEPT1 WITH SILVER DOWN $1.43 : :NO CHANGES IN INVENTORY AT THE SLV:// / :INVENTORY RESTS AT 493.832 MILLION OZ
AUGUST 31 WITH SILVER DOWN $0.97 : :SMALL CHANGES IN INVENTORY AT THE SLV:A DEPOSIT OF 0.452 MILLION OZ INTO THE SLV// / :INVENTORY RESTS AT 493.832 MILLION OZ
AUGUST 28 WITH SILVER DOWN $2.44 : :SMALL CHANGES IN INVENTORY AT THE SLV:A WITHDRAWAL OF 0.543,000 MILLION OZ FROM THE SLV// / :INVENTORY RESTS AT 493.380 MILLION OZ
AUGUST 27 WITH SILVER UP $1.33 : :NO CHANGES IN INVENTORY AT THE SLV: / :INVENTORY RESTS AT 493.923 MILLION OZ
AUGUST 26 WITH SILVER DOWN $0.60 : :HUGE CHANGES IN INVENTORY AT THE SLV: A WITHDRAWAL OF 1.174 MILLION OZ OUT OF THE SLV / :INVENTORY RESTS AT 493.923 MILLION OZ
AUGUST 25 WITH SILVER UP $0.43 : :HUGE CHANGES IN INVENTORY AT THE SLV: A DEPOSIT OF 3.9786 MILLION OZ INTO THE SLV / :INVENTORY RESTS AT 495.097 MILLION OZ
AUGUST 24 WITH SILVER DOWN $1.08 : :HUGE CHANGES IN INVENTORY AT THE SLV: A DEPOSIT OF 0.633 MILLION OZ INTO THE SLV / :INVENTORY RESTS AT 491.754 MILLION OZ
AUGUST 21 WITH SILVER UP $1.48 : :NO CHANGES IN INVENTORY AT THE SLV. / :INVENTORY RESTS AT 491.121 MILLION OZ
AUGUST 20 WITH SILVER UP $2.92 : :HUGE CHANGES IN INVENTORY AT THE SLV A WITHDRAWAL OF 2.169 MILLION OZ OZ OUT OF THE SLV. / :INVENTORY RESTS AT 491.121 MILLION OZ
AUGUST 19 WITH SILVER UP $1.72 : :HUGE CHANGES IN INVENTORY AT THE SLV A DEPOSIT OF 2.259 MILLION OZ OZ INTO THE SLV. / :INVENTORY RESTS AT 493.290 MILLION OZ
AUGUST 18 WITH SILVER DOWN $2.02 : :SMALL CHANGES IN INVENTORY AT THE SLV A WITHDRAWAL OF 768,000 OZ OUT OF THE SLV. / :INVENTORY RESTS AT 492.296 MILLION OZ
AUGUST 17 WITH SILVER UP $1.11 : :SMALL CHANGES IN INVENTORY AT THE SLV A WITHDRAWAL OF 768,000 OZ OUT OF THE SLV. / :INVENTORY RESTS AT 492.296 MILLION OZ
AUGUST 14 WITH SILVER UP $0.19 : :SMALL CHANGES IN INVENTORY AT THE SLV A DEPOSIT OF 720,000 OZ INTO THE SLV. / :INVENTORY RESTS AT 493.064 MILLION OZ
AUGUST 13 WITH SILVER DOWN $0.92 : :NO CHANGES IN INVENTORY AT THE SLV / :INVENTORY RESTS AT 492.341 MILLION OZ
AUGUST 12 WITH SILVER UP $0.75 : :HUGE CHANGES IN INVENTORY AT THE SLV;A DEPOSIT OF 3.434 MILLION OZ INTO THE SLV / :INVENTORY RESTS AT 492.341 MILLION OZ
AUGUST 11 WITH SILVER DOWN $0.39 : :HUGE CHANGES IN INVENTORY AT THE SLV;A DEPOSIT OF 1.085 MILLION OZ INTO THE SLV / :INVENTORY RESTS AT 488.907 MILLION OZ
AUGUST 10 WITH SILVER UP $1.83 : :NO CHANGES IN INVENTORY AT THE SLV; / :INVENTORY RESTS AT 487.822 MILLION OZ
AUGUST 7 WITH SILVER UP $2.00 : :HUGE CHANGES IN INVENTORY AT THE SLV; A DEPOSIT OF 1.355 MILLION OZ INTO THE SLV : / :INVENTORY RESTS AT 487.822 MILLION OZ
AUGUST 6 WITH SILVER DOWN $0.75 : :NO CHANGES IN INVENTORY AT THE SLV : / :INVENTORY RESTS AT 486.467 MILLION OZ
CLOSING INVENTORY 489.558 MILLION OZ OF SILVER
GOLD COMMENTARIES:
ROBERT LAMBOURNE….
Tether is expanding its gold and silver activities
This Substack article by Vince Lanci reports on the increased activities of Tether in gold and silver. Their expansion into leasing is noteworthy.
Maybe I’m jaundiced, but I hope this isn’t another set up for the double counting of gold and possibly silver.
END
1.PETER SCHIFF//JOHN RUBINO
JOHN RUBINO……….
ALASDAIR MACLEOD..
3.CHRIS POWELL AND HIS GATA DISPATCHES
4. ANDREW MAGUIRE//KINESIS LIVE FROM THE VAULT/289
END
END
5. COMMODITY REPORT: SILVER/VBL
How a Short Squeeze Actually Works in Silver

by VBL
Thursday, Sep 17, 2026 – 18:50
Contents
TL;DR: how a silver short squeeze works
Step 1: what “going short” means
Step 2: why silver is uniquely squeezable
Step 3: the trigger
Step 4: the scramble
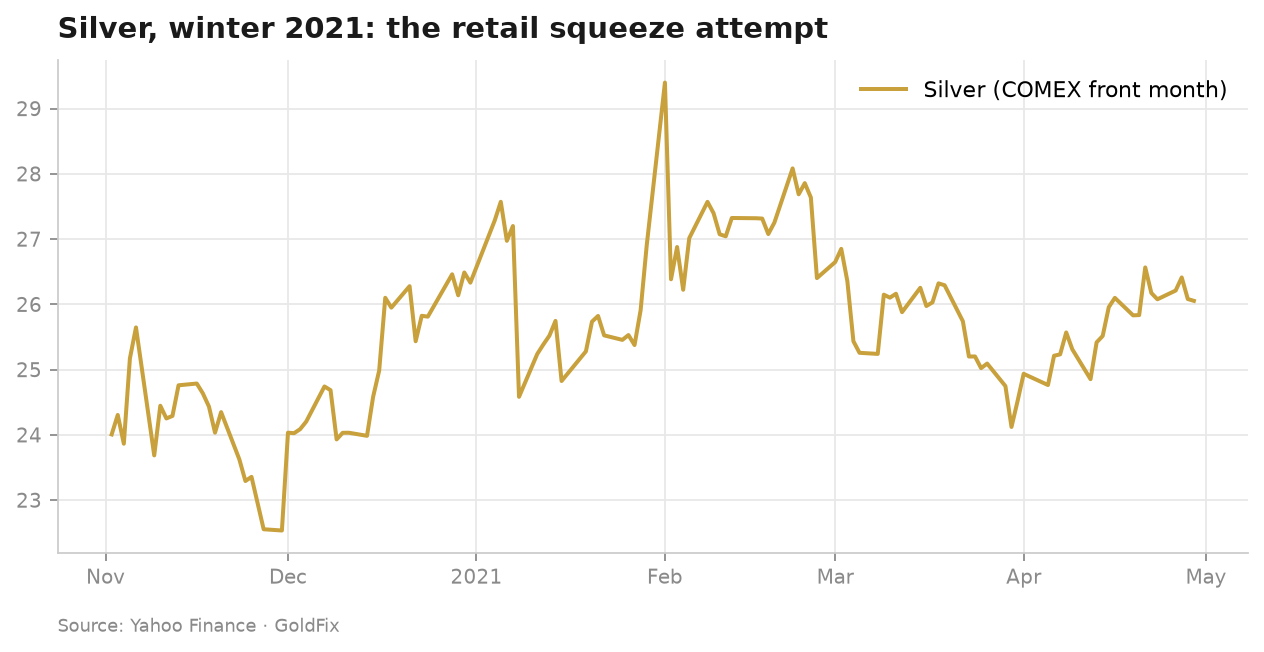
What it looked like in January 2026
How to read it on the tape
What stops a squeeze
The Mechanism in Plain English
By GoldFix for Scottsdale Mint
Silver is up 2.8% today, the day after a Fed hike, trading up $1.82 last at 64.60. Now would be a good time to refresh what a Silver Squeeze actually is.
TL;DR: how a silver short squeeze works
A short squeeze in silver happens when more people are obligated to deliver or buy back silver than can easily be sourced. Traders sell silver they don’t physically own (paper shorts) in sizes far larger than the metal in the vaults. That works until enough buyers demand actual bars at once; then the shorts must find scarce physical metal or buy their position back fast, and price is forced up until sellers reappear. The thinner the deliverable float, the more violent the move.
This page is the mechanism, step by step: what a short is, why silver is uniquely squeezable, and what makes price gap instead of drift. For the full picture (the deficit math, COMEX vs LBMA inventories, and the gold/silver ratio), start with our pillar on the silver squeeze, explained.
Step 1: what “going short” means
Going short silver means selling metal you don’t own, promising to deliver or settle it later, on a bet the price falls so you can close cheaper. In the futures and unallocated markets, you can do this without ever touching a bar; the contract is a paper claim. That’s normal and useful: it adds liquidity and lets miners and industrial users hedge. The risk is asymmetric, though. A long can only lose what they paid; a short’s losses are open-ended, because price can keep rising and they’re still on the hook to cover.

Step 2: why silver is uniquely squeezable
Two structural facts stack the deck. First, the paper market dwarfs the metal: by widely-cited estimates there can be dozens of paper ounces outstanding for every ounce of registered, deliverable COMEX silver. Second, the physical cushion is shrinking. The silver market has run a structural deficit for years, quietly draining above-ground stock. A big paper short stacked on a thin and thinning physical float is the textbook squeeze setup: lots of claims, little metal to settle them.

Step 3: the trigger
A squeeze ignites when enough holders stop accepting paper and demand the metal, or when shorts are forced to cover at once. The spark can be a demand surge (industrial or investment), a failure-to-deliver scare, a social-media wave, a large allocator standing for delivery, or a macro flight into real money. It rarely needs a mastermind. Most modern silver episodes are leaderless squeezes, not Hunt-brothers-style corners; a crowd reaching for physical simultaneously while the float is too thin to serve them all.
Step 4: the scramble
Now the shorts are trapped. They have two bad options: source real metal (scarce, slow, and getting more expensive by the hour), or buy their short position back, which means bidding price up against themselves. Both push price the same direction: up. As price rises, more shorts hit their pain threshold and cover, which lifts price further, which forces the next tier to cover. That feedback loop is the squeeze. Price is the release valve, and it gaps because the metal can’t be conjured fast enough to relieve the pressure.
Continues here unlocked
END
GOLD AND SILVER//leasing of gold and silver leads to double counting!!
this is an accident waiting to happen:
Tether’s $1.5 Billion Gold Loan Business Is No Joke
Authored by GoldFix
Tether has become a substantial source of financing in the physical gold market, extending approximately $1.5 billion in precious-metals financing to Gold.com, one of the largest bullion dealers in the United States. It is also trading and storing silver in a Las Vegas facility. We have both stories.
The scale moves Tether beyond its better-known role as the issuer of USDT and beyond simply accumulating physical gold. It is now using part of that gold position in transactions that resemble traditional bullion-market financing.
Bloomberg reported this week that Tether accounted for the majority of approximately $1.7 billion in precious-metals leases outstanding at Gold.com at the end of June. Gold.com owed approximately $1.45 billion in payables and advances to Tether at that point. The relationship has expanded quickly. At the end of March, Gold.com had disclosed roughly $362.6 million in precious-metals leases and customer advances involving Tether. Within approximately three months, the amount associated with Tether had increased by more than $1 billion.
The financing relationship followed Tether’s $150 million strategic investment in Gold.com earlier this year, which gave the stablecoin company roughly a 12% ownership position. The companies described that investment as part of a broader effort to connect physical bullion distribution with digital gold products, including Tether Gold, or XAU₮. Gold.com has since described precious-metals leasing from Tether as a significant source of financing and has said the companies intend to develop an integrated gold ecosystem spanning physical and digital markets.
How the Financing Works
This is not simply a conventional dollar loan secured by gold. Under a previously disclosed arrangement, Tether can provide LBMA Good Delivery gold bars through a precious-metals leasing facility. Tether retains ownership of the metal while Gold.com receives use of it for an agreed period. The facility carried an annual lease rate of 1.75%, with individual transactions permitted to run for as long as 18 months. At maturity, Gold.com must return the equivalent quantity and purity of gold, with settlement taking place in London.
For a bullion dealer, this can be an efficient form of working-capital financing. Rather than borrowing dollars and purchasing bullion outright, the dealer can borrow the metal directly, use it to maintain inventory or satisfy customer demand, and later return an equivalent quantity. This is an established function in the bullion market and has historically been associated with major banks and specialist precious-metals firms.
What is unusual here is the lender. Tether has accumulated enough physical gold to participate directly in that financing system.
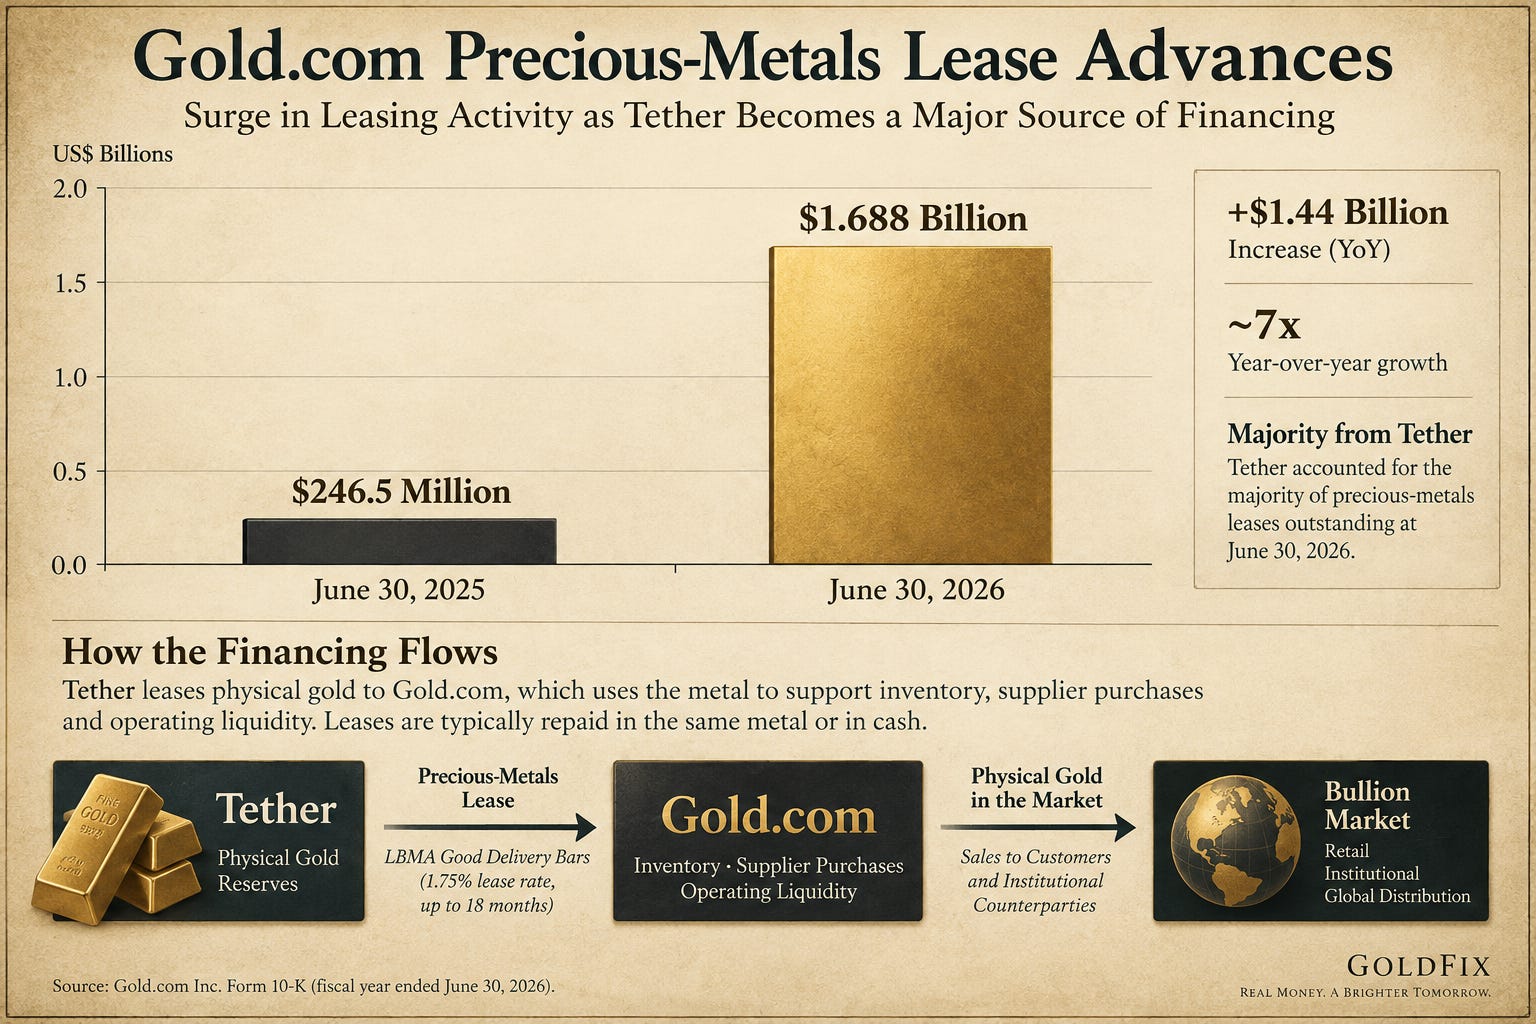
Tether reported holding more than 146 metric tonnes of physical gold at the end of June. The company added approximately 14 tonnes during the second quarter, following purchases of roughly six tonnes during the first quarter and more than 21 tonnes during the final quarter of 2025. At June prices, the position was valued at approximately $18.8 billion.
The Gold.com relationship shows that Tether is no longer treating all of that bullion simply as a passive reserve asset. Gold that is leased into the market can also serve a funding and liquidity function while remaining an asset of the lender.
That is the important distinction. Tether is simultaneously accumulating bullion and developing ways to use that bullion within financial transactions. Its role increasingly combines elements of reserve ownership and wholesale gold financing.
From Gold Ownership to Gold Infrastructure
The development also fits with Tether’s expansion into tokenized gold. XAU₮ represents ownership interests in physical bullion held in custody, while Gold.com provides an established distribution network in the conventional bullion market. The leasing relationship creates another connection between those activities by placing physical gold into commercial circulation.
Tether should not be confused with a traditional bullion bank, which typically performs a much broader range of market-making, derivatives, custody, clearing and financing activities. But the leasing agreement demonstrates that it is now performing at least one function long associated with that market: supplying physical metal as financing to a major dealer.
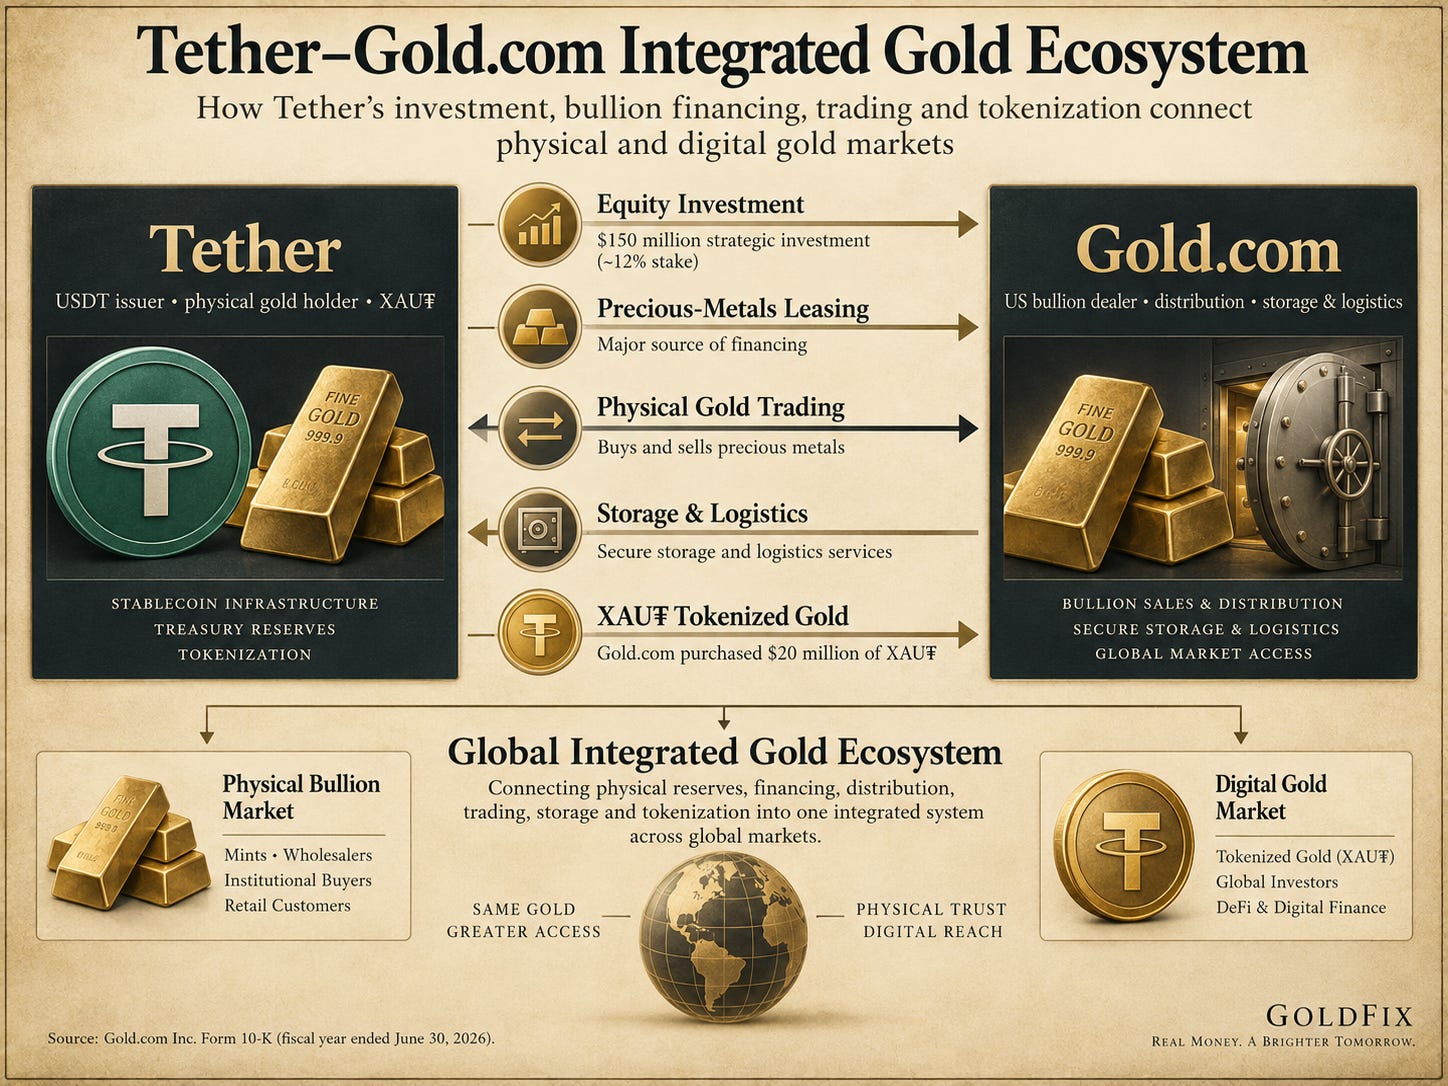
The broader point is straightforward. Tether’s gold strategy is no longer limited to owning bullion. It is beginning to use that bullion within a larger structure connecting physical ownership, financing, distribution and tokenization. The $1.5 billion relationship suggests that the transition from owning gold to financing with gold is already underway.
What Bloomberg missed and we are happy to report is that this is not just a gold story. It is a silver story as well.
Exclusive: Tether Is Also Trading and Storing Silver in Las Vegas
After analyzing Gold.com’s most recent S-3 and 10k GoldFix notes the following…
Tether’s expansion into precious metals extends beyond gold. Regulatory filings show that a Tether affiliate is storing physical silver at Gold.com’s precious-metals facilities in Las Vegas while maintaining separate agreements to buy, sell and lease silver through the bullion dealer.
From Gold.com’s most May 2026 S-3:
“a subsidiary of the Company and an affiliate of the Selling Stockholder entered into a Precious Metals Storage Agreement, dated March 24, 2026, pursuant to which the affiliate of Selling Stockholder is storing gold and silver at storage facilities of the Company in Las Vegas, Nevada and at other locations arranged through the Company”
Gold.com disclosed the relationship in a May SEC filing describing three agreements with Tether affiliates.
Continues here
END
REPORTS FROM ASIA:
JAPAN// RUSSIA
Russia Demands Japan Remove US Typhon Missiles From Its Territory
Friday, Sep 18, 2026 – 06:00 PM
Back in 2025 we noted the strong condemnations from Russia and China when the US Army first announced and deployed the Typhon missile system to Japan, controversially under the initial guise of holding joint drills.
Stars and Stripes also underscored at the time that the Typhon was deployed to a US Intermediate Nuclear Forces (INF) Marine Corps Air Station Iwakuni, about 25 miles southeast of Hiroshima, which puts mainland China and parts of eastern Russia in range of the system.
Russia this week is formally demanding that Japan remove the Typhon systems, according to a new statement by the Russian Foreign Ministry. This comes after another deployment and use in recent joint Japan, Australia and American forces drills.

Spokesperson Maria Zakharova blasted the US deployment as ‘unacceptable’ and called on Tokyo to immediately reverse its decision and take steps toward de-escalation.
“On September 3, a protest note was delivered to the Japanese side in Moscow and Tokyo over the deployment on Kyushu of US Typhon ground-based systems designed to launch intermediate-and shorter-range missiles,” the diplomat said in the statement..
“The document specifically noted that Tokyo had once again taken this step despite repeated demarches by the Russian side explaining our concerns about threats to national security, regional peace and stability arising from the deployment of this type of weapon on the Japanese archipelago,” she described.
“We stressed that Japan’s deployment of these systems on its territory is unacceptable under any pretext, regardless of the duration or manner of that deployment,” the Foreign Ministry spokeswoman said further. “The Japanese side was urged to end this practice and remove the aforementioned systems from its territory.”
The Typhon, also known as Mid-Range Capability, is a land-based missile launcher that can fire nuclear-capable Tomahawk missiles, which have a range exceeding 1,000 miles, and SM-6 missiles, which can hit targets up to 290 miles away.
The missile system would have been banned under the Intermediate Nuclear Forces (INF) Treaty, a treaty with Russia that the US withdrew from in 2019.
What makes this standoff over the weapon system more dangerous is that Russia over a year ago announced that it too is no longer bound by a self-imposed moratorium on the deployment of missile systems that were previously banned by the INF Treaty. The Japan case may provide Moscow with another excuse to ramp up its own border area deployments of mid-range missiles
END
4. EUROPEAN AND SCANDINAVIAN COMMENTARIES PLUS NATO
SPAIN
74% Of Sex-Crime Suspects In Spain’s Basque Country Are Foreigners
Saturday, Sep 19, 2026 – 07:00 AM
Foreign-born suspects account for nearly three-quarters of sexual-crime arrests in Basque Country, official figures show

Official statistics released by the Basque regional police, the Ertzaintza, indicate that people born outside Spain made up 58.7 percent of all arrests in the first half of 2026 even though they represent 10.2 percent of the population.
The disparity is sharper in several high-profile offense categories.
Of the 107 people detained for crimes against sexual freedom, 79 were born abroad, making up 74 percent of arrests in this category, according to data obtained by The Objective.
Foreign-born suspects also accounted for 73.3 percent of homicide arrests and 61.3 percent of those for causing injury.
The highest shares appeared in other offences: 94.7 percent of drunk-driving arrests (36 of 38), 79.6 percent of theft arrests (222 of 279), and 77.6 percent of robberies involving violence or intimidation (253 of 326).
The figures come from data the Basque Department of Security, which began publishing this data systematically at the end of 2025. Until then, the Ertzaintza routinely omitted the birthplace of detainees.
Security councillor Bingen Zupiria of the PNV said the change followed “tremendous pressure” from the Popular Party (PP) and Vox in the Basque parliament. Police unions supported the move as a contribution to “crime prevention.”
After that pressure, Zupiria stated, the department was forced to “change its criteria.” Arrests are now broken down first by continent and then by region, including North Africa, the rest of Africa, Latin America, or Europe.
The publication of these breakdowns ended a long-standing practice of withholding origin information that the Basque government said had created more confusion than clarity. Citizens, officials argued, have a right to see the actual composition of recorded crime.
Within the foreign-born group, those originating from North Africa are notable for their high offense rates.
They form roughly 1.8 percent of the Basque population yet accounted for 37 percent of homicide arrests, 24 percent of sexual-assault arrests, 64 percent of theft arrests, 48 percent of robberies with force, and 66 percent of violent robberies in the first six months of the year.
Suspects from the rest of Africa and from Latin America also appear over-represented in several categories of crimes against persons and property.
Overall arrests have been rising. The Ertzaintza recorded 6,903 in 2021 and 9,222 in 2025. The first half of 2026 already produced 5,050. If the pace continues, the year would end with a record of about 10,100.
Only the Basque and Catalan regional forces currently publish the origin of suspects to the general public. However, an internal document obtained earlier this year showed that, across Spain as a whole, foreigners accounted for 51 percent of daily arrests (527 of 1,033). The share was higher in Madrid (64 percent), Catalonia (71.8 percent) and Murcia (60 percent), close to the Basque figure of 59 percent.
Other research has shown that foreigners commit 500 percent more rapes than Spaniards and 400 percent more murders.
Prison data from the Basque Department of Justice for August 2026 shows 722 of the 1,967 inmates (36.7 percent) were foreign-born.
Among those under 25, the proportion rose to 65.9 percent, or two out of three.
UK
As A Former Head Of MI6, It’s Clear That Britain’s Climate Policy Is Leaving Us Dangerously Exposed To Our Enemies
Saturday, Sep 19, 2026 – 08:10 AM
Authored by Richard Dearlove via The Daily Sceptic,
This is the transcript of a lecture given in London last night to the Global Warming Policy Foundation by Sir Richard Dearlove, the former head of MI6, titled ‘Energy Security: Blowing in the Wind’. The full lecture is available to watch on YouTube.

A summer of drought and record temperatures has discomforted the country: parched ground, overheated public transport, sleepless nights and a distorted and obsessive media. It is a distracting backdrop for a lecture on energy security – ‘climate change’ must be the most repeated phrase of the last three months since the first heatwave of the summer back in May. To step out of this context will seem like a heresy to the ideologues of Net Zero. Are you blind to the disturbing evidence around us, they will ask. However, the extreme weather events of the last 90 days are not a logical place to start a debate about energy security. We must take a strategic view free of prejudice, and put aside emotionally charged, only partly scientific convictions about climate change.
There are so many of them – for example Lord Deben’s endless preaching from his ‘countryside crusader’ soapbox in Country Life, the frequent BBC interviews with Met Office scientists. However, I am pleased that the media debate is not entirely one-sided and that some heavyweight voices are striking a counterbalance. For example, this from a very recent Washington Post op-ed: “Nations are finally realizing they cannot afford to shun any power source for ideological reasons” – written in the context of a striking revival of interest in nuclear power.
Of course, I am not a scientist, and I do not have formal technical qualifications; but I did spend 38 years in the intelligence service, where one gets some practice in weighing up intelligence of various kinds, and for more than 20 years since have been one of its speaking heads. National security and the geopolitics of national security are my thing. Very few share my depth of experience – successes and failures.
My principal aim in this lecture is to lay bare the vulnerabilities in our national energy stance – note my reluctance to use the word policy. I do not think that government has an energy policy; perhaps it has a climate policy (which raises the question of whether it is actually possible to have a climate policy or whether such a policy falls into the category of extracting sunbeams from cucumbers). For analytical expertise and strategic analysis, I am indebted to Dr John Constable and to Professor Gwythian Prins. Their contributions to this lecture are extensive.
As my title suggests, the UK’s climate stance/policy currently lacks security anchors; and the answer, my friends, is certainly not blowing in the wind. It has been more a finger in the wind. As a country we have been drifting and we are dangerously exposed. The most pressing threat to this country is not man-made climate change as Ed Miliband and now Miatta Fahnbulleh, avidly supported by legions of so-called experts, would have us think. There is no simple link between canceling Rosebank and stopping wildfires. To believe such a thing is the height of naïvety, or ignorance of the science, or conviction akin to religious belief.
National security is three dimensional. There is the direct threat mounted against us by hostile states – the easiest to understand. Then there are the vulnerabilities created by shortcomings in our infrastructure and policies and subject to exploitation by our enemies and competitors. The third dimension is from threats that we have failed to identify accurately and for which there is little or no defensive preparation. Putin’s Russia characterizes the first, our neglect of defense expenditure the second, and the Covid pandemic (lab made and not zoonotic as some of us alerted Boris Johnson in early 2020) the third.
Extreme weather and climate change are a natural hazard and are a huge disruptive threat for which we should and do make contingencies – like the Thames Barrier. Mankind has always had to live with these disruptions, dictating patterns of human settlement and how, over centuries, we have planned and built. The belief that we might exercise a degree of control over the climate is an understandable aspiration but common sense, which accepts that we cannot control the weather, would suggest it remains beyond human reach. The recent earthquake in Venezuela or the falling mountain in Tibet should remind us that our exposure to the forces of nature is not something we can control – only sometimes partially mitigate.
By all means include natural hazards in a list of national security threats (as the British Cabinet Office does) but do distinguish them as being separate from those that emanate from hostile nations and entities.
The two issues on which I will focus in this lecture are: the vulnerabilities of our energy infrastructure, and their actual and potential exploitation by foreign powers that do not share our national interest. I am not qualified to argue the case on climate science about which so many here are expert. I am therefore sticking to the areas closest to my own expertise.
When I was C (chief of MI6) I had the unusual experience of meetings with hostile international players – the Russian leadership, the PRC leadership and Qaddafi amongst others. I do not need to go into the purpose of those meetings here. However, it is worth recording a conversation with the Chinese general who was then head of the 2PLA – the all-powerful Military Intelligence Service of the PRC to which Deng Xiaoping had granted primacy in the Chinese intelligence community.
I should first explain the significance of that conversation. The Chinese Communist Party leadership shares many of the characteristics of a cult, albeit one that has seized control of a whole country – it claims infallibility in doctrine whilst proclaiming its leaders to be faultless scientists of human affairs. It therefore extirpates ruthlessly any cult that seeks to challenge its infallibility within the PRC. However, it is also ideologically attuned to exploiting the cults of its enemies not only to weaken them from within but also to make them a vehicle for their own baleful influence. The methodology is built into the PRC’s DNA because it is so sensitive to its own vulnerabilities.
The focus of the general’s concern was the activities of Falun Gong in the UK and Europe amongst the Chinese diaspora. The Falun Gong movement witnessed huge growth in China in the 1990s until it was subject to a massive campaign of suppression. The PRC saw the cult as a direct challenge to the authority of the Communist Party, with which it shared certain conspiratorial, organizational and ideological characteristics.
In the democratic West we are thoroughly familiar with the fashionable cults and movements that blow through society. Only those that espouse violence are subject to legal suppression. Their durability is variable and so is the extent to which they capture serious political attention. Remember CND, the campaign against the deployment of cruise missiles in Europe, the various emanations of Palestinian terrorism, the radical terrorist groups in Germany and Italy in the 1970s. To these I would now add climate catastrophism and its associated greening and anti-carbon fuel movements – and you will have others in mind like Black Lives Matter and the pro-Hamas Palestinianism so evident recently on our streets.
Climate catastrophism has built major bridgeheads in the public mind, in the media and in the political domain. It is also a driver of the Net Zero bandwagon. Challenging this edifice, despite its shaky foundations, has been difficult – though a shift in the Overton window does now allow a little more space for a talk such as this one.
What is beginning to be well documented by academic research is the extent to which the movements which were spawned during the Cold War, like CND and radical terrorist groups like the Red Army Faction, were exploited by Soviet Active measures which used them ruthlessly to try to undermine and weaken the West. Their support for and penetration of them was methodical and extensive. Those skills are alive and well today in Russia and China. The SVR and 2PLA have large departments focused on active measures supported by other whole-government initiatives.
The PRC’s capability needs explanation. Perhaps more important than 2PLA, with which it works closely, the Chinese Communist party’s United Front Work Department counts 40,000 employees and 600,000 in affiliated organizations and together has a budget in the low billions of dollars. The department’s purpose is to shape a world favorable to the PRC’s interests. It has seen an important revival of its role under Xi’s rule. You may recall the case of the Chinese lawyer Christine Lee’s unlimited travel and entertainment largesse which was lavished around Westminster – a classic example of UFWD influence.
Helpfully, the Chinese Communist Party likes to publish its doctrine. One example is the 1999 paper written by two second intelligence officers titled ‘Unrestricted Warfare: assumptions on war and tactics in the age of globalization’, which describes the efficacy not of physical disarmament of the enemy but of its moral disarmament. You can see therefore why Xi Jinping has himself described the UFWD as “China’s magic weapon”.
On a recent visit to Spain (Pedro Sanchez the Spanish PM sees China as a favored partner) I asked a group of Spanish MPs if they knew about the UFWD. Not one of them knew of it or understood its role – yet Spain at the moment is one of the main focuses of its European activity. Perhaps we are slightly more alert in the UK, but there is no harm at all in raising awareness further.
The Russian threat is actual and immediate. It requires less explanation because it is so obvious. Putin’s Russia sees itself already engaged in gray warfare with the West on account of our support for Ukraine. It is prepared to carry out attacks without consideration of the political risk. The Russian agency that conducts this conflict is mainly the GRU, Russian military intelligence – equipped and trained to carry out acts of sabotage behind enemy lines. Its various attacks in Europe have been widely publicized.
I would, in the context of this talk, draw particular attention to just one of its capabilities. As the Cold War ended Russia nonetheless continued to invest heavily in developing its underwater warfare resources. The intelligence about this back in the early 2000s was striking; and today we understand better why the Soviet Union, even as it disintegrated, had the foresight to invest in the capability to interfere with undersea cables, pipelines and electricity grid interconnectors. The evidence of its aggressive intentions is incontrovertible.
It may surprise you that I am not going to dwell on the manifest illogicalities of our current energy circumstances: the extreme Net Zero targets; the deprecation of intrinsically cheap conventional energy; the excessive subsidies to renewable electricity; the refusal to exploit our own fossil fuel resources; the grid’s struggle to manage an increasingly stochastic generation profile; the poor thermodynamic quality of renewables; and the growing dependence on imports in distressed circumstances. The list is long and familiar to all of you – and the point of this lecture is to develop a fresh perspective on the nation’s energy security.
I urge our leading politicians to take very careful note. We are not the victims of a conspiracy to make us vulnerable. We have quite casually done this to ourselves. We have as a nation negligently wandered close to a cliff edge and the adversaries I have described stand ready to help us over it; and the fragility of the present international order enhances the risk. “Do not distract your enemy whilst he is making a mistake,” was Napoleon’s famous dictum. The leaders of the CRINK alliance are smirking at our lack of realization about what we allowed our energy sector to become.
John Constable has introduced me to some frightening statistics. Comparing energy flow data for 1974 and 2025, it shows industrial final consumption has fallen by about 70% in absolute terms, from 41% to 14% of the national total, whilst transport rose by 76% to become the largest single sector. Only 50 years ago the UK was still a major industrial power. Iron and steel manufacturing, once substantial, has all but completely disappeared (when I went to university in 1963 my mother, who unusually had a career, was about to retire as Chef de Cabinet to the chairman of the United Steel Companies).
Three consequences follow. The country has lost the industrial capacity to reproduce its own energy system, so that uncertain access to equipment and spares (for example generators and transformers) is a graver and more chronic danger than a temporary shortage of gas. Deindustrialization also means that the UK has lost the large interruptible load that once allowed a shortage to be absorbed by factories rather than households (remember the three-day week). Furthermore, in ceasing to manufacture, it has exported its exposure to the energy systems of its suppliers, some of whom are strategic adversaries.
Our foreign policy is therefore fettered, and could even be held to ransom – does the Foreign Secretary, the arch prophet of Net Zero, have any grasp of the country’s predicament? His present obsession with new West Bank Israeli settlements (whilst Kyiv incidentally is being torn apart by Russian missiles) suggests that his attention is elsewhere.
The economic and social character of the country has of course changed enormously in 50 years. What was a heavy-duty production system has become a consumption center. The current pattern of our energy consumption shows that we move about and buy things, largely imported things. We do not manufacture as we once did. In the process we have inadvertently destroyed the circularity which largely assured our energy security. The energy system required industrial output and industrial output required energy.
That kept us sane and kept us on the rails. So, in complacently deindustrializing we have not merely lost an industry, we have lost the capacity to rebuild the energy system itself. Large-scale transformers ordered today now take two years to arrive, (before 2020 it was seven to 14 months), generators up to three years, and the grain-oriented electrical steel (GOES), for which there is no real substitute, comes largely from China, whose production capacity now dwarfs any other state. Europe has just two producers of that steel remaining, both plagued by reductions and closures as China undercuts the market. Britain and its allies do retain the capacity to design and assemble the apparatus on which the grid depends, but the material without which none of it can be built is being concentrated in the hands of the very country which the Director General of MI5 has identified as the most serious threat to Britain’s national security.
Some power sector manufacture still remains in the hands of reasonably friendly powers, but in a tight corner there may be practical limits to friendship, and in any case, there will be a queue.
The PRC leadership thinks long-term, and it does not have to worry about re-election, only about its survival. One of its policies, pursued with great success, has been to build dependencies not just in its own regional sphere of influence but globally. We have seen the leverage that its domination of the production of rare earths has secured, and we have watched how Huawei (a company closely associated with the PLA) has knocked out its foreign competitors and spread its communications technology around the world. London Transport has also recently started to purchase Chinese electric buses, made of course with the benefit of large state subsidies, all of them subject to software control by the manufacturer.
The idea that ‘Your No. 22 isn’t running today because the vehicle has just been immobilized by the manufacturer’ is faintly comic, but the weakening of the electricity grid is of another order – let us say because failing equipment could not be replaced. Water, sewage, gas networks, rail and underground transport, traffic lights and communication are all mains-connected. Such peacetime dependencies give China strategic leverage, and in a crisis, it gives it weapons of mass disruption which could literally bring a country to a standstill. In the documentation for the 20th Party Congress, Xi Jinping talks of China achieving global domination by 2045; we should take the threat seriously because the methodology for doing it is being put in place under our very noses.
The bulk of my professional experience was on the front line of the Cold War. We used to make the following assumptions: that the country’s war-fighting potential resided in its industry, that our most vulnerable link was the fuel chain (mostly then carried by sea) and that our industrial base could be rebuilt and repaired – a question of time and organization rather than capability.
The terms of that equation have fundamentally changed. We have very little industry left to protect and we cannot rebuild non-existent industries which lie in foreign jurisdictions beyond our reach. And consequently, the state cannot, through emergency command and control, promptly rebuild what it loses, because the industries are now in other jurisdictions and beyond its reach. It can join the queue, or it can beg. Furthermore, a consumer-led energy society is exposed to breakdown when failures occur. It cannot temporarily switch power consumption away from industry to keep home fires burning.
Saying that the current energy policy is mad or grounded in the religion of climate change does not really get us very far – simply into shrill arguments that deepen the disagreement. What I have tried to do, with a great deal of help, is to take the argument back towards a national Grand Strategy for energy, one which recognizes that we live in a tense and hostile world where the greatest danger is not climate change. If a present or future government can evaluate and plan its exposure to energy risks – for example, identifying single points of failure dependent on foreign manufacture and building contingencies around them – then we could be on track towards a more security-aware energy policy. It might also engender a more balanced assessment of the thermodynamic value of the national fuel mix.
We have talked blithely about ‘powering past coal’ but no major industrial power has in reality abandoned coal for heavy industry, China in particular, and in fact we remain dependent on the products of those economies. This is a difficult message for many of our politicians to accept.
Might we make it easier for them if, for a start, we introduce a concept of national security exceptions to Net Zero – a quarter way house until sanity returns and the country is ready to embrace a balanced energy policy.
In this context there is also a compelling case to do all that we can to rebuild the strategic industries we require to ensure that we can defend our island fortress and be a reliable ally to friendly democracies around the world. This is a subtle matter – the state is almost certainly not the best agent for this undertaking – and it would probably take at least a generation, but the legacy benefits would be enduring. The first responsibility of government is the safety of the nation.
However, successive governments have forgotten this, and Britain is now caught in an energy trap of its own making. As with rebuilding our armed forces, it will take a significant national effort to extract us and bring us back to a position of safety. The task is urgent. The Government should have this amongst its very top priorities. Instead, we are being urged to remove a few thousand rough sleepers from our streets – a laudable feel-good objective but not exactly of strategic importance to the destiny of the proud nation that is Great Britain.
Sir Richard Dearlove is Chair of Board of Trustees of University of London and a former head of the British Secret Intelligence Service (MI6). This transcript was first published on the GWPF website.
end
UK
Watch: British Cops Grill Street-Preacher After Someone Takes ‘Offense’ At Bible Passages
Sunday, Sep 20, 2026 – 09:20 AM
Authored by Steve Watson via Modernity News,
Britain’s latest public-order farce is not a machete fight, a rape gang or a phone-snatch. It is a man on a high street with a Bible.

Footage circulating Friday shows three female officers surrounding a Christian street preacher in a busy shopping precinct.
One of them looks like she should still be sitting exams at school. The other two hover, phones out, expressions tight, as if they have been sent to defuse a bomb.
The clip is eight minutes of modern Britain in micro. A member of the public reports being “offended” by words. Officers arrive and the preacher is treated as the problem.
The all inclusive term ‘hate speech’ is waved around and ‘intimidation’ is offered as the hook for an investigation. The man citing Scripture is expected to justify himself to people who appear unfamiliar with the very statutes they are leaning on.
This is not law enforcement. It is customer service for the emotionally fragile.
As we hear in the footage, Sections 4A and 5 of the Public Order Act 1986 are the blunt instruments used again and again against street preachers.
Section 5 makes it an offence to use threatening or abusive words or behaviour within the hearing or sight of a person likely to be caused harassment, alarm or distress. “Insulting” was stripped out of Section 5 in 2013. There is a defence if the conduct was reasonable.
Section 4A is the heavier charge. It requires intent to cause harassment, alarm or distress, plus proof that harassment, alarm or distress was actually caused. Police guidance itself describes 4A as aimed at “more serious, planned and malicious incidents.”
Yet here are yet more female police officers spewing those statutes at the guy as if they’re citing parking restrictions.
Being offended by the Bible is not grounds for a public order offense. Reciting the Gospel in a public street is not automatically “threatening.” Calling the encounter “intimidation” because a passer-by disliked the message does not conjure the mental element the statute demands. Courts have said as much, repeatedly, after officers have already cuffed, swabbed and bailed the preacher.
That distinction is lost on too many in uniform. In the new footage the officers look lost in it. One of them is literally a frightened child. The other two look scared of the conversation they started. The preacher is the only person on camera who appears to have read the law.
We’ve seen this all too often in Britain recently.
In another similar incident, a volunteer Met officer ordered 20-year-old gospel singer Harmonie London to stop performing “church songs” on Oxford Street, claiming she was “not allowed to sing church songs outside of church grounds.”
The Met later apologised and admitted the officer “was mistaken,” adding: “We’re sorry for the offence caused and will take the learning forward.”


Video: Police Officer Orders Christian Singer To Stop Singing ‘Church Songs’ In Public
Acts bizarrely and walks off when challenged
There are many many more cases.
Pastor Dia Moodley was arrested in Bristol in November 2025 on suspicion of a religiously aggravated Section 4A offence and “inciting religious hatred” after preaching on Islam and transgender ideology.
He was held for eight hours and banned from the city centre over Christmas before the case collapsed.
“Avon and Somerset Police have arrested me twice because my lawful speech was seen as offensive to some Muslims and people with a progressive worldview,” he said.
When a Muslim bystander later told him on camera, “If you do that again bro, we’ll send the boys round,” police filed it as “unpleasant” comments that “do not constitute an offence.”
John Steele was arrested in Rotherham after a 30-second conversation about Quran 4:34 at a domestic-abuse stall. Charges were dropped as “not needed in the public interest.”
Pastor Steve Maile was handcuffed in Watford and held for 12 hours; Hertfordshire Police confirmed a Section 5 public order investigation.
Shaun O’Sullivan has been arrested 16 times, including for saying “God bless you.” A jury acquitted him after a six-day trial that cost an estimated £20,000.
Many such cases.
This is not a handful of confused constables. It is policy.
And who exactly is calling the police to report being ‘intimidated’?
In February, a lone female Met officer in Whitechapel, was surrounded by angry men insisting “This is a Muslim area,” after a Christian preacher dared to recite the gospel.
In a refreshing change, the officer told the men “In this country, we have freedom of speech.”
She added: “I understand that you guys don’t want to hear it, so I would just recommend that you walk away and don’t listen to him. He’s not in your home.” That officer understood the job. Too many of her colleagues do not.

This is part of a wider crackdown on speech in general.
At least 62,199 people were arrested for communications offences between 2021 and 2025 – roughly 34 a day. Only about one in five of those cases ends in a conviction.

Britain’s SPEECH GULAG: 62,000 Arrested In Five Years
Police hunt jokes and tweets while streets rot — and the numbers just got worse

Why Britain Arrests 30 People EVERY DAY For Speech
“I didn’t think it could get any worse”
Big Brother Watch’s Silkie Carlo called it “an Orwellian mess” and said people have been arrested “for holding blank pieces of paper.”
Lord Toby Young asked why authorities police tweets while shoplifting, phone theft and sexual offences rise.
Shadow home secretary Chris Philp put it simply: “Police shouldn’t be wasting time on the internet. They should be catching real criminals.”
After the 2024 Southport riots, police stood up a National Internet Intelligence Investigations team to flag “protest-related” posts to local forces. More than 100 referrals followed. Nigel Farage called it “the beginning of the state controlling free speech.”

UK Police Literally Have An ‘Elite Squad’ To Flag Spicy Social Media Posts…
And report the ‘offenders’ to the government
On the street the same instinct now wears a high-vis jacket. Offence becomes “intimidation.” A Bible becomes a public-order risk. Officers who cannot explain Section 4A still feel entitled to demand names and deliver a public grilling.
Anyone who still assumes the person in the uniform knows the statute should watch another clip making the rounds: security guards outside a migrant hotel fail to display SIA licences – a criminal offence under the Private Security Industry Act – and the attending officer’s response, after being walked through the law, is: “He’s breaking the law. What am I supposed to do?”
This is the depressing reality of the situation. Quote the Act at them and they freeze. Point to an actual offence by the state’s preferred clients and they shrug. Send three young women to lecture a preacher because someone felt intimidated by Scripture, and they treat the complaint as gospel.
Keir Starmer told JD Vance last year: “We’ve had free speech for a very very long time in the United Kingdom and it will last for a very very long time.” The high street footage says otherwise. So do the 62,000 speech arrests. So does the officer who looks like a child, standing between a Bible and a country that no longer trusts its own laws.
Freedom of speech that dies the moment someone claims offence is not freedom.
END
FRANCE
France Losing Control As Credit Rating Downgraded, And Now Europe Starting To Crack
Yes — France has faced multiple credit rating downgrades amid political instability and rising debt, and market pressures (especially bond spreads) have intensified, raising concerns about broader eurozone strains.
bloomberg.com
Recent rating actions
Major agencies have cut France’s sovereign ratings in stages since 2024–2025, citing persistent high deficits, rising debt-to-GDP, and fragmented politics that hinder fiscal consolidation:
- Fitch cut France to A+ from AA- in September 2025 (lowest on record for a major agency at the time for France), pointing to political fragmentation after government collapses, deficits expected to stay above 5% of GDP, and debt projected to rise toward 121% of GDP by 2027 with no clear stabilization path. reuters.com
- S&P followed with a cut to A+ from AA- in October 2025, highlighting heightened risks to budgetary consolidation amid instability. reuters.com
- Moody’s had earlier lowered its rating (to Aa3), and Morningstar DBRS also adjusted downward previously. On September 18, 2026, Morningstar DBRS confirmed France at AA but changed the trend to Negative from Stable, reflecting rising risk that the government will fail to address fiscal imbalances, with debt-to-GDP likely remaining elevated and potentially approaching 125% over the medium term. dbrs.morningstar.com
France’s deficits have repeatedly exceeded EU limits (around or above 5% of GDP recently, versus the 3% reference), debt has climbed well above 110–118% of GDP, and successive minority governments have struggled to pass meaningful austerity or reform packages. Political gridlock—multiple prime ministers since the 2024 snap elections, confidence votes, and the run-up to the 2027 presidential election—has been a consistent theme in agency rationales.Market signals and “Europe starting to crack”French government bond yields and the risk premium over German Bunds have risen sharply. On September 18, 2026, the 10-year France-Germany spread reached or exceeded 100 basis points (around 101–104 bp in reports), the widest since the 2012 eurozone debt crisis. French 10-year yields moved higher (near or above 4.5% in some sessions), and France has at times paid more to borrow than countries like Italy, Spain, or Greece that traditionally carried higher risk premia.
reuters.com
This reflects investor unease over France’s fiscal trajectory, high public spending, interest costs that are rising as a budget item, and pre-election uncertainty. Analysts note France’s large, liquid bond market (once viewed as core/safe) is being reassessed, with some describing a shift toward “peripheral” status in market pricing. Contagion worries exist because France is the eurozone’s second-largest economy: wider spreads or further fiscal slippage could pressure other sovereigns, banks, and the broader bloc, especially against a backdrop of higher global yields, energy/geopolitical shocks, and uneven growth. Some commentary frames France as a potential stress test for the euro area given its size and the difficulty of fiscal adjustment under political fragmentation.
reuters.com
That said, France retains strengths (diversified economy, institutional capacity, euro membership benefits, and still-investment-grade ratings well above junk). Markets have priced in a good deal of the political risk already, and earlier downgrades did not trigger immediate forced selling crises. The situation is serious and deteriorating on the fiscal and political fronts, but it is not yet a full 2010–2012-style sovereign debt crisis. Outcomes will depend heavily on the ability to pass credible budgets, any post-2027 election policy shifts, growth, and eurozone policy responses if pressures escalate further.
END
5.RUSSIAN AND MIDDLE EASTERN AFFAIRS
ROBERT H…
HINT News on X: “

BREAKING: A drone struck a cooling tower at Russia’s Kursk Nuclear Plant, with no reported radiological impact. In Ukraine, a Russian drone hit an Odesa office building, injuring seven, while strikes also hit the Kirovohrad region.” / X
This is highly dangerous and stupid.
Apart from a nuclear fallout in attacking nuclear plants there is a line that no nation can leave unnoticed.
The State Duma elections in Russia are underway as of yesterday. There is likely a swing to the right to give a firm mandate to the Kremlin to finish off Ukraine.
Many months ago I wrote that after this election things would become much worse for Ukraine going into October. Be very aware of what comes forth there.
END
RUSSIA/UKRAINE
Russia Seizes Assets Of Swiss Food Giant Nestle
Saturday, Sep 19, 2026 – 07:35 AM
Russian authorities seized the remaining businesses and assets of Swiss food giant Nestle and three French groups, the latest move against Western firms in response to sanctions against Moscow.
A decree signed by President Vladimir Putin issued late Thursday transferred the Russian operations of Nestle, French retailer Auchan and the former Leroy Merlin DIY chain, now known as Lemana Pro, to a company called LEV Management. The decree also covers the Russian subsidiaries of French logistics group FM Logistic, France24 reported.

Investigative outlet Novaya Gazeta Europe reported that LEV Management was created only at the end of 2025, and is headed by a Russian interior ministry general. It had no known business activity.
Most Western companies quickly sold their Russian operations and holdings after the Ukraine invasion, or at least isolated them, as sanctions have made trading in most goods difficult.
Russia has since made it difficult for firms to leave, requiring presidential authorization for deals, or seizing the assets outright.
In a short statement, Nestle said it was “committed to taking all necessary steps to protect its rights and ensure continuity of business operations in the interests of all stakeholders, particularly its employees“.
“The company is assessing the situation and its options,” it added, without providing details of its residual Russian operations.
Jean-Philippe Bertschy of the Swiss investment bank Vontobel said he expected the financial impact to Nestle would be small “given Russia’s limited contribution to group sales”.
He said Russia now accounted for just over one percent of the group’s sales, down from around two percent before the Ukraine war.
It has suspended “the vast majority of sales, non-essential imports, advertising and capital investment”, he said, while continuing to supply essential food items.
Auchan and Leroy Merlin are both controlled by France’s Mulliez family, and each has around a dozen outlets in Russia.
The latest seizure echoes Moscow’s 2023 takeover of Danone’s Russian business, which was later sold to a nephew of Chechen leader Ramzan Kadyrov.
END
ISRAEL/USA VS IRAN/ FRIDAY NIGHT
ISRAEL USA VS IRAN/SATURDAY
ISRAEL TBN
END
END
SAUDI ARABIA HOUTHIS/SYRIA ANTI HOUTHIS MILITANT:
Syria Rejects Desperate Saudi Plea To Deploy Militants To Yemen
Saturday, Sep 19, 2026 – 08:45 AM
Provocative rumors have been flying all week that Saudi Arabia has recruited Syrian militants to fight the Houthis in Yemen, at a moment the Iran-aligned rebel groups is said to be rapidly gobbling up more territory, especially along the Red Sea coast.
The claim has been especially strong in Lebanese media, after prominent Al-Akhbar reported this week that hundreds of Syrian fighters were recently transferred to southern Saudi Arabia, including fighters who took part in the Jolani/HTS-led fight to topple Bashar al-Assad in December 2024. However, it’s unclear if the alleged fighters have Syrian state backing (whether on a covert level or not), or if they could be there on their own initiative as mercenaries.

The Saudis had provided strong covert support, along with other Gulf states, to the over decade-long effort overthrow of Assad, and so Riyadh could now being calling in favors from Damascus.
The phenomenon of Syrian mercenaries and foreign fighters transferred in large numbers to other broader conflict theatres is not without precedent, as many are still said to be in Libya.
However, their deployment in Yemen might not yet be a reality, and it could just be that Saudi officials have pitched it as just an idea or possibility, amid the ongoing appeal also for more help from Western allies including the US and Britain.
On Friday Turkish media is reporting that Damascus has rejected the alleged Saudi plea to send Syrian militants for fighting in Yemen. According to Turkiye Today:
Syrian sources who spoke to Türkiye Today said Saudi Arabia had in recent months sought fighters to meet its military needs in Yemen, but that the Syrian government had “politely” rejected a request to organize and deploy a Syrian force against the Houthis.
“This issue has been exhausted and is over. The Saudi request was made several months ago. Syria politely turned it down, saying it was focused on its own military organization process and did not intend to enter a conflict as a third party,” one of the sources said.
However, the same sources indicated the Sharaa/Jolani government would not prevent Syrians as individuals from traveling for the purpose of assisting the Saudi coalition.
Separate reports this week have speculated that Turkey could get involved in the fight for Yemen on Saudi Arabia’s behalf based on the recently inked Mecca Defense Pact. But that too is simply at the level of unfounded rumor at this point.
The same Turkish media report underscores, “Claims that Türkiye had played a role in transporting or organizing Syrians for deployment to Yemen were also rejected by Turkish sources.”
The unnamed sources said: “We have no involvement in this matter. Syria and Saudi Arabia are sovereign countries.” As for Turkish media, the reports of Damascus slamming the door on Riyadh ring true given post-Assad Syria is facing serious problems on many fronts, especially internal unrest and large demonstrations this week over fuel price hikes. It doesn’t have the military power or resources to get much involved in Yemen at this stage.
But on the other side of this, it also remains true that the Turkish government has long sought to use Syrian militants as fodder for its grander designs in places like North Africa.
END
HOUTHIS/SAUDI ARABIA
Houthi Ballistic Missiles Hit Fuel Tanks Near Riyadh Airport In War First
Saturday, Sep 19, 2026 – 01:25 PM
In a historic first of the Yemen conflict, Houthi ballistic missiles rained down on the Saudi capital of Riyadh overnight, triggering rare air raid alerts and a general state of panic among the citizenry.
The international airport may have been targeted, given huge black smoke plumes were seen rising above city’s King Khalid international airport. There looks to have been a significant ground impact just near the major aviation hub.

The Guardian reports, “Explosions were heard in the capital as firefighters battled to extinguish the flames of a burning fuel tank emblazoned with the logo of the Saudi oil company Aramco near the city’s King Khalid international airport.”
Several rounds of explosions in the capital were heard overnight, with reports of flight cancelations and pauses, with FlightRadar24 citing “major problems” at the airport.
“The Saudi civil defense force sent air raid alerts overnight on Friday to residents of Riyadh, Jeddah and other cities including Yanbu, a major industrial port which is home to critical oil facilities,” The Guardian report notes.
No casualties or major damage has been officially reported, and the air alert warnings were soon lifted. There hasn’t been much in the way of a specific public assessment of the attack from Saudi authorities.
Gulf states which have been targeted throughout the Iran conflict have by and large kept quiet on damage as a result of attacks either by Iranian forces or the Houthi rebels in Yemen. In some cases they’ve persecuted citizens who share photographs with the outside world.
Fierce fighting continues to unfold in Yemen, with regionally based analyst Yasmeen al-Eryani of the Sanaa Center think tank saying the Houthis continue to set the pace of escalation:
“You could see that the Houthis are determining the timelines and the levels of the escalation,” al-Eryani said. “So, depending on the current situation, it seems that the Houthis are the ones in control.”
The analyst traced the latest tensions back to July, when an Iranian Mahan Air flight resumed direct travel between Tehran and Houthi-controlled Sanaa.
She said tensions escalated with Saudi Arabia after a subsequent Mahan Air flight was prevented from landing in Sanaa, prompting Houthi retaliation and raising fears of a broader confrontation.
But the attacks have gone the other way as well, with the Houthi military on Saturday announcing that the Saudi coalition carried out 26 attacks against areas under the group’s control over the prior day.
The Houthis further tallied that over 300 Saudi attacks had been launched on their positions over just the past week, as cited in the AFP. After the rapid Houthi advance along the Red Sea coast this month, the Iran-aligned group is in better position to potentially block international shipping in the Bab Al-Mandab Strait.
END
RUSSIA VS UKRAINE
Ukraine Pounds Major Moscow Refinery As Global Diesel Crisis Threatens Economic Shock
Sunday, Sep 20, 2026 – 08:45 AM
Military conflicts, economic wars, and resource wars are converging ahead of the Northern Hemisphere winter.
Export restrictions on critical materials and energy products are adding economic pressure worldwide, raising the risk that supply disruptions and retaliatory measures widen existing conflicts. With no clear path to de-escalation, the potential for spillover from active war zones remains top of mind.
The most pressing news so far this morning is that Ukraine launched a major overnight drone strike on Russia, hitting a Moscow refinery despite President Trump’s request for Ukraine to stop striking Russian energy infrastructure as a global refining crisis deepens.
Bloomberg reports that the Gazprom Neft-owned Moscow Oil Refinery, about 16 miles from the Kremlin, was struck by drones. The facility has a processing capacity of around 245,000 barrels a day and supplies fuel to the surrounding metro area.
Ukrainian President Volodymyr Zelenskyy wrote on X, “One of Russia’s key oil industry facilities and the aggressor’s logistics facility were hit. These are billions of dollars that sustain the war machine. The systems used included FP-1, RZ-100, MICH-2000, Palianytsia, Vendetta, Liutyi, Bars, Flamingo, Sichen, and Pelican.”
Last week, diesel futures and refining spreads climbed to record highs as worsening supply disruptions in the Gulf and Russia tightened availability of the industrial fuel that powers the global economy.
Potential export restrictions, or extensions of existing restrictions, are compounding the squeeze. A report on Tuesday said Moscow was considering extending its diesel export ban, while Senate Majority Leader John Thune told reporters that day he was “open to exploring” a US diesel export ban.
The squeeze was even more severe in refining spreads. The US heating oil crack, which measures the difference between fuel and crude prices, surged to $117 a barrel on Wednesday, the highest level in Bloomberg data going back to 2009.

Bloomberg Intelligence senior commodity strategist Mike McGlone has warned that the diesel price shock echoes similar moves in gasoline during the 2008 energy shock.
end
6/.GLOBAL ISSUES, COVID ISSUES, VACCINE INJURIES/HEALTH ISSUES
GLOBAL ISSUES
COVID VACCINE INJURIES: MARK CRISPIN MILLER
DR PAUL ALEXANDER
RABOBANK/MICHAEL EVERY/OR OR PICTON/GIFFIN OR RABOBANK EXECUTIVE/COMMENTARY ON WORLDLY AFFAIRS
7. OIL AND NATURAL GAS/ENERGY COMMENTARIES
CENTCOM Claims US Military Has Escorted A Billion Barrels Of Crude Out Of Hormuz
Saturday, Sep 19, 2026 – 06:05 PM
Brent crude futures eased toward $103 a barrel by the end of the week as mixed Iran headlines and hopes for renewed diplomacy around next week’s United Nations General Assembly weighed on energy markets.
On Saturday morning, CENTCOM commander Adm. Brad Cooper said the US had escorted 1 billion barrels of oil and more than 2,000 commercial vessels out of the Persian Gulf over the past couple of months.
Hostilities at the Hormuz chokepoint continued into Friday, as CBS News reported that two vessels were hit by projectiles. Iran claimed responsibility for striking one over an alleged “illegal crossing.”
President Trump said Thursday he would soon make a “big decision” on whether to launch a major assault to “annihilate” the Iranian regime. “It’s a big decision,” the president told Axios ahead of a planned meeting with Persian Gulf leaders next week. “Anything could happen to me.”
We suspect any major action against the Iranian regime could come after the midterm elections, whether kinetic, securing or neutralizing Kharg Island, or a next phase of expanded sanctions that could include not just Tehran but also China.
Middle East oil exports have stayed resilient despite the Saudi East-West pipeline disruption, largely because flows have been rerouted through Hormuz.
UBS oil and gas analyst Henri Patricot wrote in a note that combined crude and petroleum-product exports through the critical waterway and alternative routes reached about 14 million barrels a day in the two days preceding Friday. He said the weekly average remained around 12 million barrels a day, compared with more than 20 million before the conflict kicked off in late February.
That still leaves global oil markets with a deficit of more than 8 million barrels from these export routes on a weekly basis. This only shows the scale of the disruption that continues ahead of the Northern Hemisphere winter, as Saudi Arabia told major refineries in Europe that crude loadings would be halted next month due to ongoing disruptions to the East-West pipeline.
Patricot said the increased shipments through the Hormuz chokepoint continue to be driven by “dark transits“:
Reduced concerns on near-term flows, same uncertainty on resolution
A pick-up in flows via the Strait of Hormuz in recent days has eased some of the concerns around near-term crude supply, impacting prices. More reports indicate that Aramco will raise exports from Oman over the next few weeks. Flows will reportedly be going to Asia. US President Donald Trump said that the is nearing a decision over whether to restart attacks on Iran. He is due to meet GCC leaders next Tuesday. Meanwhile attacks on vessels in the Strait of Hormuz have reportedly continued.
Flows going up in the past couple of days, despite Yanbu interruption
We estimate total crude oil and oil product exports via Hormuz plus volumes diverted to the bypass routes were up to 14Mb/d in the past couple of days, despite the drop in Yanbu. Total flows remain at 12Mb/d on a weekly basis vs. the >20Mb/d preconflict. The increase continues to be driven by dark transits via Hormuz as visible volumes in the latest UBS Evidence Lab data. Another LNG carrier left the Gulf yesterday, the second one we have seen exiting this month. Flows via the Bab el Mandeb Strait remain within the recent range.

Gulf loadings ramping up Gulf
Gulf crude loadings ex-Iran rose to >10Mb/d over the past 2 days and are near their highest level since the start of the conflict at 8.1Mb/d over the past week vs. the August average of 5.5Mb/d. This is driven by higher Saudi and Iraqi exports. There is still no fresh Iranian crude loading on the other hand . Including Fujairah, loadings on the bypass routes averaged 2.5Mb/d in the past 2 days and are at 4.9Mb/d so far in September vs. 3.4Mb/d in August and 6.4Mb/d in July. Oil product loadings in the Gulf are also bouncing back slightly, above 1.5Mb/d vs. sub-1Mb/d for most of the conflict.

Separately, JPMorgan’s head of global markets strategy, Dubravko Lakos-Bujas, told clients, “Middle East oil exports have stayed unexpectedly resilient despite the Saudi East‑West pipeline disruption, largely because flows have been rerouted through Hormuz.”
Brent crude futures settled around $103.87 a barrel on Friday, while the US diesel crack spread closed around $112.60 a barrel, suggesting the crisis is less about crude and more about refining (read Goldman’s diesel report), specifically diesel.
END
8. EMERGING MARKETS//AUSTRALIA NEW ZEALAND ISSUES
CANADA VS USA
Trump Signs Memo To Remove Canadian Goods From US Federal Procurement
Friday, Sep 18, 2026 – 08:55 PM
Authored by Jason G. Antonio via The Epoch Times,
U.S. President Donald Trump has signed a memorandum directing the removal of Canadian-origin goods from the federal civil procurement system, following through on a commitment he made earlier this month.

The Sept. 16 memo authorizes the director of the Office of Management and Budget, the United States Trade Representative, and the Federal Acquisition Regulatory Council to “identify and take all steps toward removing or otherwise making non-available for purchase Canadian-origin items in the federal civil procurement system.”
The memo also directs U.S. Trade Representative Jamieson Greer to monitor “Canada’s continued treatment of U.S. origin goods in Canadian government procurement.”
The action follows Trump’s Sept. 8 directive to the General Services Administration (GSA) to remove Canadian-origin products from its Multiple Award Schedules, a government-wide contracting program that manages more than US$50 billion in federal procurement. The GSA schedules give federal agencies access to millions of commercial products and services.
“Everyone knows that Canada doesn’t let our Great Dairy Farmers sell into the Canadian Market, and that the only reason Canada makes Autos is because of previous disastrous Trade Agreements while other Presidents were in Office,” Trump said on social media after issuing the GSA directive.
Trump also said Canadian governments, including provincial governments, have “banned American Small Businesses and Companies from selling into their Government Procurement Markets.”
The procurement measures come amid an escalating trade dispute between the two countries.
Canada imposed new counter-tariffs on Sept. 8 covering about US$20 billion in U.S. imports, with rates of 15, 25, and 50 percent. The tariffs target products including steel and aluminum, dairy, appliances, agricultural equipment, pulp and paper, plastics and electronics.
The Canadian measures matched U.S. tariffs of 50 percent on about the same value of Canadian products imposed under Section 338 of the Tariff Act of 1930, effective Aug. 22.
Canada has also implemented a “Buy Canadian” policy, while all provinces except Alberta have restricted or prohibited the sale of U.S. alcoholic products, or imposed tariffs on them, and have also enacted measures to prioritize Canadian suppliers for government contracts.
Since Canada first announced its intention to impose counter-tariffs in response to the new U.S. tariffs that went into force on Aug. 22, Trump also announced new 50 percent tariffs on Canadian vehicles and auto parts beginning in 2027. He also said he would ban the sale of products made by Canadian aviation giant Bombardier in the United States unless they are made in America, and announced new import bans on certain Canadian goods beginning on Sept. 29.
Some of the Canadian products banned for U.S. import include most alcoholic products, certain dairy products, and motorcycles.
Trump said while visiting Ireland on Sept. 12 that the two countries could have a trade deal “fairly soon,” while repeating his criticism of Canada’s trade practices.
“We actually have a good [relationship] with Canada, but the United States has been ripped off for 50 years by Canada,” Trump said.
Carney said on Sept. 14 that he welcomes the president’s comments that a deal could be reached soon.
“We’re ready to sit down and negotiate that and move it forward,” Carney told Bloomberg.
Carney has said that diversifying away from the United States is a priority for his government.
“We are building our strength at home and diversifying our partnerships abroad,” he said in a speech on Sept. 15.
END
CUBA
Cuba Hit With National Power Grid Collapse As Oil Sources Dry Up
Saturday, Sep 19, 2026 – 12:15 PM
Cuba’s power grid collapsed once again this week, this time at a national level, leaving millions of people across the island without electricity. This is the sixth time since the US cut off fuel sources to the island since January that the national grid has collapsed and it’s the most utility shutdown events in the country’s recent history.
Even when Cuba’s grid is in operation, only 30% of the population at most receives electricity at any given time. Many regions stay dark 20 to 30 hours at a stretch. Some provinces have reported 60–90 hours without power. Havana has gone from 4 hours a day early in the year to 18 hours after the fuel cutoff.
“Protocols are now in place to begin the gradual restoration of the system,” said Felix Estrada, an official with Cuba’s National Electrical Union (UNE). Power had returned to a handful of scattered neighborhoods in Havana by late evening, primarily around hospitals, but much of the city remained completely dark.

Many exhausted residents of the capital Havana were already without power when the national blackout hit.
“Yesterday I’d gone without power for 24 hours. They turned the lights on for an hour, and then the grid collapsed,” said Frank Lorenzo, a 23-year-old Havana resident.
Around 61% of Cuba’s oil was sourced from Venezuela until the US capture of illegitimate president Nicolas Maduro. Shipments from Mexico have were also scaled back and then cut off. Russia has sent only one tanker so far this year.
Reports of a “shadow fleet” of tankers carrying Iranian oil to Cuba have circulated since at least 2020. Investigations of the seized tanker “Skipper” in 2025 found it had previously carried Iranian oil to Syria and China, then later moved Venezuelan oil on a route tied to Cuba. It confirmed the existence of overlapping Iran–Venezuela–Cuba shipping networks.
The US blockade of the Strait of Hormuz has proven incredibly effective in shutting down Iranian oil exports, leaving Iran’s clandestine trade partners high and dry.
The communist regime has operated as a hub for Chinese, Russian and Iranian operations including intel operations in the western hemisphere for decades. Along with Venezuela, Cuba has represented a hostile eastern foothold in America’s backyard. The Trump Administration also accuses the Cuban government of engaging in propaganda programs in the US, working with far-left organizations (including Antifa and Democratic Socialists) to organize activist subversion to undermine national stability.
Cuba reports limited negotiations with US officials and has largely pandered to the American media in the hopes of winning favor in the court of public opinion. As with Iran, Trump seems to be playing the long game, waiting for Cuba to economically falter before entering into serious talks. The frequency of power outages on the island nation is increasing and it will be difficult for Cuba to continue functioning for much longer.
Without an industrial base, agriculture and basic utilities, internal breakdown is inevitable.
END
USA ECONOMIC REPORTS
Trump Bans CNN, MSNBC And Politico From White House
Friday, Sep 18, 2026 – 04:40 PM
Authored by Zachary Stieber via The Epoch Times,
President Donald Trump on Sept. 18 said he has banned three news outlets from the White House.

Trump said on Truth Social that he was, effective immediately, banning CNN, MS Now, and Politico from the White House “as a result of their constant ‘reporting’ FAKE NEWS!”
The president added:
“Media Outlets shouldn’t be able to constantly write or report FICTION and LIES when they’re covering the President of the United States, the Trump Administration, or the United States of America. Other Fake News Media Outlets to follow.”

MS Now and Politico did not immediately respond to requests for comment.
CNN could not be reached.
The White House did not immediately respond to a request for more details regarding which stories or posts the president was referring to.
Trump routed them during a post-tweet press conference:
“What I do ask is just a semblance of truth. CNN is fake news. MSNOW is fake news. They’re fake news. They know it. They’re putting there for a reason.”
“Politico was bailed out by our government from going out of business.”
Trump added that “I don’t want them in my office”, stating that he will take this as far he can including “we’ll be suing these people too.”
He concluded by noting that “there may be other media outlet bans to follow.”
Trump previously banned The Associated Press from the Oval Office and other spaces after the outlet declined to change its stylebook to reflect the president’s renaming of the Gulf of Mexico to the Gulf of America.
A federal judge entered an injunction against the ban, determining that it violated the U.S. Constitution’s First Amendment because it discriminated based on The Associated Press’s viewpoint.
But an appeals court in mid-2025 partially stayed the injunction. The court allowed Trump to ban the outlet from the Oval Office, Air Force One, and some other spaces, concluding that “these restricted presidential spaces are not First Amendment fora opened for private speech and discussion” and that the White House “therefore retains discretion to determine, including on the basis of viewpoint, which journalists will be admitted.
Judges also ruled that Trump could not ban reporters from the White House’s East Room.
“The identified harms are less clear with respect to the East Room, which does not share the hallmarks of spaces like the Oval Office,” the majority said.
At present, however, there is no White House press secretary and the usual press briefings are somewhat disrupted. The most likely immediate outcome is that the administration attempts to remove those networks from the presidential and vice presidential pool rotations.
END
LOS ANGELES
Los Angeles Ranks Last Among 100 US Metros For Affordability And New Home Construction
Saturday, Sep 19, 2026 – 10:30 AM
Authored by Mary Prenon via The Epoch Times,
Des Moines, Iowa, ranked first and Los Angeles ranked last in Realtor.com’s inaugural report grading the 100 largest U.S. metros on housing affordability and homebuilding activity.

The results highlighted how local zoning and permitting can affect housing affordability in different areas.
The real estate platform’s first Metro Affordability and Homebuilding Report Card, released on Sept. 16, showed that Des Moines received an “A+” grade with a score of 83.4, the highest among the 100 metros analyzed, reflecting its strong residential construction activity and affordability.
The city has a median listing price of $349,903, with the monthly mortgage payment requiring 27.5 percent of a median-income household’s income, below the commonly cited threshold of 30 percent.
The calculation assumed a 10 percent down payment and a 30-year fixed-rate mortgage with a 6.5 percent interest rate.
At the other end of the list, Los Angeles received an “F” grade with a score of 12, leaving it at the bottom of the 100-metro ranking.
The median listing price in the city stands at $1.129 million, requiring a household earning the median income to spend 84.4 percent of its income on the monthly mortgage payment on a typical home, according to the report.
Meanwhile, the report said that local housing policies can help explain the gap between the highest- and lowest-performing metro areas in new home construction and affordability.
“Beyond land availability, the biggest difference between the ‘A’ metros and the ‘F’ metros is local housing policy, especially related to zoning and permitting,” Realtor.com senior economist Joel Berner said in the report.
“The ‘A’s share regulatory flexibility and streamlined approval processes, while the ‘F’s are locked in restrictive land-use frameworks.”
The report noted that Des Moines had a permit-to-population ratio of 1.85, meaning the city was issuing permits for new homes at a rate 85 percent higher than the national average relative to its population.
By contrast, Los Angeles’ ratio of 0.47 meant that the city was permitting less than half the national average relative to its population.
“The combination of extreme affordability pressure and limited new supply placed it at the bottom of the class,” the report noted.
Along with Los Angeles, New York City, Providence, Rhode Island, Honolulu, and Boston also had failing grades.
For example, Berner said, Boston has four times as many pages of zoning law as Austin, Texas, and 79 percent of its land is zoned, compared with just 15 percent in Austin.
Minimum parking mandates apply to 88 percent of land in Boston, while in Austin, the requirement is 37 percent.
Boston also has less land that allows unrestricted accessory dwelling units, limiting the supply of smaller, more affordable homes.
“The contrast between Austin and Boston makes clear that the rules governing what can be built can be just as consequential as the land available to build on,” Berner added.
Those top-ranked metros with less restrictive zoning and permitting also include: Raleigh, North Carolina; Columbia, South Carolina; Houston; and Indianapolis.
Regionally, the South and Midwest performed best for both new construction and affordability, while the Northeast and West lagged.
The report attributes the difference to more available and lower-cost land in the South and Midwest, in addition to more flexible zoning and permitting policies.
“Homebuilding and affordability are inseparable, and if we want to improve affordability in a lasting way, we need to build more homes,” Realtor.com chief economist Danielle Hale said in the report. “The metros at the top of these rankings show that buyers benefit most when communities pair homes that are attainable for today’s local earners with enough new construction to support tomorrow’s demand.”
In its Sept. 16 report, the National Association of Home Builders (NAHB) and the Wells Fargo Housing Market Index found that builder confidence in September hit the lowest level since September 2025.
“Buyer traffic has weakened across much of the country, largely because of rising mortgage rates,” NAHB Chairman Bill Owens said in the report.
The average 30-year fixed mortgage rate was 6.95 percent for the week ending Sept. 17, up from 6.76 percent the previous week and 6.26 percent a year earlier, according to Freddie Mac.
Owens also said builders continue to face higher material costs, rising energy prices, and ongoing labor shortages.
NAHB chief economist Robert Dietz added that 42 percent of builders rated current lot availability as “poor,” and 38 percent as just “fair.”
According to Realtor.com, the United States remains short of more than 4 million homes, putting financial strain on first-time homebuyers.
END
The Marriage Deficit Is An Economic Catastrophe
Saturday, Sep 19, 2026 – 09:20 AM
Authored by Stephen Moore via The Epoch Times,
The Beatles told us: “All you need is love.”
They were right, but along with love must come marriage.
But marriage rates have plummeted, especially among young men.
A Pulitzer Prize-worthy story by Sean Salai of The Washington Times crunches all the numbers. To say they are worrisome would be a vast understatement.
– In 2025, nearly twice as many men ages 18 to 39 were unmarried as were married.
– There were 30.4 million unmarried men ages 18 to 39 in 2025, up 47 percent from 20.7 million in 2000.
– In the same period, married men in this age range dropped by 15 percent, from 18.1 million to 15.4 million. “Such men are more likely to be lonely, prone to deaths of despair and unhappy,” according to Brad Wilcox, a University of Virginia sociologist.
– Forty-two percent of working-class men are unmarried, according to educational psychologist Donna R. Turner. In 1980, 73 percent of working-class men were married.
I could go on and with these depressing statistics.
But I believe the decline in marriage and children is a threat to the American future much more dangerous than even the national debt, climate change, cancer or foreign aggression.
Family is the essential organizing unit in America. We’re not to live in Soviet-style communes where the authority figure is “Big Brother.”
Every study shows that the decline in marriage among young men is tied to alcoholism, violent crime, drug abuse, pornography, depression, isolation, less economic success and suicide.

Are women to blame?
Certainly. Study shows that as women have become more career oriented, they are having a harder time “marrying up.”
Generation X and millennials have become choosier in finding a mate and more likely to have children alone, if they have them at all.
“Women have less structural need for marriage than past generations did,” said Angelica Gianchandani, a New York University finance instructor. “Rising income and education give many women a financial independence marriage once provided, and donor sperm and fertility treatment have decoupled motherhood from a partner altogether.”
Women are much less likely to be religious today than in decades past. So holy matrimony is less of a lifetime priority or moral obligation.
We do know that when women raise children without a father in the home – for whatever reason – their kids, especially their sons, are less successful. It’s a particular problem for black women to find a suitable mate when so many young black males are incarcerated.
I’m thrashing for explanations and solutions to this deeply troubling social trend. Obviously, we are not returning to the “Father Knows Best” norms of the 1950s or 1960s.
But recovery starts with admitting we have a problem. I would suggest that President Donald Trump announce a national bipartisan commission on “Rediscovering Love, Marriage and Parenthood.”
One last stat to underscore the urgency of turning around these trends:
The latest Census Bureau data indicate that 47 percent of households were headed by married couples last year, down from 78.8 percent in 1949.
That trend MUST be reversed to advance America’s economic prosperity and human happiness.
Views expressed in this article are opinions of the author and do not necessarily reflect the views of The Epoch Times or ZeroHedge.
END
END
KING NEWS
SWAMP STORIES FOR YOU TONIGHT
Minnesota’s Anti-ICE Relief Fund Shut Down Due To Rampant Fraud
Friday, Sep 18, 2026 – 11:00 PM
Officials in Hennepin County, Minnesota, shut down a $2 million relief fund for businesses claiming to be affected by federal immigration enforcement after officials discovered widespread fraud among applicants, forcing them to end the program. The county board created the fund to help businesses “harmed” by Operation Metro Surge, the federal immigration enforcement operation that began in December 2025. Federal agents shot and killed two U.S. citizens, Renee Good and Alex Pretti, in Minneapolis in January, turning it into one of the most scrutinized immigration enforcement actions in the country.

Of about 300 applications submitted, only 82 were deemed legitimate. Officials distributed only $500,000 before shutting the program down.
County officials found the problem ran deeper than a few opportunists padding their paperwork. Site visits revealed businesses listed on applications that did not exist. Investigators found the same AI-generated language pasted into dozens of unrelated applications with little variation.
Hennepin County Commissioner Jeff Lunde said the fraud reflected a broader breakdown. “The fact that people, after all this fraud, felt that they could apply and get away with it, I think it’s a problem because clearly there’s no fear out there,” Lunde said. “Until we get it where people fear things, then they’re gonna keep doing it.”
Lunde described watching the numbers deteriorate in real time. “Then at a certain point we’re like, ‘OK, we’re getting declining results on that.’ And so we said it’s time to stop the program. So we just stopped processing at that point,” he said. He described the bulk of the applications as fraudulent outright, a flood of fabricated claims rather than a handful of bad actors slipping through the cracks.
Neither Hennepin County nor Walz’s office responded to Fox News’ requests for comment.
Independent journalist Nick Shirley kicked off Minnesota’s fraud reckoning with a viral December video accusing several Somali-run daycare centers of billing the state for children who were never there, a claim he put at more than $110 million in fraudulent billing. The FBI previously dismantled a $250 million fraud scheme involving the nonprofit Feeding Our Future, which falsely claimed to have served millions of meals to children during the pandemic.
President Trump has spent much of the past year aiming his rhetoric about Minnesota’s fraud problem at the state’s Somali population, pointing to a string of prosecutions involving nonexistent or dormant businesses and nonprofits used to drain government aid programs.
Walz testified before the House Oversight and Government Reform Committee in Washington, D.C., on March 4, over the alleged misuse of federal funds across Minnesota’s social services and Medicaid programs. Vice President JD Vance referred Walz and state Attorney General Keith Ellison to the National Fraud Enforcement Division earlier this year for a potential criminal investigation. Republicans argue the two enabled a fraud scandal that has metastasized across the state’s welfare system. Walz and Ellison acknowledge that taxpayer money was misused but insist Republicans are inflating the scope for political gain.
That fraud division is now a Senate vote away from becoming a permanent fixture at the Department of Justice. The House passed the bill 352 to 72 on Wednesday, with every “no” vote coming from Democrats. More than 140 House Democrats, including Minority Leader Hakeem Jeffries, joined every Republican in support. Democrats voted to give permanent status to the very fraud division Vance had already used against their own governor, suggesting Minnesota’s fraud problem is harder to spin from inside the caucus than from a podium in St. Paul.
Rep. Harriet Hageman (R-Wyo.) didn’t hold back on what Minnesota has revealed. “What has come [out of Minnesota] over the last year, what has been exposed, is absolutely criminal in nature,” Hageman said, adding that fraud in other Democrat-run cities and states is likely “higher by an order of magnitude.”
Hennepin County just handed her something better than a talking point. A program built to comfort the supposed victims of immigration enforcement collapsed under the exact kind of fraud Minnesota’s leadership spent a year dismissing as a right-wing conspiracy theory.
END
SEE YOU ON TUESDAY


